1. Introduction
A variety of services and features have been provided for human reproduction by the ecosystem on this planet [
1], which supports the survival and development of human beings [
2]. There have been a growing number of Metropolitan Areas on this planet, most of which greatly depend on external ecosystem services [
3]. These Metropolitan Areas are usually on the edge of a fragile ecological balance. Once exposed to a large scale disturbance, their local ecosystems would easily lose homeostasis. That is the reason for their exchange of material and energy with the outside areas by the way of products logistics and other forms. In 1919, C. L. Andrews introduced the theory of capacity into the investigation of reindeer in Alaska, which could be seen as the budding of the theory of bio-capacity [
4], and bio-capacity gradually became a hot field of natural science research [
5,
6]. With more in-depth and wider-scope research on bio-capacity, the accounting of bio-capacity became the emphasis and difficulty. Ecological Footprint was proposed by Rees [
7], and improved later [
8,
9,
10]. Due to its vivid expression of concept and simple and feasible method of calculation, combined with bio-capacity, foot-printing has now become a powerful tool for assessing sustainable development [
11,
12,
13,
14]. The concept of D
ef proposed in this paper, emphasizing the indicator of distance to carry out a research on the range of ecological impact, might be an important supplement and improvement to the Ecological Footprint Theory System.
Urbanization brings both positive and negative impacts [
15,
16]. In the future, people’s dietary needs will become more diverse [
17,
18]. China’s urbanization process has far exceeded its corresponding economic capability. These increase the ecological pressure faced by cities. Therefore, it can be easily seen that the ecological impact expand together with urbanization, especially in Metropolitan Districts. Their existence depends on their ability to transfer bio-capacity from other regions. A city’s ecological footprint is measurable [
19]. The ecological footprint of city has an outward extension with city expansion, which leads to an increase of the distance and amount in the process of transferring bio-capacity. For example, in 2008, the population in Beijing was about 22.9182 million, and rose to 30.6425 million in 2012 (see the numerical calculation below). Obviously the population in Beijing increased substantially during the five years, which directly required a significantly increase of its ability to transfer bio-capacity from external regions. This is the starting point of this article.
Beijing is such a typical Metropolitan Area that it could not complete self-sufficiency in food resources due to high land prices and low agricultural resources. As a result, a large number of various types of food resources were introduced every day. If the entire Beijing Metropolitan Area is regarded as a sub-ecosystem, obviously, it could only maintain its ecological balance when numerous materials and energies have been introduced together with the external release of its waste. Therefore, the stability of this sub-ecosystem is greatly dependent on the method in which it makes contact with the outside world. The definition of ecological footprint distance (hereafter abbreviated as Def) proposed in this paper, focused on the indicator of distance, attempted to reveal the space scope of the supplied natural capital that maintains the sustainable development of the research object.
A city could be seen as a naturally existing organism, and needs an ecologically dependent range to keep its vitality so as to complete its ecological process. Thus, the Def of a certain research object may be understood as the distance of all categories of consumed resources in order to keep its homeostasis. Yet it is difficult to collect all the data on distance of all categories of imported resources. Therefore, data of food resources were collected and analyzed in the research, by which the author tried to show the definite dependent range of Beijing on external ecological resources from the aspect of Def of food resources. Meanwhile, to highlight the dependence of research object on external ecological resource, the Def of local food resources consumed was assumed to be 0. Thus, while calculating the Def of a certain object, there is only the Def of external food resources needed to be taken into consideration.
2. Method and Data Source
2.2. Four Basic Assumptions
Due to limited access to data and to simplify the research, the calculation of D
ef of Beijing was based on the following four assumptions:
The quantity of vegetables, fruit, meat and eggs, fish and grain and oil can be used to represent the quantity of all categories of food resources of Xinfadi.
The sources of food resources of Xinfadi can be used to represent the sources of food resources consumed in Beijing.
The quantity percentage by sources of food resources of Xinfadi can be used to represent the quantity percentage by sources of food resources consumed in Beijing.
The spatial and temporal variation of food resources imported by Xinfadi is in accordance with that of Beijing. In fact, these assumptions were reasonable according to the market research data, which showed a predominant market share of Xinfadi in Beijing (from 2008 to 2012, remaining at about 60%–70% above) and a rather large proportion of the five selected categories of food resources (
Table 1).
Table 1.
The proportion of the five selected categories of food resources in Xinfadi from 2008 to 2012.
Table 1.
The proportion of the five selected categories of food resources in Xinfadi from 2008 to 2012.
| Year | 2008 | 2009 | 2010 | 2011 | 2012 |
|---|
| Percentage (%) | 99.22 | 99.49 | 99.46 | 99.5 | 99.6 |
2.3. Source of Data and Data Classification
To calculate Beijing’s D
ef, three kinds of data were necessary: the population of Beijing, residents’ food consumption and data about bio-capacity output-sources. The first two categories of data were read by the “Beijing Statistical Yearbook” [
21]; the data of bio-capacity output-sources was obtained by market research. To simplify the study, the data of “Xinfadi agricultural products wholesale market” (hereinafter referred to as the “Xinfadi”) was chosen to represent the data of bio-capacity output- sources of Beijing. In recent years, Xinfadi’s market share in Beijing were: 2003, 60%; 2004, 70%; 2007, 60%; 2008, 70%; 2009, more than 70%; and the following years keeping growing up [
22]. Thus, Xinfadi’s data was typical and representative, showing the kinds, amount and sources data of Beijing’s imported bio-capacity. The data collected from Xinfadi was overall classified in the following five categories: vegetables, fruits, meat and eggs (including poultry), aquatic products, and grain and oil. Wherein, fruits included fresh fruit and dried fruit; meat and eggs included pork, beef, lamb, chicken and eggs; aquatic products referred to freshwater fish; and grain and oil included flour, rice and oil. These five categories are the majority of all food resources on the Xinfadi market (see
Table 1).
The population of Beijing is divided into three parts: resident population, resident foreign population and floating population. The calculation was based on data from “Beijing Statistical Yearbook” [
21] and “Chinese report of floating population development” [
23]. The calculation results showed that the population in Beijing from 2008 to 2012 was 22.9182 million, 26.2266 million, 26.5091 million, 28.8757 million and 30.6425 million, respectively.
The calculation of residents’ food consumption was based on “Beijing Statistical Yearbook (2000–2013)” and the officially released CPI (Consumer Price Index). The results were achieved according to Formula (4):
wherein, C
ij was the spending on food-class i in year j, Q
ij was the consumption of food-class i in year j. In order to get more accurate results, the calculation of the amount of imported vegetable and fruit was based on Xinfadi’s trading volume and market share in Beijing (as listed above, the average annual market share was set at 66.7%).Yet for the other three categories, their market share of Xinfadi in Bejing was not clear, and their amount of imported food resources were respectively equaled to the local consumption subtracting the local production, taking the loss rate into consideration (according to “China Logistics Statistical Yearbook (2009–2013)”, the average loss during production and transportation of agricultural products in Beijing was set at 25%).
3. Results and Analysis
3.1. The Scale of Imported Bio-Capacity and the External Dependency
With the fast-growing population in Beijing Metropolitan Area, the imported bio-capacity per capita increased year by year. Accordingly, the total amount of imported bio-capacity continued to increase year by year (
Table 2). From 2008 to 2012, the imported bio-capacity per capita increased from 211.09 kg to 272.18 kg; the proportion of the imported then increased accordingly from 48.4% to 64.2%.
Table 2.
Scale of the imported bio-capacity and the external dependency per capita.
Table 2.
Scale of the imported bio-capacity and the external dependency per capita.
| Items | Categories | 2008 | 2009 | 2010 | 2011 | 2012 |
|---|
| Total consumption of bio-capacity per capita (kg) | Grain and oil | 93.70 | 89.76 | 91.34 | 86.28 | 84.27 |
| Vegetable | 197.09 | 181.84 | 178.23 | 188.77 | 182.76 |
| Fruit | 77.02 | 80.84 | 82.36 | 83.94 | 90.10 |
| Meat and egg | 52.73 | 52.51 | 52.96 | 52.47 | 51.32 |
| Aquatic products | 14.64 | 15.68 | 14.52 | 13.96 | 15.49 |
| Total | 436.04 | 421.39 | 419.40 | 425.41 | 423.93 |
| Imported bio-capacity per capita (kg) | Grain and oil | 42.92 | 45.70 | 50.94 | 47.02 | 49.71 |
| Vegetable | 91.94 | 91.16 | 92.50 | 111.65 | 114.25 |
| Fruit | 37.84 | 46.41 | 50.14 | 53.53 | 62.59 |
| Meat and egg | 26.41 | 28.64 | 29.79 | 31.87 | 32.22 |
| Aquatic products | 11.98 | 13.47 | 12.14 | 11.85 | 13.40 |
| Total | 211.09 | 225.37 | 235.52 | 255.92 | 272.18 |
| Proportion of imported (%) | Grain and oil | 45.8 | 50.9 | 55.8 | 54.5 | 59.0 |
| Vegetable | 46.6 | 50.1 | 51.9 | 59.1 | 62.5 |
| Fruit | 49.1 | 57.4 | 60.9 | 63.8 | 69.5 |
| Meat and egg | 50.1 | 54.5 | 56.3 | 60.7 | 62.8 |
| Aquatic products | 81.8 | 85.9 | 83.6 | 84.9 | 86.5 |
| Average | 48.4 | 53.5 | 56.2 | 60.2 | 64.2 |
3.3. Spatial and Temporal Variation of Beijing’s Def
Based on time unit of season and year and spatial unit of provincial administrative, study on spatial and temporal variation of Beijing’s Def was carried out. In China, divided by the meteorological law, there are usually four seasons: Spring (from March to May), summer (from June to August), fall (from September to November) and winter (from December to next February). For the sake of data limitation, the time range was set from the winter of 2008 to the winter of 2012, where the data of 2008’s winter was represented by the data of 2009’s first two months and the data of 2012’s winter was represented by the data of 2012’s last month.
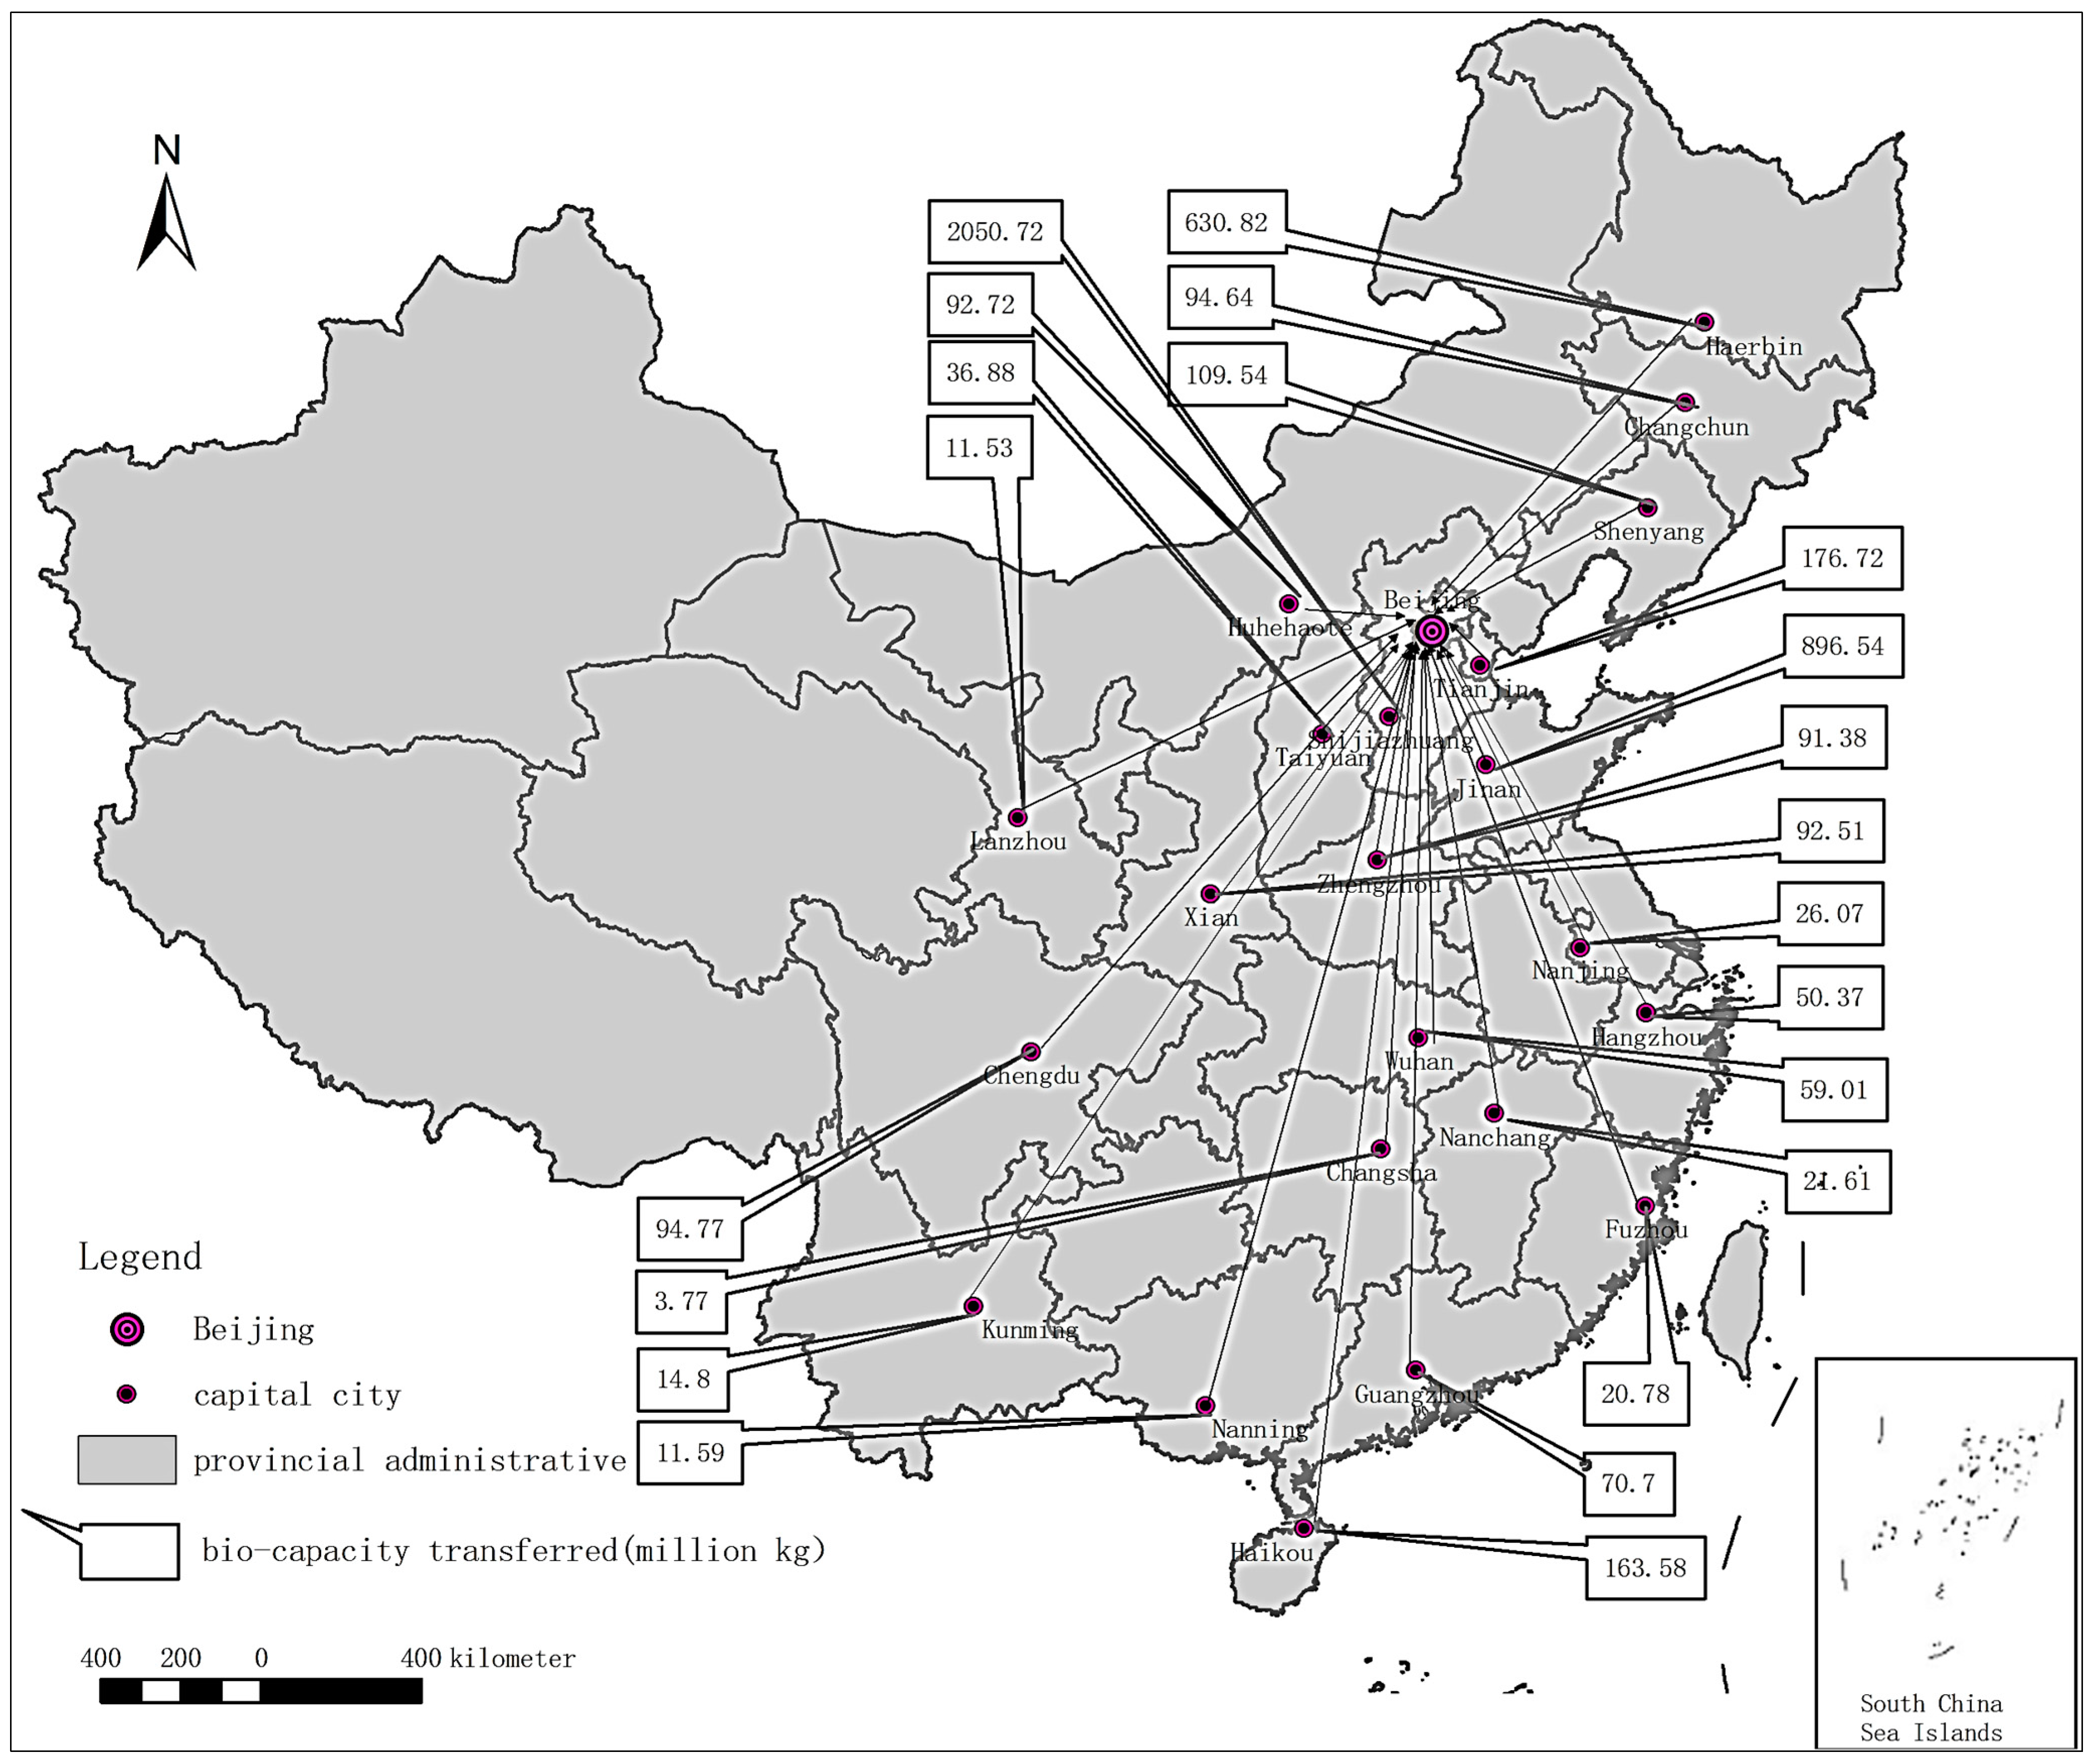
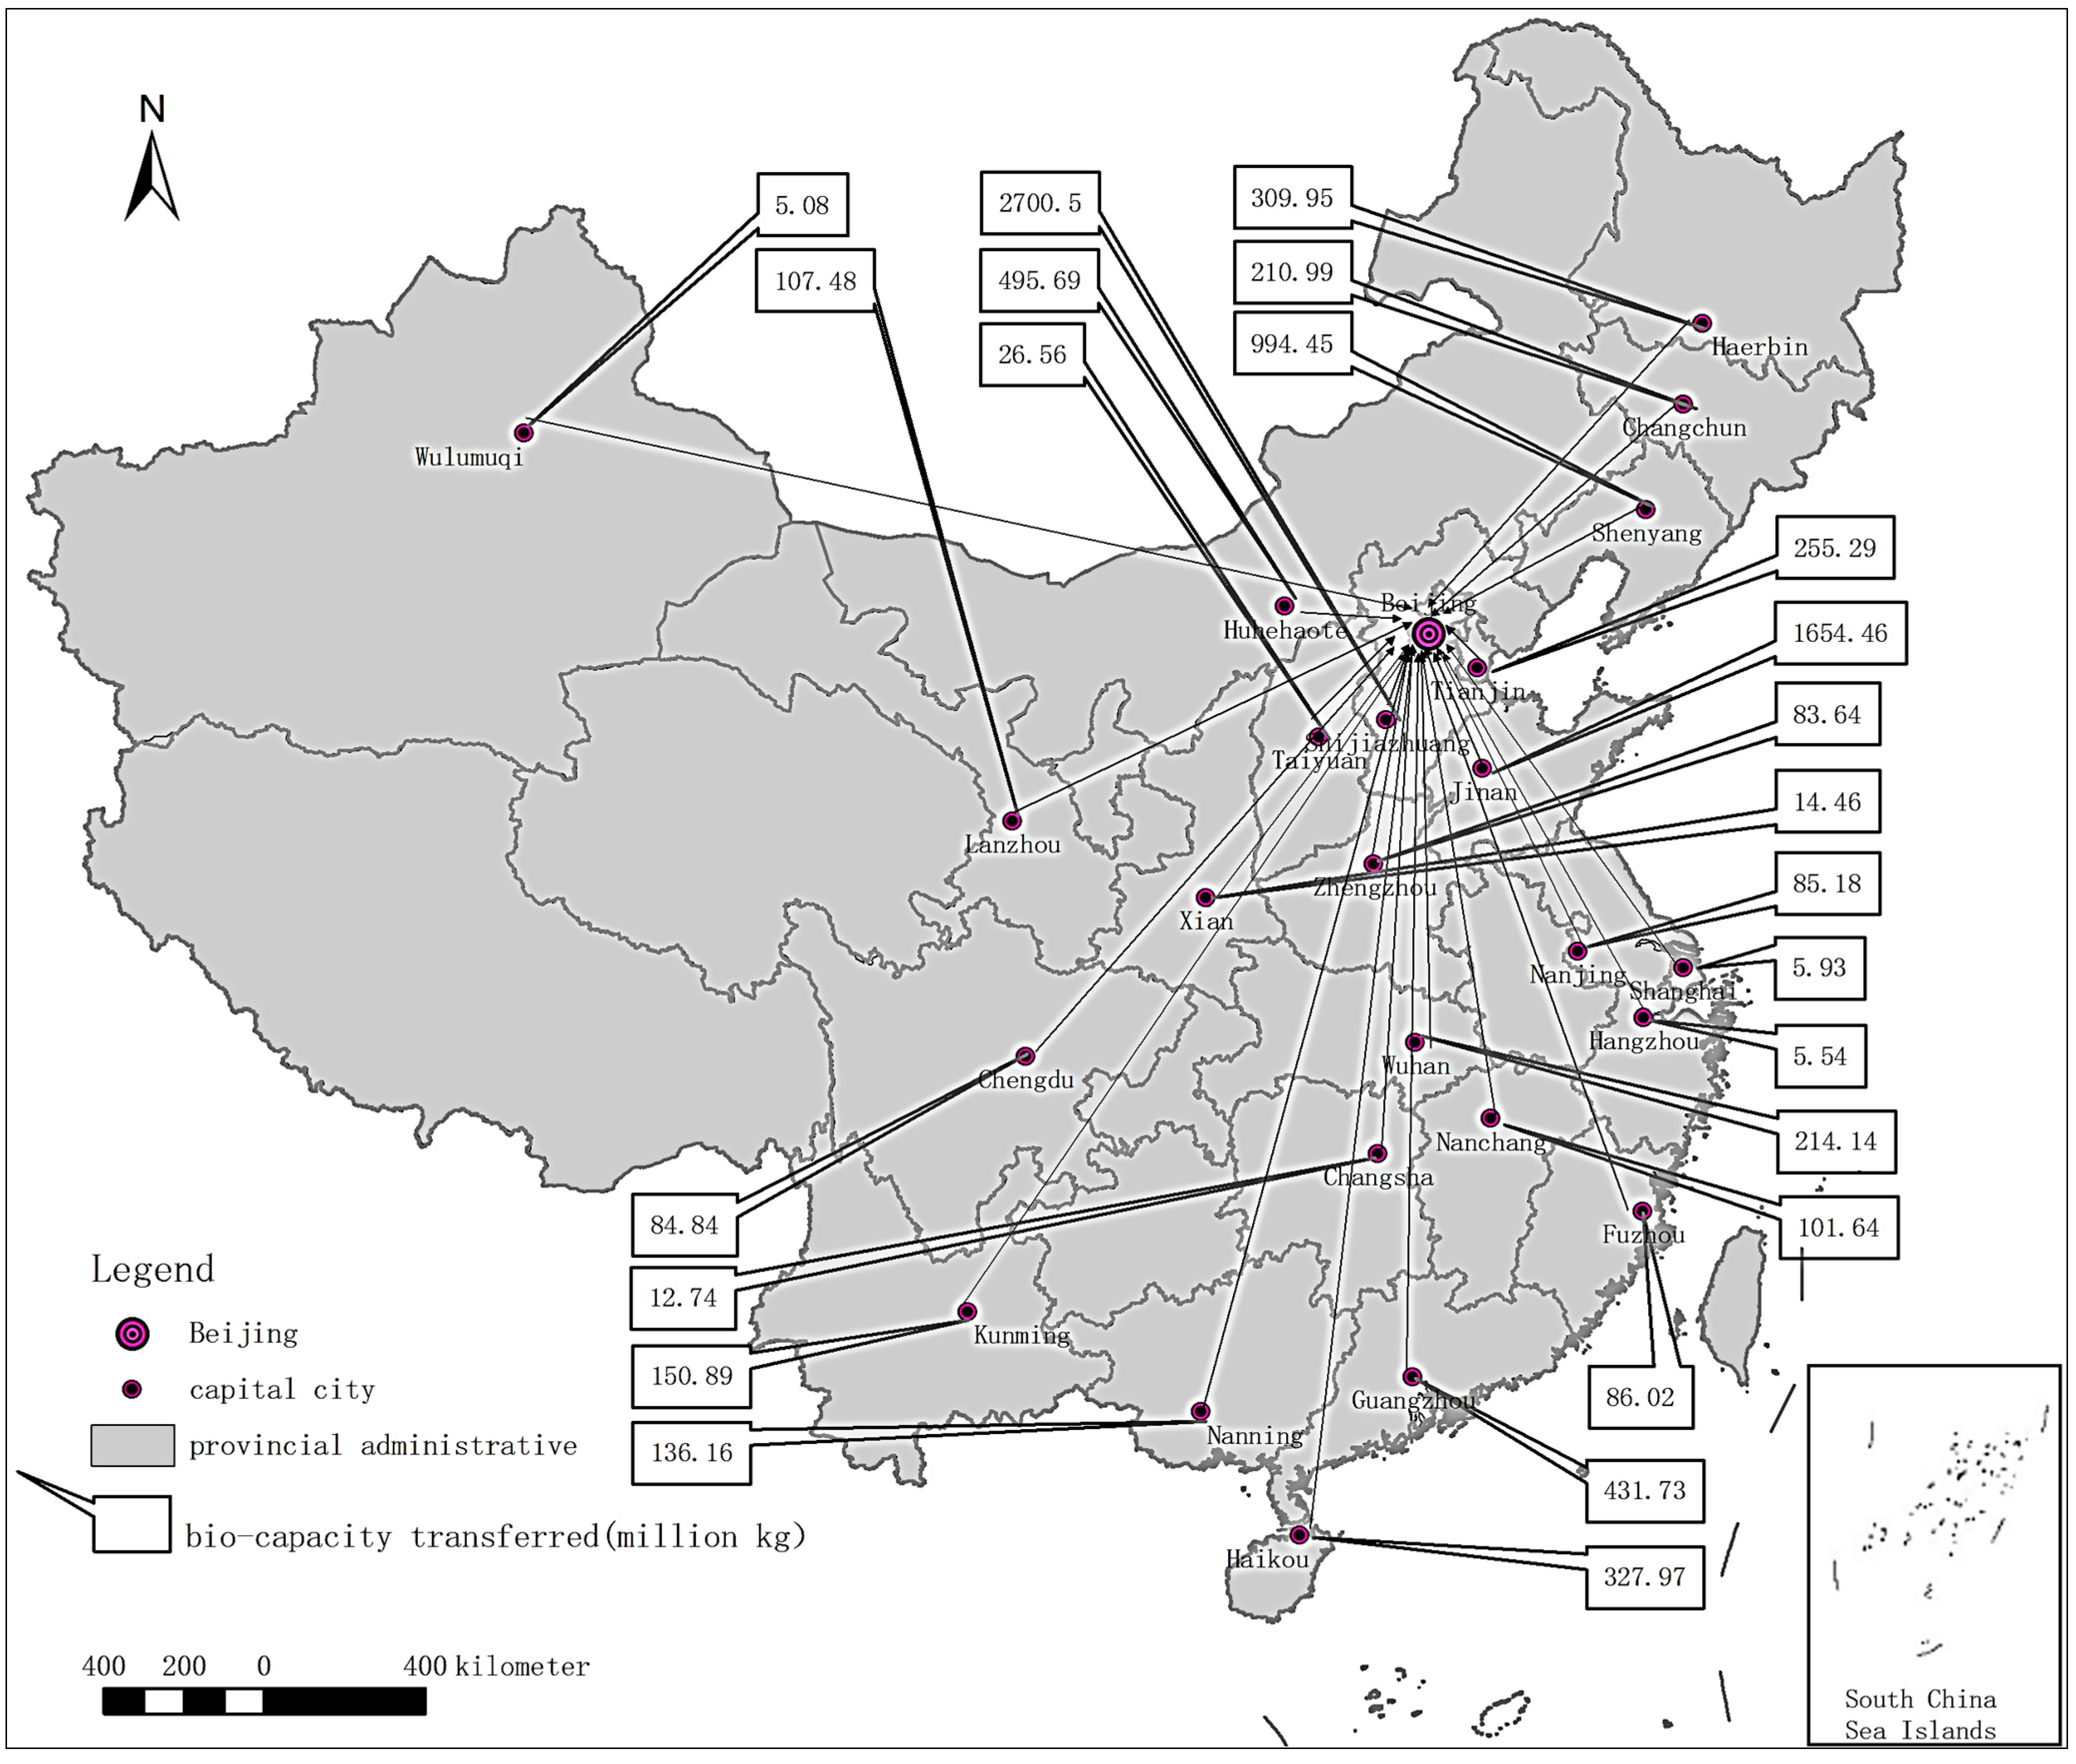
3.3.1. The Provincial Distribution of Imported Bio-Capacity in Beijing
According to the D
mi of bio-capacity supplied by different source regions and based on the unit of provincial administrative, spatial analysis (from 2008 to 2012) of Beijing’s imported bio-capacity was carried out. In different years, according to corresponding value discipline of each year, the source regions of Beijing’s bio-capacity supplying sources were divided into: high dependency regions, middle dependency regions and low dependency regions, taking 2008 and 2012 as examples (
Figure 1 and
Figure 2).
In 2008, values in descending order of all the source regions’ supply with D
mi (unit: 100 million t·km) were as follows: the top six were Harbin (6.52), Hebei (4.93), Hainan (3.74), Shandong (3.26), Sichuan (1.39) and Guangdong (1.32), all of which totaled more than 100 million t·km; to Beijing, these regions were highly dependent food-ecological suppliers. The next six regions by turn were Jilin (0.81), Shanxi (0.80), Liaoning (0.68), Hubei (0.61), Zhejiang (0.56) and Henan (0.54); to Beijing, these regions were modestly dependent food-ecological suppliers. As to the other regions such as (by turn) Inner Mongolian (0.34), Fujian (0.32), Yunnan (0.30), Jiangxi (0.27), Tianjin (0.26), Guangxi (0.24), Jiangsu (0.23), Shanxi (0.14), Gansu (0.13) and Hunan (0.05), were not much dependent food-ecological suppliers to Beijing. Details were shown in
Figure 1 (in
Figure 1 and
Figure 2, the capital of each province represented its provincial administration, see
Appendix Table A1).
Figure 1.
The spatial distribution of Beijing’s imported bio-capacity in 2008.
Figure 1.
The spatial distribution of Beijing’s imported bio-capacity in 2008.
In 2012, values in descending order of all the source regions’ supply with D
mi (unit: 100 million t·km) were as follows: the top nine were Guangdong (8.05), Hainan (7.50), Hebei (6.50), Liaoning (6.20), Shandong (6.02), Heilongjiang (3.20), Yunnan (3.10), Guangxi (2.77) and Hubei (2.20), all of which totaled more than 200 million t·km; to Beijing, these regions were highly dependent food ecological suppliers in 2012. The next six regions by turn were Jilin (1.80), Inner Mongolian (1.80), Fujian (1.33), Jiangxi (1.25), Sichuan (1.24) and Gansu (1.22); to Beijing, these regions were modestly dependent food-ecological suppliers with a value of more than 100 million t·km. As to the other regions, such as (by turn) Jiangsu (0.75), Henan (0.50), Tianjin (0.38), Hunan (0.17), Shanxi (0.12), Xinjiang (0.12), Shanxi (0.10), Shanghai (0.06) and Zhejiang (0.06), were not much dependent food- ecological suppliers to Beijing. Details were shown in
Figure 2.
Figure 2.
The spatial distribution of Beijing’s imported bio-capacity in 2012.
Figure 2.
The spatial distribution of Beijing’s imported bio-capacity in 2012.
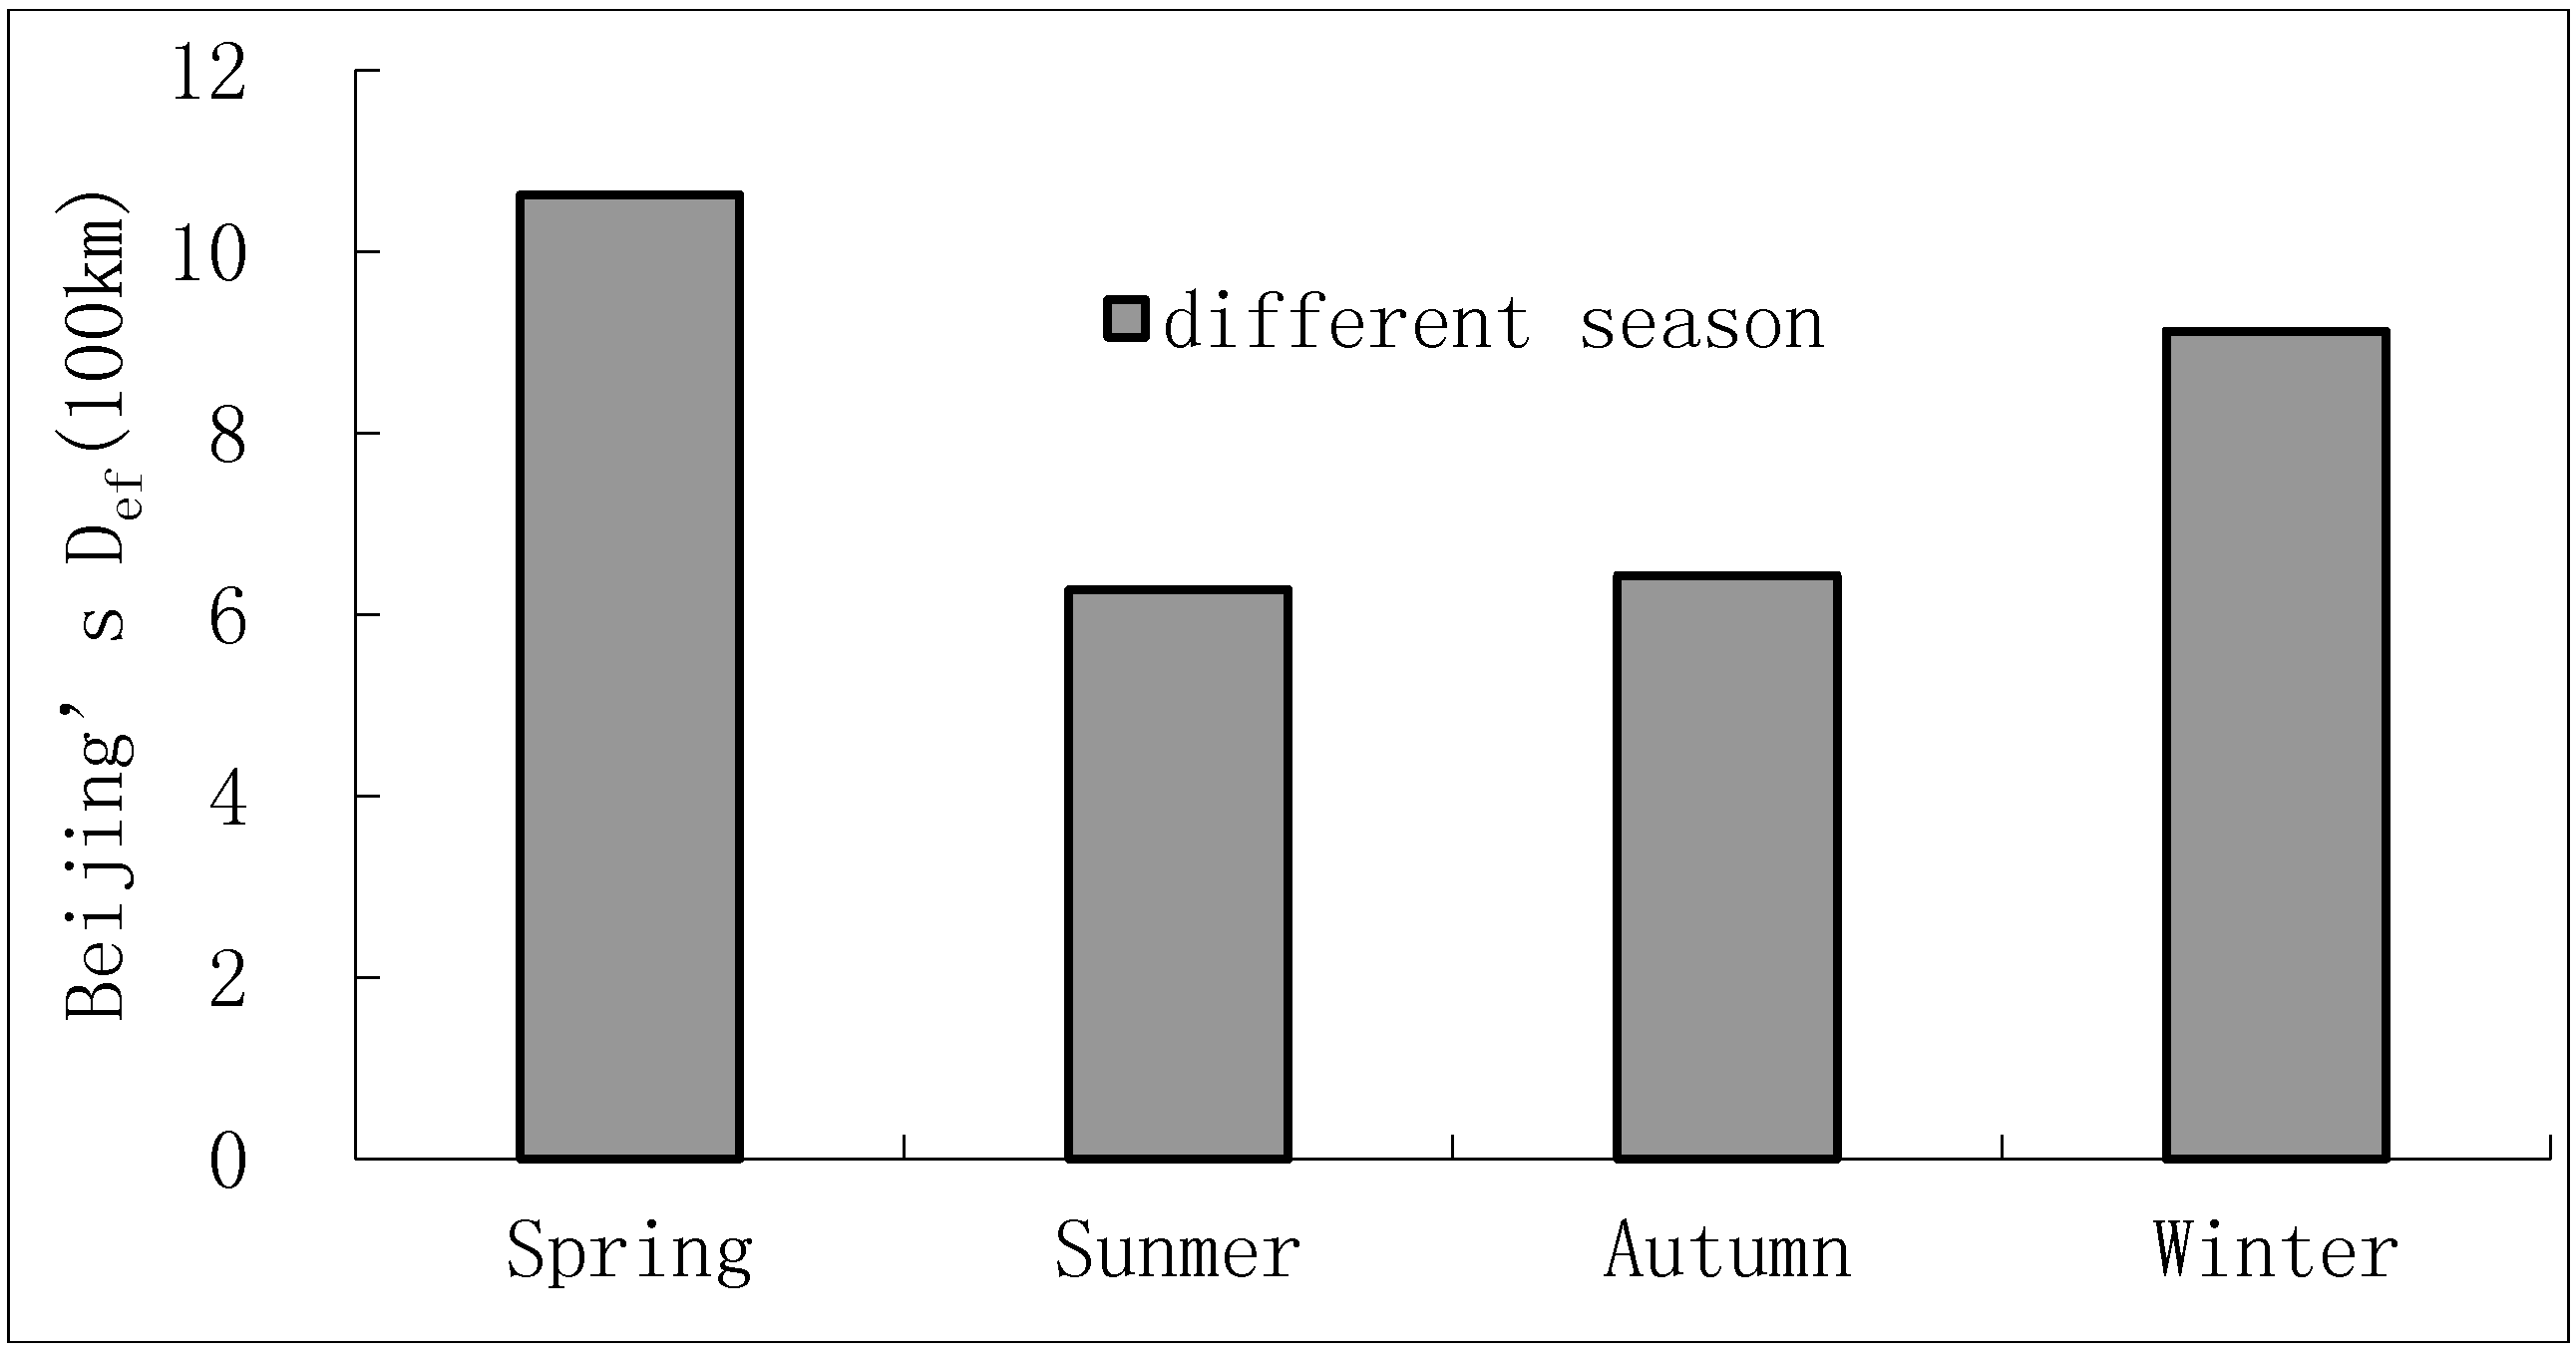
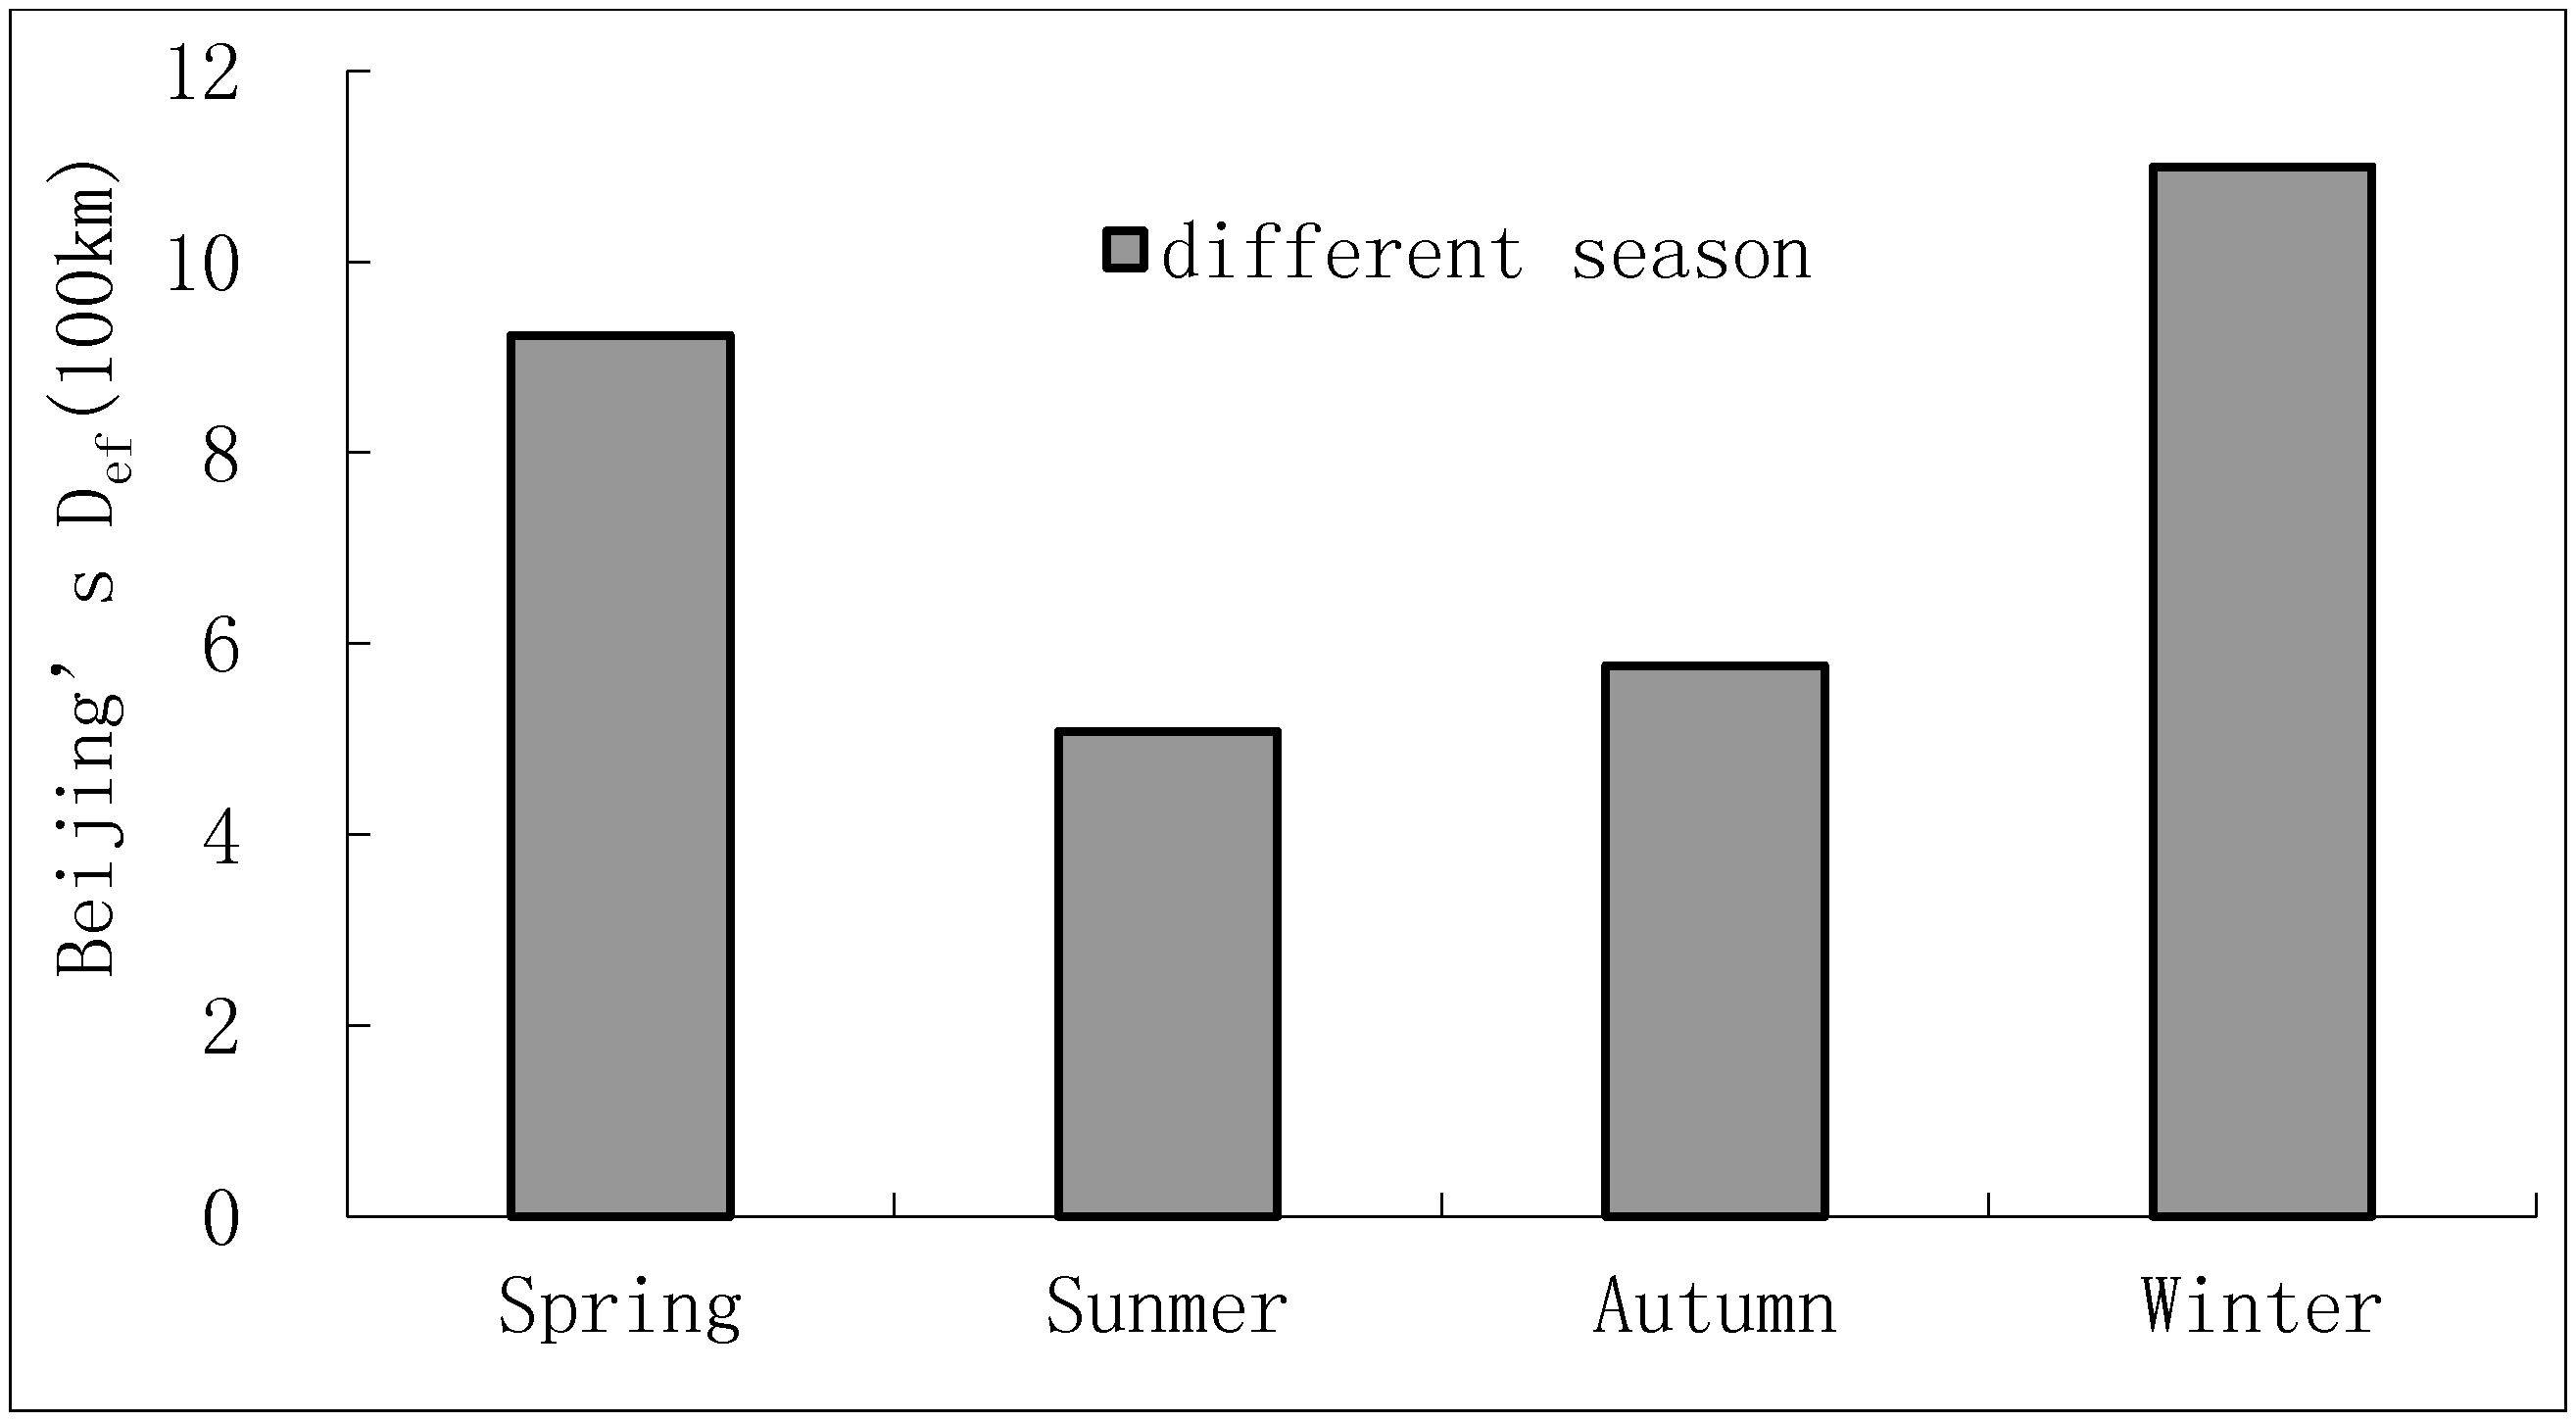
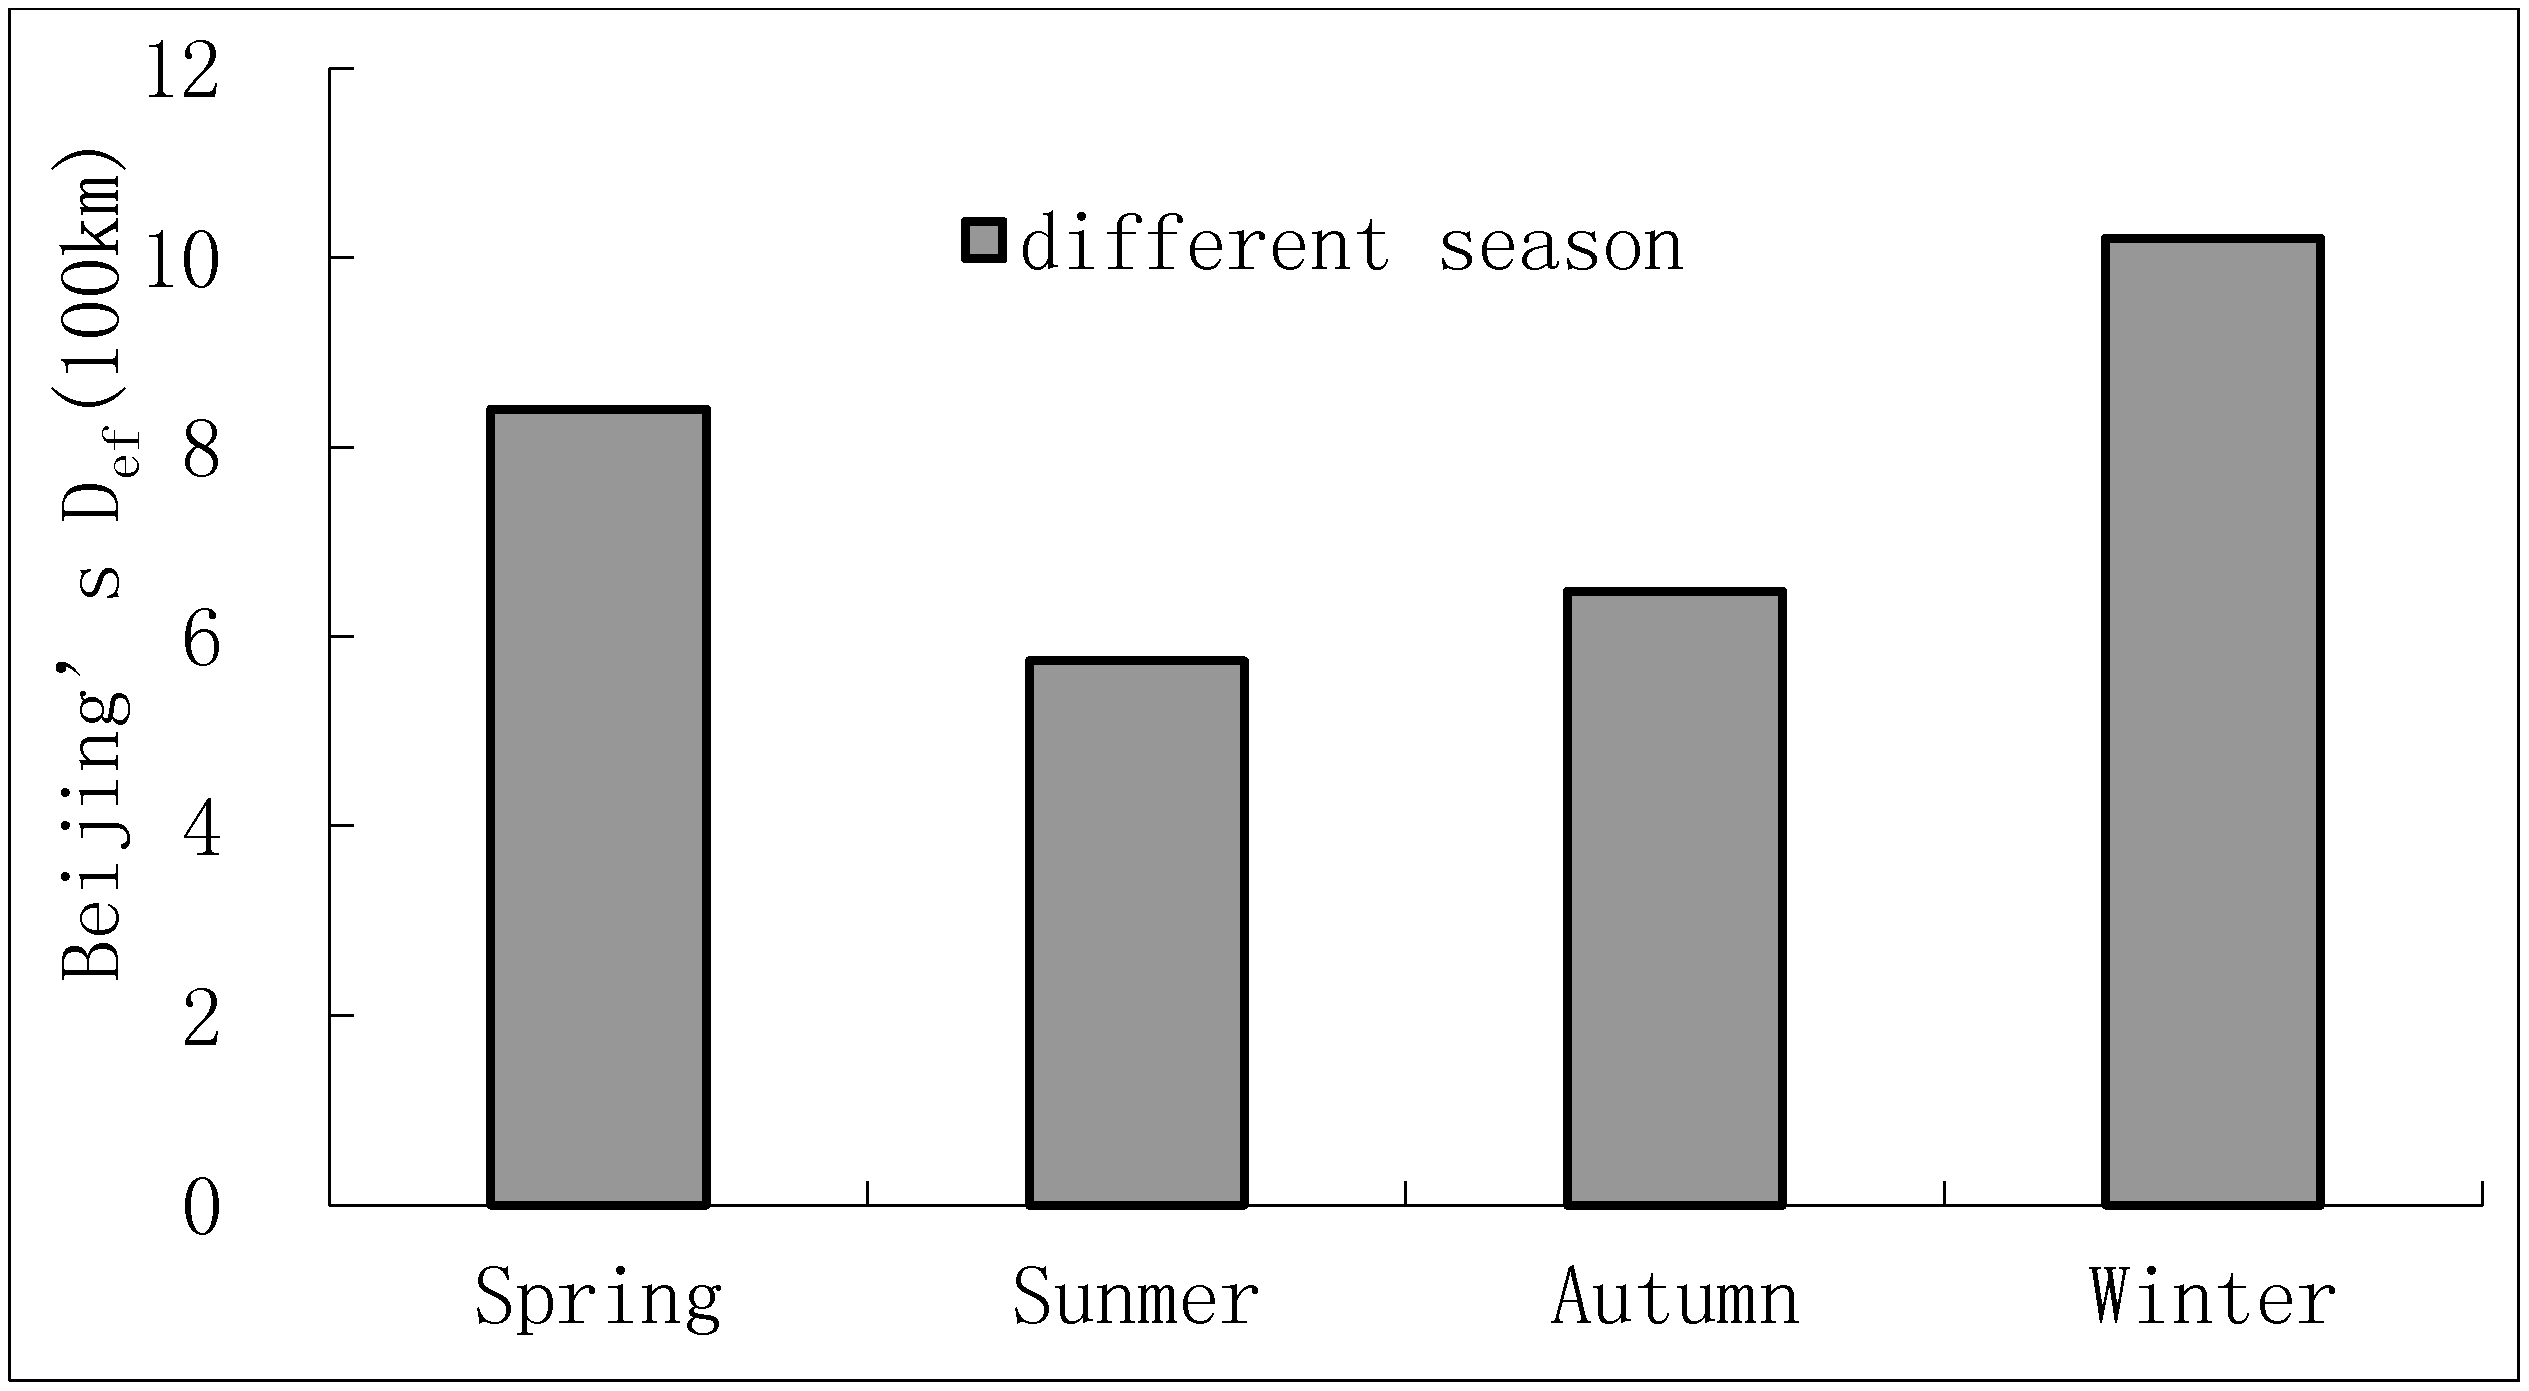
3.3.2. The Seasonal Dynamic of Beijing’s Def (2009–2012)
For the limitation of data, the time range for the annual seasonal dynamic analysis of Beijing’s Def was from 2009 to 2012.
As shown in
Figure 3, in 2009, the Max of Beijing’s seasonal D
ef appeared in the winter with its value 1020.92 km; the next is spring with a value of 840.37 km; then there was an obvious decline in fall with a value 647.62 km; the Min appeared in summer with a value of 574.59 km, about half of that winter.
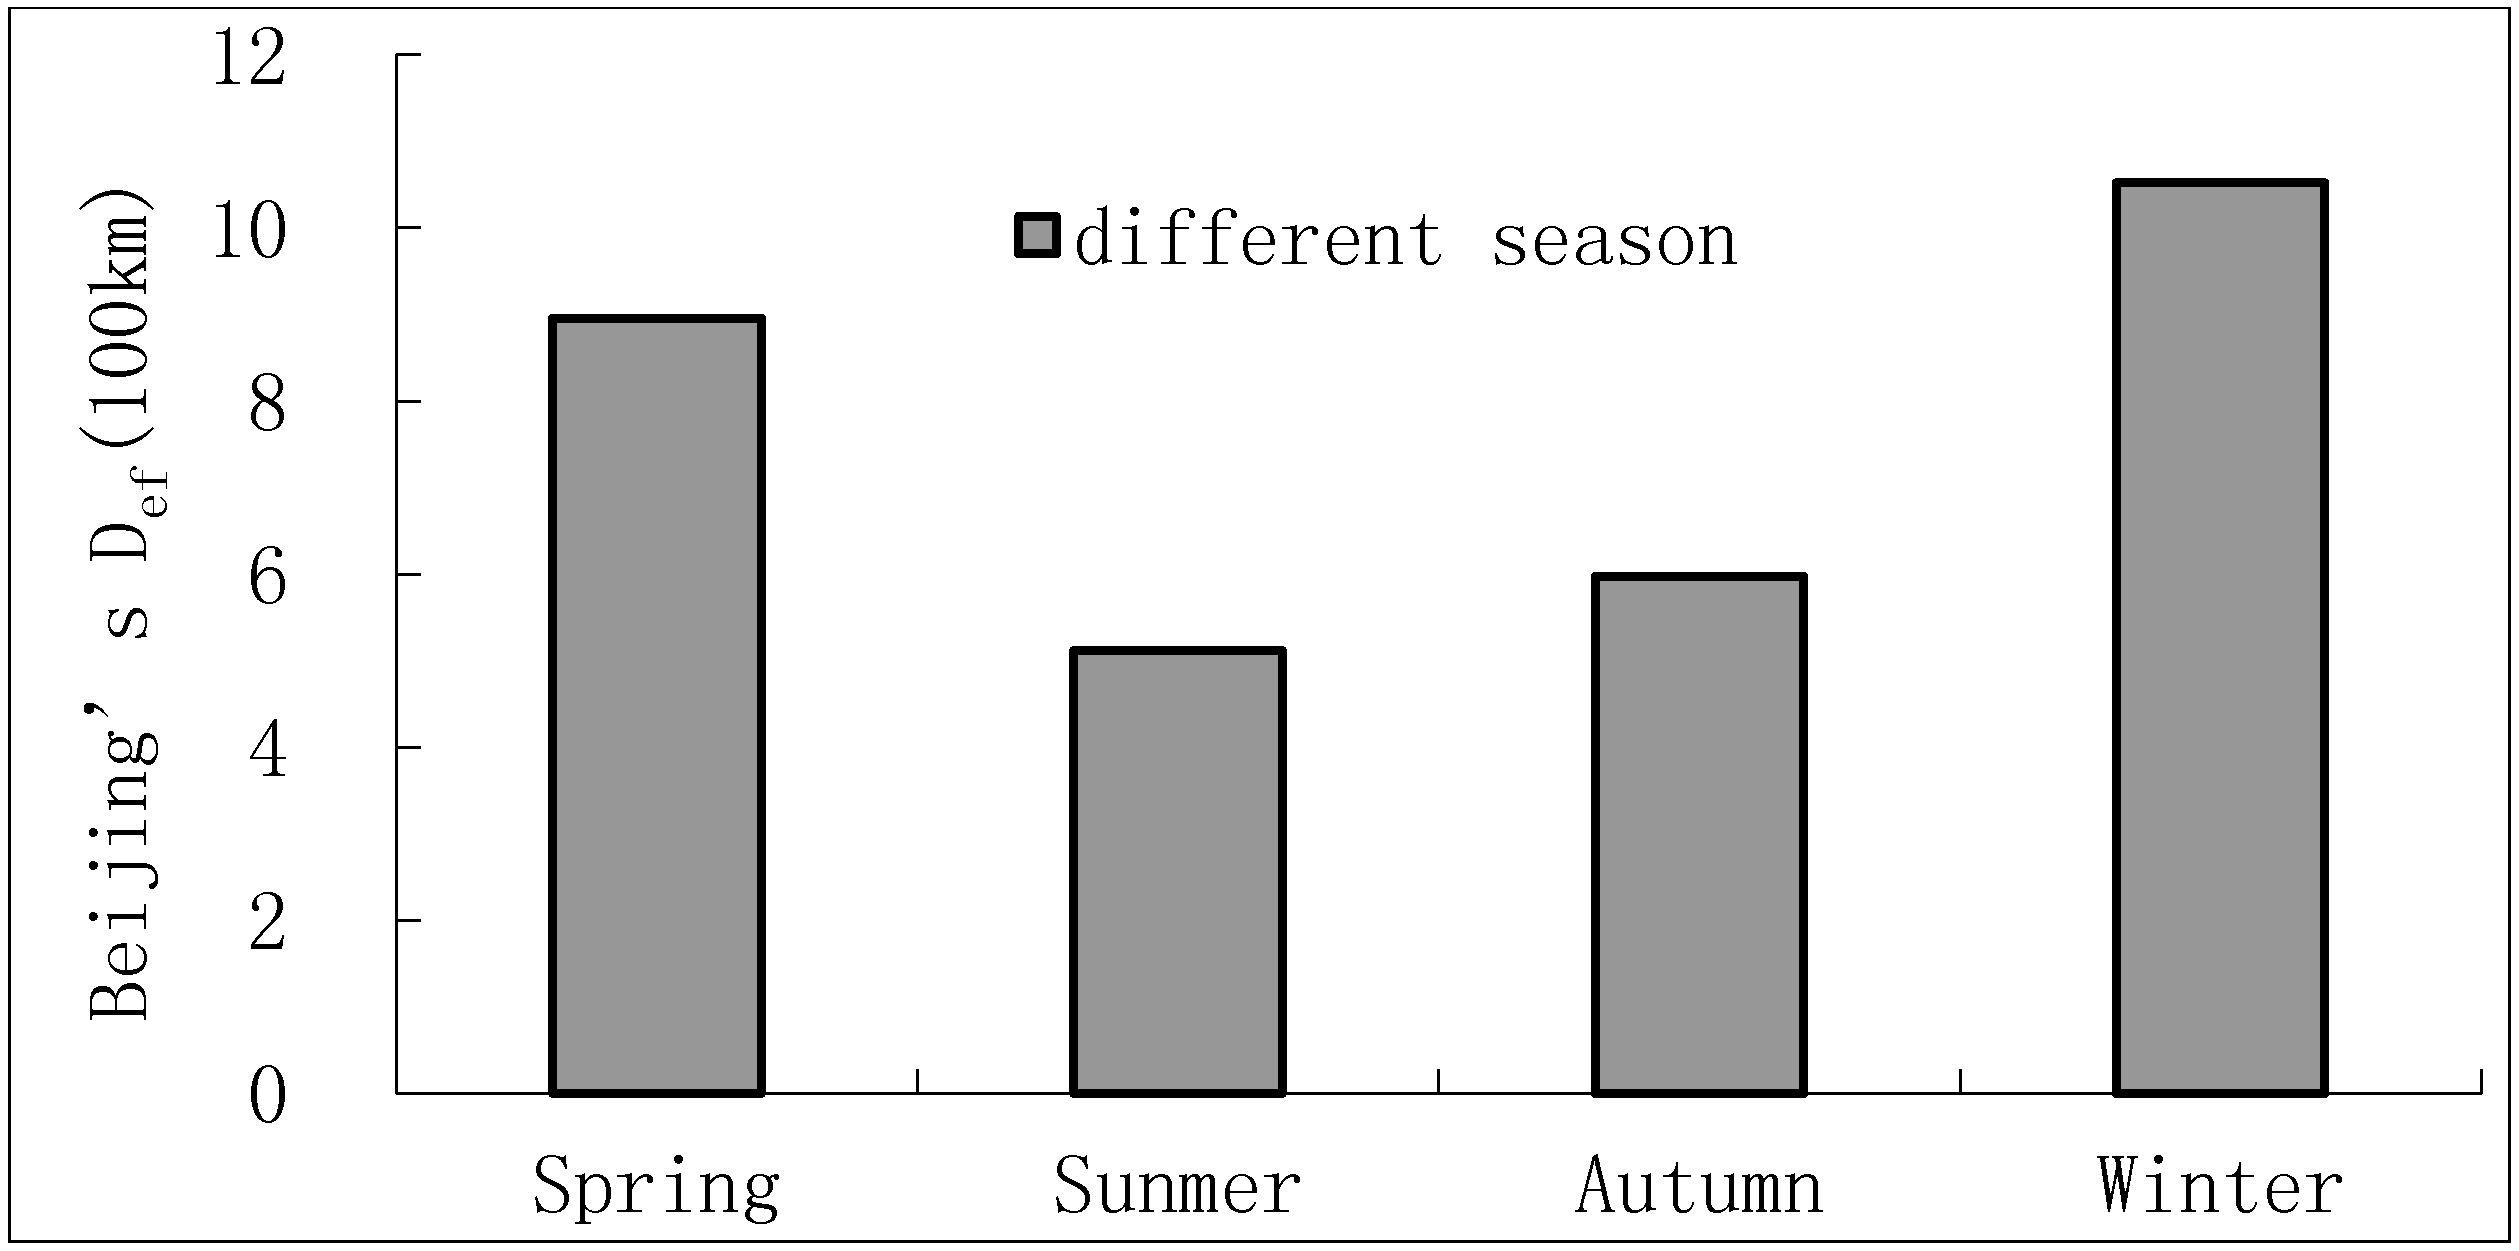
The seasonal dynamic of Beijing’s D
ef in 2010 was shown in
Figure 4, wherein the Max of Beijing’s D
ef appeared in Spring with a value of 1062.44 km, the second in Winter with a value of 912 km, then the third in Autumn with a value significantly declined to 642.9 km, and the Min in Summer with a value of only 627.01 km.
Figure 5 revealed the seasonal dynamic of Beijing’s D
ef in 2011. In 2011, the Max appeared in winter with a value of 1099.73 km; the second appeared in spring, valued 923.12 km; the third in fall with a value of 576.61 km; and the Min in summer with a value of 507.76 km.
Figure 3.
Seasonal dynamic of Beijing’s Def in 2009.
Figure 3.
Seasonal dynamic of Beijing’s Def in 2009.
Figure 4.
Seasonal dynamic of Beijing’s Def in 2010.
Figure 4.
Seasonal dynamic of Beijing’s Def in 2010.
Figure 5.
Seasonal dynamic of Beijing’s Def in 2011.
Figure 5.
Seasonal dynamic of Beijing’s Def in 2011.
It could be inferred from
Figure 6 that in 2012, the Max of Beijing’s D
ef appeared in winter with a value of 1052.16 km, the second in spring with a value of 896 km, then the third in fall with a value significantly declined to 597.14 km, and the Min in summer with a value of only 511.64 km.
Figure 6.
Seasonal dynamic of Beijing’s Def in 2012.
Figure 6.
Seasonal dynamic of Beijing’s Def in 2012.
By the seasonal dynamic of Beijing’s D
ef showed in
Figure 3,
Figure 4,
Figure 5 and
Figure 6, it could be inferred:
The Max of Beijing’s Def appeared more frequently in winter (2009, 2011 and 2012) than in spring (2010 only); winter (or spring) might be the most difficult season for people to live through in Beijing.
Beijing’s Def reduced obviously in summer and fall; the Min of Beijing’s Def of four chosen years all appeared in summer with a value of slightly more than half of the Max.
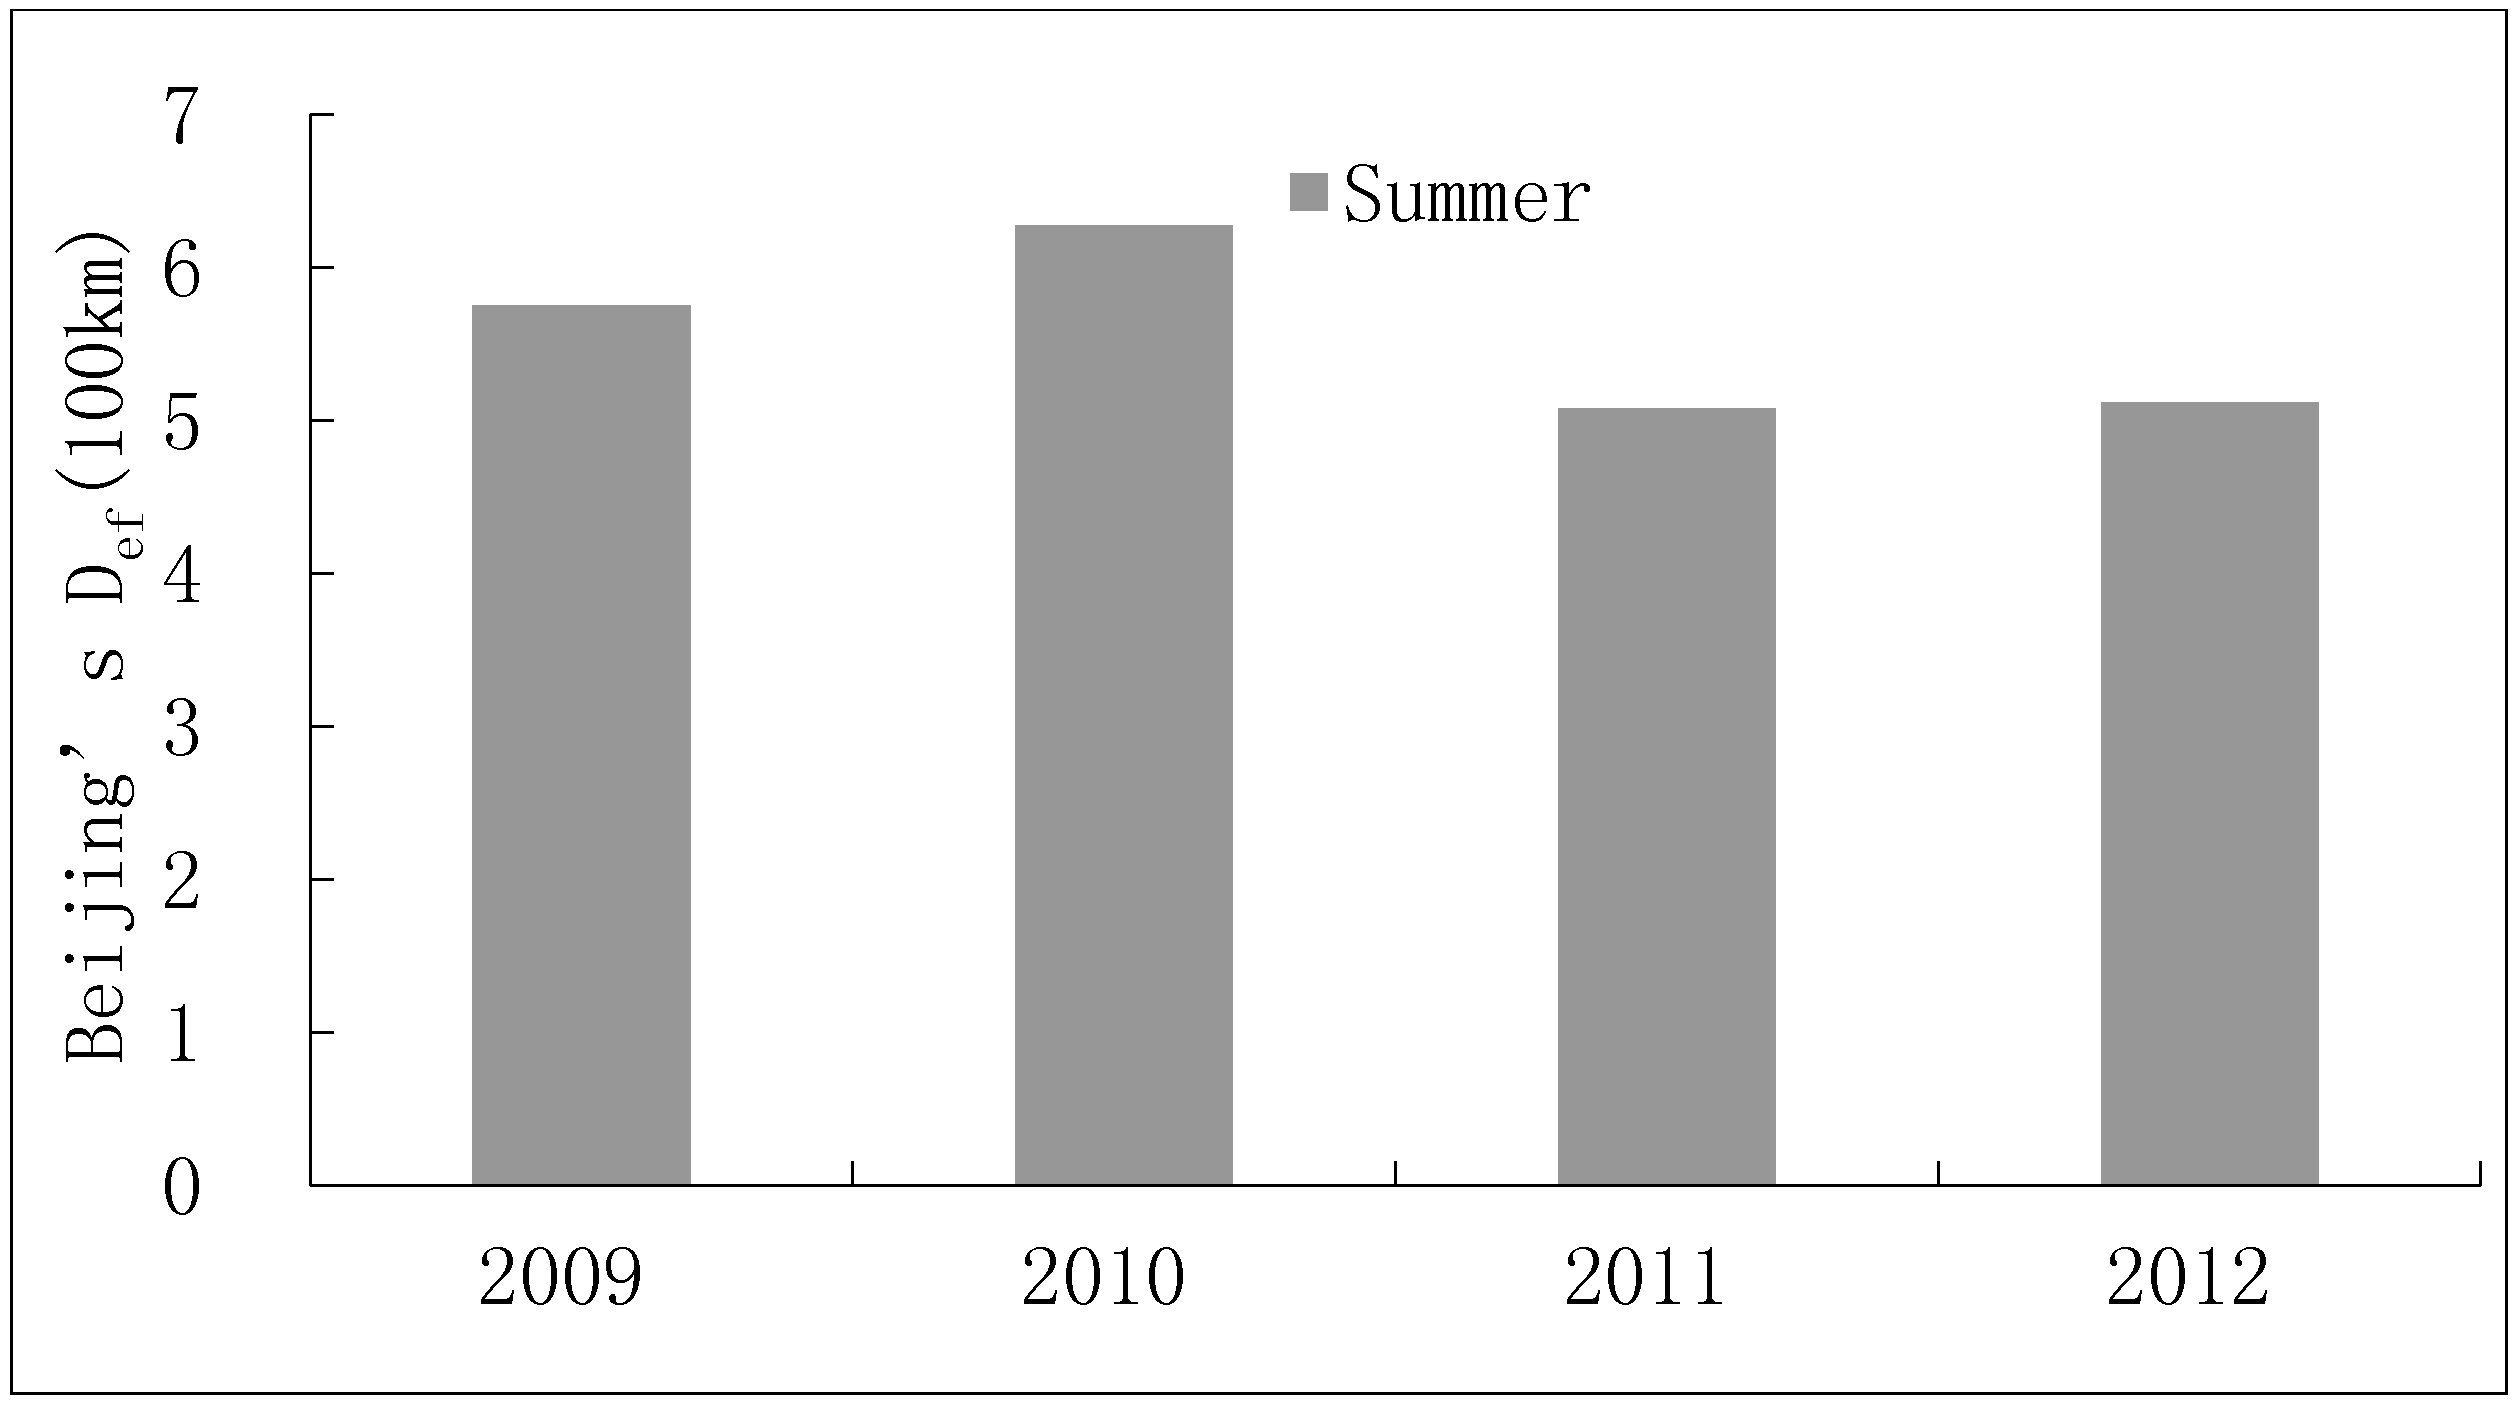
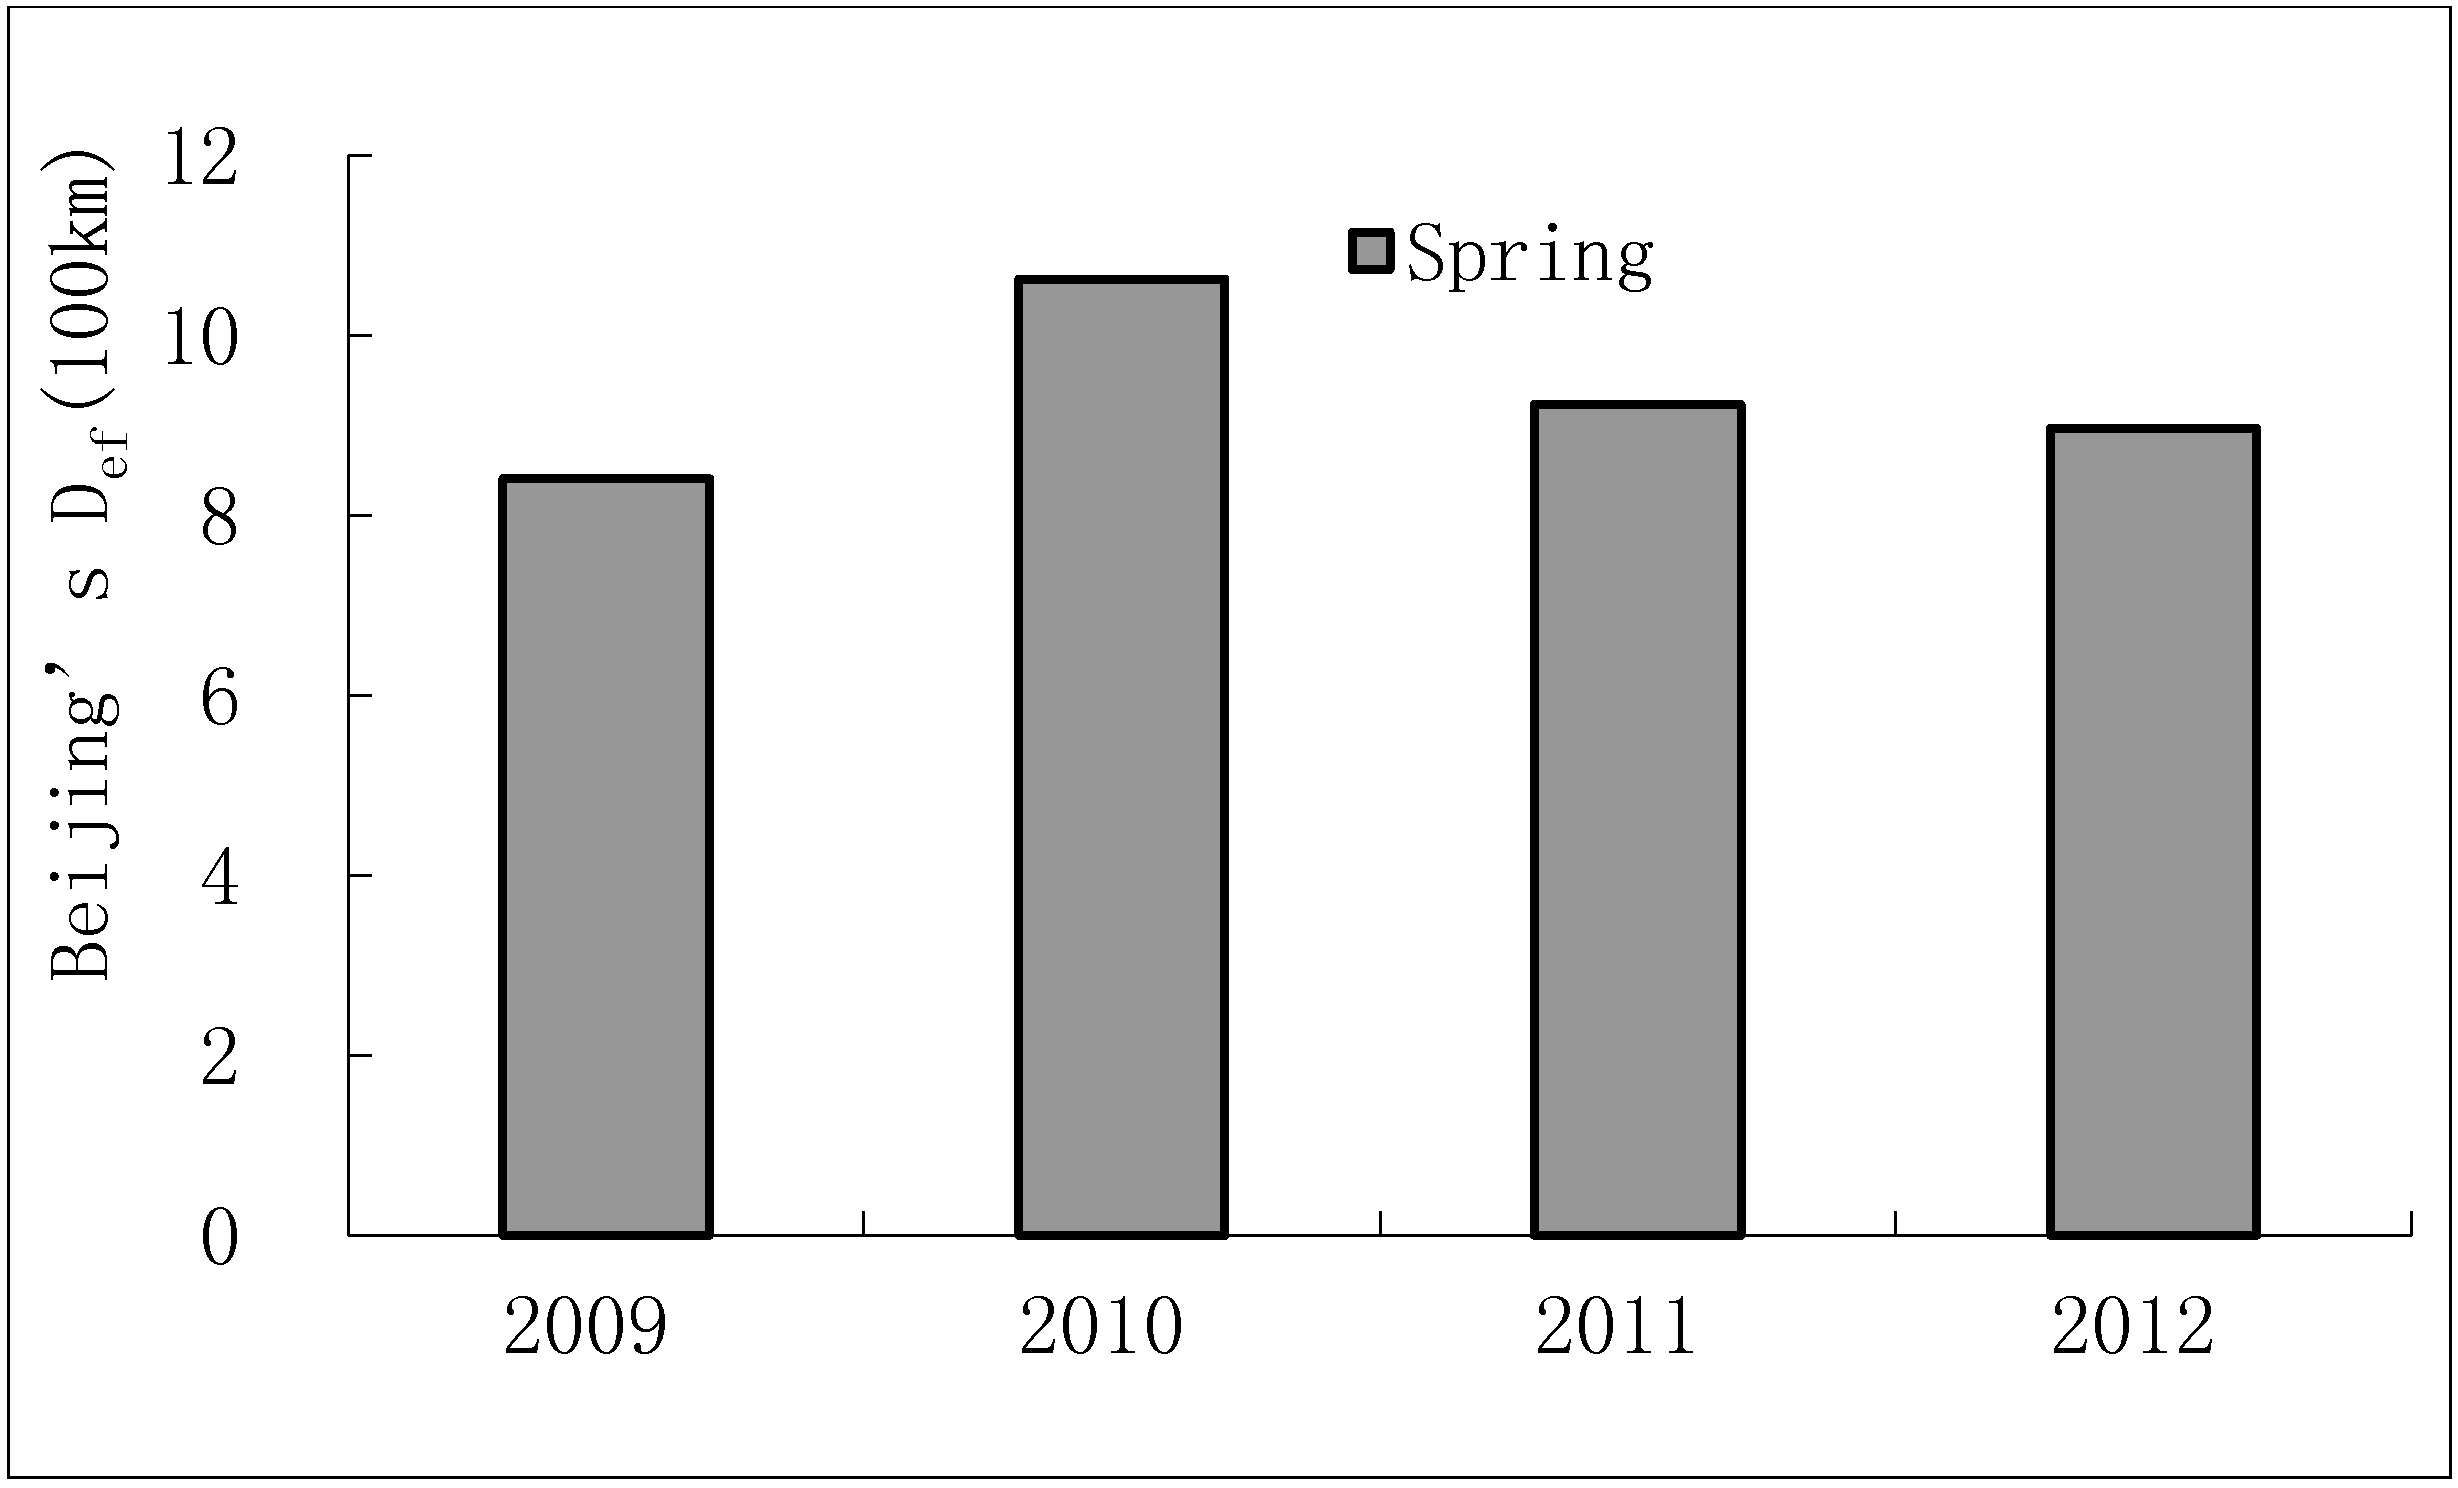
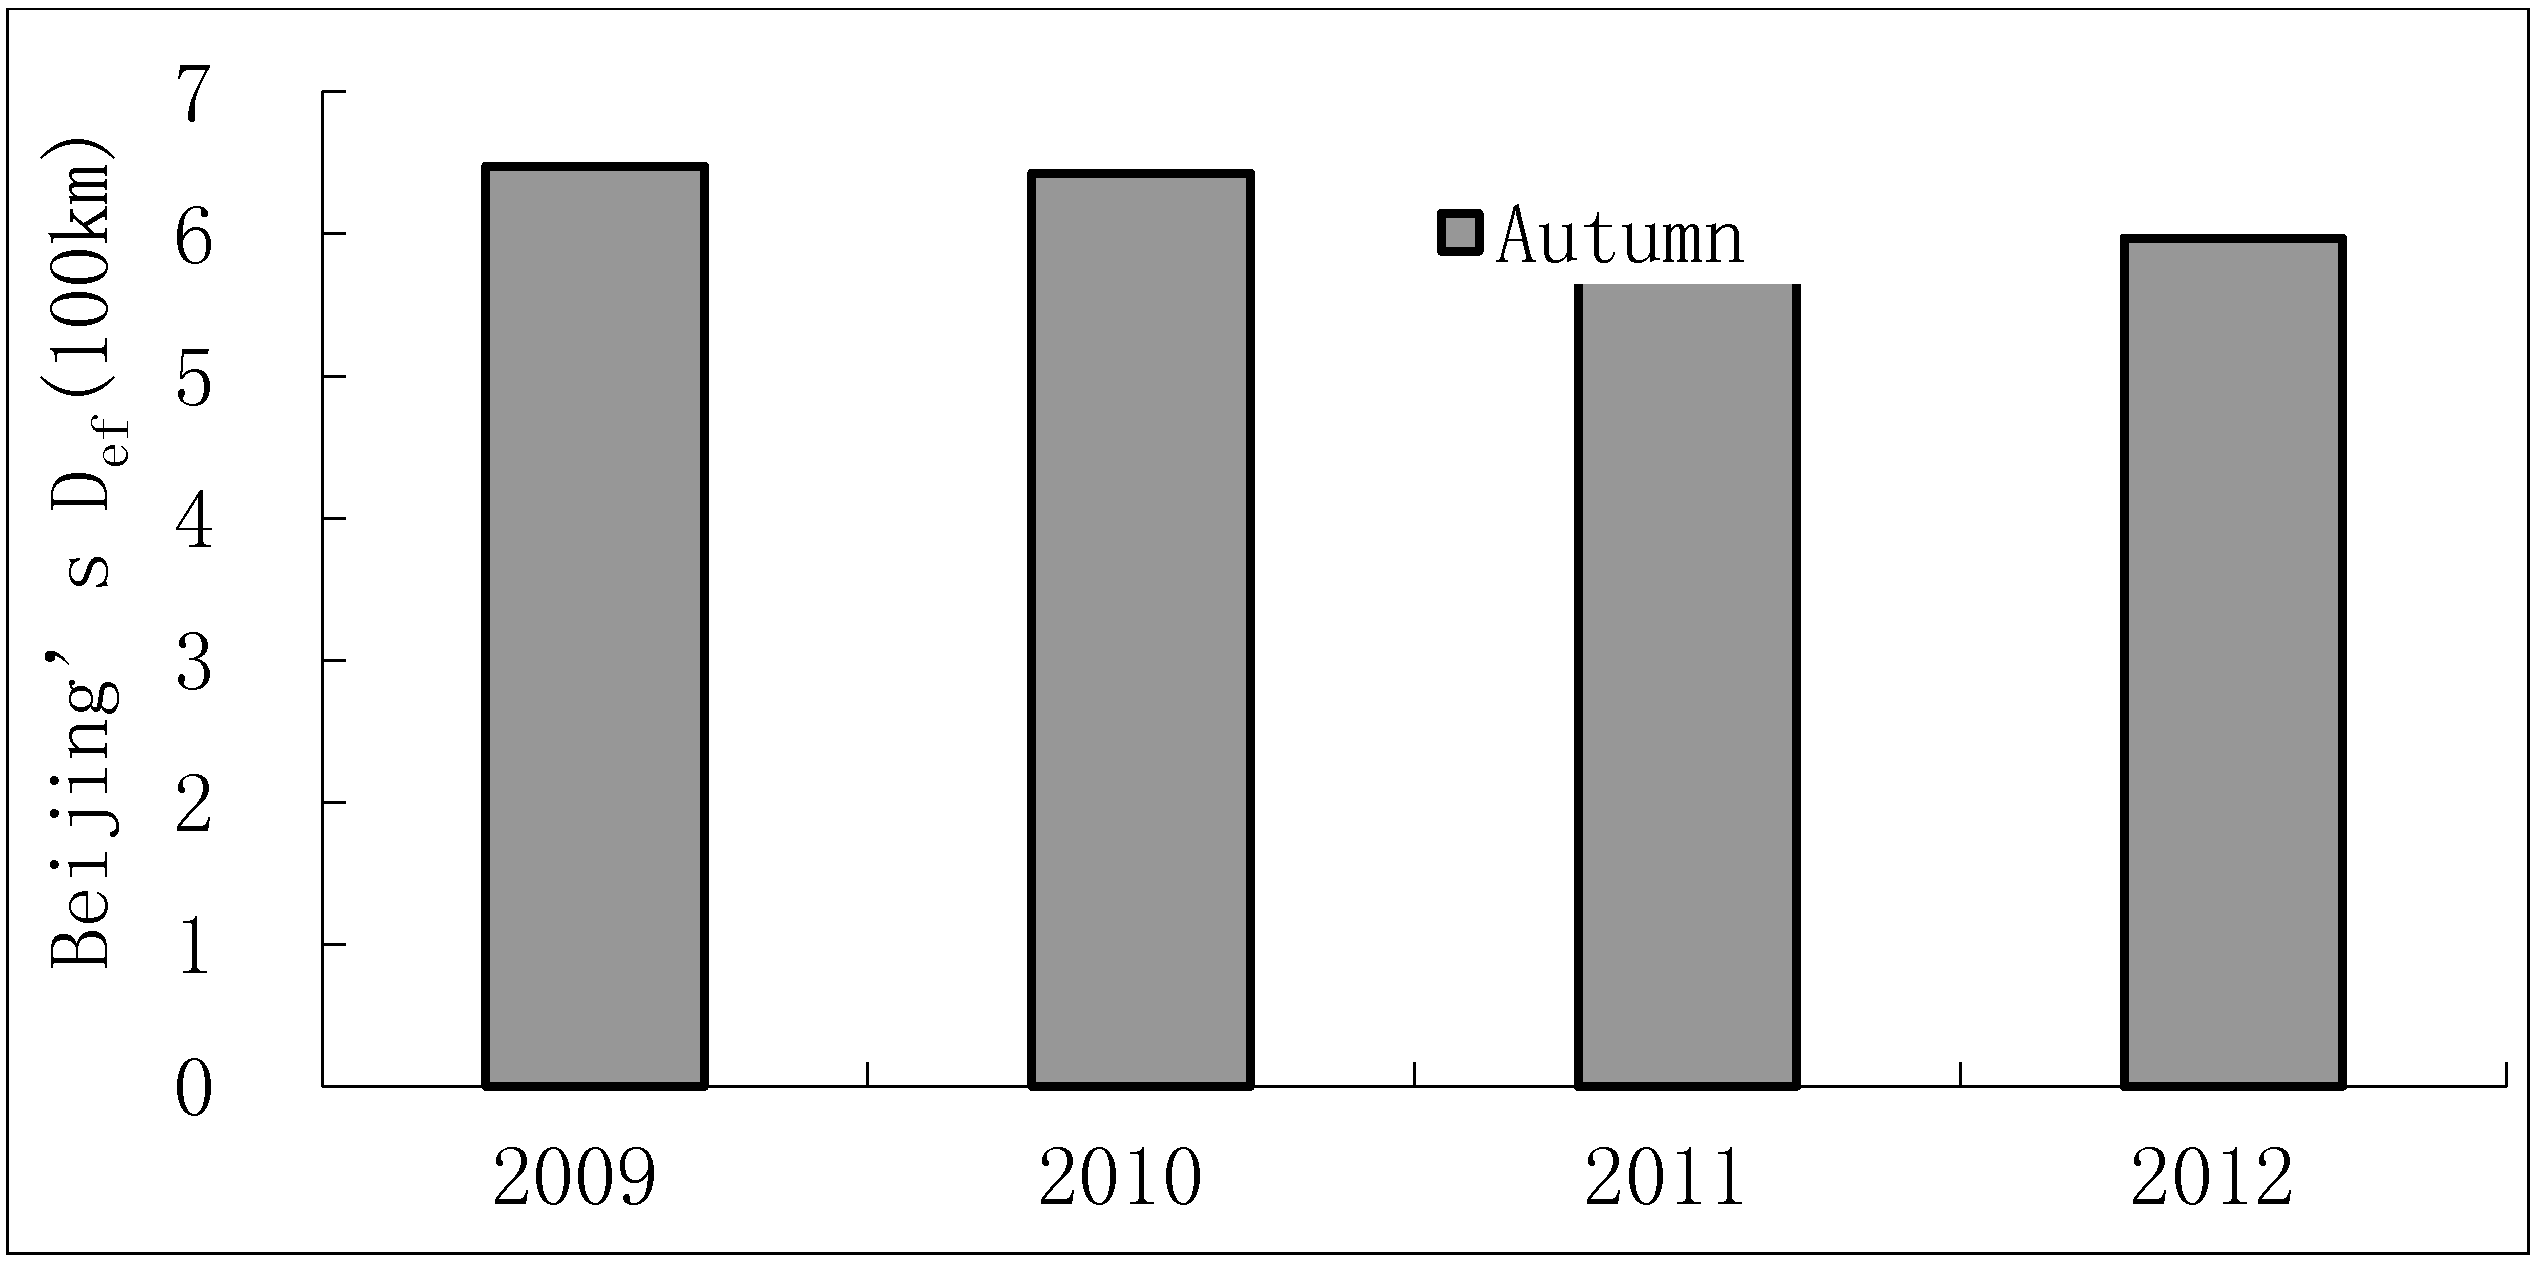
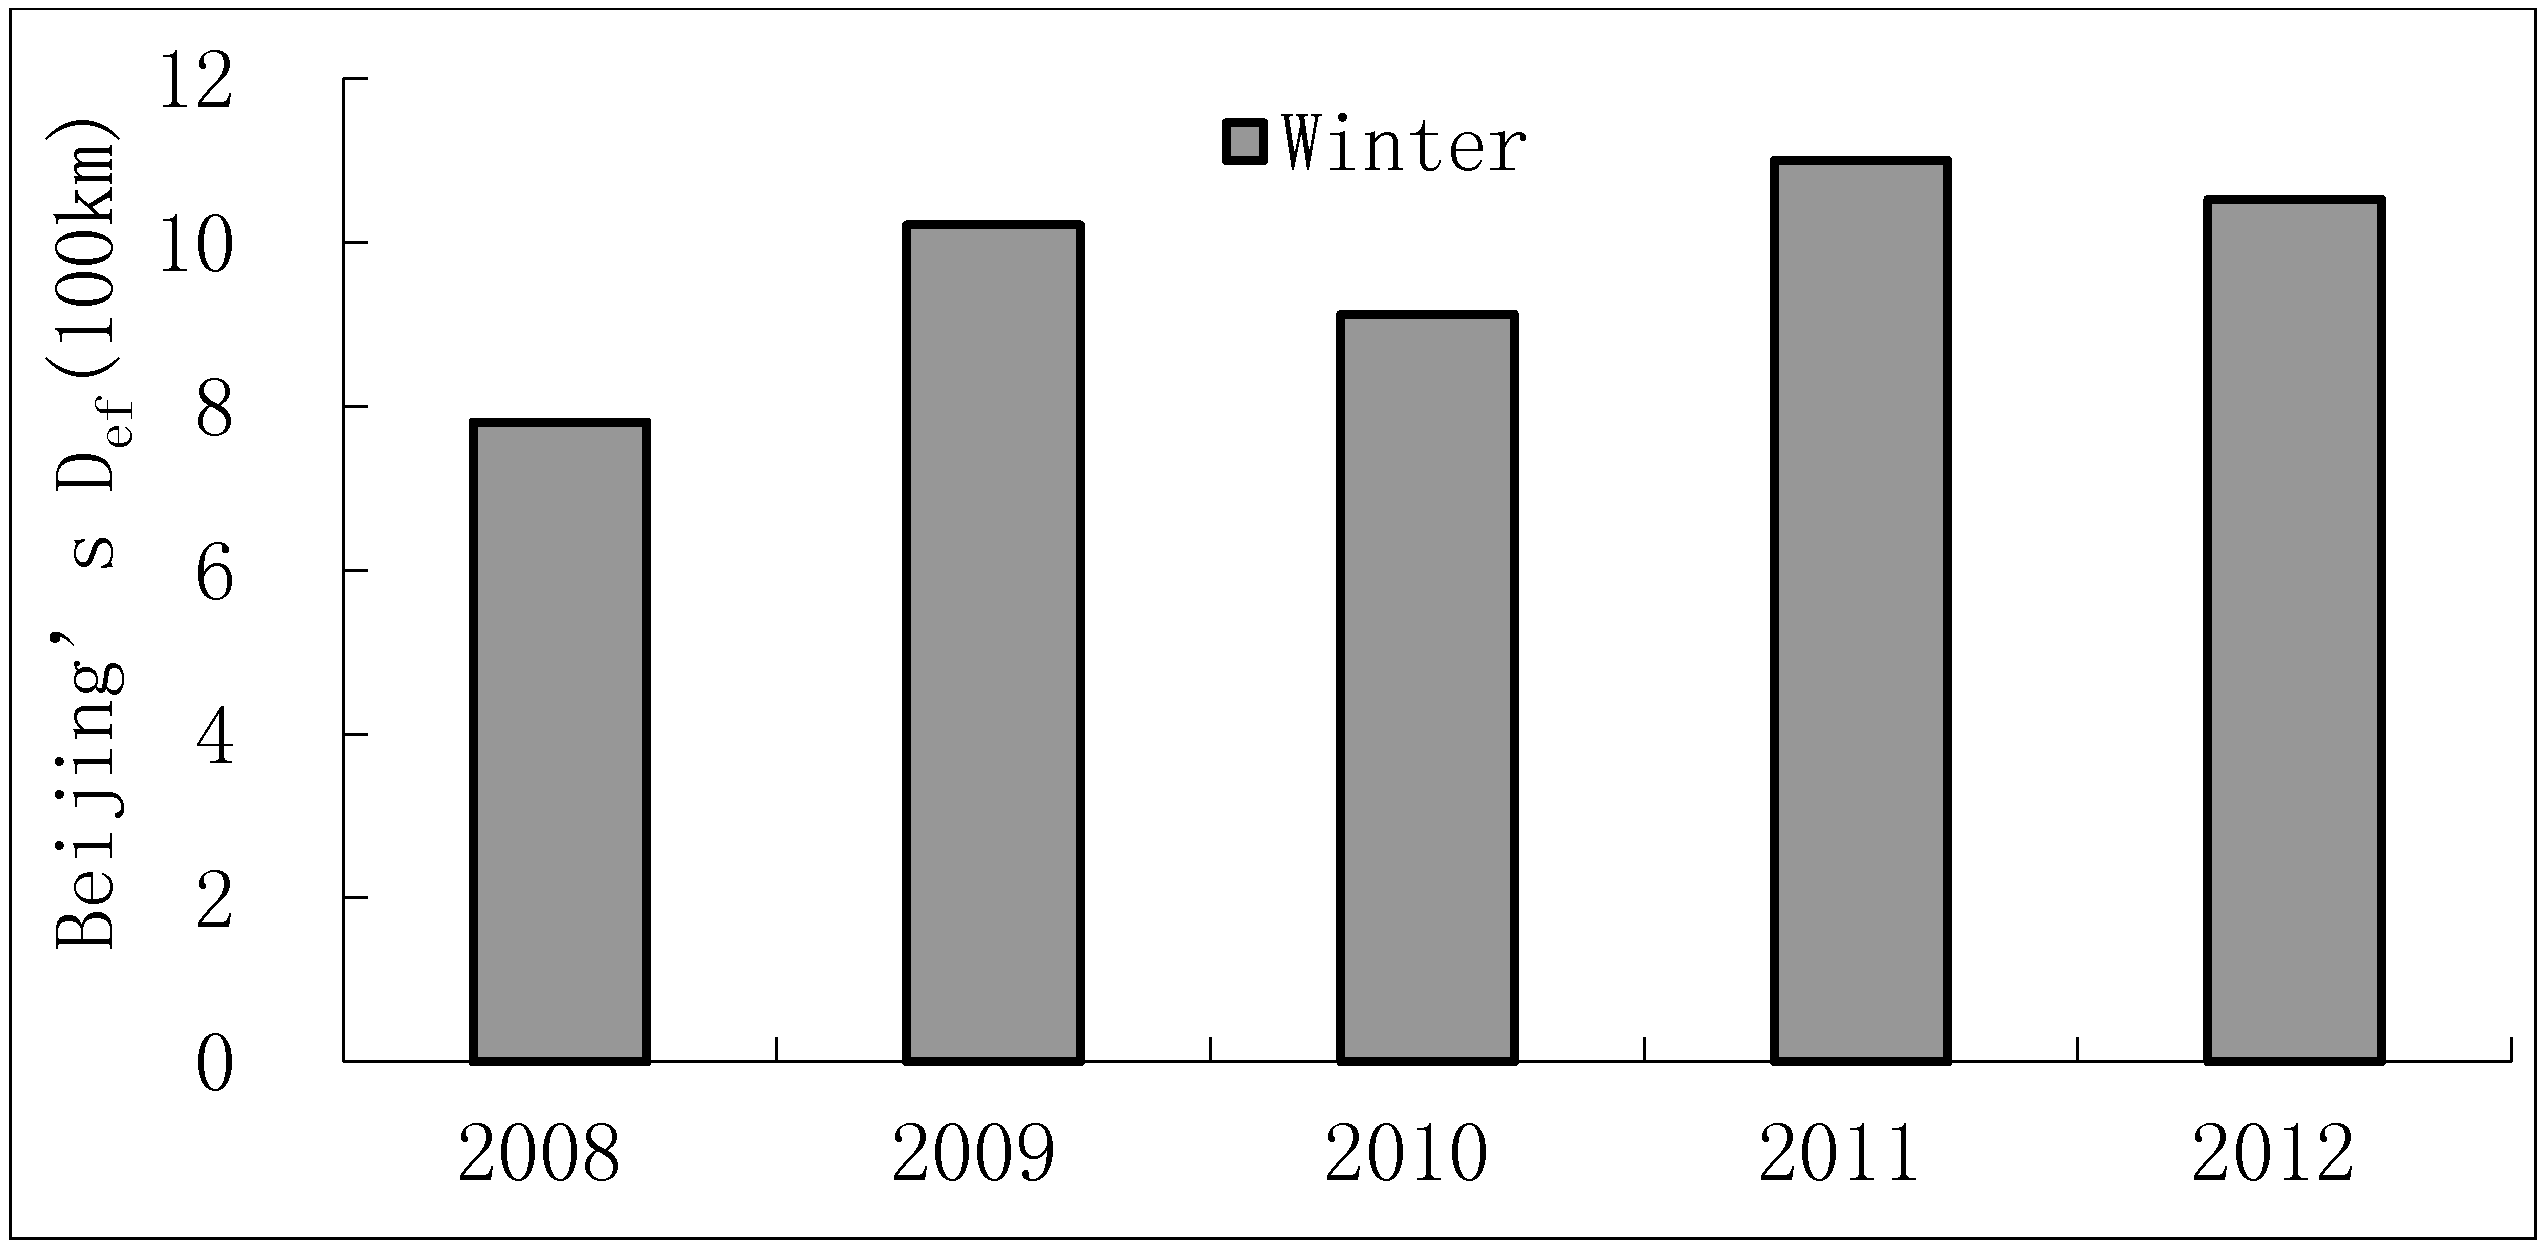
3.3.3. The Inter-annual Dynamic of Beijing’s Def in four Seasons
For the limitation of data, the time range for the inter-annual seasonal dynamic of Beijing’s Def in four seasons was as follows: for spring, summer and fall ranged from 2009 to 2012, yet for winter ranged from 2008 to 2012.
The inter-annual dynamic of Beijing’s four seasons was shown in
Figure 7,
Figure 8,
Figure 9 and
Figure 10, which respectively represented spring, summer, fall and winter. From the aspect of the same season, the Max of Beijing’s D
ef in spring and summer both appeared in 2010; the Max of Beijing’s D
ef in fall appeared in 2009 and 2010 (with a slight difference of 5 km); the Max of Beijing’s D
ef in winter appeared in 2011. Independent of year, Beijing’s D
ef in the two seasons of summer and autumn were significantly less than that of the two seasons of winter and spring.
Figure 7.
Inter-annual dynamic of Beijing’s Def in spring.
Figure 7.
Inter-annual dynamic of Beijing’s Def in spring.
Figure 8.
Inter-annual dynamic of Beijing’s Def in summer.
Figure 8.
Inter-annual dynamic of Beijing’s Def in summer.
Figure 9.
Inter-annual dynamic of Beijing’s Def in fall.
Figure 9.
Inter-annual dynamic of Beijing’s Def in fall.
Figure 10.
Inter-annual dynamic of Beijing’s Def in winter.
Figure 10.
Inter-annual dynamic of Beijing’s Def in winter.
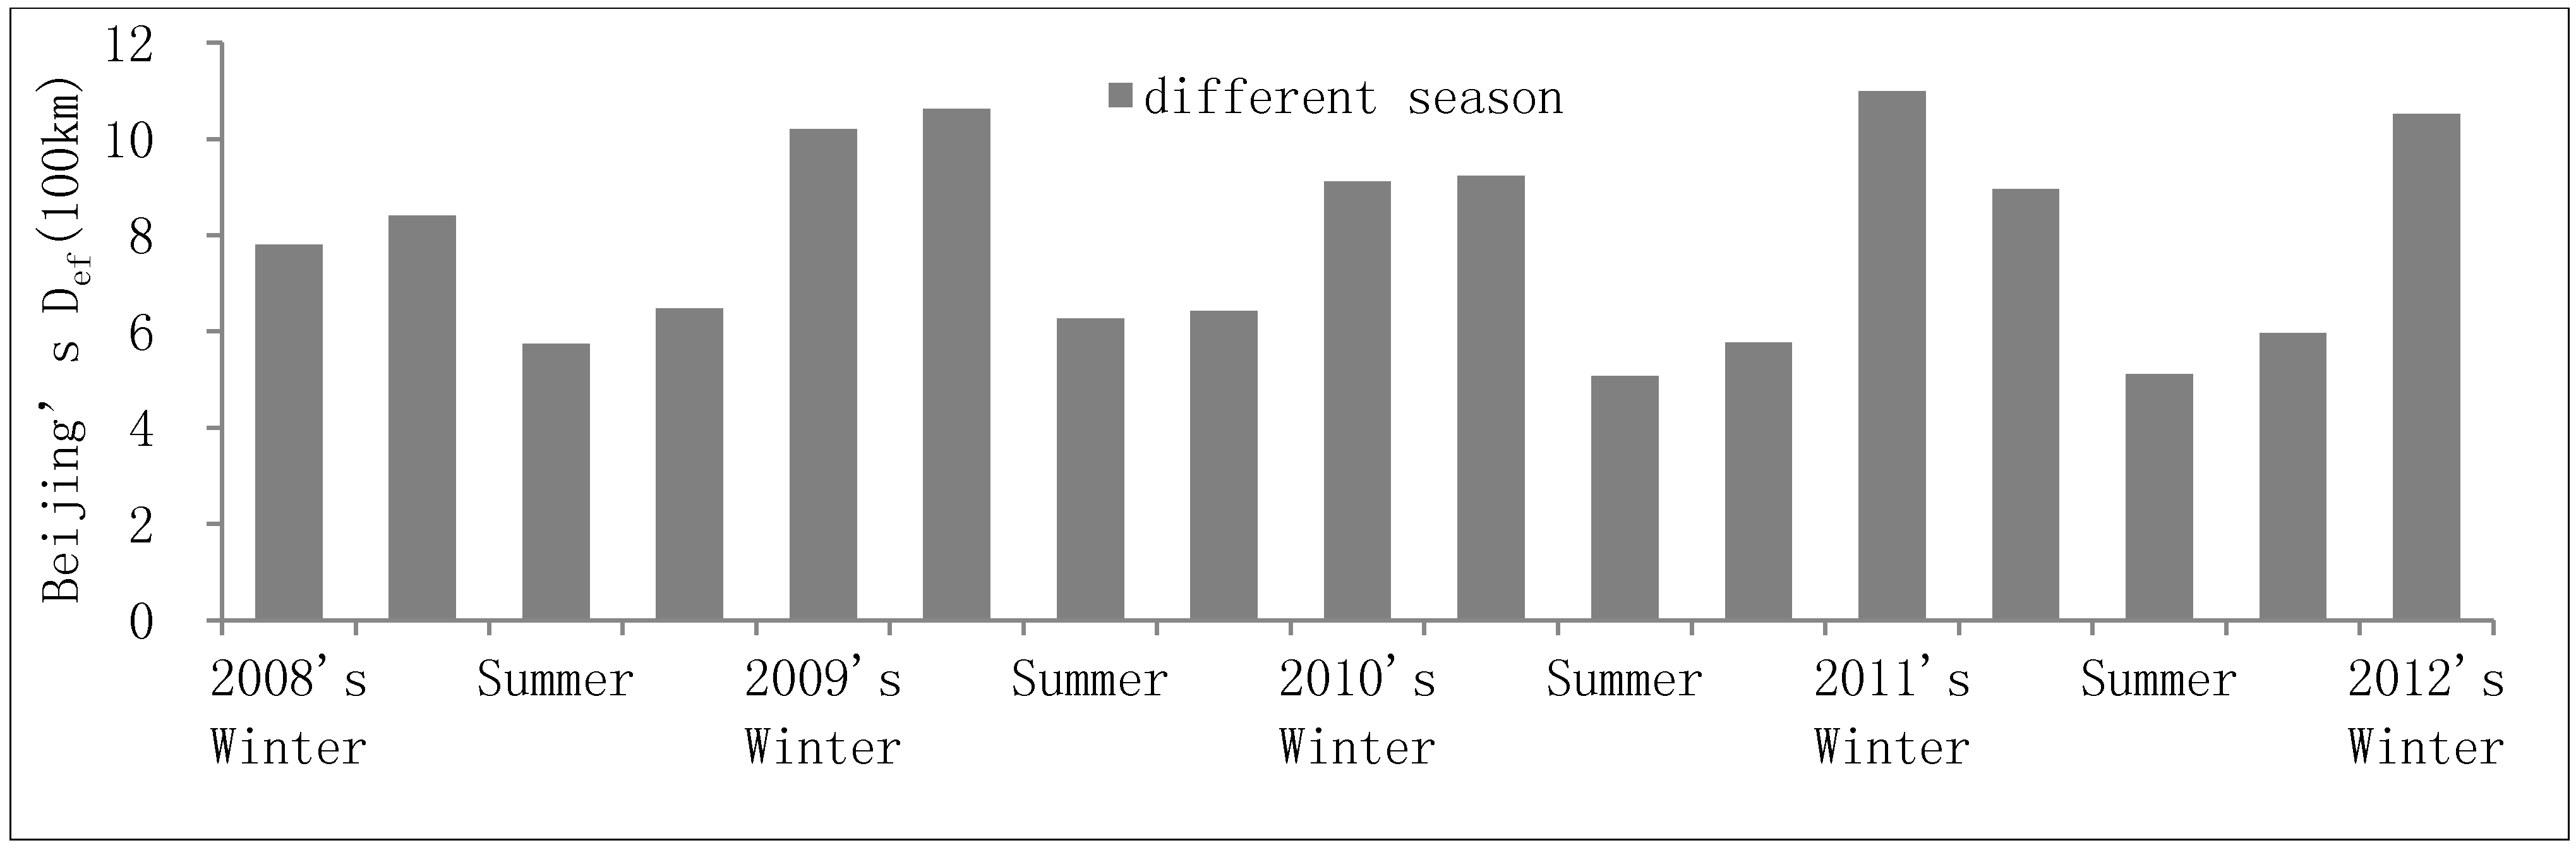
3.3.4. Multi-Year Consequent Seasonal Dynamics
The time range for the analysis of multi-year consequent seasonal dynamics of Beijing’s D
ef was set from the winter of 2008 to the winter of 2012. The details were shown in
Figure 11. The multi-year consequent seasonal dynamics of Beijing’s D
ef from the winter of 2008 to the winter of 2012 showed an undulating shape. Obviously, Beijing’s D
ef in winter and spring was much larger than that of summer and fall.
Figure 11.
Multi-year consequent seasonal dynamics of Beijing’s Def from 2008’s winter to 2012’s winter.
Figure 11.
Multi-year consequent seasonal dynamics of Beijing’s Def from 2008’s winter to 2012’s winter.
4. Conclusions and Discussion
In this paper, for the sake of using five categories of food resources to represent all categories of food resources and the ignorance of consumption of native food resources, the final calculation results of Beijing’s ecological footprint distance were therefore smaller than the actual value.
Through the study on Beijing’s D
ef from 2008 to 2012, it could be inferred that:
The Def of a certain object—such as a city—could be measurable, and reflected its ecological impact scope and degree. With the expansion of its population scale, Beijing’s ecological footprint distance ascended overall from 567 km in 2008 to 677 km in 2012. Beijing’s Dmi continued to increase from 274,304,189.60 t·km in 2008 to 564,419,532.04 t·km in 2012. The ecological cost for people to live in Beijing increased year by year.
The proportion of Beijing’s imported bio-capacity increased year by year from 48.4% in 2008 to 62% in 2012. Most of the food resources consumed in Beijing depended on the supply of other regions, and the main suppliers were concentrated in few provinces: grain and oil and meat and egg were mainly supplied by the northern regions including Heilongjiang, Jilin, Liaoning, Hebei and Inner Mongolia; yet, vegetable and fruit were mainly supplied by Hainan, Guangdong, Hebei and Shandong; aquatic products were mainly from Hebei and Jiangsu with a relatively small number. Supply base of these categories of bio-capacity should be further decentralized, avoiding too much concentration so as to keep the stability of the bio-capacity supply chain.
There was a seasonal dynamic of Beijing’s Def, showing a higher value in winter and spring than in summer and fall.
The consumption of Beijing’s ecological resources depended heavily on external world due to its rapid urbanization, which increased the living cost in Beijing and might result in a larger payment of all stakeholders. In order to keep the stability of sub-ecosystem of Beijing, the government should launch more appropriate initiatives for Beijing’s sustainable development.
In summary, here in this presentation, the authors proposed three indicators of “ecological footprint distance” (Def, Aef and Dmi), trying to judge how far the ecological impact scope of a city may be, to what extent a city depends on the external resources, and how high the ecological cost it is for a person to live in a city (especially in a megacity). These indicators built from Ecological Footprint (EF), and could add additional information to traditional EF results. As a popular tool, EF gives the area information about the natural ecosystem occupied by human, yet how far the ecological impact of a city is not known. In addition, Def gives the distance information on a city’s ecological impact, which could be an effective compensation for the EF. The indicators of “ecological footprint distance” may be critically important for the government to set up its “resources-supply security system” according to the “distance” of different food resources transferred from external regions. For example, while encountering a wide range of continuous blizzard, food crisis may take place in a city. If the safe distance of food supply of each kind of agricultural product from external world is clear, measures could be taken to avoid the disaster in advance. While faced with natural or man-made disasters, a “resources-supply security system” established according to “distance” could remind the government when and from where to import those categories of food resources with consideration of their Def respectively. Here, the word “when” means to take the preservation period of different food into consideration.
Nowadays, metropolitan areas are generally facing with increasing ecological pressure. Although improvement of eco-efficiency and the application of trade measures can effectively alleviate the ecological resources pressure on metropolises within their threshold range [
24], from the perspective of the ecological system, the sub-ecosystems could only be stable while ways to exchange material and energy with the external world is smooth. With the urbanization process in China, metropolitan cities’ D
ef might continue to increase. The governments should establish an effective early warning mechanism, so as to deal with any emergency that may arise, and try to achieve sustainable development in metropolitan areas.
Acknowledgments
This research was funded by China National Technology Support Program-ecological compensation of key ecological function areas (2013BAC03B05), Zhejiang Agr & Forestry University Development Fund (2004FR011), and The National Natural Science Foundation of China (41101539). The paper benefited from discussions with my colleagues: Lei Xie, Keqiang Huang and Xinbao Yan. I am especially grateful to the Sustainability editors, the anonymous reviewers, and my friend Huayu Li for their thoughtful comments on an earlier version of the paper.
Author Contributions
Gaodi Xie designed research and took part in the writing of the paper; Wenhui Chen performed research, analyzed the data and wrote the paper; Shuyan Cao, Chunxia Lu, Yu Xiao and Changshun Zhang took part in the writing of the paper; Na Li and Shuo Wang collected the data. All authors read and approved the final manuscript.
Appendix
Table A1.
Capital city and its provincial administrative in China (part of all, mentioned in this paper)
Table A1.
Capital city and its provincial administrative in China (part of all, mentioned in this paper)
| Capital City | Provincial Administrative | CAPITAL CITY | Provincial Administrative | Capital City | Provincial Administrative |
|---|
| Beijing | Beijing | Haerbin | Heilongjiang | Changchun | Jilin |
| Shenyang | Liaoning | Huhehaote | Inner Mongolia | Wulumuqi | Xijiang |
| Lanzhou | Gansu | Xian | Shanxi | Taiyuan | Shanxi |
| Yinchuan | Yinchuan | Shijiazhuang | Hebei | Tianjin | Tianjin |
| Jinan | Shandong | Zhengzhou | Henan | Chengdu | Sichuan |
| Wuhan | Hubei | Nanjing | Jiangsu | Shanghai | Shanghai |
| Hangzhou | Zhejiang | Nanchang | Jiangxi | Changsha | Hunan |
| Nanning | Guangxi | Kunming | Yunnan | Fuzhou | Fujian |
| Guangzhou | Guangdong | Haikou | Hainan | | |
Conflicts of Interest
The authors declare no conflict of interest.
References
- Costanza, R.; Arge, R.; Groot, R.; Farber, S.; Grasso, M.; Hannon, B.; Limburg, K.; Naeem, S.; O’Neill, R.; Paruelo, J.; et al. The value of the world’s ecosystem services and natural capital. Nature 1997, 387, 253–260. [Google Scholar] [CrossRef]
- Gaodi, X.; Shuyan, C.; Chunxia, L. Study on China Ecological Carrying Capacity, 1st ed.; Science Press: Beijing, China, 2011; pp. 1–17. [Google Scholar]
- Jixi, G. Sustainable Development Theory Exploration—Ecological Carrying Capacity Theory, Methods and Applications, 3rd ed.; China Environmental Science Press: Beijing, China, 2001; pp. 29–131. [Google Scholar]
- Andrews, C.L. Reindeer in Alaska. Washington Hist. Q. 1919, 10, 171–176. [Google Scholar]
- Gaodi, X.; Yu, X.; Chunxia, L. Study on Ecosystem Services: Progress, Limitation and Basic Paradigm. J. Plant Ecol. 2006, 2, 191–199. [Google Scholar]
- Bolund, P.; Hunhammar, S. Ecosystem services in urban areas. Ecol. Econ. 1999, 29, 293–301. [Google Scholar] [CrossRef]
- Rees, W. Ecological footprints and appropriated carrying capacity: What urban economics leaves out. Environ. Urban. 1992, 2, 121–130. [Google Scholar] [CrossRef]
- Wackernagel, M.; Rees, W. Our Ecological Footprint: Reducing Human Impact on the Earth; New Society Publishers: Gabriola Island, Canada, 1996; pp. 69–129. [Google Scholar]
- Wiedmann, T.; Barrett, J. A Review of the Ecological Footprint Indicator—Perceptions and Methods. Sustainability 2010, 2, 1645–1693. [Google Scholar] [CrossRef]
- Aubauer, H.P. Development of Ecological Footprint to an Essential Economic and Political Tool. Sustainability 2011, 3, 649–665. [Google Scholar] [CrossRef]
- Wackernagel, M.; Monfreda, C.; Moran, D.; Wermer, P.; Goldfinger, S.; Deumling, D.; Murray, M. National Footprint and Biocapacity Accounts 2005: The underlying calculation method. Land Use Policy 2004, 21, 231–246. [Google Scholar] [CrossRef]
- Xu, Z.M.; Cheng, G.D.; Zhang, Z.Q. Measuring sustainable development with the ecological footprint method—Take Zhangye prefecture as an example. Acta Ecol. Sin. 2001, 9, 1484–1493. [Google Scholar]
- Kitzes, J.; Galli, A.; Bagliani, M.; Kitzes, J.; Galli, A.; Bagliani, M.; Barrett, J.; Dige, G.; Ede, S.; Erb, K.; et al. A research agenda for improving national Ecological Footprint accounts. Ecol. Econ. 2009, 7, 1991–2007. [Google Scholar] [CrossRef]
- Lewan, L.; Simmons, C. The Use of Ecological Footprint and Biocapacity Analyses as Sustainability Indicators for Sub-national Geographical Areas: A Recommended Way Forward. In Proceedings of Final Report to the Oslo Workshop, European Common Indicators Project, Ambiente, Italy, 27 August 2001.
- Bloom, D.E.; Canning, D.; Fink, G. Urbanization and the Wealth of Nations. Science 2008, 772, 772–775. [Google Scholar] [CrossRef]
- Staniunas, M.; Burinskiene, M.; Maliene, V. Ecology in Urban Planning: Mitigating the Environmental Damage of Municipal Solid Waste. Sustainability 2012, 4, 1966–1983. [Google Scholar] [CrossRef]
- Charles, H.; Godfray, J. Food and Biodiversity. Science 2011, 2, 1231–1232. [Google Scholar]
- Newton, P.; Meyer, D. Exploring the Attitudes-Action Gap in Household Resource Consumption: Does “Environmental Lifestyle” Segmentation Align with Consumer Behaviour? Sustainability 2013, 5, 1211–1233. [Google Scholar] [CrossRef]
- Kissinger, M.; Sussman, C.; Moore, J.; Rees, W.E. Accounting for the Ecological Footprint of Materials in Consumer Goods at the Urban Scale. Sustainability 2013, 5, 1960–1973. [Google Scholar] [CrossRef]
- ArcGIS, version 9.3; Environmental Systems Research Institute, Inc.: RedLands, CA, USA, 2008.
- Beijing Municipal Bureau of Statistics, National Bureau of Investigation Corps Beijing. Beijing Statistical Yearbook (2000–2013); China Statistics Press: Beijing, China, 2000–2013. [Google Scholar]
- Yuxi, Z. Theory and Practice on Agricultural Products Circulation—Practice and Experience of Beijing Xinfadi Market; Social Sciences Academic Press: Beijing, China, 2012; pp. 1–379. [Google Scholar]
- National Population and Family Planning Commission migrants Service Management Division. Chinese Report of Floating Population Development (2010–2012); China Population Press: Beijing, China, 2010–2012; pp. 197–286. [Google Scholar]
- Aall, C.; Husabø, I.A. Is Eco-Efficiency a Sufficient Strategy for Achieving a Sustainable Development? The Norwegian Case. Sustainability 2010, 2, 3623–3638. [Google Scholar] [CrossRef]
© 2014 by the authors; licensee MDPI, Basel, Switzerland. This article is an open access article distributed under the terms and conditions of the Creative Commons Attribution license (http://creativecommons.org/licenses/by/4.0/).

 ,
, 