1. Introduction
The Mediterranean region has been subject to intense anthropic pressure for millennia, resulting in a vulnerable and often fragile ecosystem [
1]. Livestock and crop farming are the main human activities in the area [
2]. The excessive use of fertilizers in the region has, in general, led to soil acidification, problems of soil degradation, and a major proportion of contaminant trace metals [
3,
4,
5,
6]. Moreover, in the European Mediterranean region, cropping intensity is often inconsistent with the soil’s natural potential, with 26% of the soils used for farming being in fact unsuitable for that purpose [
6]. These activities, coupled with other planned and unplanned actions by men have contributed to increase landscape change [
7,
8,
9] raising global alertness related to the need to rethink the impact of several agricultural practices in order not only to protect the environment, but also to reduce their impact, in which heavy metal concentrations is a major concern.
The concentration of heavy metals in agricultural soils is mainly related with the parental material of the area [
10], although there are only few studies on availability and mobility of the heavy metals in agricultural soils.
The characterization of the content and sources of heavy metals in soils is a key element in many programs of environmental protection, including the establishment of regional-level quality standards to detect sites affected by contamination [
11,
12]. The accumulation of heavy metals in the soil is considered to be a serious risk at the environmental level [
13]. Published results on the levels of heavy metals in soils been based on indirect estimation, small-scale studies, or poorly defined time periods, but often represent the only information available for extensive territories. Also, they are not only hard to extrapolate, but seem unlikely to provide any reliable picture of long-term trends that might be applicable to any large agricultural area under commercial management. For this reason, the present large-scale field study represents a major research contribution to determining and quantifying the impact of agriculture on soil available heavy metal content under Mediterranean conditions.
It is widely accepted that determining the total content of heavy metals in a soil is neither sufficient to understand their relative mobility and ecological availability as contaminants nor particularly useful as a tool to estimate potential risks. The toxicity of metals for plants and animals including humans depends not only on their total concentrations, but also on their mobility and reactivity with other components of the ecosystem [
14,
15]. The “bioavailable fraction” is the fraction of the total contaminant in the interstitial water and soil particles that is available to the receptor organism [
16]. However, there is still very little direct measurement data or predictions of the available fraction of metals in soils. In Portugal and Spain for instance, there is hardly any information at all on available heavy metals in agricultural soils, and this lack of information is reflected in poorly informed legislation, which does not take soil characteristics into account [
17,
18]. The initial soil pH and the ability of plant roots to change the pH have been found to be the principal predictors of the exchange of heavy metals, and therefore of their bioavailability [
19]. It is generally accepted that anthropogenic heavy metal contamination exists mainly in the form of reactive species on the soil surface, and the concepts of “bioavailability” and “bio-accessibility” were introduced to express the actual effect of the concentration of a contaminant on organisms in the ecosystem [
16,
20,
21,
22].
Following [
23] “The term geochemical baseline indicates the actual content of an element in the superficial environment at a given point in time, as is defined by Salminen and Gregorauskiene (2000) cited by [
23]. The geochemical baseline in an area of heavy anthropogenic impact includes the geogenic, natural content (background). The determination of background (geogenic) values, in contrast to baseline values, is very important for defining the extent of pollution in areas where environmental legislation has not yet established intervention limits for all environmental matrices”.
The geochemical baseline concentration (GBC) and background level (BL) of different heavy metals in soils have been studied in various Mediterranean countries [
12,
18,
23,
24,
25,
26,
27,
28]. It is widely accepted that the BL and GBC were the best approach to establish the levels of non-contaminated soils 26 Different approaches have been taken to establishing the GBC of trace elements in Mediterranean soils [
12,
18,
29,
30,
31]. Most have centered on the total heavy metal content without considering the bioavailability of the different elements involved [
32], even though, according to Baldantoni
et al. [
33], bioavailability constitutes the best indicator of the potential impact of these contaminants.
The present study is aimed at contributing to improved information on available heavy metals in Mediterranean agricultural soils in particular, it being important to bear in mind that there is only limited data available on available heavy metals in Mediterranean soils in general. Given this context, the specific objectives were: (i) to study the levels of available heavy metals in typical agricultural soils of a Mediterranean region; (ii) to establish the available GBC of these metals; and (iii) to establish relationships between available heavy metals and certain soil properties.
3. Results and Discussion
The main soil characteristics are listed in
Table 1. The commonest soil groups in the study area are Fluvisols (42.7%), Luvisols (21.7%), Calcisols (16.1%), Cambisols (6.1%), Vertisols (1.8%), and Regosols (0.6%), as is usual in Mediterranean ecosystems [
34]. In general, these are medium-loam and clay-loam soils with a pH close to 7, slightly calcareous, and low levels of soil organic matter (SOM, 1.54%) and total nitrogen (N, 0.1%). They have intermediate levels of cation exchange capacity (CEC, 15.8 cmolc kg
−1), with calcium as the principal exchangeable cation, and a degree of saturation of exchangeable cations of 70%. Their levels of available phosphorus and potassium (P
2O
5 and K
2O, respectively) are high, indicating intensive use of soil fertilizers, which is, thus, suggestive that farming may be incorporating pollutants into the soils [
44,
45]. Their saturated soil-paste electrical conductivity at 25 °C is low (EC25, 0.11 dS m
−1), indicating that these soils have no salinity problems.
Table 1.
Mean values, standard deviation, and ranges for general descriptive parameters of Caia soils (n = 630).
Table 1.
Mean values, standard deviation, and ranges for general descriptive parameters of Caia soils (n = 630).
| Statistical Parameters | SOM (%) | N (%) | Soil Carbonates (%) | pH | CEC cmolckg−1 | CE25 dS m−1 | P2O5 (mg/100 g) | K2O (mg/100 g) |
|---|
| MINV | 0.2 | 0.03 | 0.1 | 4.5 | 3.8 | 0.01 | 4.0 | 18 |
| AM | 1.5 | 0.10 | 5.5 | 6.9 | 15.8 | 0.11 | 197 | 220 |
| MAXV | 4.4 | 0.31 | 16.4 | 8.9 | 71.5 | 1.00 | 5920 | 3268 |
| STD | 0.6 | 0.04 | 4.2 | 1.1 | 10.2 | 0.11 | 413 | 185 |
| GM | 1.4 | 0.09 | 3.6 | 6.9 | 13.5 | 0.09 | 120 | 186 |
The total concentrations for the heavy metals in these soils based on the 30 representative top soils of the study area (
Table 2) were (mg kg
−1): ranges, Cd <d.l.–0.7; Cr 10.8–89, Cu 9.5–489, Ni 5.2–48.6, Pb 7.7–41.9; and Zn 10.1–65.6.kg
−1. According to these data therefore, the order of the heavy metals’ total content was Cr>Zn>Ni>Pb>Cu>>Cd. In general, in all the soils these levels are low compared with literature values for Mediterranean agricultural soils [
46,
47]. The ZnEqT values (252 ± 135 mg kg
−1) were also lower than Gil
et al. [
12] obtained in Mediterranean greenhouse soils, and the present study’s heavy metal total concentrations do not surpass the RV established by Inácio
et al. [
24] in Portuguese soils or the GBC values of natural soils in the Mediterranean region established by Roca-Pérez
et al. [
25].
Table 2.
Total concentrations (mg kg−1 dry soil) of trace elements in soil samples (n = 30) from Caia area.
Table 2.
Total concentrations (mg kg−1 dry soil) of trace elements in soil samples (n = 30) from Caia area.
| Statistical Parameters | Cd | Cr | Cu | Ni | Pb | Zn | Zn EqT |
|---|
| MINV | <d.l. | 10.8 | 5.4 | 5.2 | 7.7 | 10.1 | 63 |
| AM | 0.6 | 48.4 | 16.7 | 23.6 | 19.1 | 29.6 | 252 |
| MAXV | 0.7 | 89.0 | 45.0 | 48.6 | 41.9 | 65.6 | 506 |
| STD | 0.1 | 25.5 | 9.1 | 13.6 | 8.9 | 15.1 | 135 |
| GM | 0.6 | 41.1 | 14.6 | 19.6 | 17.1 | 25.9 | 214 |
Table 3 presents the mean concentrations of available Cd, Cr, Cu, Pb, Ni, and Zn in the soils, with the corresponding values of the standard deviation, range, and geometric mean.
According to these data, the order of the available content of the metals was Pb > Ni > Cu > Cr > Zn > Cd. The content of the most available heavy metal in this kind of soil, Pb, is known to be essentially anthropogenic [
5,
23].
Table 3.
Available concentrations (mg kg−1 dry soil) of trace elements in soil samples (n = 630) from Caia area with associated statistical parameters.
Table 3.
Available concentrations (mg kg−1 dry soil) of trace elements in soil samples (n = 630) from Caia area with associated statistical parameters.
| Statistical Parameters | Cd | Cr | Cu | Ni | Pb | Zn | Zn EqB |
|---|
| MINV | <d.l. | <d.l. | <d.l. | <d.l. | <d.l. | <d.l. | 0.3 |
| AM | 0.24 | 0.85 | 1.23 | 1.95 | 3.16 | 0.64 | 19.4 |
| MAXV | 0.55 | 3.30 | 10.00 | 6.60 | 13.00 | 5.00 | 130 |
| STD | 0.23 | 0.79 | 1.15 | 1.30 | 2.33 | 0.58 | 14.5 |
| GM | 0.15 | 0.50 | 0.86 | 1.48 | 2.25 | 0.51 | 14.3 |
The availability data for Cr, Cu, Pb, and Zn are lower than or close to those reported by different workers in the literature considering the same extractant (
Table 4), but the data for Pb are perceptibly higher than those reported by Antolin
et al. [
48] and Buccolieri
et al. [
49]. The only work that determines available Cd is Antolin
et al. [
46] and their data are lower than we found in the study area.
Table 4.
Available concentration of Cd, Cr, Cu, Ni, Pb and Zn, extracted with EDTA in different soils (mg kg−1).
Table 4.
Available concentration of Cd, Cr, Cu, Ni, Pb and Zn, extracted with EDTA in different soils (mg kg−1).
| Heavy Metals | In this work | Bucolieri et al., 2010 | Masas et al., 2009 | Gisbert et al., 2006 | Ramos 2006 | Antolin et al., 2005 | Walker et al., 2003 |
|---|
| Cd | 0.24 ± 0.23 | n.d. | n.d. | n.d. | n.d. | 0.012–0.013 | n.d. |
| Cr | 0.85 ± 0.79 | n.d. | 1.5 ± 0.5 | n.d. | n.d. | n.d. | n.d. |
| Cu | 1.23 ± 1.15 | 5.40 ± 5.67 | 2.5 ± 1.2 | 0.9–8.8 | 15.3 ± 4.3 | 1.64–1.19 | 11.3 |
| Ni | 1.95 ±1.30 | 0.41 ± 0.32 | 1.3 ± 0.9 | n.d | n.d. | n.d | n.d. |
| Pb | 3.16 ± 2.33 | 2.09 ± 1.92 | 5.8 ± 3.2 | 22.1–179 | n.d. | 1.34–1.75 | 28.2–32.5 |
| Zn | 0.64 ± 0.58 | 3.67 ± 3.27 | 7.8 ± 9.7 | 10.5–7.7 | 2.2 ± 1.2 | 0.77–2.41 | 15.2–14.4 |
Although the levels of available heavy metals vary greatly among different Mediterranean soils, the order of their concentrations in the present study are similar to those found by other workers, implying that the processes operating are similar. The levels of ZnEqB found are lower than those reported by Ramos-Miras
et al. [
42], in greenhouse soils (44.6 ± 43.5 mg kg
−1), although they use other extracting agent.
This is indicative of the present soils being free of relevant contamination or large scale mobilization of the heavy metals analyzed as might have been caused by farming activities, despite the large amounts of fertilizers (available phosphorous and potassium) detected in them.
3.1. Baseline Concentrations
Soils constitute a complicated and heterogeneous system [
50], so that simple monitoring of their heavy metal concentrations is insufficient guarantee of their environmental quality. Their trace element contents vary widely, so that it is inappropriate to use universal background concentrations as a criterion since the native concentrations of metals in a specific soil may exceed any given listed ranges. It is therefore important to determine the values of the GBC and RV concentrations locally [
8,
18,
42,
51,
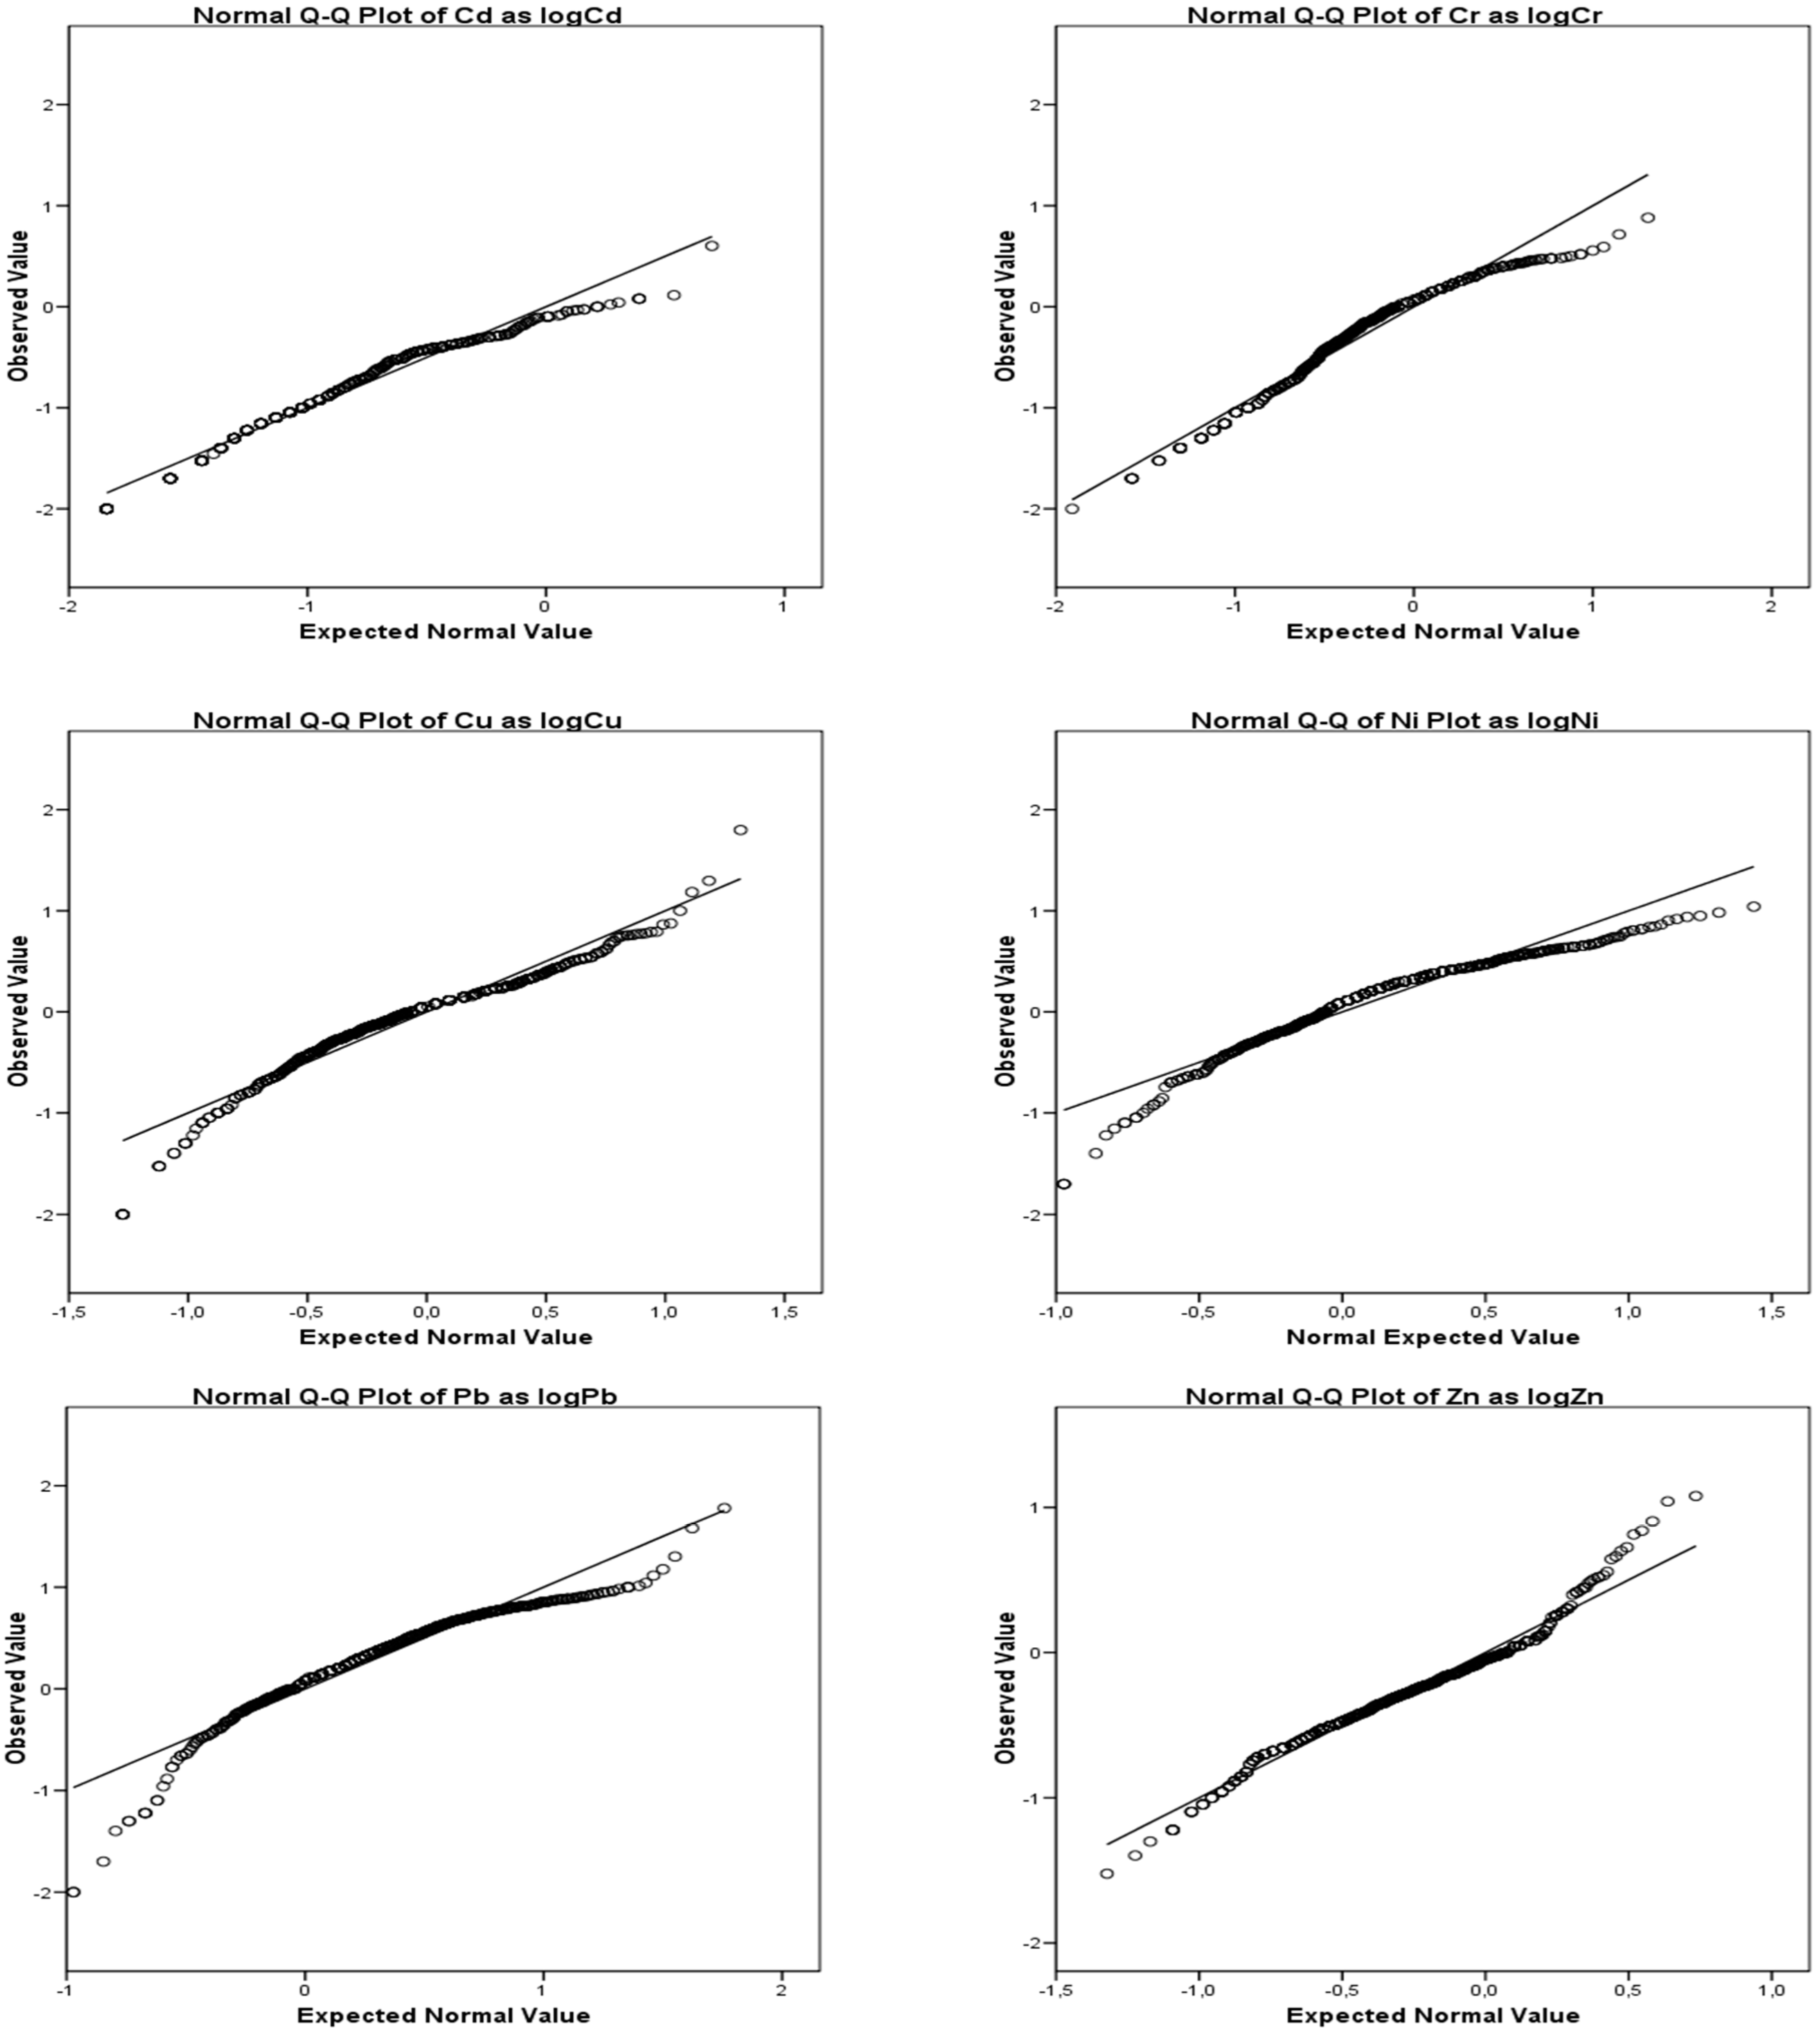
52]. To estimate the GBC values, the “standard threshold method” was applied [
43]. The Q-Q plots are shown in
Figure 2. Low values deviate from linearity because they were beneath the detection limit, and were hence assigned the detection limit value as proposed by Tack
et al. [
41]. The threshold was chosen as the point at which the slope of the Q-Q plot changes. Values beneath the threshold point denote the GBC (0.91, 2.52, 6.33, 7,32, 4.60, 2.53 threshold point of Cd, Cr, Cu, Ni, Pb and Zn, respectively). The resulting GBC ranges were (in mg kg
−1): 0.04 to 0.90, 0.70 to 2.50, 0.10 to 6.30, 0.30 to 7.30, 0.29 to 4.50, and 0.18 to 2.50 for Cd, Cr, Cu, Ni, Pb, and Zn, respectively. The BL estimated from non-contaminated soils were (in mg kg
−1): 0.23, 0.72, 1.22, 2.00, 1.96, and 0.57 for Cd, Cr, Cu, Ni, Pb and Zn, respectively. The method of threshold points allows the differentiation of homogeneous populations using statistical criteria, assuming that populations with higher contents of heavy metals are subject to contamination processes.
Figure 2.
Normal probability plot of bioavailable Cd, Cr, Cu, Pb, Ni and Zn contents as logconcentration.
Figure 2.
Normal probability plot of bioavailable Cd, Cr, Cu, Pb, Ni and Zn contents as logconcentration.
There are only two literature studies on the GBC of available heavy metals in soils—Tarvainen and Kallio [
32] in natural soils in Finland, and Ramos-Miras
et al. [
42] in agricultural soils. They both used EDTA for extraction, however, so that it is difficult to compare their results with the present findings, even more so given that they did not analyze the same heavy metals. Nevertheless, the present results lie within the limits proposed by those authors.
The upper limit of the GBC could be used as the RV against which to assess soil contamination [
31] find that this method is far more effective than others that have been put forward in the specialized literature. Using therefore the upper GBC values as the RVs of the available heavy metals (Cd 0.9; Cr 2.5; Cu 6.3; Ni 7.9; Pb 4.5; and Zn 2.50; all in mg kg
−1) with which to determine whether or not a soil is contaminated, we found that 2% for Cd, 6% for Cr, 1% for Cu, 4.5% for Pb, 5% for Ni, and 4% for Zn of the samples were slightly contaminated. In particular, only 6% of the sample soils had a higher available content of heavy metals than the RV limit (due mainly to Cr, Cu, Ni, and Pb). The difference of BL and GBC could be because of diffuse pollution. In sum, these results point to a minimal extension of soil contamination by available heavy metals. Using the 90% percentile value as reference to determine where a soil could be contaminated like Tack
et al. [
41] (
Table 5). All of the heavy metals values for 90% percentile were lower than the RV proposed for these soils in this work, except for Pb, who value of 90% is higher than RV. This fact confirms that the contamination for available heavy metals was minimal except for Pb, who is one of the most mobile [
42,
53].
Table 5.
Estimated of baseline concentrations of Available heavy metals (mg kg−1 dry soil) based on percentile values of the data considered to be baseline values.
Table 5.
Estimated of baseline concentrations of Available heavy metals (mg kg−1 dry soil) based on percentile values of the data considered to be baseline values.
| Percentile | Cd | Cr | Cu | Pb | Ni | Zn |
|---|
| 5% | 0.01 | 0.05 | 0.14 | 0.24 | 0.35 | 0.14 |
| 25% | 0.07 | 0.18 | 0.53 | 1.30 | 0.83 | 0.32 |
| 50% | 0.16 | 0.55 | 1.00 | 2.50 | 1.70 | 0.50 |
| 75% | 0.37 | 1.10 | 1.60 | 4.60 | 2.70 | 0.72 |
| 90% | 0.50 | 1.70 | 2.37 | 6.10 | 3.56 | 1.00 |
| 95% | 0.70 | 2.00 | 3.30 | 6.80 | 3.94 | 1.20 |
| 99% | 0.92 | 2.30 | 5.70 | 7.70 | 4.40 | 1.90 |
3.2. Correlation Analysis
A soil’s physicochemical parameters can greatly influence metal assimilation by plant roots, affecting both root growth and the mobility of the contaminants. Understanding the relationship between the elements present and those parameters could help clarify the behavior of the elements in the soil. We therefore analyzed the potential correlations between the available heavy metal concentrations and soil pH, SOM, soil carbonates, P
2O
5, K
2O, EC25, and ZnEqB for the 630 soil samples, after confirm the data normality. The results are presented in
Table 6. Most of the correlations were statistically significant (α = 0.01 and α = 0.05). The correlations of especial interest were SOM-available heavy metals, pH–available heavy metals, available phosphorous and potassium-available heavy metals, and those between the available heavy metal themselves.
The SOM values were positively correlated with the available heavy metal contents, reflecting the affinity of these metals for the organic matter in the soil [
54,
55,
56,
57]. All the available heavy metal concentrations were positively correlated with pH. This last result was unexpected because most of the literature consulted describes an increase in pH as leading to a decrease in the available heavy metal content [
58,
59]. This might be because increased pH’s could thus favor the release of these metals by mobilizing the soil components in which they are retained. Although heavy metals are more weakly bound to soil particles in contaminated soils than in purely lithogenic ones, and are hence more readily mobilized [
60,
61,
62].
Table 6.
Spearman Correlation coefficients of Available heavy metal concentrations with soil properties in Caia agricultural soils (n = 630).
Table 6.
Spearman Correlation coefficients of Available heavy metal concentrations with soil properties in Caia agricultural soils (n = 630).
| Parameters | pH | SOM | P2O5 | K2O | Soil Carbonates | EC25 | Cd | Cr | Cu | Ni | Pb | Zn |
|---|
| pH | 1 | | | | | | | | | | | |
| SOM | 0.357 (#) | 1 | | | | | | | | | | |
| P2O5 | 0.391 (#) | 0.178 (#) | 1 | | | | | | | | | |
| K2O | 0.429 (#) | 0.346 (#) | 0.428 (#) | 1 | | | | | | | | |
| Soil Carbonates | 0.510 (#) | 0.313 (#) | −0.281 (#) | n.s. | 1 | | | | | | | |
| EC25 | 0.283 (#) | 0.208 (#) | 0.257 (#) | 0.344 (#) | | 1 | | | | | | |
| Cd | 0.507 (#) | 0.294 (#) | 0.183 (#) | 0.194 (#) | 0.587 (#) | 0.150 (#) | 1 | | | | | |
| Cr | 0.480 (#) | 0.251 (#) | 0.143 (#) | 0.265 (#) | 0.486 (#) | 0.132 (#) | 0.536 (#) | 1 | | | | |
| Cu | 0.583 (#) | 0.369 (#) | 0.264 (#) | 0.330 (#) | n.s. | 0.121 (#) | 0.182 (#) | 0.224 (#) | 1 | | | |
| Ni | 0.554 (#) | 0.289 (#) | 0.190 (#) | 0.247 (#) | 0.299 (#) | n.s. | 0.393 (#) | 0.413 (#) | 0.535 (#) | 1 | | |
| Pb | 0.616 (#) | 0.359 (#) | 0.311 (#) | 0.409 (#) | 0.515 (#) | 0.217 (#) | 0.544 (#) | 0.443 (#) | 0.416 (#) | 0.398 (#) | 1 | |
| Zn | 0.354 (#) | 0.415 (#) | 0.297 (#) | 0.245 (#) | 0.134 (*) | 0.182 (#) | 0.307 (#) | 0.204 (#) | 0.340 (#) | 0.213 (#) | 0.296 (#) | 1 |
| Zn EqB | 0.610 (#) | 0.351 (#) | 0.232 (#) | 0.297 (#) | 0.281 (#) | n.s. | 0.407 (#) | 0.412 (#) | 0.663 (#) | 0.971 (#) | 0.451 (#) | 0.294 (#) |
The Cd, Cr, Pb, and Ni levels were correlated with soil carbonates, suggesting their presence in these soils in a form linked to carbonates [
58,
63]. The available phosphorus and potassium content was positively correlated with the available heavy metal contents, possibly reflecting the presence of heavy metal contaminants in fertilizers [
44,
45,
64]. The available phosphorus and potassium content was also positively correlated with the ZnEqB contamination index, which would be consistent with the aforementioned result. There were also significant correlations between the available heavy metals and EC25. Any increase in ionic strength caused by salts in a soil promotes the release of heavy metals, especially Cd and Pb, due to competition for sorption sites by cations and metal-complexation anions [
47,
65,
66].
Finally, there were significant positive correlations between the heavy metals themselves. This is suggestive of a similar, if not identical, origin of the heavy metals, and indicating that anthropic activities could enhancing the mobility of these elements [
18,
42]. There was further support for this interpretation in the strong positive correlations between the ZnEqB contamination index and the available Cd, Cr, Cu, Pb, Ni, and Zn contents.
4. Conclusions
The concentrations of total and available heavy metals in these agricultural soils, which are typical of the Mediterranean region, were generally lower than or close to those reported in the literature for other agricultural areas. The GBCs of the available heavy metals were: 0.04 to 0.90 mg kg−1, 0.70 to 2.50 mg kg−1, 0.10 to 6.30 mg kg−1, 0.30 to 7.90 mg kg−1, 0.29 to 4.50 mg kg−1, and 0.18 to 2.50 mg kg−1, for Cd, Cr, Cu, Ni, Pb, and Zn, respectively. The threshold method is a good way to establish GBC values in an initially homogeneous population of soil. Only a small percentage of the 630 soils sampled had high available levels of heavy metals, so that there is no evidence for any extensive heavy metal contamination of these soils. All the available heavy metal concentrations were strongly correlated with pH and SOM. Even though the concentrations lay within normal ranges for most of the soil samples, the multivariate analysis indicated that the available Cd, Cr, Pb, Ni, Cu, and Zn contents were essentially driven by anthropic activities. This indication was supported by their strong correlations with the ZnEqB index.
Given the potential risk to human health represented by available heavy metals, especial effort is called for to determine both the locations of contaminated soils and the sources of their contamination in order to be able to halt the contamination process and avoid larger areas being affected. We must emphasize that the present results are preliminary, and the findings will be more extensively studied in future work.

 ,
, 
