1. Introduction
Chinese cities have been experiencing drastic urban land expansion since the period of economic reform that began in 1978, in turn causing serious social justice, equitable development and environmental protection issues [
1,
2]. Shanghai, China’s leading global city and the “dragon’s head” of the Yangtze River Delta, has been undergoing significant urban growth since 1990, when the central government established the Pudong New Area. Between 1993 and 2009, the city’s built-up area increased from 300 km
2 to 886 km
2, with a 6.5% annual growth rate [
3]. The land development of Shanghai is the result of interactions between market and state, and global and local forces [
4,
5,
6,
7,
8]. Given its massive urban population and land size, as well as its sensitivity to global change, a better understanding of urbanization and land expansion in Shanghai is critical to the development and sustainability of both Shanghai and China.
The existing studies of the process and mechanisms of urban growth in China are confined in the two perspectives, the institutional perspective and the neoclassical perspective, and both of them have weaknesses [
2]. The institutional perspective has argued that urban growth in Chinese cities is shaped by the state and the market [
2,
9]. The scholars, from this perspective, have investigated the internal land use change of development zones (DZs) [
10,
11,
12]. Other scholars from the neoclassical perspective have demonstrated that urban growth in China is influenced by accessibility and neighboring land use types [
6,
13,
14]. Integration of these perspectives will provide a fuller understanding of urban growth in China. Spatial patterns of land expansion in urban China have also garnered much attention, especially from geographers [
15,
16,
17,
18]. Based on spatial analysis methods in a geographic information system (GIS) environment, they have identified three major patterns of urban land expansion in China: infilling, expansion, and leapfrog [
19,
20,
21]. However, underlying forces shaping these patterns and their linkages to the powers of state and market are largely unexplored.
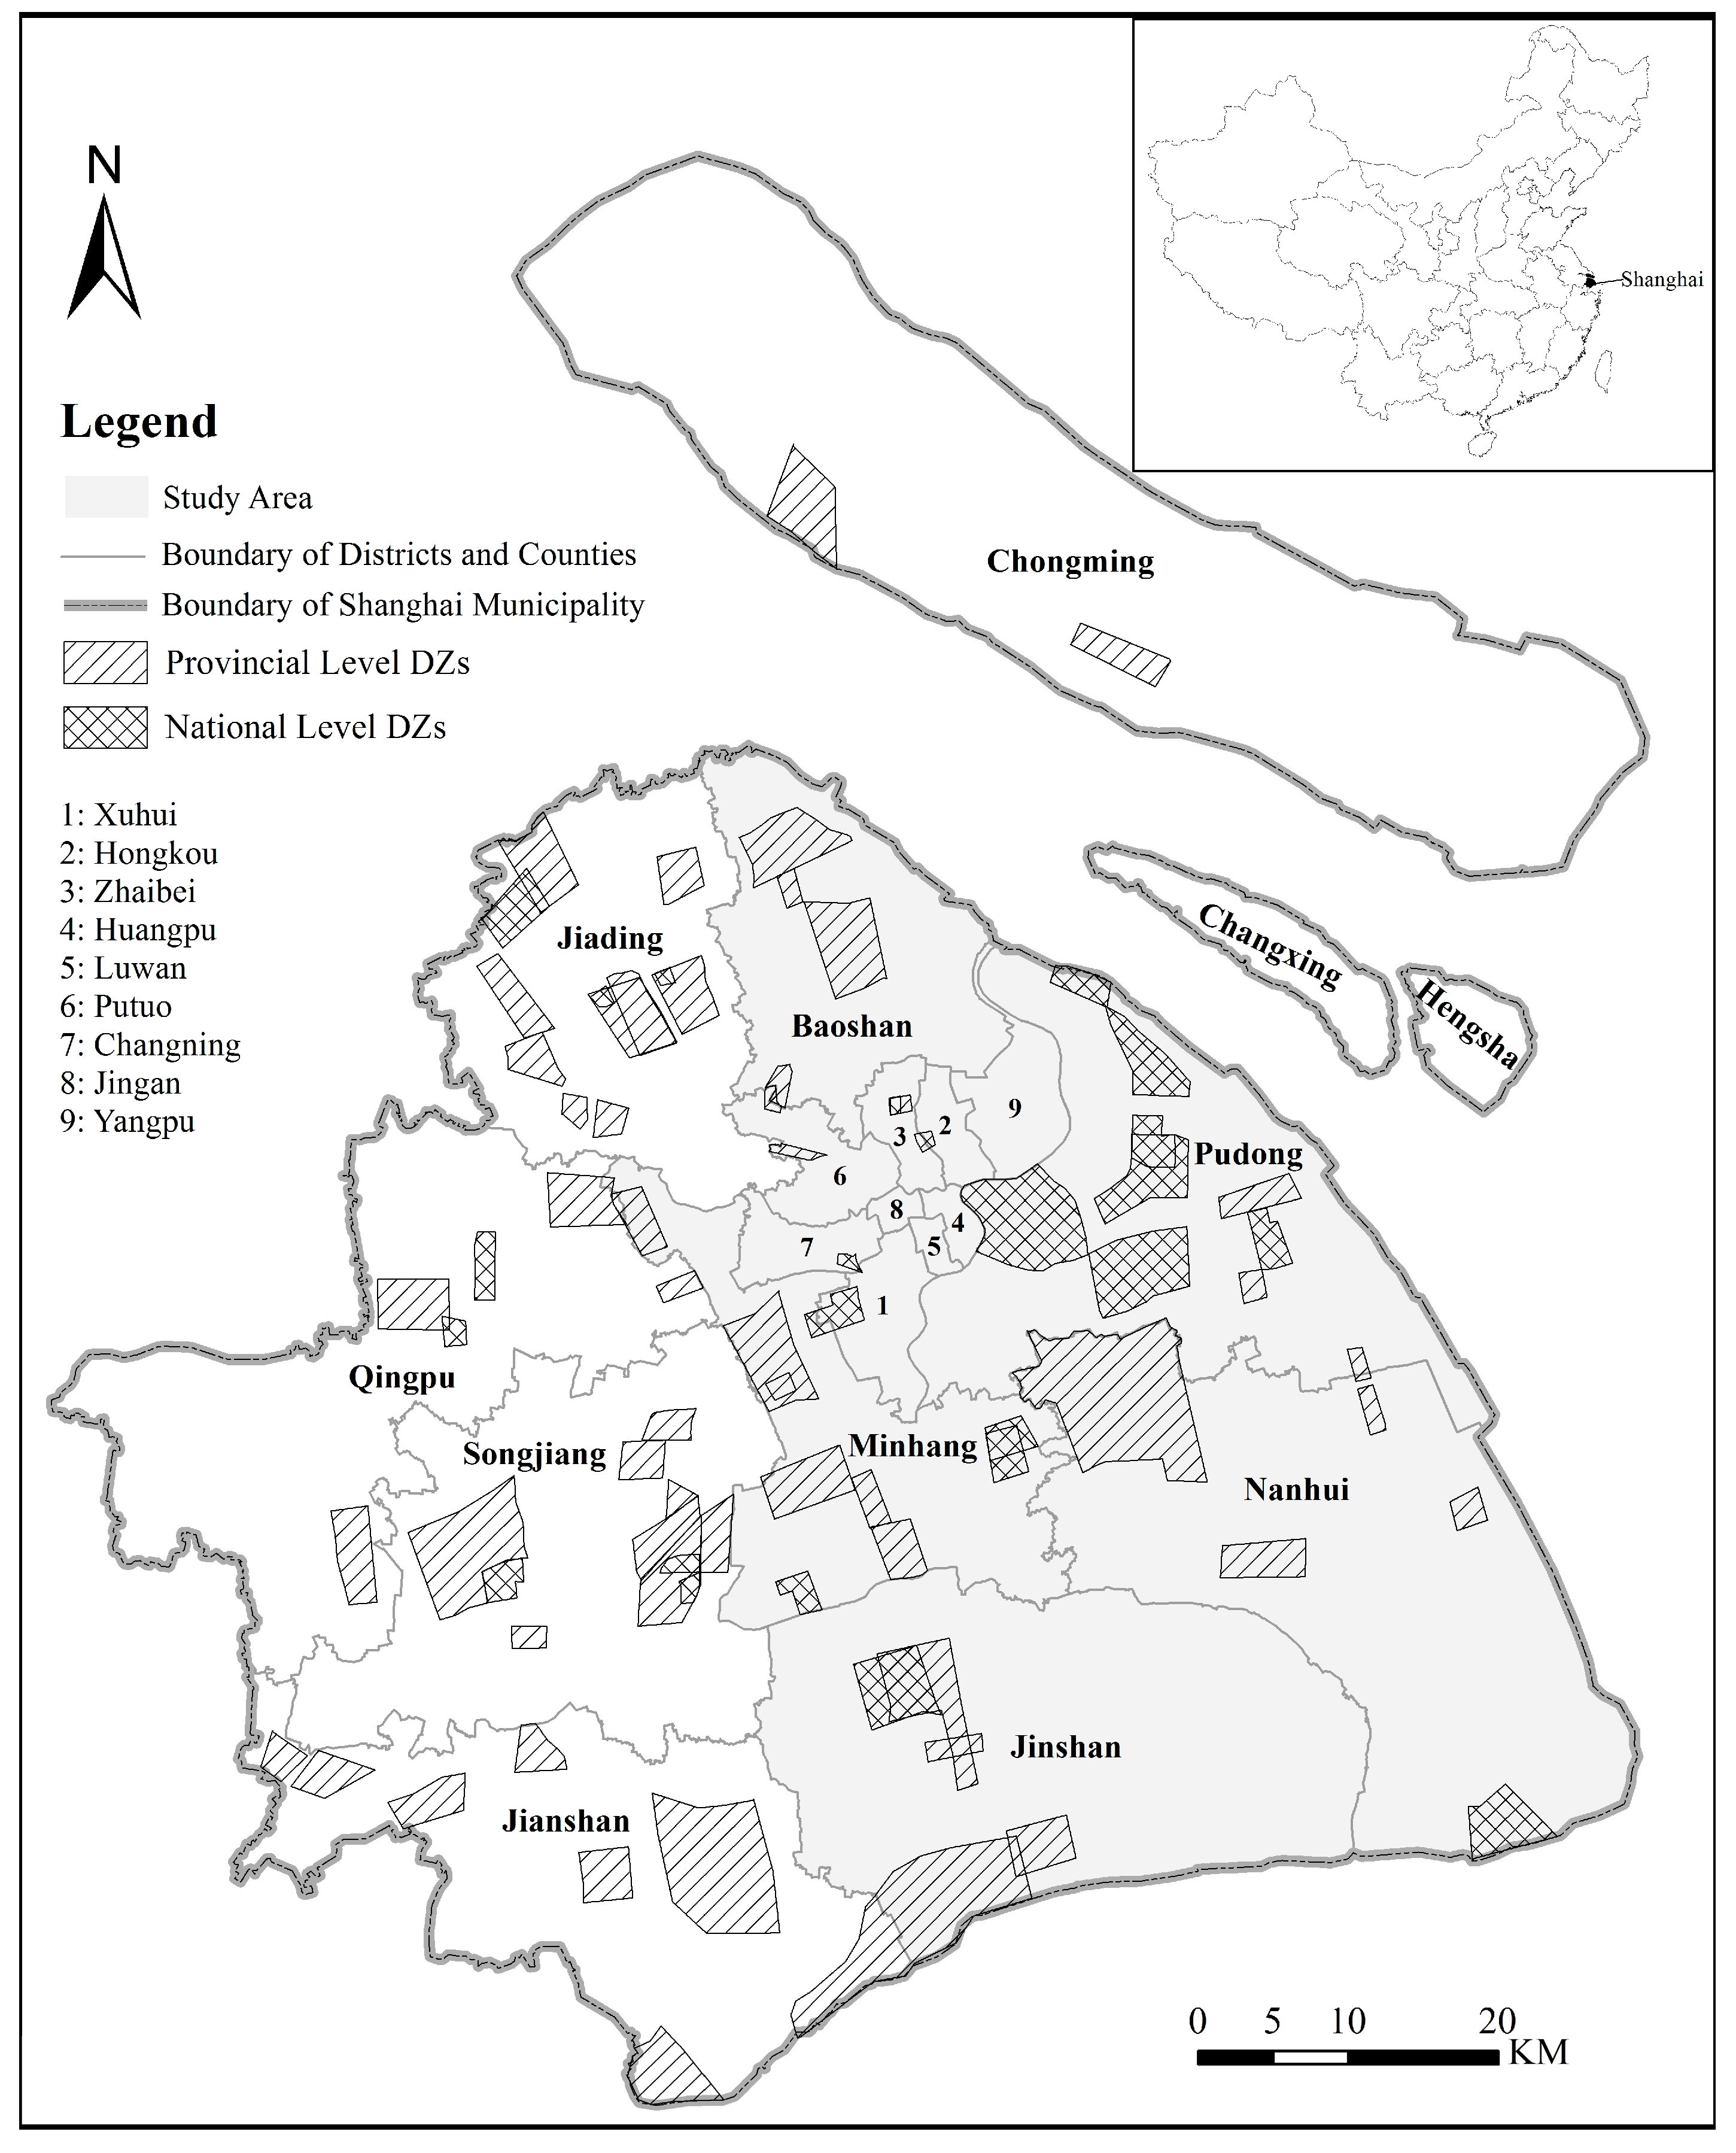
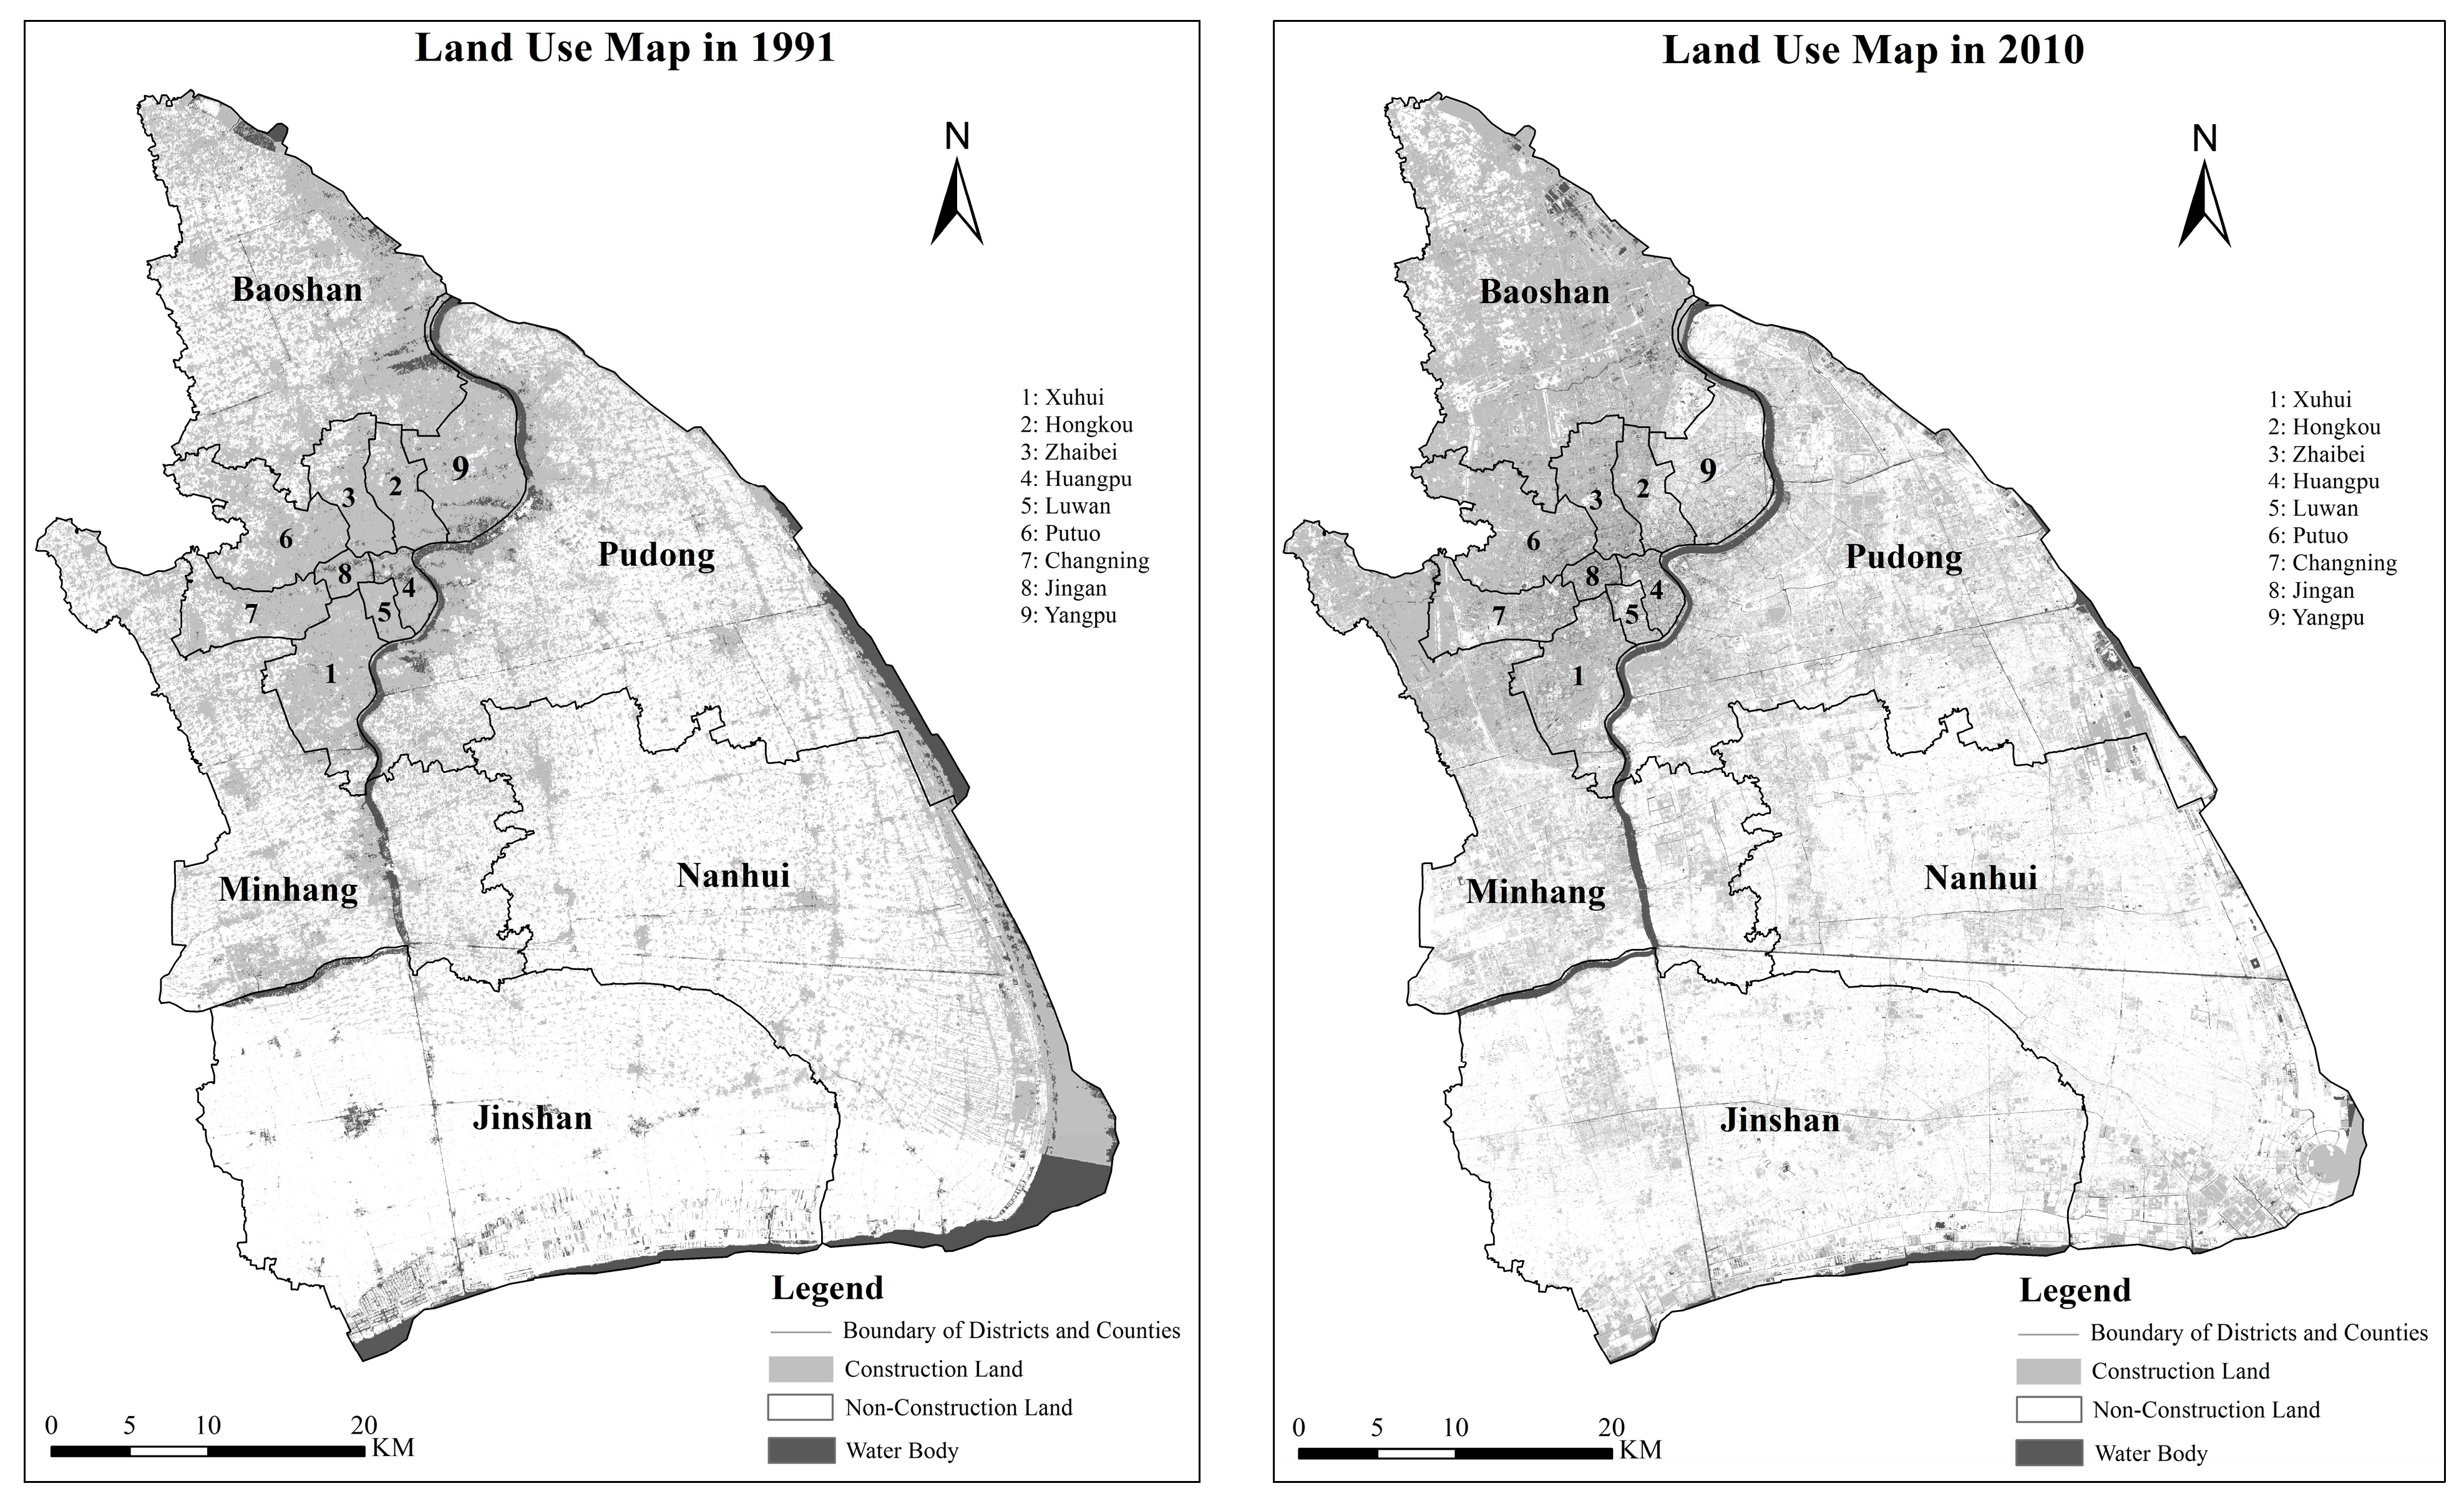
In this study, we assessed the extent of urban land expansion in Shanghai, including the Pudong New Area and the development zones, from 1991 to 2010. In particular, by applying a patch analysis method in GIS on the land use change images, we identified the spatial patterns of urban land expansion in Shanghai. We also applied global logistics regression, logistic spatial regime regression and geographically weighted logistic regression (GWLR) to investigate the interaction between the development of urban land and accessibility, state policy/planning and neighborhood land use to better understand the mechanisms of urban growth, and to quantify the interactions between state and market powers.
2. Literature Review
Studies on urban growth in China with the neoclassical perspective apply statistical, remote sensing and GIS techniques to investigate the relationships between urban growth, economic development, accessibility, and the neighborhood effects [
6,
13,
16,
22,
23,
24,
25]. They find that economic growth [
26], development of transportation systems [
27], increase of tertiary industry and average salary [
28] and rural-urban migration [
29] are important driving forces of urban growth. While this line of research tends to emphasize accessibility and physical capital, they have also attempted to incorporate institutional factors into the analysis [
2].
Scholars using the institutional perspective have examined the process of economic transition in China and its influence on local governance, the transfer of land use right, conversion of rural land use, and contradictions between different types of planning [
30,
31,
32]. Since the 1990s, there has been an intense debate about whether the market or the state is more responsible for urban growth in China, because economic transformation is a gradual process in which the market system and the planning system coexist [
4,
5]. Some scholars argue that urban growth in Chinese cities is impacted by the triple transition of globalization, marketization, and decentralization [
2,
32]. They also analyze the process of administrative change and explain how these changes lead to urban growth [
33,
34,
35]. Agents of planning and regulation implementation, local governance, as well as different components of central and local governments, have aroused extensive discussion [
36,
37,
38].
The development zone fever is also an important factor contributing to urban growth in China [
10,
12,
39]. Because DZs are established to attract foreign investment, foreign investment in its turn has become one of the most significant indicators influencing the spatial and structural transformation of urban China [
4,
5,
11]. Some scholars have examined the relationship between land administration systems and the development of DZs [
10], and others have focused on urban land use change inside DZs [
12].
The decentralization of urban governance transfers control of urban development from the central government to local government [
32]. Since the 1990s, metropolitan and district governments have gradually gained more administrative power in economic development, urban planning, and land management. Since 1992, the right of land use planning has been given to district and county governments, who are now responsible for preparing detailed development plans. However, this division of power between the municipal and district governments differs from place to place, causing dissimilarities in patterns and dynamics of urban growth across cities [
4,
32]. Scholars point out that state planning efforts, such as establishing DZs, play a significant role in the urban growth of Beijing [
40], while others find that enterprises and foreign investments have become major driving forces of urban expansion in cities of the Pearl River Delta [
27,
38,
41,
42].
Different processes of urban expansion lead to dissimilar spatial patterns of urban growth. Empirical studies (e.g., [
15,
18,
43,
44,
45]) find that diverse patterns across cities are due to dissimilar geographic and economic conditions. For example, in Chengdu, geographers find that the major pattern before 2000 is expansion, but after 2000, infilling and leapfrog become the major patterns of urban growth [
16]. Xu
et al. [
17] have observed that this major pattern in Nanjing has transformed the city since 1988 from expansion to infilling and leapfrogging. The sprawl of Beijing is based on urban traffic loops of concentric circles [
43], while Hangzhou and Wuhan have shown the typical polycentric expansion patterns [
18,
44]. We could conclude that there is not one simple pattern that works to describe development and expansion in all Chinese cities. Therefore, the analysis of urban growth patterns in Shanghai expands the body of literature, and demonstrates that patterns of urban growth indeed vary across Chinese cities.
To summarize, five areas need further investigation. First, despite the intense debate over whether the state or the market has greater influence on urban expansion in China, few studies have addressed this issue quantitatively. Second, there is a literature gap describing how urban growth drivers in Chinese cities vary across different institutional, geographic and economic conditions. Third, most studies are weak regarding underlying dynamics which shape these different spatial patterns of urban land expansion in China. Fourth, there is a dearth of literature concentrating on the site-decision of the DZs and the impact of DZs on urban growth in China. Finally, few studies specifically address the patterns and dynamics of Shanghai’s expansion, and we still do not fully understand its urban growth patterns and driving forces.
5. Determinants of Urban Growth in Shanghai
To avoid the multi-collearity problem of the afterwards regression analyses, we tested the variance inflation factor (VIF) of all explanatory variables, and found that all the results of VIF are smaller than 2, thus indicating that no pair of variables has a significant linear correlation.
Table 5 represents the results of the global logistic regression and GWLR. The receiver-operating characteristic (ROC) results are larger than 0.8 for all the models, which are located in the convinced interval (
Table 5).
First, from the state power perspective (
Table 5), we found that the distance to railway (DRL) has the strongest negative effect on land conversion probability, which is different from the result of Nanjing and Wuhan [
13,
48]. The distance to highways (DHW) and the distance to subway stations (DSWS) are insignificant, which can be interpreted as meaning that our study area is not a traditional transportation hub. The coefficients of distances to airports and ports (DAA and DPP) are also significantly positive, which represents the urban growth that occurs in the area further distant from airports and ports, in order to avoid pollutants such as noise.
Table 5.
Global logistic regression and GWLR result.
Table 5.
Global logistic regression and GWLR result.
| Area | Global Logistic | GWLR |
|---|
| Variables | Coefficient | Mean Coefficient | Positive |
|---|
| Market |
| DLW | −0.174 *** | −0.219 | 22.17% |
| DEA | 0.399 | 2.984 | 62.96% |
| DEC | −3.605 ** | −0.905 | 25.43% |
| DEW | 1.069 | 3.391 | 67.29% |
| Urban growth pattern |
| DC | −0.096 *** | −0.076 | 0.00% |
| DSC | 0.015 * | 0.012 | 86.47% |
| DHPR | 0.092 *** | 0.092 | 100.00% |
| State |
| VDZ | 0.922 *** | 0.903 | Global Variable |
| VP | 0.669 ** | 0.661 | Global Variable |
| PD | 0.234 ** | 0.304 | Global Variable |
| DHW | 0.014 | 0.020 | 62.93% |
| DRL | −0.042 ** | −0.065 | 0.00% |
| DAA | 0.022 ** | 0.013 | 72.06% |
| DPP | 0.014 ** | 0.016 | 90.04% |
| DSWS | −0.003 | −0.021 | 31.28% |
| Assessment |
| Constant | 1.354 | −0.993 | 62.81% |
| AIC | 3859.4 | AIC | 3754.4 |
| Observations | 3504 | Observations | 3504 |
| ROC | 0.802 | ROC | 0.834 |
| Pseudo R2 | 0.26 | | |
The coefficients of DZs, planning areas and Pudong (VDZ, VP and PD) should be highlighted, because these variables are the most significant indicators in demonstrating how state power influences the urban development in Shanghai. The coefficient of VDZ is 0.922, which is very significantly high as a dummy variable in logistic regression. The parameter estimate of VP is also significantly high. The coefficient of PD is lower than VDZ and VP, but it is still very high. The results of these variables prove that our hypothesis, that state policy and planning, are the major driving forces of urban growth in Shanghai, which also matches with the conclusion of Wu [
4], pointing to the strong government regulation in Shanghai.
Second, from the market power perspective, distance to local artery roads (DLW) is the most significant variable, which is similar to the findings of previous studies [
13,
33]. The rise of proximity to city streets in land development is important in many large cities of China, and the coefficients of density of agriculture land (DEA) and water (DEW) are both positive but not significant. These results imply that the potentiality and restriction are not important in Shanghai’s development, because the development of DZs is decided by the local and central government, and attracts a huge amount of investment, which devaluates the expense of the land conversion. Moreover, because Shanghai already had a stable large scale of urban core in 1991, the land use expansion in this urban core should be relatively rare. In the study of Nanjing and Wuhan, density of agriculture land is significantly positive, thus representing the potentiality of urban growth. Water area is one of the significant restrictions of urban growth.
Third, the local government of Shanghai proposed polycentric development as one of the major strategies of urban growth in its urban master plan in 1999 [
46]. However, our results reveal that expansion from just one city center is the principal spatial pattern of urban growth in Shanghai. For instance, among the urban growth pattern variables, distance to major city center (DC) has the strongest significant negative impact on the urban development, while the distance to sub-administration centers (DSC) has positive influence on the urban growth in this study area. These two variables imply that the pattern of urban development of this study area is individual-core, which matches the previous institutional studies [
4,
5]. The parameter of distance to the Huangpu River (DHPR) is significantly positive, which rejects the idea that Shanghai’s development is along the Huangpu River.
We employed the GWLR to find out how spatial variations affect urban growth determinants. The results prove that all parameters vary across the study area with generally regular spatial patterns. Among the variables of the market, the most significant impact on urban growth is distance to roads, with 22.17 positive percentages. In the different areas of our study, the neighborhood land use also performs the different impacts on the urban growth, because the positive and negative percentages are almost equal in this category, which implies that there are huge spatial variations in these variables’ influence on urban growth in our study area.
Moreover, among the variables of state power, DRL has the lowest positive percentage of coefficients (0%), which is consistent with the result of global logistic regression. Other variables in the state category, such as DAA, DHW, and DPP, have different impacts on urban growth based on the spatial differences. Due to the introduction of the GWLR in this study, there are some decreases in coefficients of VDZ, VP and PD. Furthermore, there is not a fixed pattern of influences on the distances to sub-administration centers and Huangpu River. We could suggest that urban growth in Shanghai is relative to the distance to the major city center, in which 86.47% of coefficients are negative. Overall, regression models effectively explain the determinants of probability of Shanghai from a global view, and prove that urban land expansion is driven by both the state and market forces.
6. Determinants Change in Development Zones? Evidence from Spatial Regime and GWLR
We employed spatial regime regression and GWLR to investigate the different dynamics across the DZs (
Table 6). For the sample points inside DZs, we found that they are more sensitive to the variables of state infrastructure powers, such as distance to subway stations, highways, railways, ports and airports, which match the infrastructure requirements of establishing a DZ (
Table 6). The urban growth pattern variables indicate that the preferences of location choices of DZs are concentrated in the suburb, which is far away from the major city center and close to the sub-administration centers. However, the urban growths in DZs are less sensitive to the variables of market power, in which only the DEC is marginally positive.
Table 6.
Results of Spatial Regime and GWLR for DZs.
Table 6.
Results of Spatial Regime and GWLR for DZs.
| Model | Spatial Regime | GWLR |
|---|
| Categories | In | Out | In | Out |
|---|
| Variables | Coefficient | Coefficient | Mean | Positive | Mean | Positive |
|---|
| Market |
| DLW | 0.168 | −0.215 *** | 0.087 | 95.82% | −0.292 | 4.76% |
| DEA | 1.411 | 0.518 | 8.807 | 94.18% | 1.607 | 55.56% |
| DEC | 2.87 * | −3.344 ** | 3.901 | 63.58% | −2.043 | 16.40% |
| DEW | 0.355 | 1.385 | 7.983 | 87.46% | 2.305 | 62.50% |
| Urban growth pattern |
| DC | 0.008 * | −0.099 *** | −0.035 | 0.00% | −0.086 | 0.00% |
| DSC | −0.009 | 0.014 * | 0.011 | 82.54% | 0.013 | 87.37% |
| DHPR | 0.011 | 0.079 *** | 0.074 | 100.00% | 0.096 | 100.00% |
| State |
| DHW | −0.003 * | 0.043 *** | −0.002 | 37.01% | 0.0252 | 69.38% |
| DRL | −0.071 *** | −0.036 *** | −0.079 | 0.00% | −0.062 | 0.00% |
| DAA | −0.009 * | 0.009 | 0.008 | 77.76% | 0.015 | 70.72% |
| DPP | −0.016 * | 0.006 | 0.010 | 78.66% | 0.018 | 92.80% |
| DSWS | −0.079 ** | 0.015 | −0.058 | 0.00% | −0.012 | 38.66% |
| Constant | 1.871 | −6.481 | 30.60% | 0.306 | 70.41% |
| AIC | 3866.8 | 3754.4 |
For the sample points outside of the DZs, we found that there is an apparent dissimilarity from the points inside of the DZs. The urban growth outside of the DZs is determined by the market powers. In both results of spatial regime and GWLR, we found that the DLW has a significantly negative influence on the urban land expansion in Shanghai. The variables DEA and DEC, which represent the cost of land conversion, are more consistent with the results of Nanjing and Dongguan [
13,
38]. This category of land development is more sensitive for the distance of city center. However, in the variables representing state power, only the coefficient of DRL is significantly negative and the DHW has a positive influence, which is opposite of the result from points inside of the DZs.
Therefore, it is important to point out that the dynamics of urban growth vary across DZs. The urban expansion outside the DZs is influenced more significantly by market variables, while the urban development inside of DZs is more likely to be controlled by the state variables.
Based on the parameter results for all the sample points, we developed three parameter surfaces to reveal the spatial variations of urban growth patterns in Shanghai. The method we employed is the inverse distance weighted (IDW) interpolation algorithm. IDW assumes that the surface is being driven by the local variation, which can be measured by the neighbor values [
13], and hence is an applicable approach in this research.
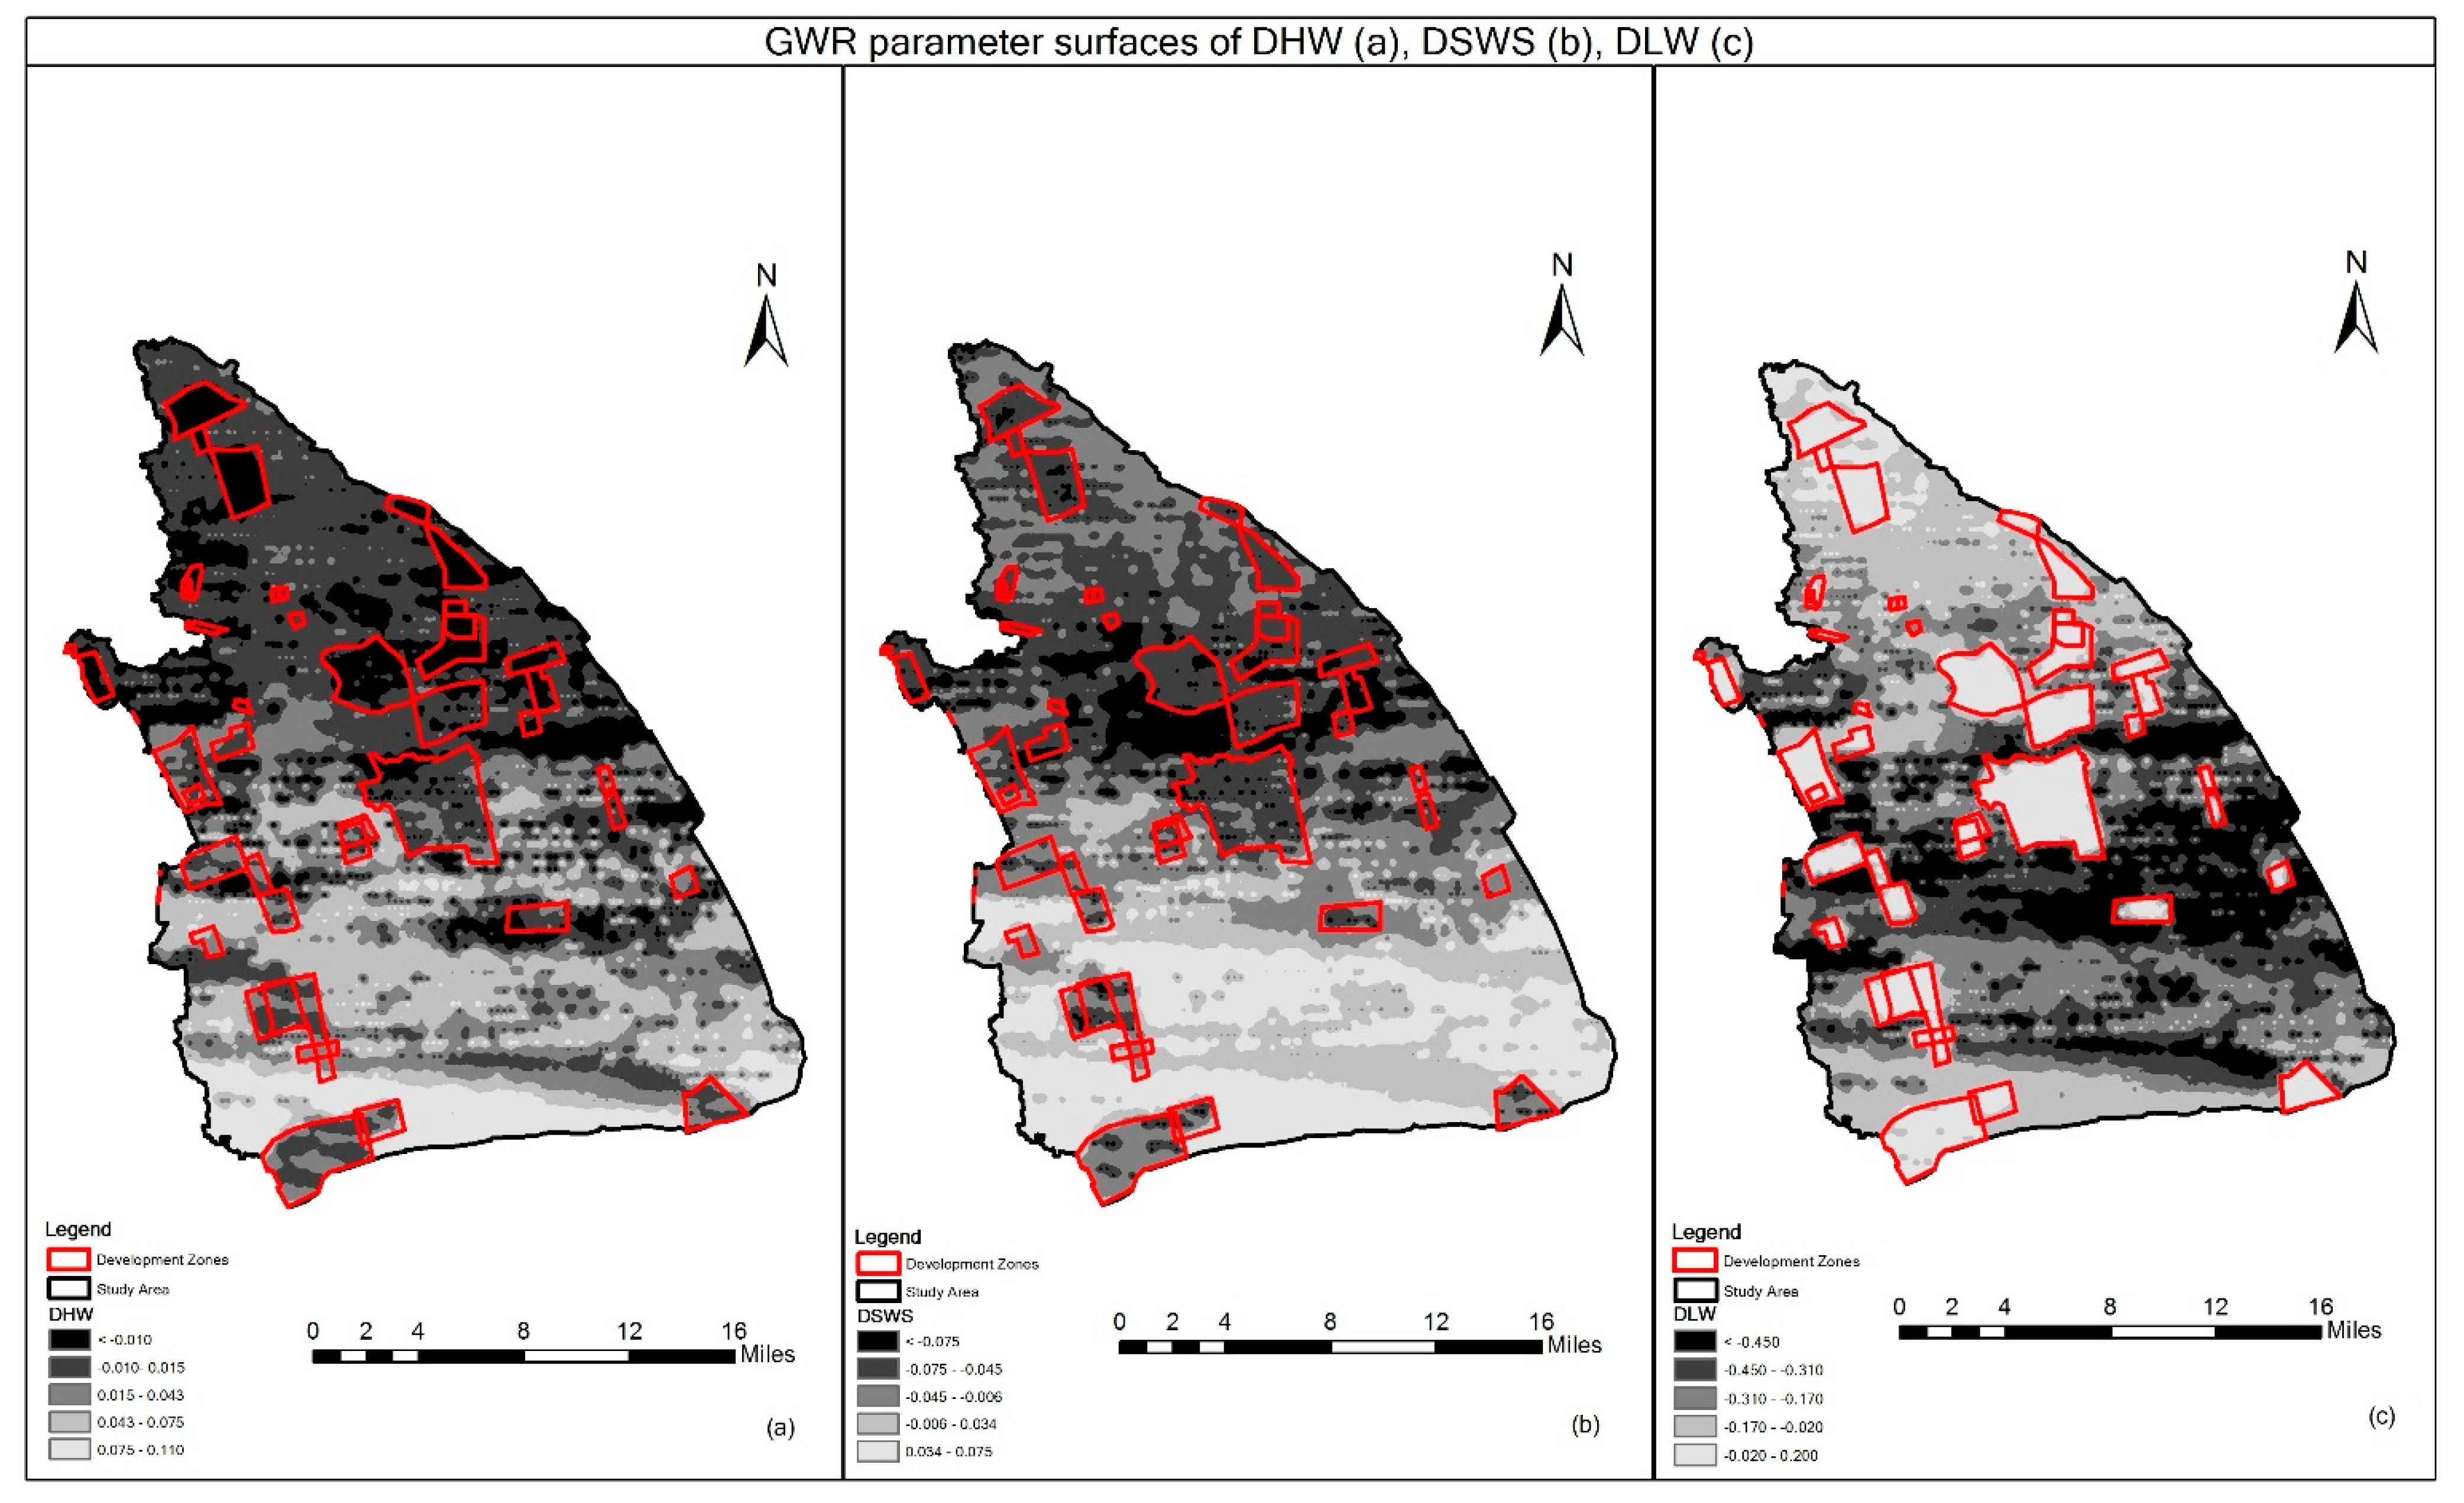
Figure 5 presents the parameter surface of DHW, DSWS and DLW with 100 m
2 cell size.
From
Figure 5, one can see that DHW and DSWS have more negative effects on the land development in the development zones than the outside area. On the other hand, DLW has a more negative influence on the land development outside of the development zones, which is opposite to the DHW and DSWS. As DLW represents the market power, and the DHW and DSWS represent the state power,
Figure 5 describes the spatial distribution of the influences from these two forces on urban growth. It is clear that the influences of state power concentrate in the DZs, while the influences from market decision are primarily located outside of the DZs.
Figure 5.
GWLR Parameter Surfaces of DHW, DSWS and DLW.
Figure 5.
GWLR Parameter Surfaces of DHW, DSWS and DLW.
7. Conclusions
As China modernizes and urbanizes, spatial patterns and determinants of urban growth in large cities have become a focus of research on land use change. China’s urban growth is influenced by the economic transition in China, and some scholars study mechanisms of urban expansion from an institutional perspective, and point out that state and market are the primary driving forces [
4,
5,
53]. Moreover, since the 1990s, supply-driven land development has been a major feature of Chinese cities [
54], which introduced spontaneous unregulated land conversion. Although the control of land has been decentralized to district governments, land leasing in Shanghai is still under strict control of the municipal government. Thus, urban expansion in Shanghai is being driven by local planning and state policy, such as the development of DZs. However, there are few quantitative results to support these findings and more rigorous analyses are needed to quantify the mechanisms. Conversely, other scholars have attempted to analyze urban growth in China based on physical components, such as accessibility and neighborhood land use conditions, and they tend to deemphasize explaining urban growth patterns from an institutional perspective.
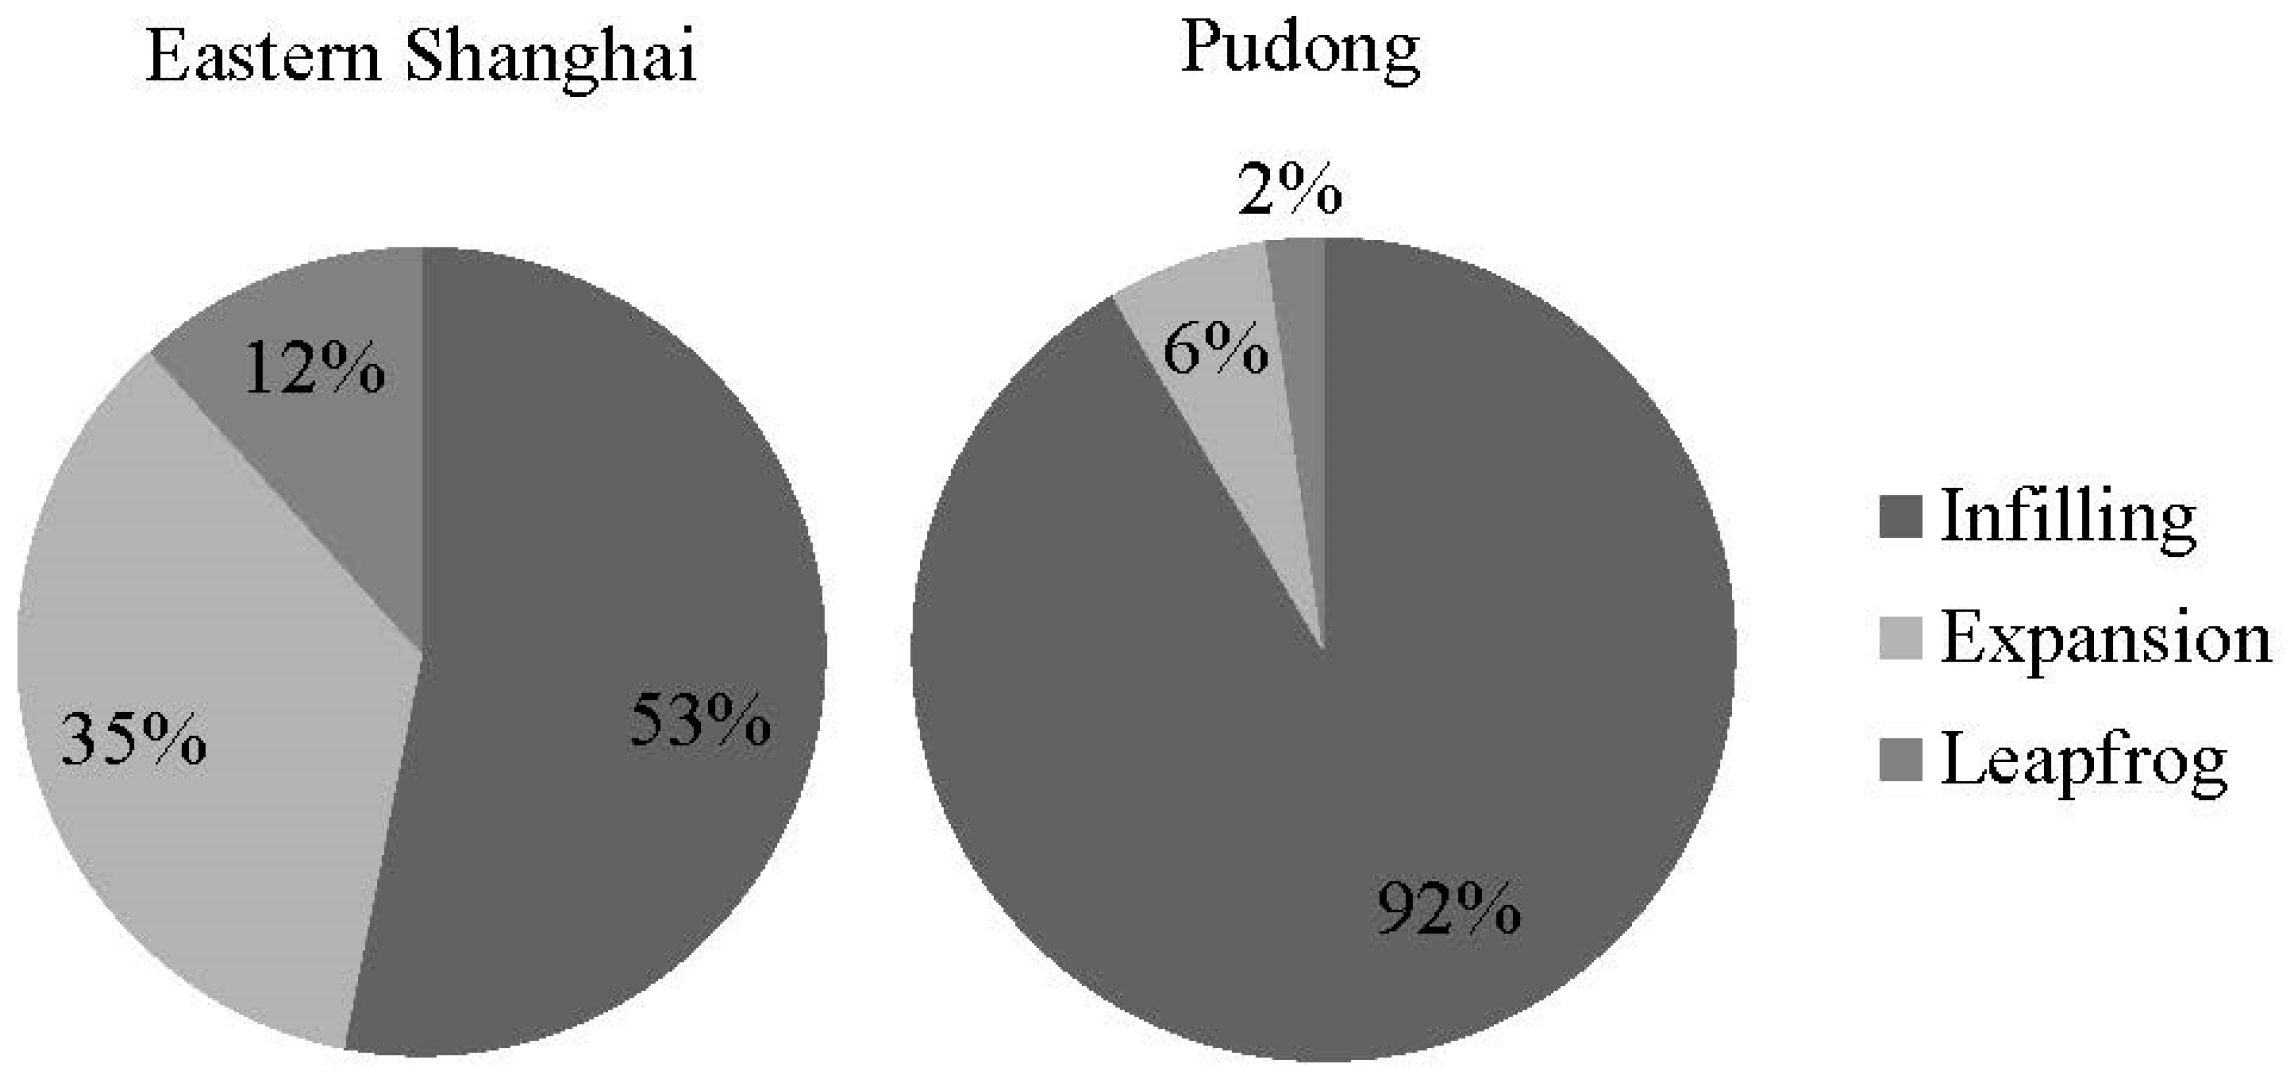
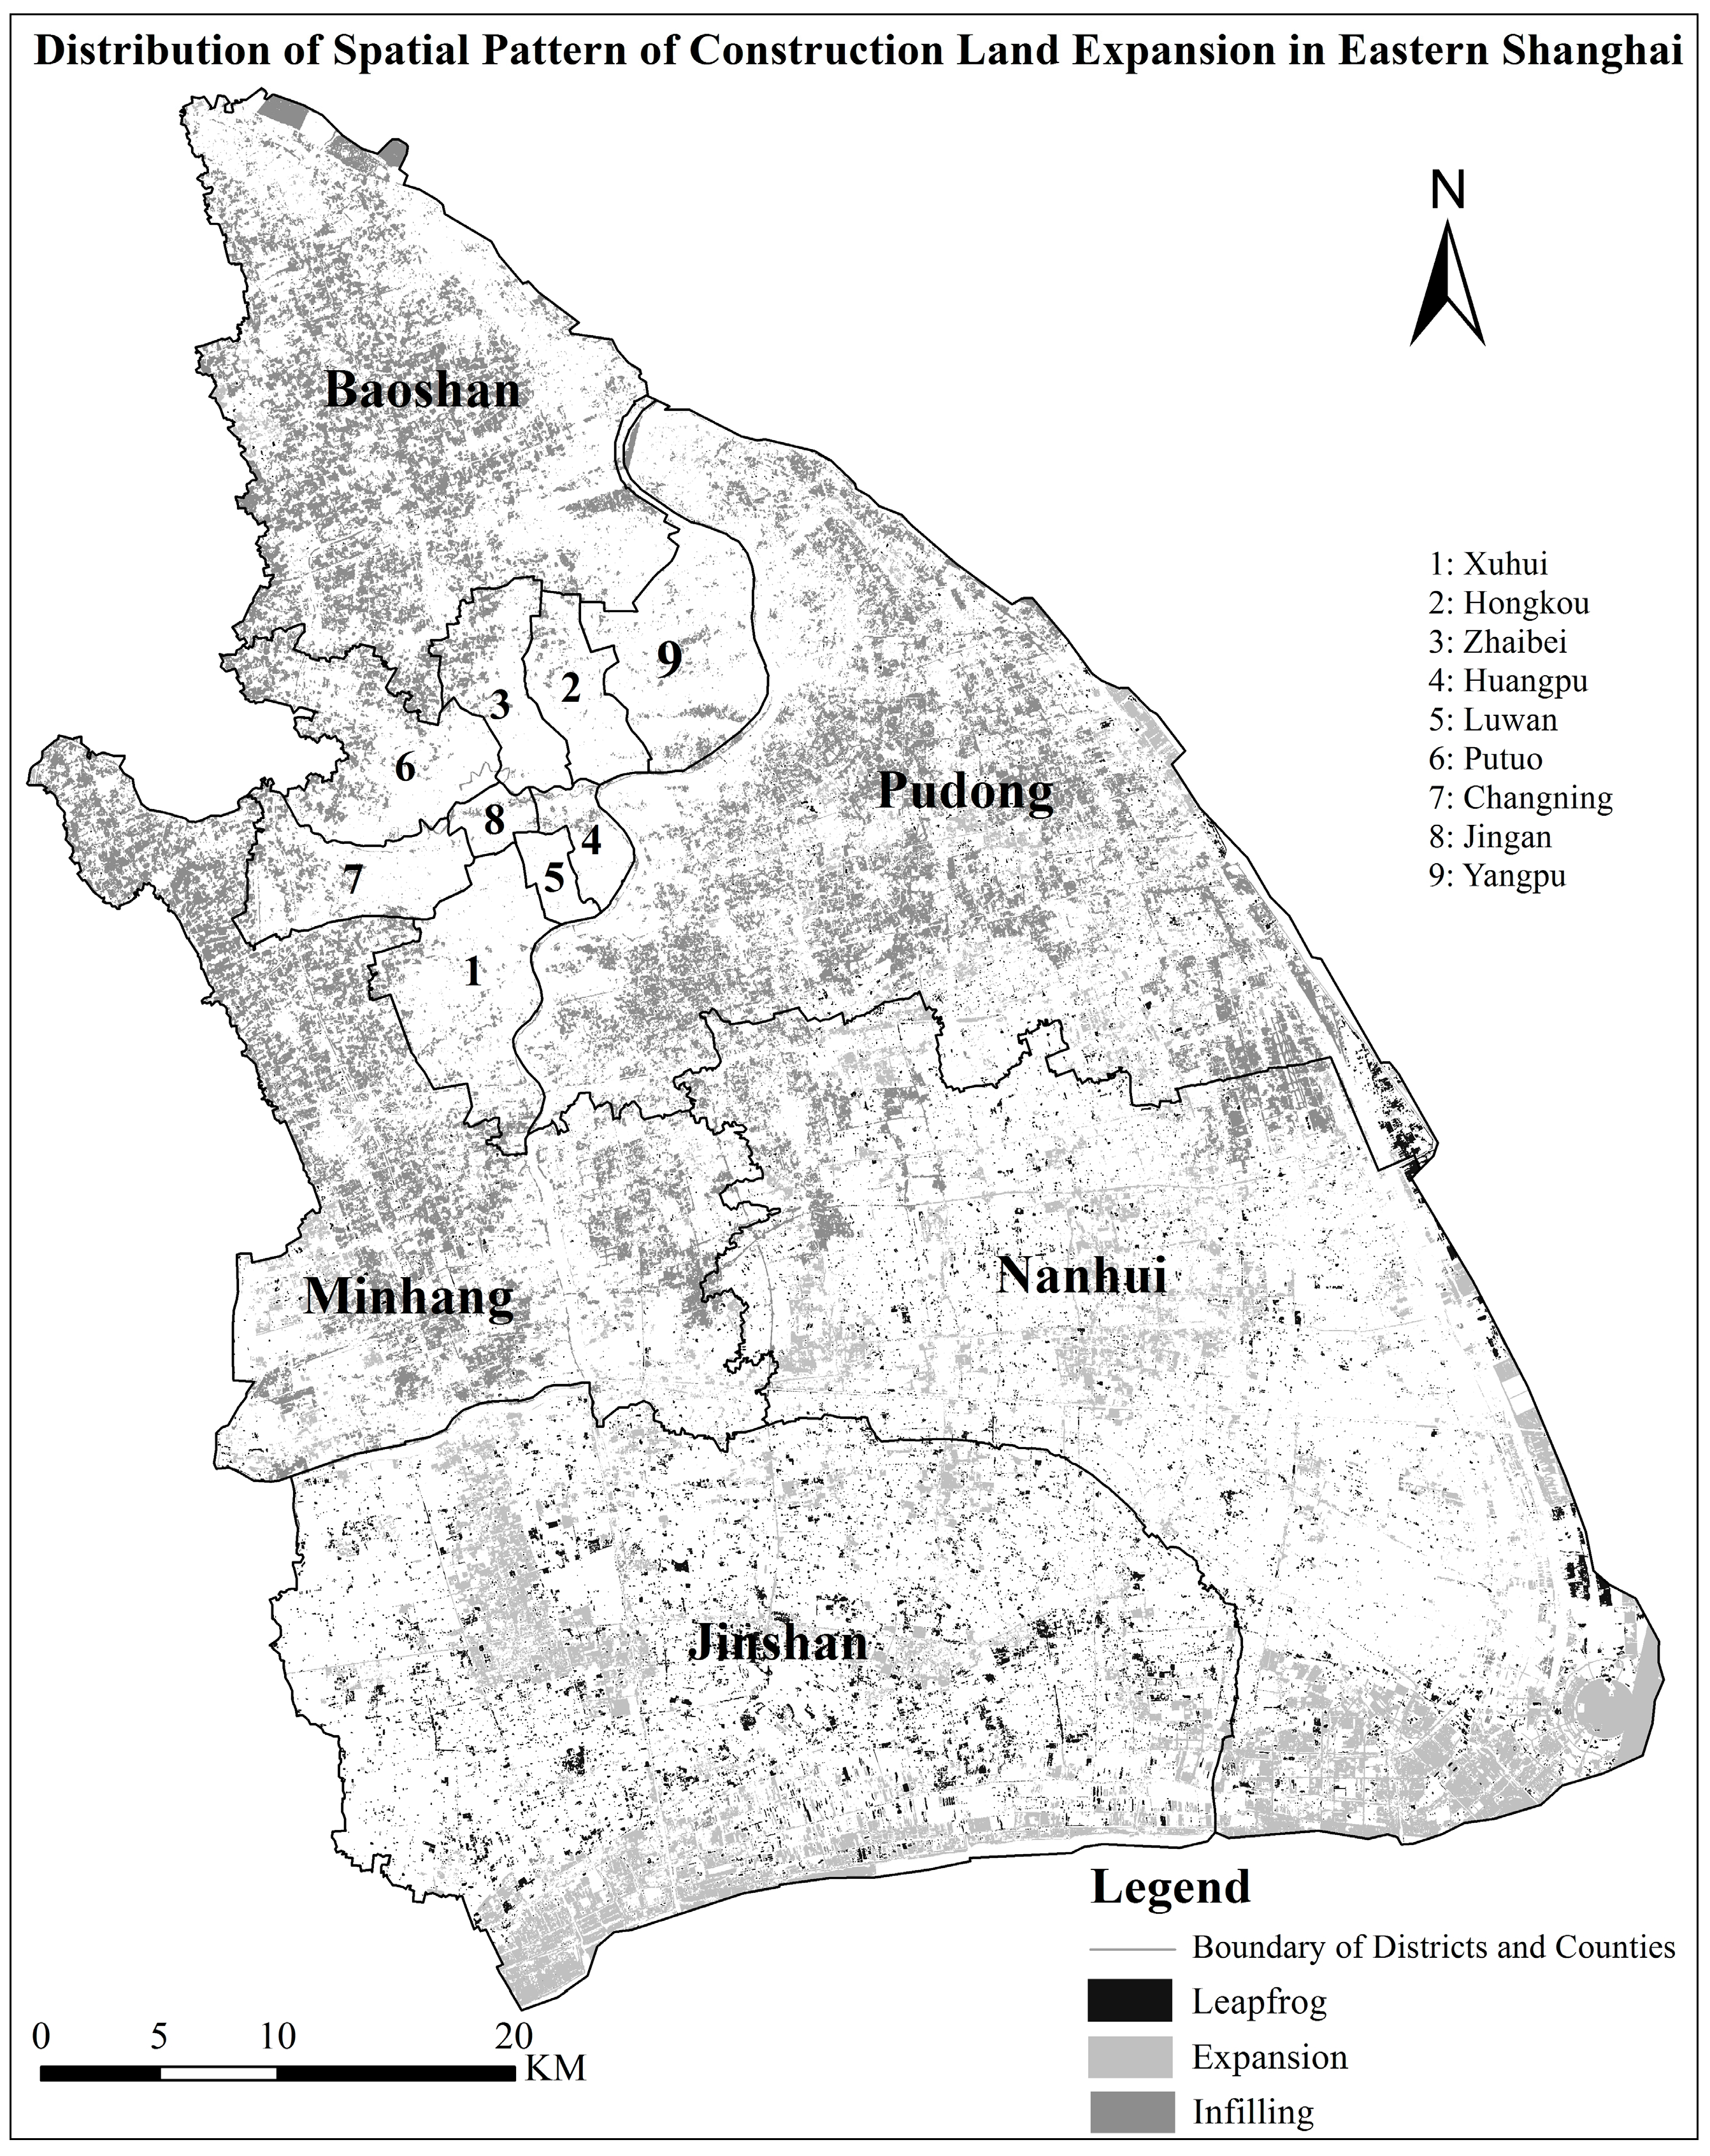
In order to investigate urban growth in Shanghai, this study analyzes spatial patterns and determinants of urban growth by patch analysis and logistic regressions. We found that major patterns of urban growth are infilling and expansion. For development zones, the increase of construction land use is influenced by administrative hierarchy. The analysis of determinants of urban growth also proves that Shanghai is single-core based development, and that both state and market play a significant role in urban growth. The spatial regime regression proves that the dynamics vary across DZs. Thus, considering urban growth as a comprehensive phenomenon, urban expansion in Shanghai is not only affected by the penetration of foreign direct investments and multinational corporations, but also driven by local planning and state policy [
4,
5].
The findings have profound policy implications for land use planning. The analysis suggests that there is still a significant government involvement in Shanghai’s development. Urban land development in Shanghai is massive without considering sustainability of economic development and environment protection. Furthermore, differences between mechanisms of urban growth for large Chinese cities also suggest that land use policies are fragmented. The gap between plan making and implementation is still a problem with urban growth. Further attention should be paid to the understanding of the extent and likely consequences of urban expansion under the dualism of plan and market. Current studies within GIS methods are mainly considering the physical dynamics of urban growth, and to show the whole picture of mechanisms of urban land expansion in Chinese cities, more efforts should be made to incorporate socioeconomic processes.


