Article

A Preliminary Forecast of the Production Status of China’s Daqing Oil field from the Perspective of EROI

1
School of Business Administration, China University of Petroleum, Beijing 102249, China
2
China National Oil and Gas Exploration and Development Corporation, Beijing 100034, China
3
Mac Ewan School of Business, Grant MacEwan University, Edmonton, AB T5J 2P2, Canada
4
Sinopec Group Exploration and Production Research Institute, Beijing 100083, China
*
Author to whom correspondence should be addressed.
Sustainability 2014, 6(11), 8262-8282; https://doi.org/10.3390/su6118262
Submission received: 8 October 2014 / Revised: 4 November 2014 / Accepted: 6 November 2014 / Published: 18 November 2014
(This article belongs to the Section Energy Sustainability)

Abstract

:
Energy return on investment (EROI) and net energy are useful metrics for analyzing energy production physically rather than monetarily. However, these metrics are not widely applied in China. In this study, we forecast the Daqing oilfield’s EROI from 2013 to 2025 using existing data for crude oil and natural gas production and the basic rules of EROI. Unfortunately, our calculations indicate that the oilfield’s EROI will continuously decline from 7.3 to 4.7, and the associated net energy will continuously decline from 1.53 × 10¹² MJ to 1.25 × 10¹² MJ. If China’s energy intensity does not decline as planned in the next ten years, then the EROI of Daqing will be even lower than our estimates. Additionally, relating the EROI to the monetary return on investment (MROI) in a low production and high intensity scenario, Daqing’s EROI will decline to 2.9 and its MROI will decline to 1.8 by 2025. If the “law of minimum EROI” and the assumed “minimum MROI” are taken into account, then we estimate that both energy pressure and economic pressure will restrict Daqing’s production by 2025.

1. Introduction

The Daqing oilfield is China’s largest oilfield and is one of the largest oilfields in the world; the area is more than 6000 square kilometers. The oil production in this field has tremendously contributed to China’s oil industry; it accounted for an average of 75% of China’s annual oil production during the1960s and 1970s. The field is presently responsible for 20% of the country’s oil production. So far, the Daqing oilfield has been responsible for three “firsts”: the first oil production, the first tax-based enterprise, and the first recovery of China’s oil industry. Today, the Daqing oil field continues to play a decisive role in maintaining the security of China’s oil supply.
In1998, Daqing entered its fourth phase of development: the declining hold-out period that is characterized by declining oil production. To maintain its position and achieve sustainable development, the China National Petroleum Corporation (CNPC) proposed the following objectives in 2004: establish a centurial oilfield [1], stabilize 40 million tons of annual oil by 2020, and recover an oil and gas equivalent of 50 million tons by2012 [2]. The Chinese government aims to make Daqing a vital oil and gas production base for China through 2060, at which point the oilfield will have been exploited for 100 years. Currently, the oil production holdout is attributed to technological advances, specifically the use of increasing water pressure beneath the oil and polymer flooding technology (i.e., tertiary oil recovery technology) to maintain oil production and control water content.
China’s domestic oil supply greatly depends on the future of giant oilfields, such as Daqing [3]. Therefore, the status of the Daqing oilfield is of great concern to the government and scholars. Tang et al. [4] employed Weng’s Model to forecast Daqing oilfield production and its ultimate recoverable reserves and concluded that greater investments in exploration will not halt the downward trend in the recoverable reserves. Höök et al. [5] stated that Daqing had already passed its peak production levels and that the decline phase was inevitable. Li et al. [6] found that Daqing’s recoverable reserves had been decreasing and that there would be no new recoverable reserves after 2029.
Considering the anticipated production plateau, several pressing questions are posed regarding the future of Daqing oilfield’s energy supply. For instance, how long can Daqing maintain its oil production plateau? Can improvements in recovery technology offset declines in the Daqing oil reserves? When will Daqing’s oil production cease? The energy supply issues that have challenged Daqing’s status deserve closer scrutiny.
The concept of “net energy” links the questions posed above. The processes of oil and gas exploration, development, production, and transportation all require energy input. Net energy is the surplus energy remaining after an initial investment in energy has been expended to produce additional energy resources. This surplus is the energy available to operate the rest of the economy [7]. Odum [8] noted that net energy is of utmost importance for all organisms and society.
The Energy return on investment (EROI) method is a foundational development in net energy research. EROI and net energy can be used interchangeably when EROI is obtained by integrating the energy yield over a short time [9]. EROI is a ratio of energy output over energy input, and it serves as an index of the quality of a single resource. Hall et al. [10] first used the term EROI in 1981 and applied it to the study of the U.S. petroleum.
EROI distinguishes the traditional economic analysis method by focusing on the physical meaning of energy resources and measuring energy input and output in joules. In the same gross output, a higher EROI corresponds to a lower energy requirement for production; thus, more net energy is available for the economy.
EROI also measures the interaction between technological progress and fossil energy depletion, and it changes with time. Dale et al. [11,12] found that due to technological progress, the EROI of fossil energy increases before production reaches the peak, however the technological component decreases and physical depletion increases the longer the resource is exploited; then the EROI will decline.
As conventional oil and gas resources are rapidly depleted in the world, the EROI of these resources is declining and net energy yield from oil production may peak within the next decade [11]. Estimates and assessments of EROI for oil and gas are currently available for many areas. The EROI of giant oil and natural gas fields dropped from 35 in the 1990s to 18 in 2006 [13]. The U.S. onshore EROI for exploration and development exceeded 100 in the 1930s, but it experienced a sharp decline throughout the 1970s (to approximately 18) [14]; then, it decreased from 18.1 to 11 in the twenty-first century [15]. The EROI of natural gas and oil production in western Canada has fallen from a long-term high of 79 to a low of 15 [16], and the national value declined to approximately 11 in 2007 [17]. Similar studies are rare in China [18,19].
Hu et al. [19] calculated a preliminary time series of EROIs for the Daqing oilfield from 2001 to 2009 and estimated the EROI up to 2015 by means of extrapolation (i.e., using the increasing rates of the output and input as heat equivalents to linearly extrapolate the values). We believe that this calculation can be improved upon and that more accurate estimates of Daqing’s EROI are needed to detect timely, important trends in Daqing’s production, EROI, and net energy within China. Using similar motivations and methods, this paper can be considered a follow-up study to Hu et al.’s preliminary analysis of Daqing’s EROI.
In this paper, using an improved method for calculating production and costs, we first forecast the EROI in four scenarios for the Daqing oilfield from 2013 to 2025. We further introduce the concept of monetary return on investment (MROI) and find that the Daqing’s MROI also experiences a decline. By using the “law of minimum EROI” developed by Hall et al. [20] and the estimated “minimum MROI” required by Daqing, we analyze the production outlook for Daqing in 2025. In the discussion, we note significant trends, compare the results with Hu et al. [19], and discuss possible underlying factors that may explain the trends over time. In addition, we discuss the primary, sensitive factors related to Daqing’s EROI.

2. EROI and Net Energy of the Daqing Oilfield

2.1. Formulas for EROI and Net Energy

Murphy et al.’s [21] two-dimensional framework for EROI analysis describes three boundaries for energy analysis (extraction, processing, and end-use) and five levels of energy inputs (direct energy and material inputs, indirect energy and material inputs, indirect labor consumption, auxiliary services consumption, and environmental consumption); the result is 15 versions of EROI. In this paper, we chose to apply Murphy et al.’s EROIstnd, as used in Hu et al.’s research [19]. EROIstnd accounts for both direct and indirect energy inputs from the extraction boundary but does not account for labor or environmental costs.
The initial method for deriving EROI is to compare energy outputs from an energy production activity with energy inputs to the same process (in thermal units). The formula is:
E R O I = i = 1 n E i O i = l n E i I
E i O and E i I indicate thermal equivalents of energy outputs and inputs, respectively, for the period considered. In addition, to correct for the energy quality of different energy utilities, a quality-corrected EROI approach using the Divisia index is also commonly applied. The revised formula is:
E R O I = i = 1 n λ i E i O i = 1 n λ i E i I
where λ is the quality factor. The revised EROI better reflects the actualsupply of energy useful to society.
According to Hu et al. [19], when applied to the Daqing oilfield, the EROI derived using heat equivalents is somewhat higher than that when correcting for quality, but the difference in the EROIs between the two approaches is negligible. In addition, to forecast the quality-corrected EROI relatively accurately, a prediction of the relative price of energy inputs is necessary (albeit difficult).For the sake of simplicity, we only calculatethe thermal equivalent EROI for Daqing. Note that the two formulas above are dynamic over time. Over the period of one time unit (such as one year), the formula for the thermal equivalent EROI is as follows:
E R O I = E O E I = E O E D i r + M I n d × E i n s
where E O is joules of all energy outputs expressed in the same units; E I and E D i r represent the total input and direct (on-site) input, respectively, of different types of energy; M I n d expresses the indirect inputs, which are usually derived from costs and energy intensity per monetary unit, E i n s .
Generally, energy output data for hydrocarbons is readily available from companies or organizations, but it is more difficult to obtain input statistics due to the increased complexity of including direct and indirect data. The process is analogous to estimate gathering. In this case, energy output is relatively simple to forecast because it is equivalent to the energy content of one barrel of crude oil or one cubic meter of natural gas, in which the measurement units are joules (natural gas output measured inoil equivalents). Clearly, a proper method to predict Daqing’s oil and gas production is critical to output estimations.
Estimating energy inputis more complicated. The above equations suggest that EROI is inversely proportional to energy inputs, which have been a major focus; specifically, the embodied energy in money and materials has received wide attention [7,15,22]. We determine the total energy input content of the direct and indirect energy input within the boundary of extraction. The direct energy input, including oil and gas for self-use, gasoline, diesel, and electricity, is given in physical units (tonsor kwh), but it is difficult to estimate the yearly physical input accurately. The indirect input is usually measured in terms of monetary units (yuan) that are used to purchase material inputs constructed offsite, such as steel forms. The indirect input abides by particular rules as production increases, as described below.
Considering the difficulty of obtaining estimates of physical energy inputs, we use the input derived from monetary costs and the energy intensity per monetary unit to convert the monetary units into energy units in an attempt to achieve reasonable results. To develop an estimated EROI formula based on Equation (3), we look beyond specific categories of direct inputs and instead utilize financial statistics to producealong-term forecast, as shown in Equation (4):
E R O I = E O M I n p × E i n s
where EO is the total joules of all energy outputs expressed in the same units; MInp expresses the monetary costs, including the direct and indirect inputs; and E i n s indicates China’s energy intensity per monetary unit.
Net energy analysis related to EROI is of great importance, which is the gross energy production deducting the energy cost during the production process, reflecting the amount of energy which can actually be delivered to society. Based on Equation (3), the formula for net energy is as follows:
N e t   e n e r g y = E O E I = E O ( 1 1 E R O I )
The meaning of the parameters in Equation (5) are the same as in Equation (3). From these series of EROI methods characterized by energy units, it can be seen that the methodology evaluates production process from the perspective of physical energy profitability, not simply conventional monetary profitability. This approach gets into the essence that physical energy available is the precondition for production activities, which cannot take place without enough net energy.

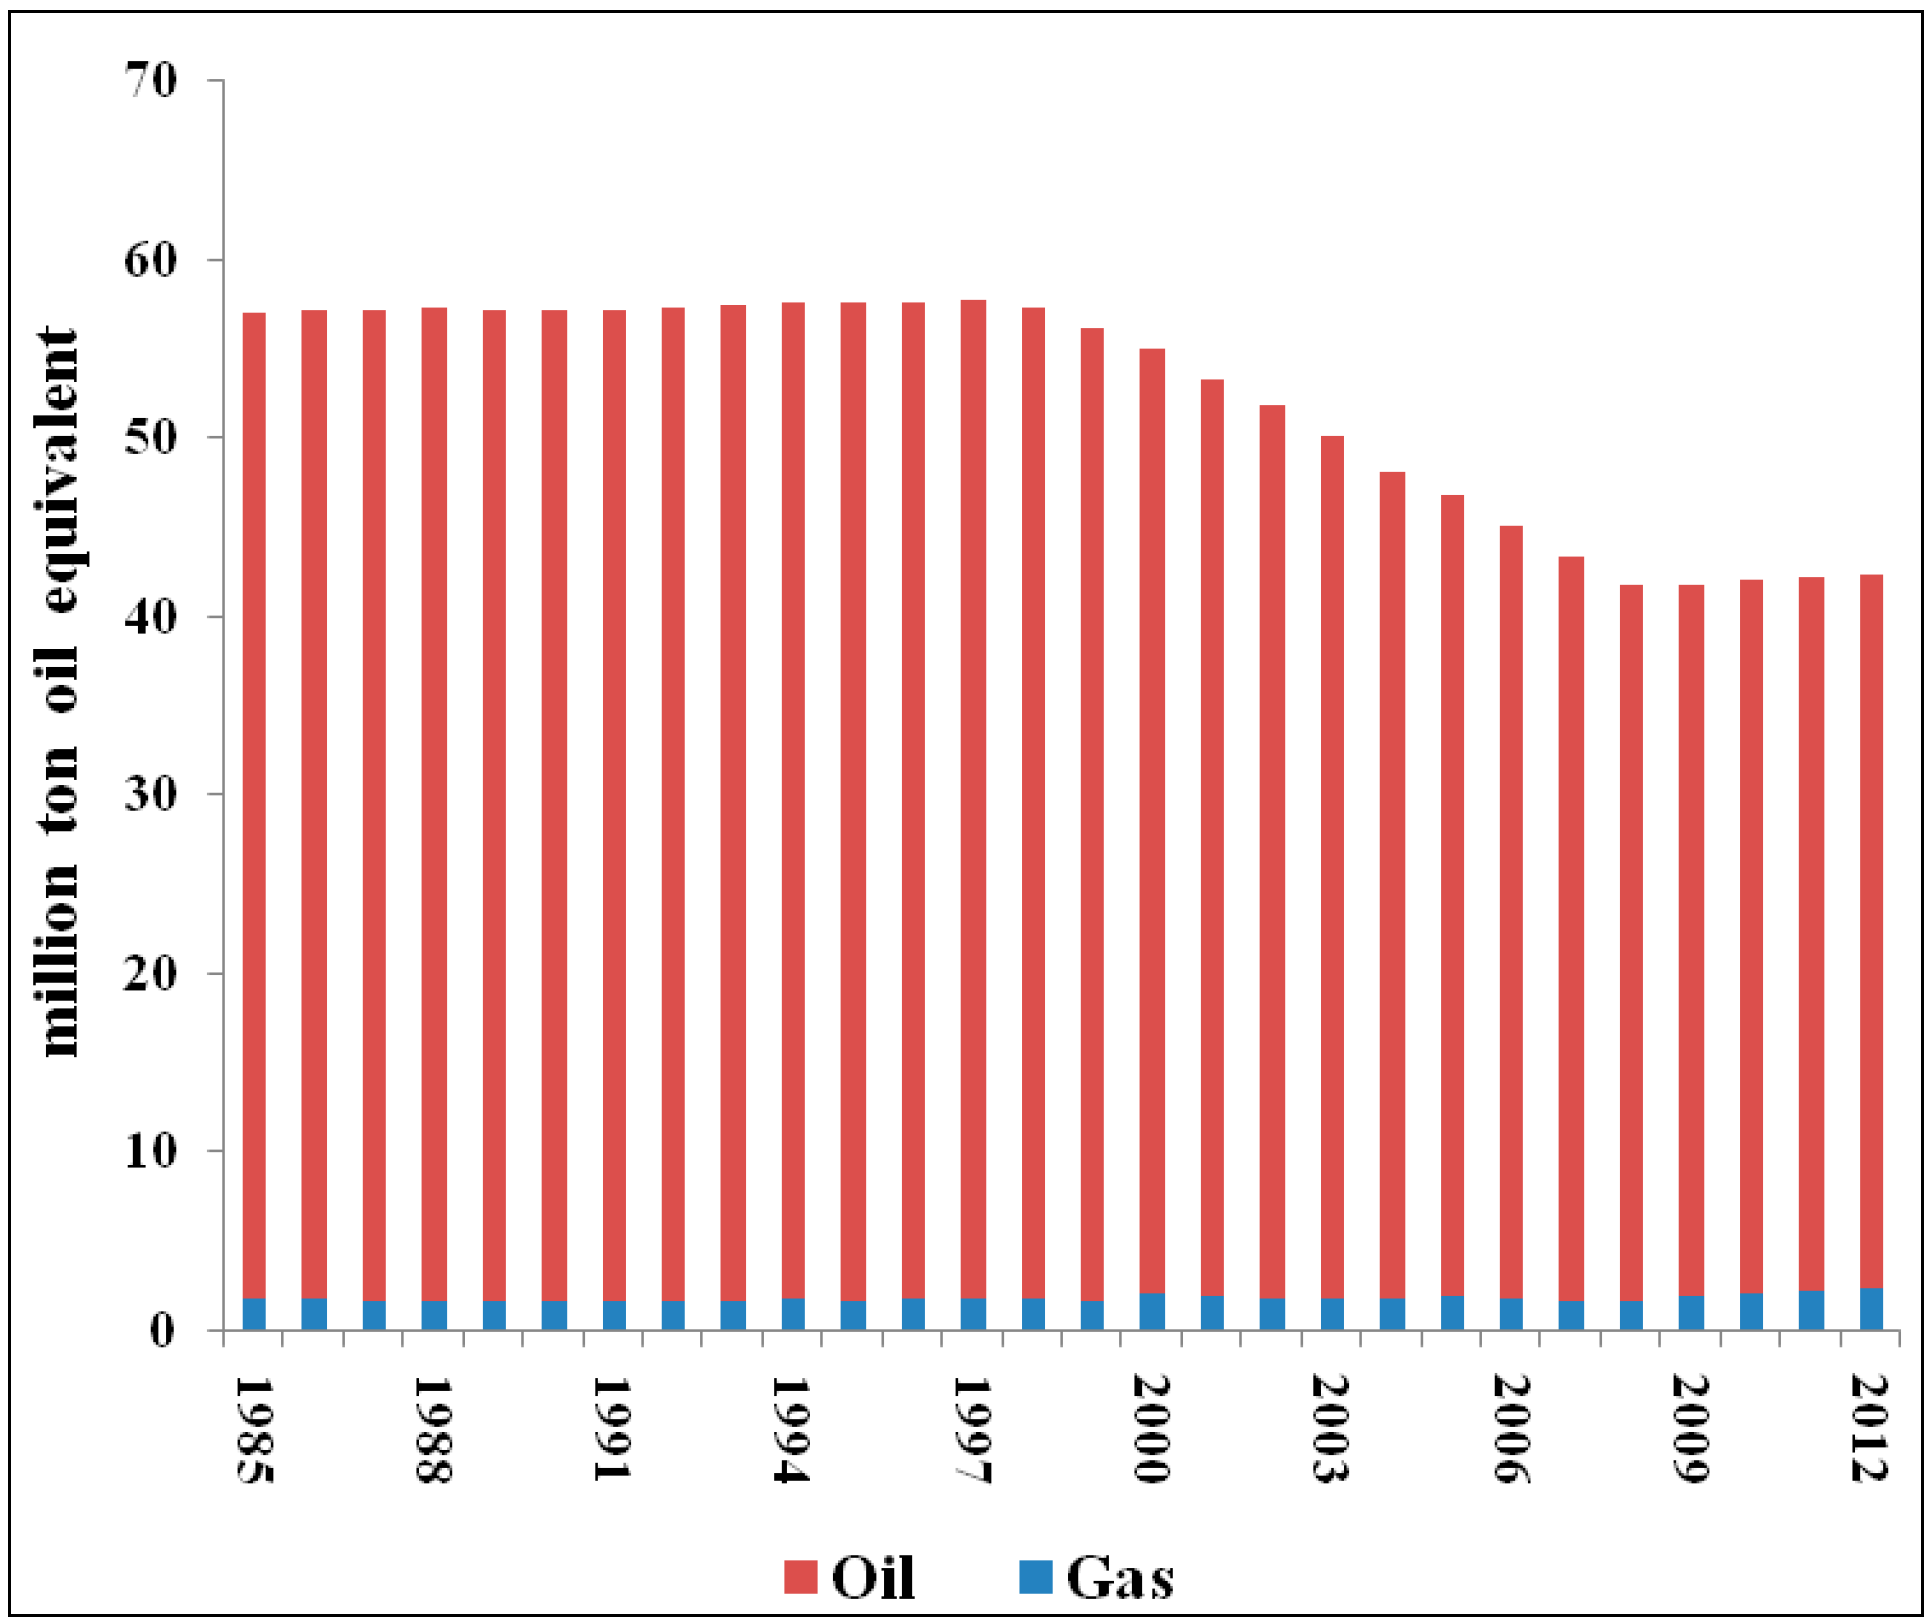
2.2. Forecasting Energy Outputs

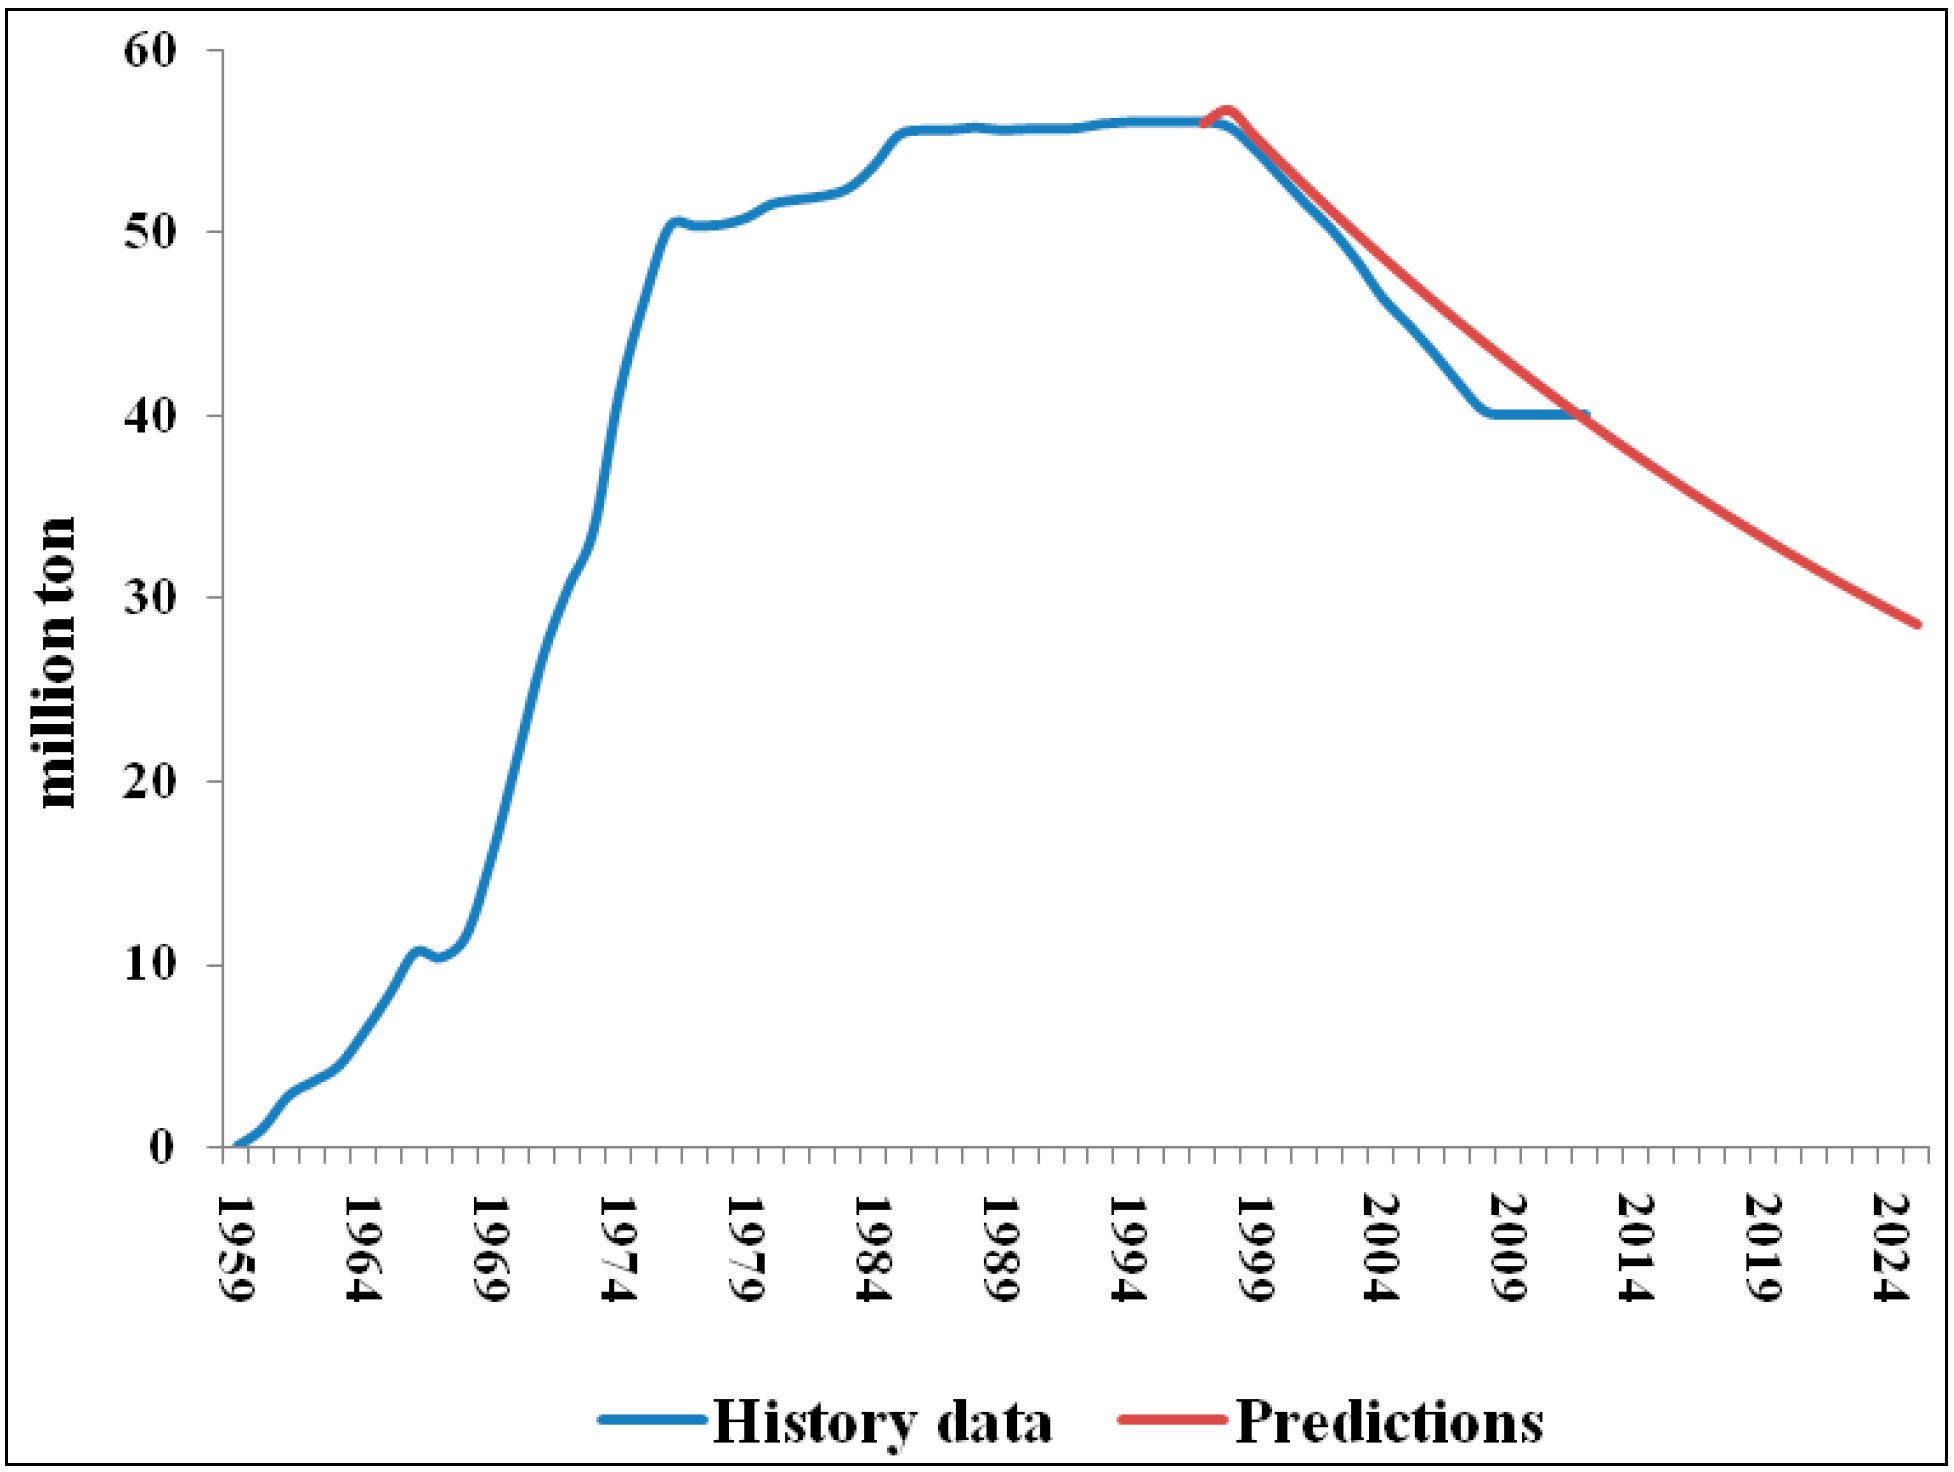
2.2.1. Annual oil Production

Previous researchers have developed variousmethods for forecasting the future oil production of water-driven oilfields, such as Daqing. Generally, these methods can be divided into three classes: (1) water-driven performance curve method [23,24]; (2) forecast model method (which mainly includes the Hubbert model [25], Weng model [26], Weibull model [27], and HCZ model [28]); and (3) the declining curve method (which mainly refers to the Arps exponential decline, the hyperbolic decline, and the harmonic decline [29,30]). Of these three categories, the water-driven performance curve method is rarely used to forecast Daqing’s oil production because the method does not account for temporal changes. In contrast, the forecast model method and the declining curve method are more practical and pertinent; therefore, they can be applied to most types of reservoirs. The declining curve method is particularly appropriate for oilfields but only if they have entered the decline stage. Because Daqing’s production has been in decline for many years, we use the exponential decline method in this paper.
The decline rate describes how rapidly the production of an oil field is declining, which is generally represented as follows:
D = d Q Q d t
where D is the annual decline rate, Q is the annual production, and t is the production time.
Considering the production at time t0, called Q 0 Q0, we obtain the following after integrating Equation (6):
Q = Q 0 exp D ( t t 0 )
Taking the logarithm of Equation (7) yields:
log Q = a b ( t t 0 )
Applying linear regression to Daqing oilfield’s historical production data, we calculate an intercept of 3.754 and a slope of 0.011. Inputting these two data points, as well as the historical production data for value , into Equations (7) and (8), we obtain the Daqing oil production forecasting formula:
Q = 56.75   exp 0.025 ( t t 0 )
By Equation (9), we get the forecast results of Daqing oil production (see Figure 1).
Figure 1. History and forecast results of Daqing oil production.
Sustainability 06 08262 g001
Q has units in millions of tons. In addition, the cumulative production starting at t 0 can be represented as:
N p t N p o = t 0 t Q d t
where N pt is the overall oilfield production since its commission, and N po is the cumulative production, since the end of the oilfield’s stable production stage. Equation (7) is substituted into Equation (10); when Q approaches 0, a recoverable reserve ( N R T ) is available:
N R T = Q 0 D + N p o
By inserting Daqing’s historical production data into Equation (11), we calculate the Daqing recoverable reserve as 3786.9 million tons; this calculation is also useful for the work described later.
The exponential declining curve qualitatively describes the progress of Daqing’s oil production, and it provides a reliable indication that the production will continue to decline. Therefore, we call this the Low Oil Production Scenario. However, in reality, the production is not wholly decided by data fit to functions, particularly because of economic and political factors. In contrast, the national plan calls for continued oil production of the Daqing oilfield at 40 million tons per year until 2020 to compensate for the projected energy shortages, which is likely to lead to a readjustment of the production trend. Based on the national plan and assuming a 2.5% decline rate from 2021 to 2025, we call this the High Oil Production Scenario.

2.2.2. Annual Gas Production

In the development history of the Daqing oilfield, oil accounted for a vast majority of the energy output (see Figure 2). Because of its unique geographical setting, there were few breakthroughs in natural gas exploration until 2002, when the Qingshen gas field, a huge volcanic rock area, was discovered in the Daqing oilfield. Upon this discovery, Daqing was named the fifth largest gas field in China, after the Tarim, Qaidam, Shanganning, and Chuanyu gas fields. Meanwhile, with recent technological advances, deep-layer natural gas exploration has increased in Daqing and has gradually expanded the gas-bearing area and helped fulfill the gas-to-oil supplement strategy.
Figure 2. Total energy output of oil and gas of Daqing.
Sustainability 06 08262 g002
According to the “Daqing Oilfield Sustainable Development Program” introduced by the Daqing Oilfield Corporation in June 2012, Daqing’s natural gas production has still managed to increase such that oil and gas equivalents in the Daqing oilfield will be maintained at 40 million tons until 2020. At that point, gas production will amount to 8000 to 10,000 million cubic meters; therefore, the required annual rate of growth between 2013 and 2020 is estimated at 14%. Based on the development plans, we predict that Daqing’s gas production will maintain a 14% rate of growth until 2025, which we define as the High Gas Production Scenario. In the event that gas production plateaus after a rapid increase, a Low Gas Production Scenario can be constructed based on the hypothesis that Daqing’s gas production will reach 10,000 million cubic meters in 2020 and remain steady from 2021 to 2025.

2.3. Forecasting Energy Inputs

As the forecast accuracy of EROI depends on the accuracy of energy input forecasts, we use inputs derived from both financial costs and energy intensity. In the extraction process, as depicted in Equation (4), MInp consists of operating costs, depreciation and depletion, and expenses, which are recorded in the Daqing Statistical Yearbook; EIns represents energy intensities and reflects the relationship of energy consumption and the economy. As the sectors for extracting petroleum and natural gas are simply categorized as “industry”, we use the data for actual GDP and energy use to derive a time series of EIns for all industries.

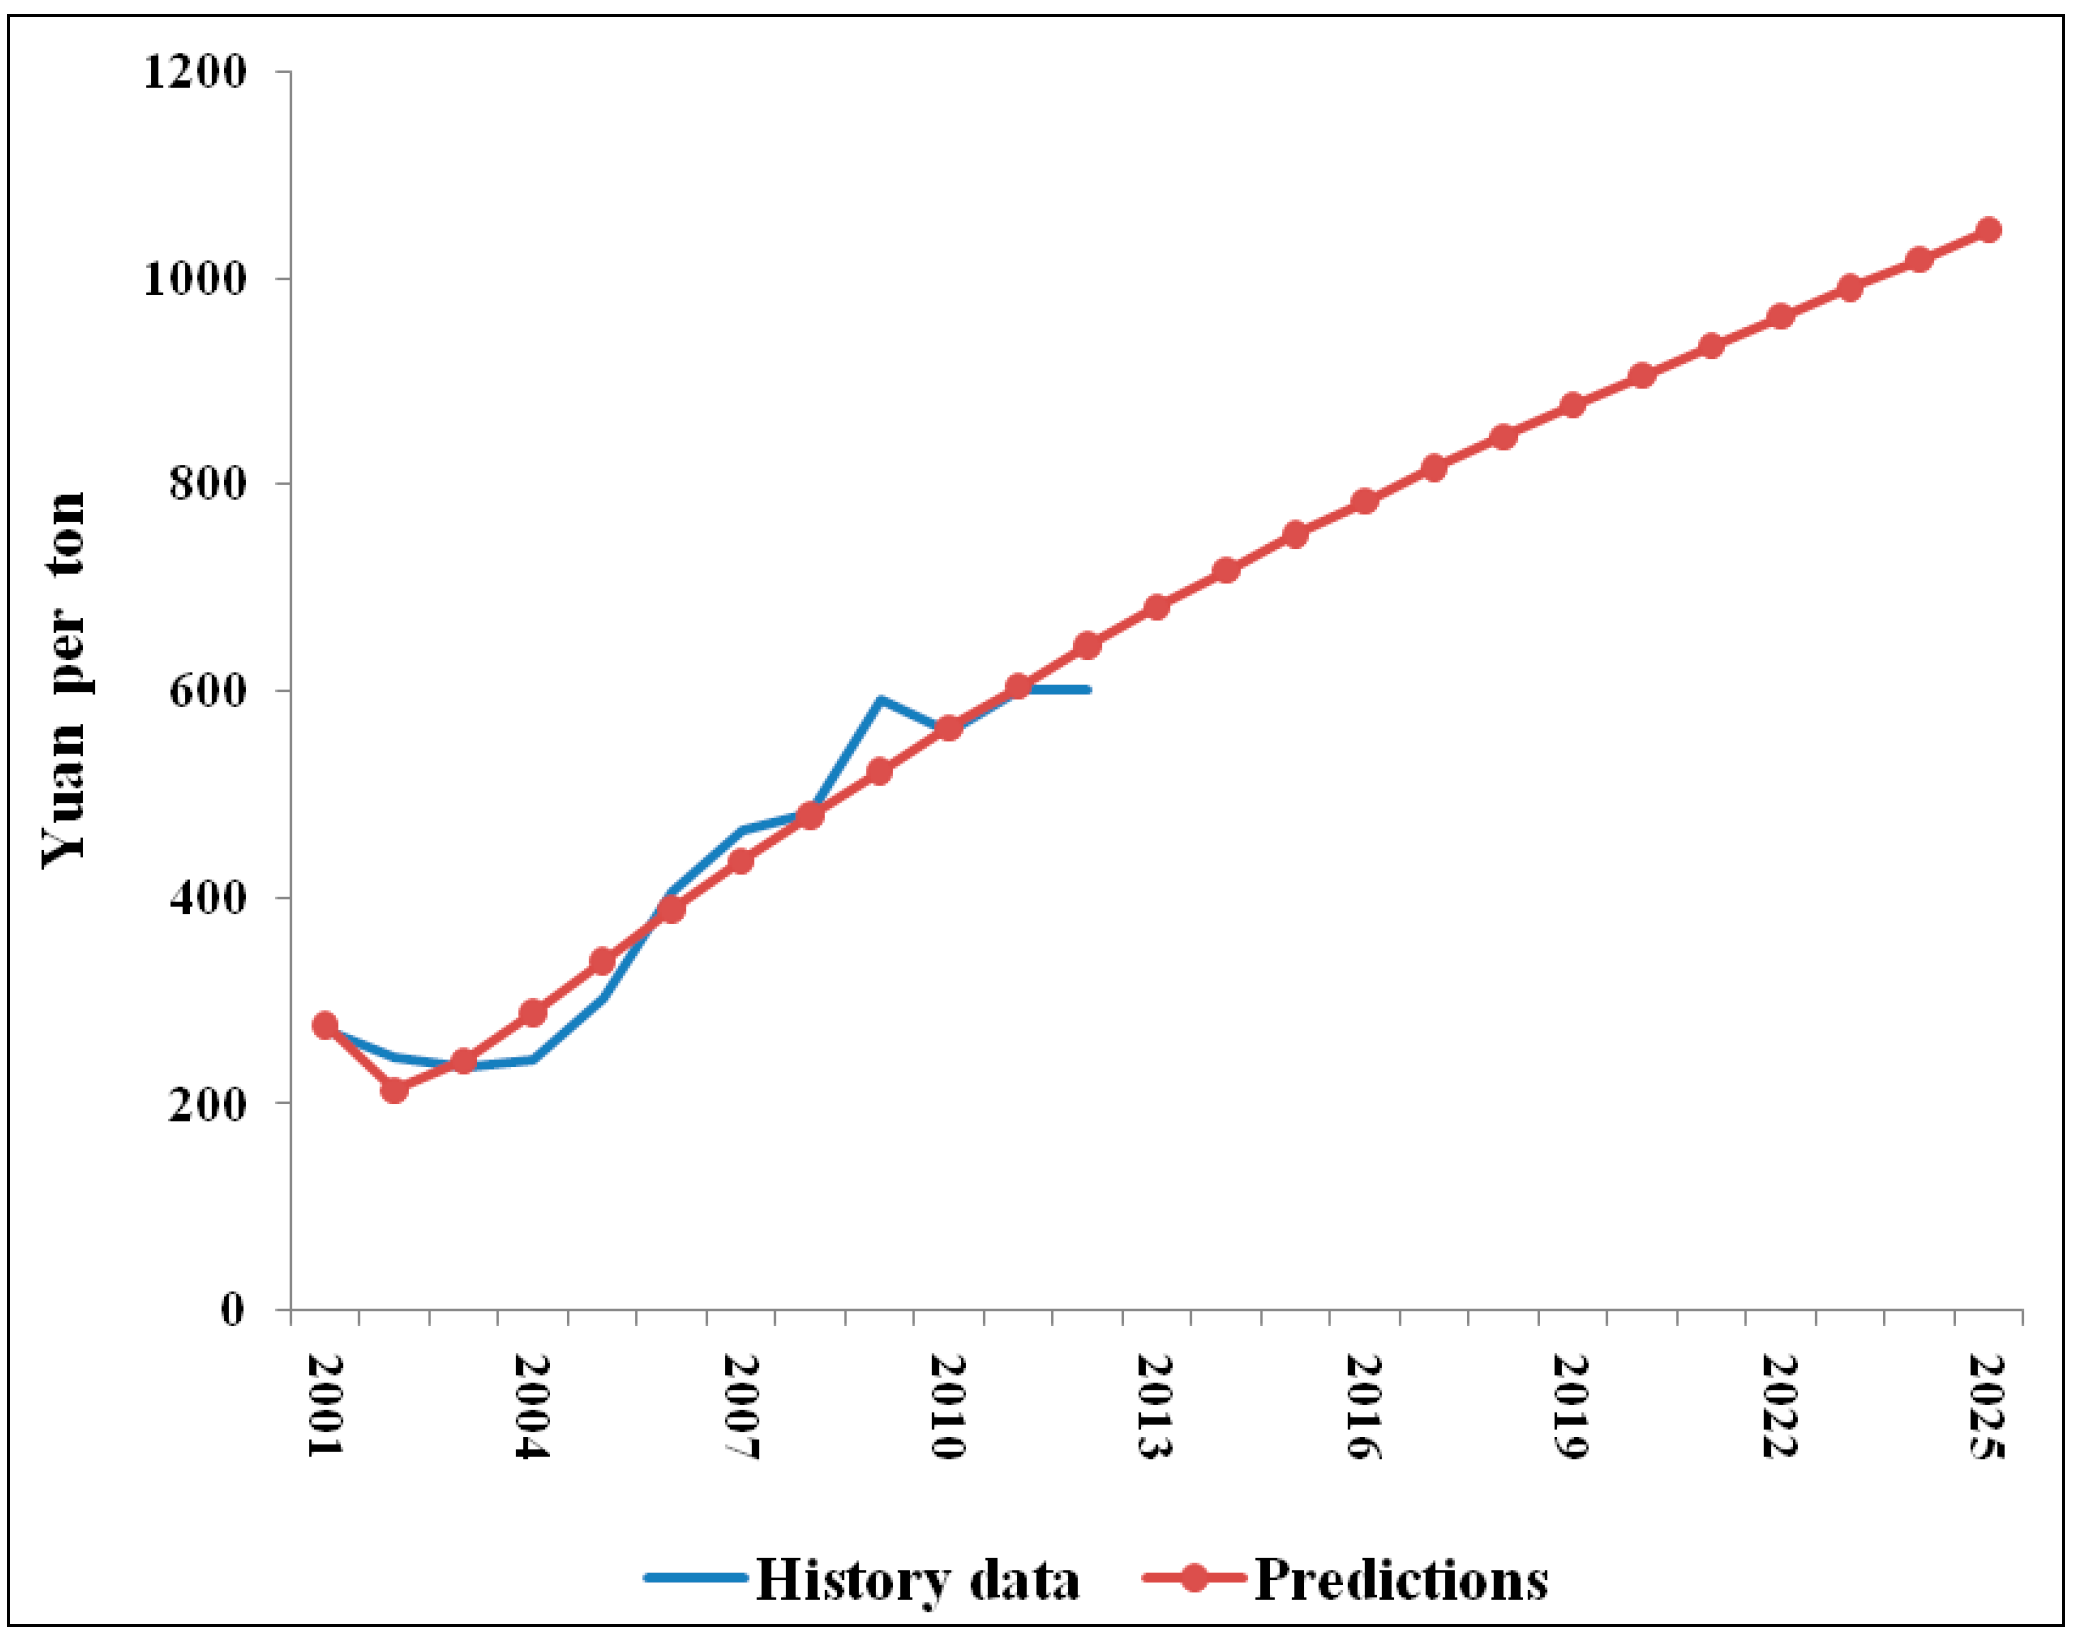
2.3.1. Operating Costs

Operating costs are incurred during production activities. In China, operating costs generally account for the largest proportion (approximately 40% to 60%) of the total cost of oil and gas extraction [31]. Furthermore, oil companies have strict operating costs because these costs are incurred throughout the entire extraction process and reflect the resource quality, level of exploration and development, effectiveness of technology, and operating management. Thus, operating costs represent a rough proxy for consumption during extraction, and they are somewhat reflective of the total costs.
Operating costs for oil and gas production are affected by many factors, such as production techniques, production processes, and geological and economic conditions, which comply with both production processes and economic laws. Méjean and Hope [32] estimated the supply cost of Canadian oilsand by considering the production decline rule and the learning effect of oilsand development. Luoand Zhao [33] forecasted the operating cost of oil and gas exploration and development project by considering the oilfield depletion effect and learning effect while structuring the forecast model in the construction, platform, and declining periods.
Therefore, this paper also assumes operating costsare the result of the learning effect versus the depletion effect. The learning effect leads to decreasing unit costs as a result of improved technology, management experience, and staff proficiency. However, the depletion effect increases unit costs when technological limits appear and resource depletion becomes more apparent [11,12].
Note that Daqing’s natural gas production only accounts for a small proportion of the total production; therefore, the learning effect and depletion effect of oil production are the main considerations when forecasting the Daqing oilfield operating cost model. By using historical data from 2001 to 2012, we can model the unit operating costs using the following expression:
C t = 3.79 × ( X t 1675.9 ) 0.07 + 14.15 × ( X t 3786.9 ) 0.025 17.52
where 0.07 is the learning coefficient; thus, the learning rate is five, as also seen in the U.S. results of McDonald and Schrattenholzer [34]. Daqing’s depletion rate is 0.025, which is also its decline rate, due to exponentialdecline [35]. Choosing 2001 as the initial time, 3786.9 is the ultimate recoverable reserves calculated using Equation (11), and 1675.9 is the cumulative production in 2001. Xt is the cumulative production from 2001 to time t. The monetary units are one hundred million yuan, and the units for the production and reserve amounts are million tons. The fitting equation passed the p-value test, and the R2 reached 95.2% (see Figure 3).
Figure 3. History and forecast results of Daqing unit operating costs. The blue line represents historical data; the red line represents predictions based on the best fit of the trend.
Sustainability 06 08262 g003
The fitting effect can predict the Daqing oilfield unit operating costs between 2013 and 2025. To eliminate the impact of price changes, estimated costs are corrected by the 2011 industrial producer price index.

2.3.2. Depreciation and Depletion
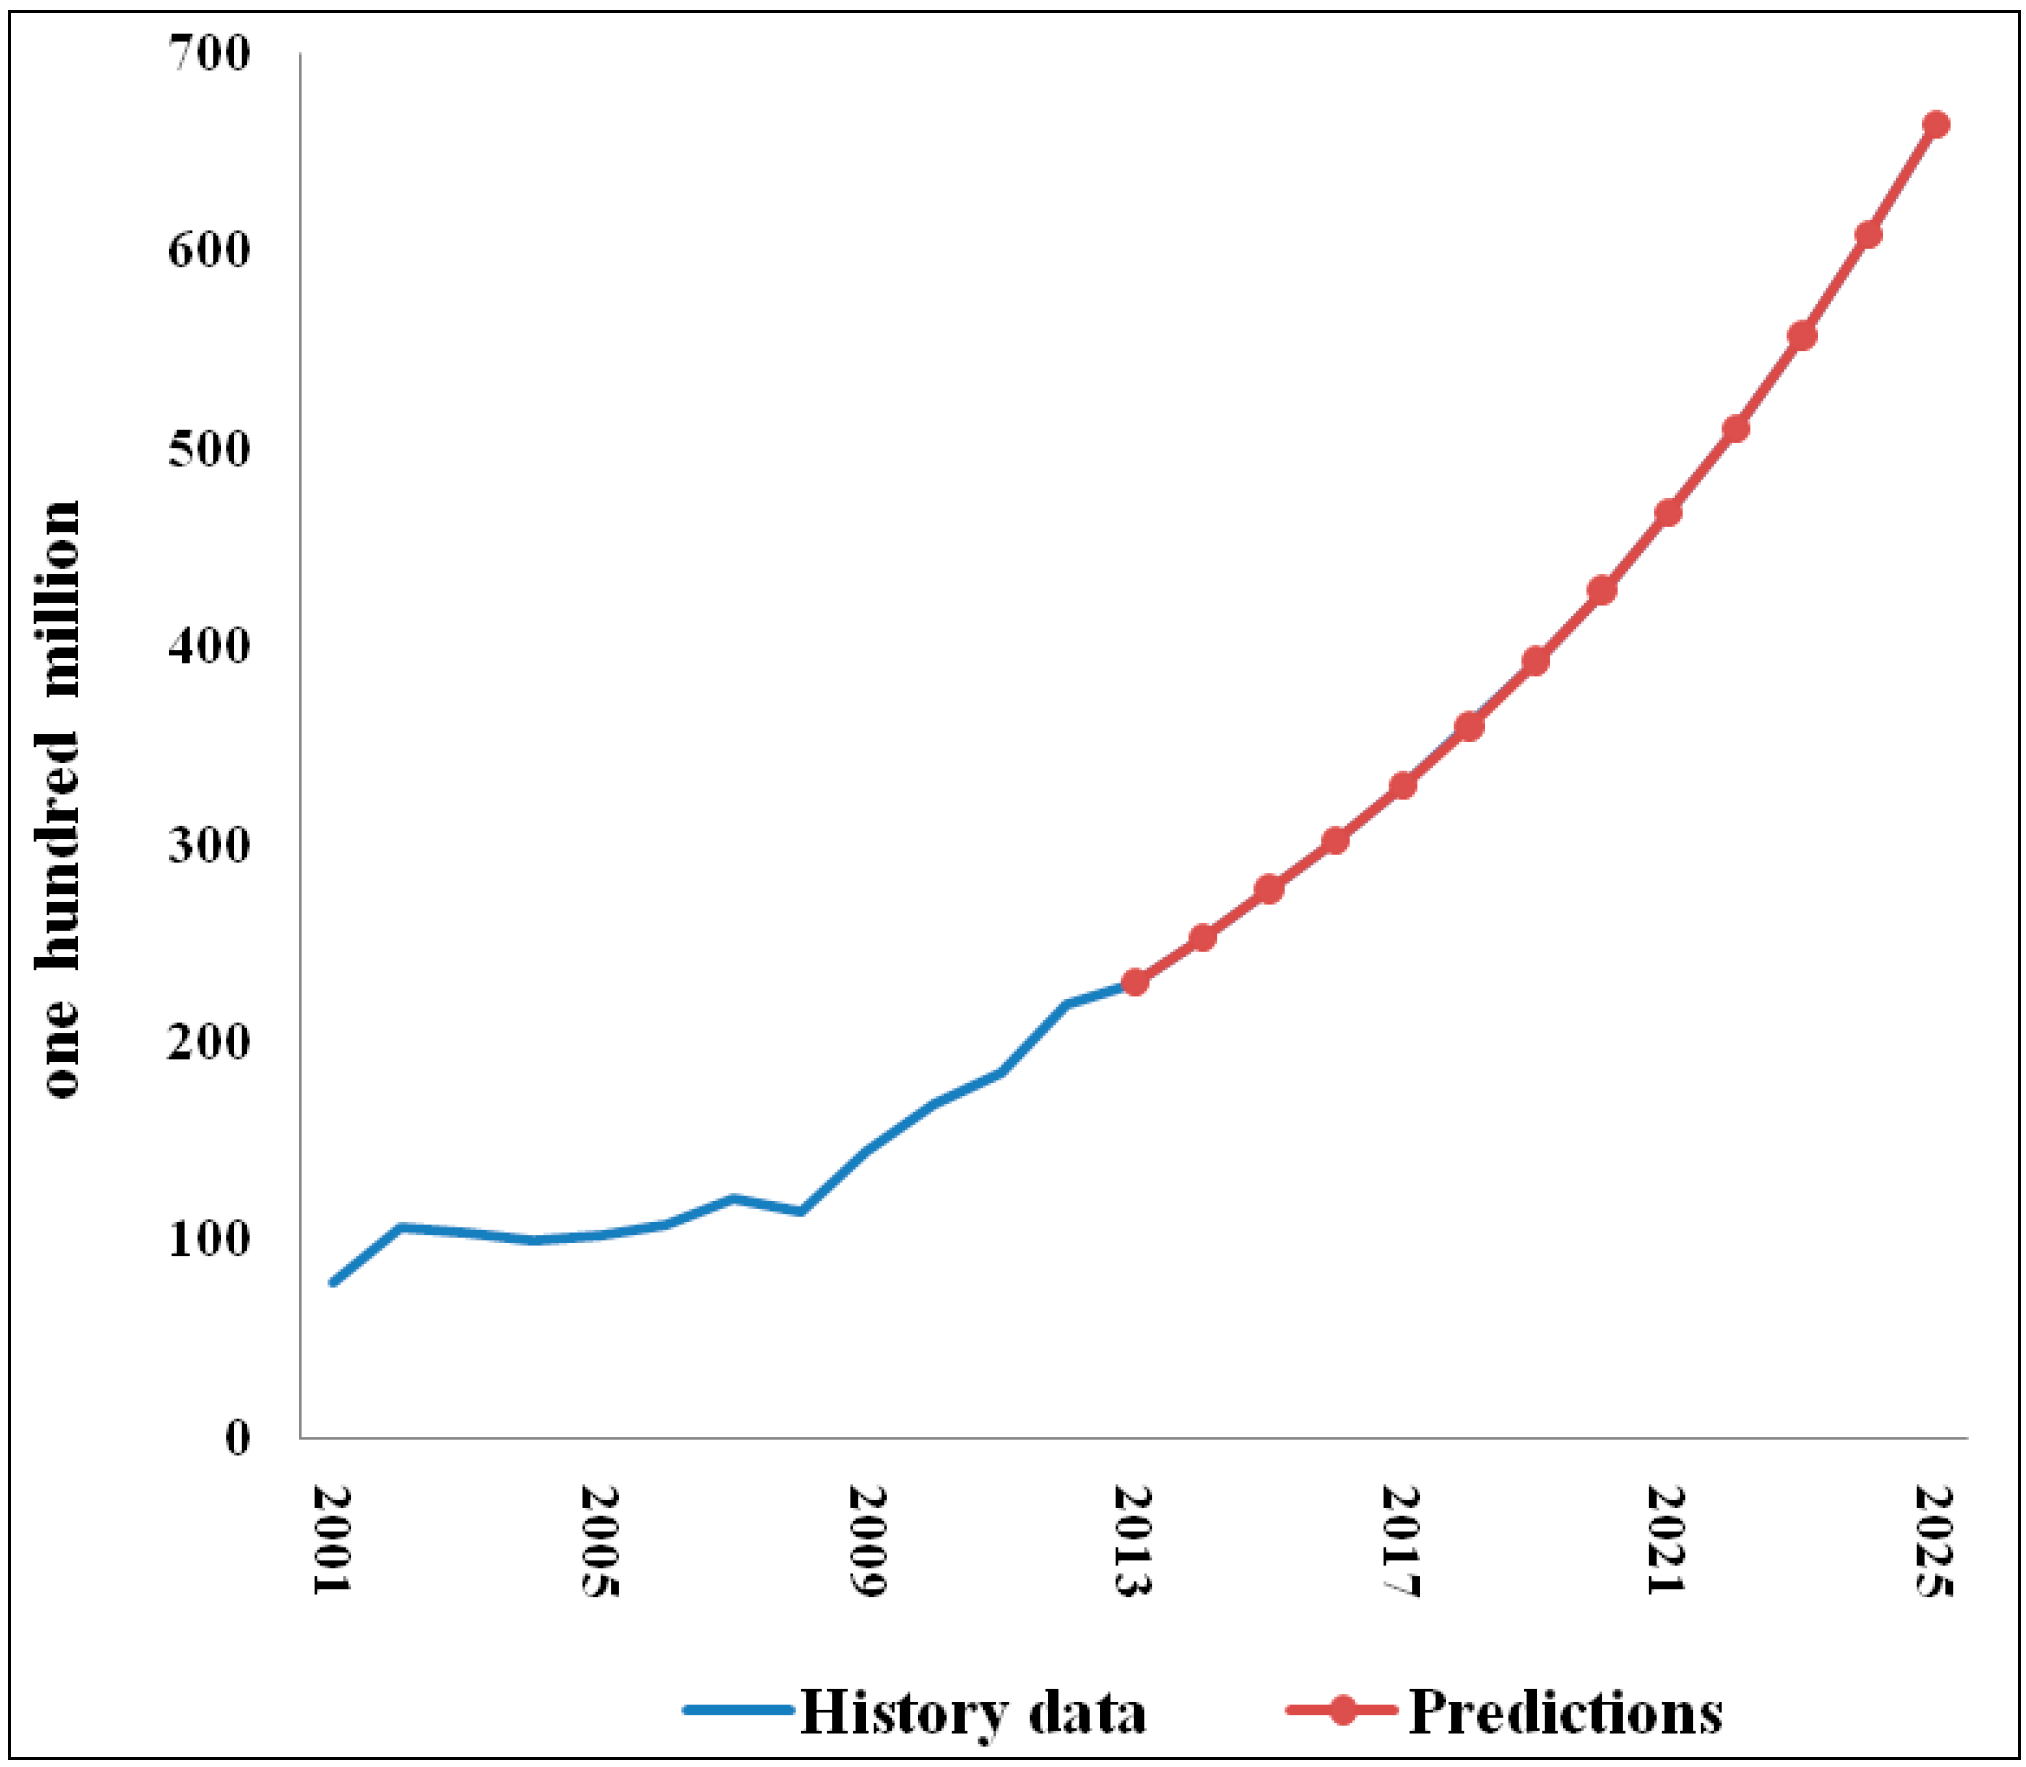
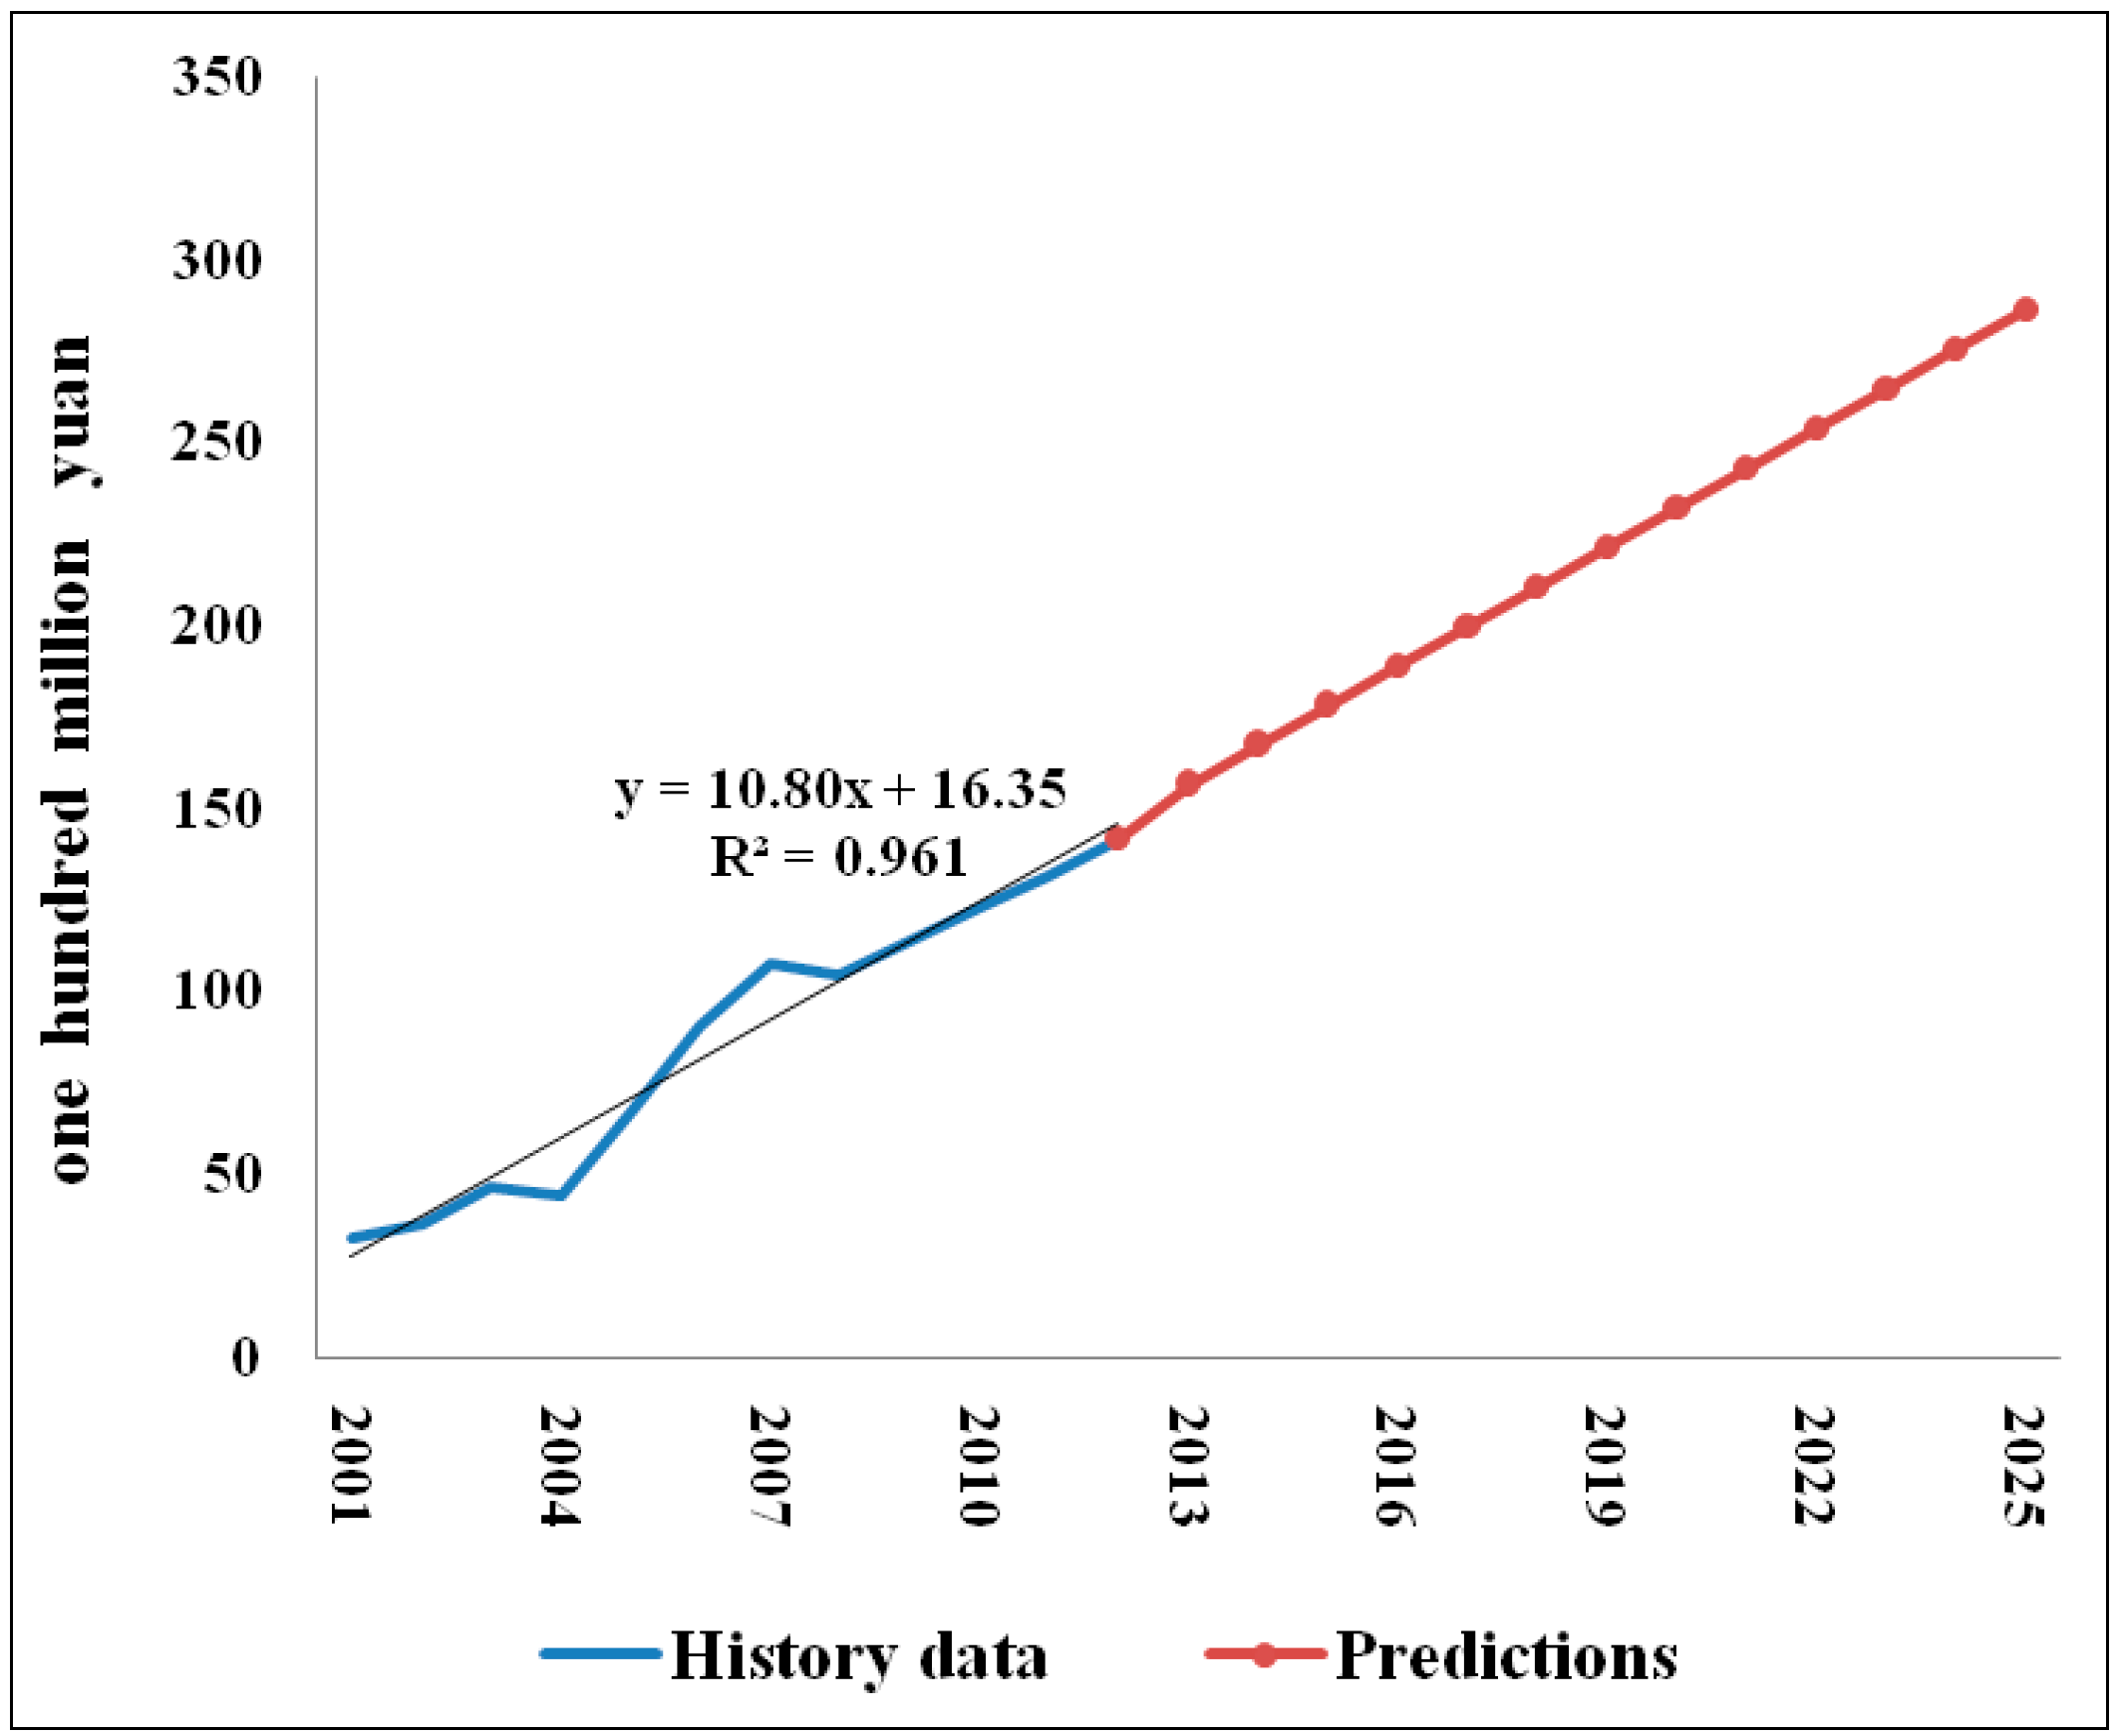
In petroleum industry accounting, depreciation refers to the value loss of wells, metering stations, gathering stations, pipelines, houses, buildings, and so on; however, water and gas injection, underground facilities, light hydrocarbon recovery facilities, and oil and gas processing facilities are not included. Depletion is a similar accounting concept to depreciation, which refers to expense that is gradually transferred from mineral property assets during the lifetime of extraction process. They are regarded as the costs of upstream successful exploration and development capitalized. Currently, Daqing implements strict budget controls on committed fixed costs, such as the original value of assets, depreciation and depletion rates, and expected life of fixed assets, so that management authorities cannot make changes casually.
Depreciation and depletion in Daqing vary in proportion to the development investment, i.e., a greater per-unit investment corresponds to a future higher depreciationand depletion. As the difficulty of exploration increases, development investments, depreciation costs, and depletion costs will continuously rise. These costs have increased rapidly, particularly since 2008. Using data from 2001 to 2012, to highlight the recent trend, we use the weighted moving average method, which is similar to extrapolation and also widely used in statistics to predict depreciation and depletion up to 2025 (see Figure 4).
Figure 4. History and forecast of depreciation and depletion in the Daqing oilfield. The blue line represents historical data; the red line is an extrapolation of the depreciation and depletion, as it is assumed to continue rising with investment development.
Sustainability 06 08262 g004

2.3.3. Expenses

Expenses mainly include management fees, financial expenses, and selling expenses. Management fees include not only the fees to organizing workers for operation activities, but to paying the mineral resources compensation tax. The latter are proportionate to the increased revenue. Meanwhile, financial expenses are also on the rise due to annual increased borrowing for new area exploration around Daqing maturing field. Although selling expenses refer to costs outside of the production process, they account for only a small proportion of the total investment, and their effect on EROI is negligible. Figure 5 shows that the expenses follow a strong linear trend, so we can estimate expenses up to 2025 based on the time series.
Figure 5. History and forecasts of expenses for the Daqing oilfield. The blue line represents the historical data; the red line is extrapolated based on the best linear fit of the trend.
Sustainability 06 08262 g005

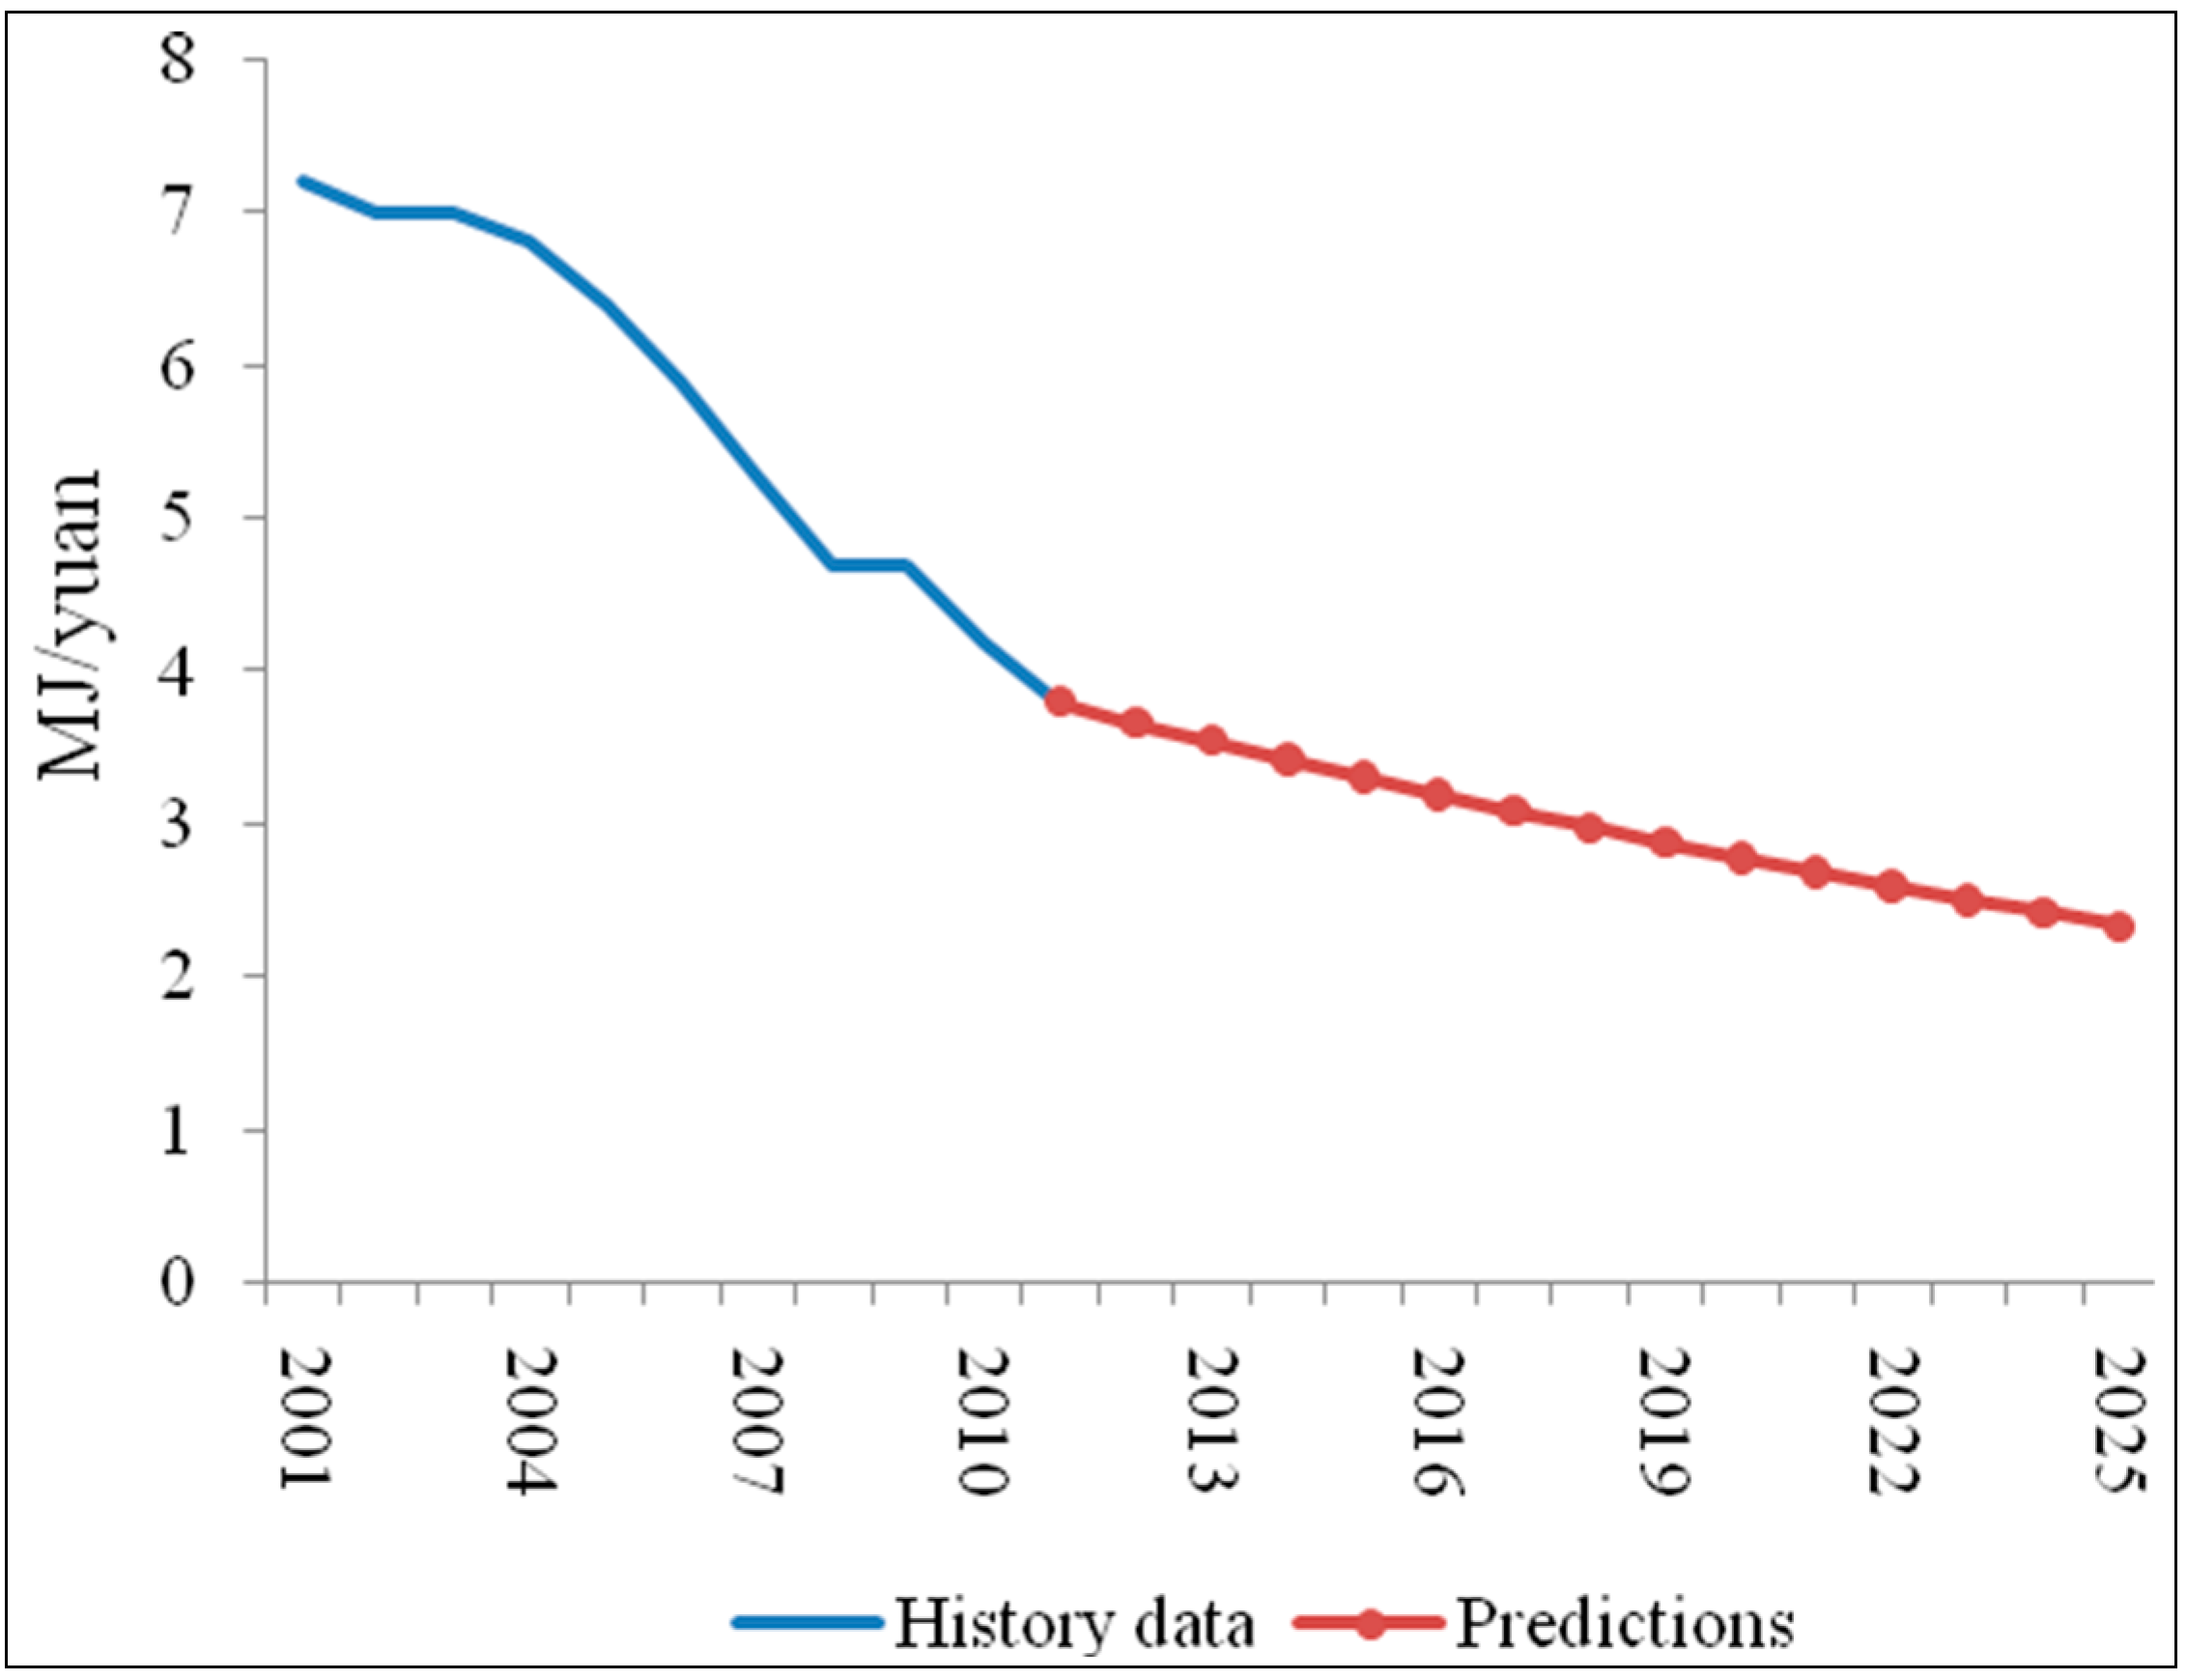
2.3.4. Energy Intensity

We use industrial energy intensity as the coefficient for converting cash flow to energy flow, which is specific and appropriate for the embodied energy of major items used in the oil and gas extraction sectors. This conversion reveals the embodied energy consumed by devices and equipment during the production process. Higher industry energy intensity will raise the energy input, reducethe EROI value, and yield lower net energy from the production output.
According to the “12th Five-Year Development Plan Outline” of the Chinese government [36], China will continuously promote the transformation of energy production and use, for example, from coal to more low-carbon energy, while reasonably controlling the total energy consumption. The plan notes that the government will not only promote the consumption of less energy, but also improve the efficiency of the national economy, reduce greenhouse gas emissions, and alleviate the contradiction between the supply and demand of energy during industrialization. By 2015, the plan should have reduced the intensity of energy consumption by 16%.
Because energy consumption by Chinese primary and service industries is relatively low, these two sectors are expectedto experience a smaller energy intensity reduction. In contrast, secondary industries require the greatest effort to reduce their energy intensity [37]. The development plan predicts that China’s industrial energy intensity will decline 3.4% per year. Thus, in this paper, the Low Intensity Scenario assumes that energy consumption will continue to decrease at the same pace until 2025. The forecast is shown in Figure 6.
Notably, an energy intensity decline of 3.4% per year is much faster than the global energy intensity declines from the 1990s and the 2000s [38]. Therefore, we must consider the challenges of implementing China’s energy intensity reduction policy. By setting the success of the government’s energy intensity reduction to the Low Intensity Scenario, we define the High Intensity Scenario as the energy intensity remaining the same from 2011 (3.8 MJ/yuan) to 2025.
Figure 6. History and forecast of energy intensity of the Daqing oilfield. The blue line represents historical data; the red line represents the predicted trend with a planned annual decline of 3.4%.
Sustainability 06 08262 g006

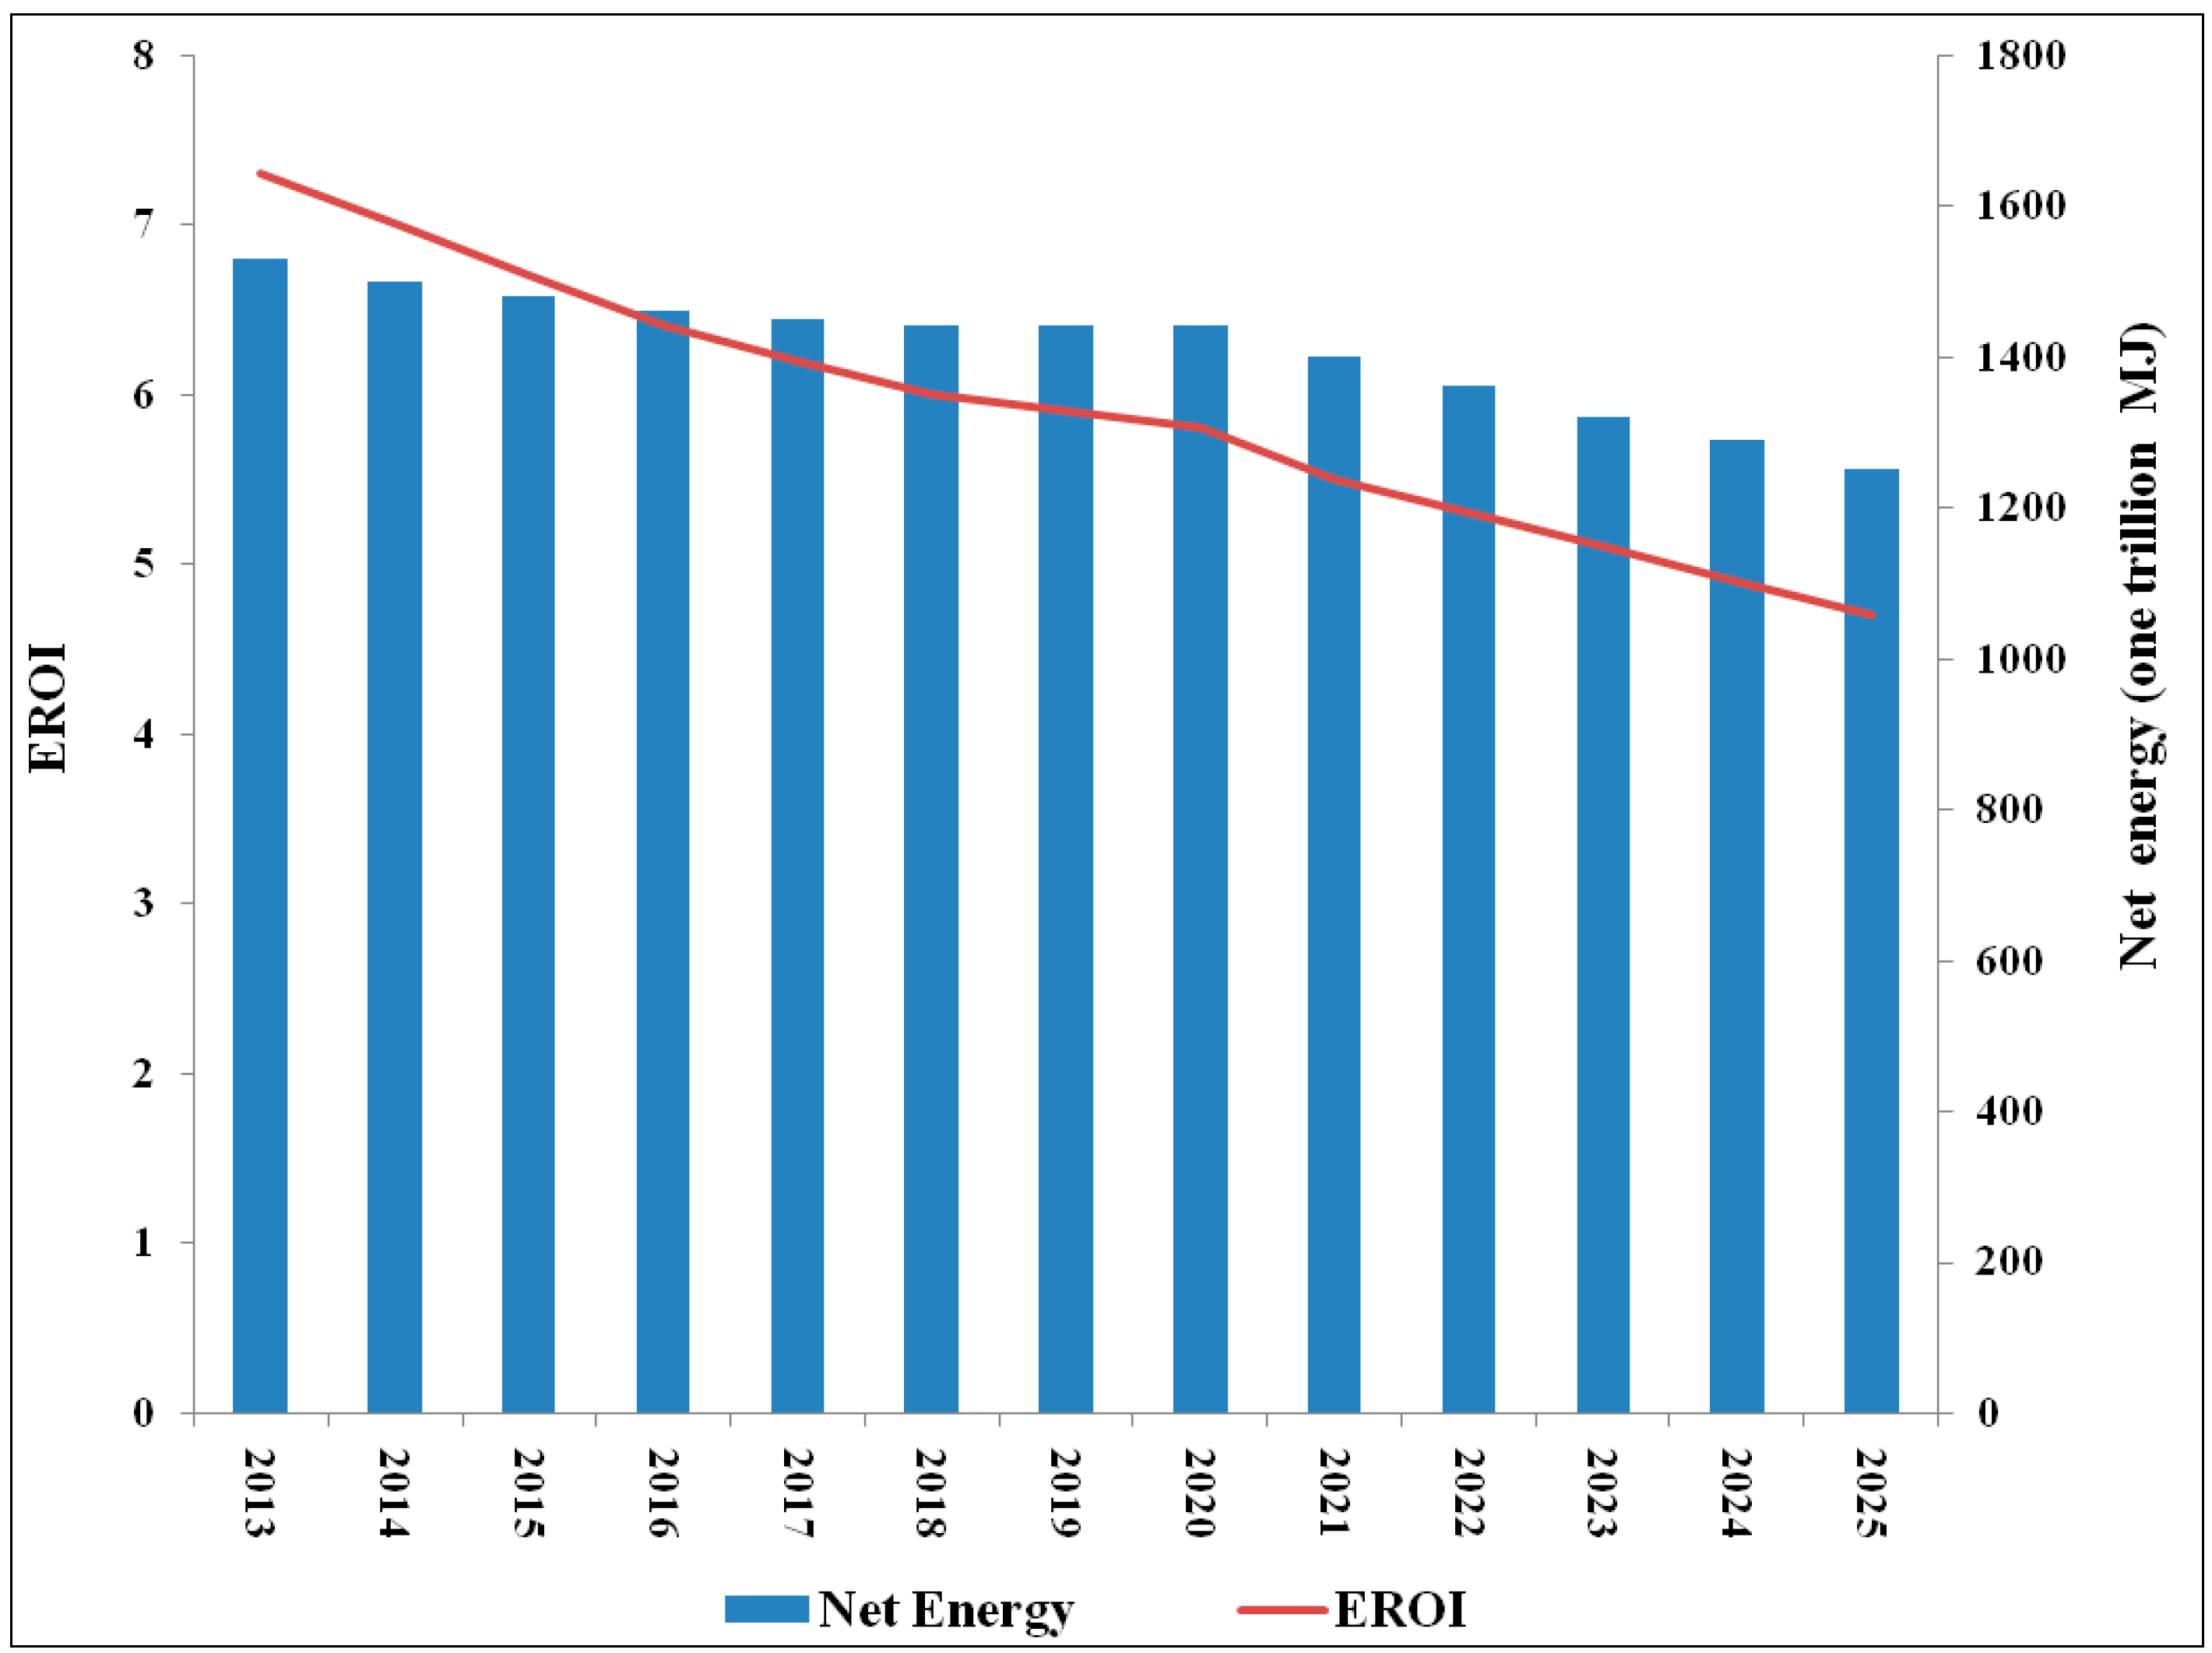
3. Forecast Results of Daqing’s EROI and Net Energy

Of the total oil and gas production estimates previously mentioned, the two low scenarios are referred to as the Low Production Scenario and the two high scenarios are referred to as the High Production Scenario. Using the input estimated above (as heat equivalence) and the energy intensity of the Low Intensity Scenario, Daqing’s EROI and net energy for 2013 to 2025 can be forecast by the application of Equation (3). This time series becomes our Base Scenario (Low Production–Low Intensity Scenario), as shown in Table 1.
Table 1. Forecast results of EROIs and net energy of the Daqing oilfield from 2013–2025 as the Base Scenario.
2013201420152016201720182019202020212022202320242025
Production (1012 MJ)1.771.751.741.731.721.721.731.751.711.681.651.621.59
EROI7.37.06.76.46.26.05.95.85.55.35.14.94.7
Net energy (1012 MJ)1.531.501.481.461.451.441.441.441.401.361.321.291.25
Overall, during the period for which the data are reasonably forecasted, the EROI results show a constant decrease from 7.3 in 2013 to 4.7 in 2025 and corresponding net energy reductions (see Figure 7). The annual declines of 4% for EROI and 2% for the net energy are caused by increasingly more difficult development conditions that require greater annual energy, capital, and labor investments.
Figure 7. Forecast results of Daqing’s EROI and net energy from 2013–2025.
Sustainability 06 08262 g007
The Base Scenario (Low Production–Low Intensity) and the forecasted EROIs for the other three scenarios (High Production–Low Intensity; High Production–High Intensity; and Low Production–High Intensity) are shown in Figure 8. The results show that, based on the planned production, the predicted EROI is approximately 7% higher and constant energy intensity is 20% lower. These predictions indicate that the EROI will decline even if the oil production remains steady.
Figure 8. Forecasted EROIs for four scenarios.
Sustainability 06 08262 g008

4. Relating EROI and MROI Analyses

4.1. Implications of Daqing’s EROI and MROI

We have thus far described the net energy necessary to physically support an energy producing entity (EPE, e.g., a firm or national oil company). Thus, from the energy production perspective, an EPE with a relatively high EROI can take full advantage of the net energy to continue its economic activities and perform social functions. The energy provided for society will be zero once the net energy drops to zero, which would seriously restrict the petroleum industry. However, in the short-term, compared with net energy, entrepreneurs and policymakers pay more attention to economic implications because chronic losses usually directly cause business failures for all types of enterprises. Generally, an EPE’s production activities closely relate to its profits, and the main production constraint is insufficient profits with little regard for inadequate net energy and low EROI.
King and Hall [39] indicated that EROI has a profound influence on production profits, and they analyzed the implicit relationship between EROI and MROI, where price is the intermediate factor connecting the two indices. As the difficulty of producing oil increases, EROI declines. Therefore, more oil and other input products are needed to reach deeper oil resources such that the input products that depend on oil for production and shipping become more expensive in terms of money and energy. As a result, the EROI is reduced and the cost to produce the same quantity of oil increases. King et al. derived Equation (12), which expresses the underlying relationship between EROI, price, and MROI. The equation can be used to build a framework for projecting Daqing’s MROI trends.
p o i l = M R O I × e i E R O I × E i n s
where e i is the oil conversion factors from physical units to thermal units, 41.8 MJ/kg from China Energy Statistical Yearbook 2009 [40]. Using Equation (13), we can estimate the oil price trend when Daqing proposes a desired MROI. We divide the EROI and Eins in the Base Scenario from 2010 to 2025 into three groups based on the average arithmetic progression of Eins:
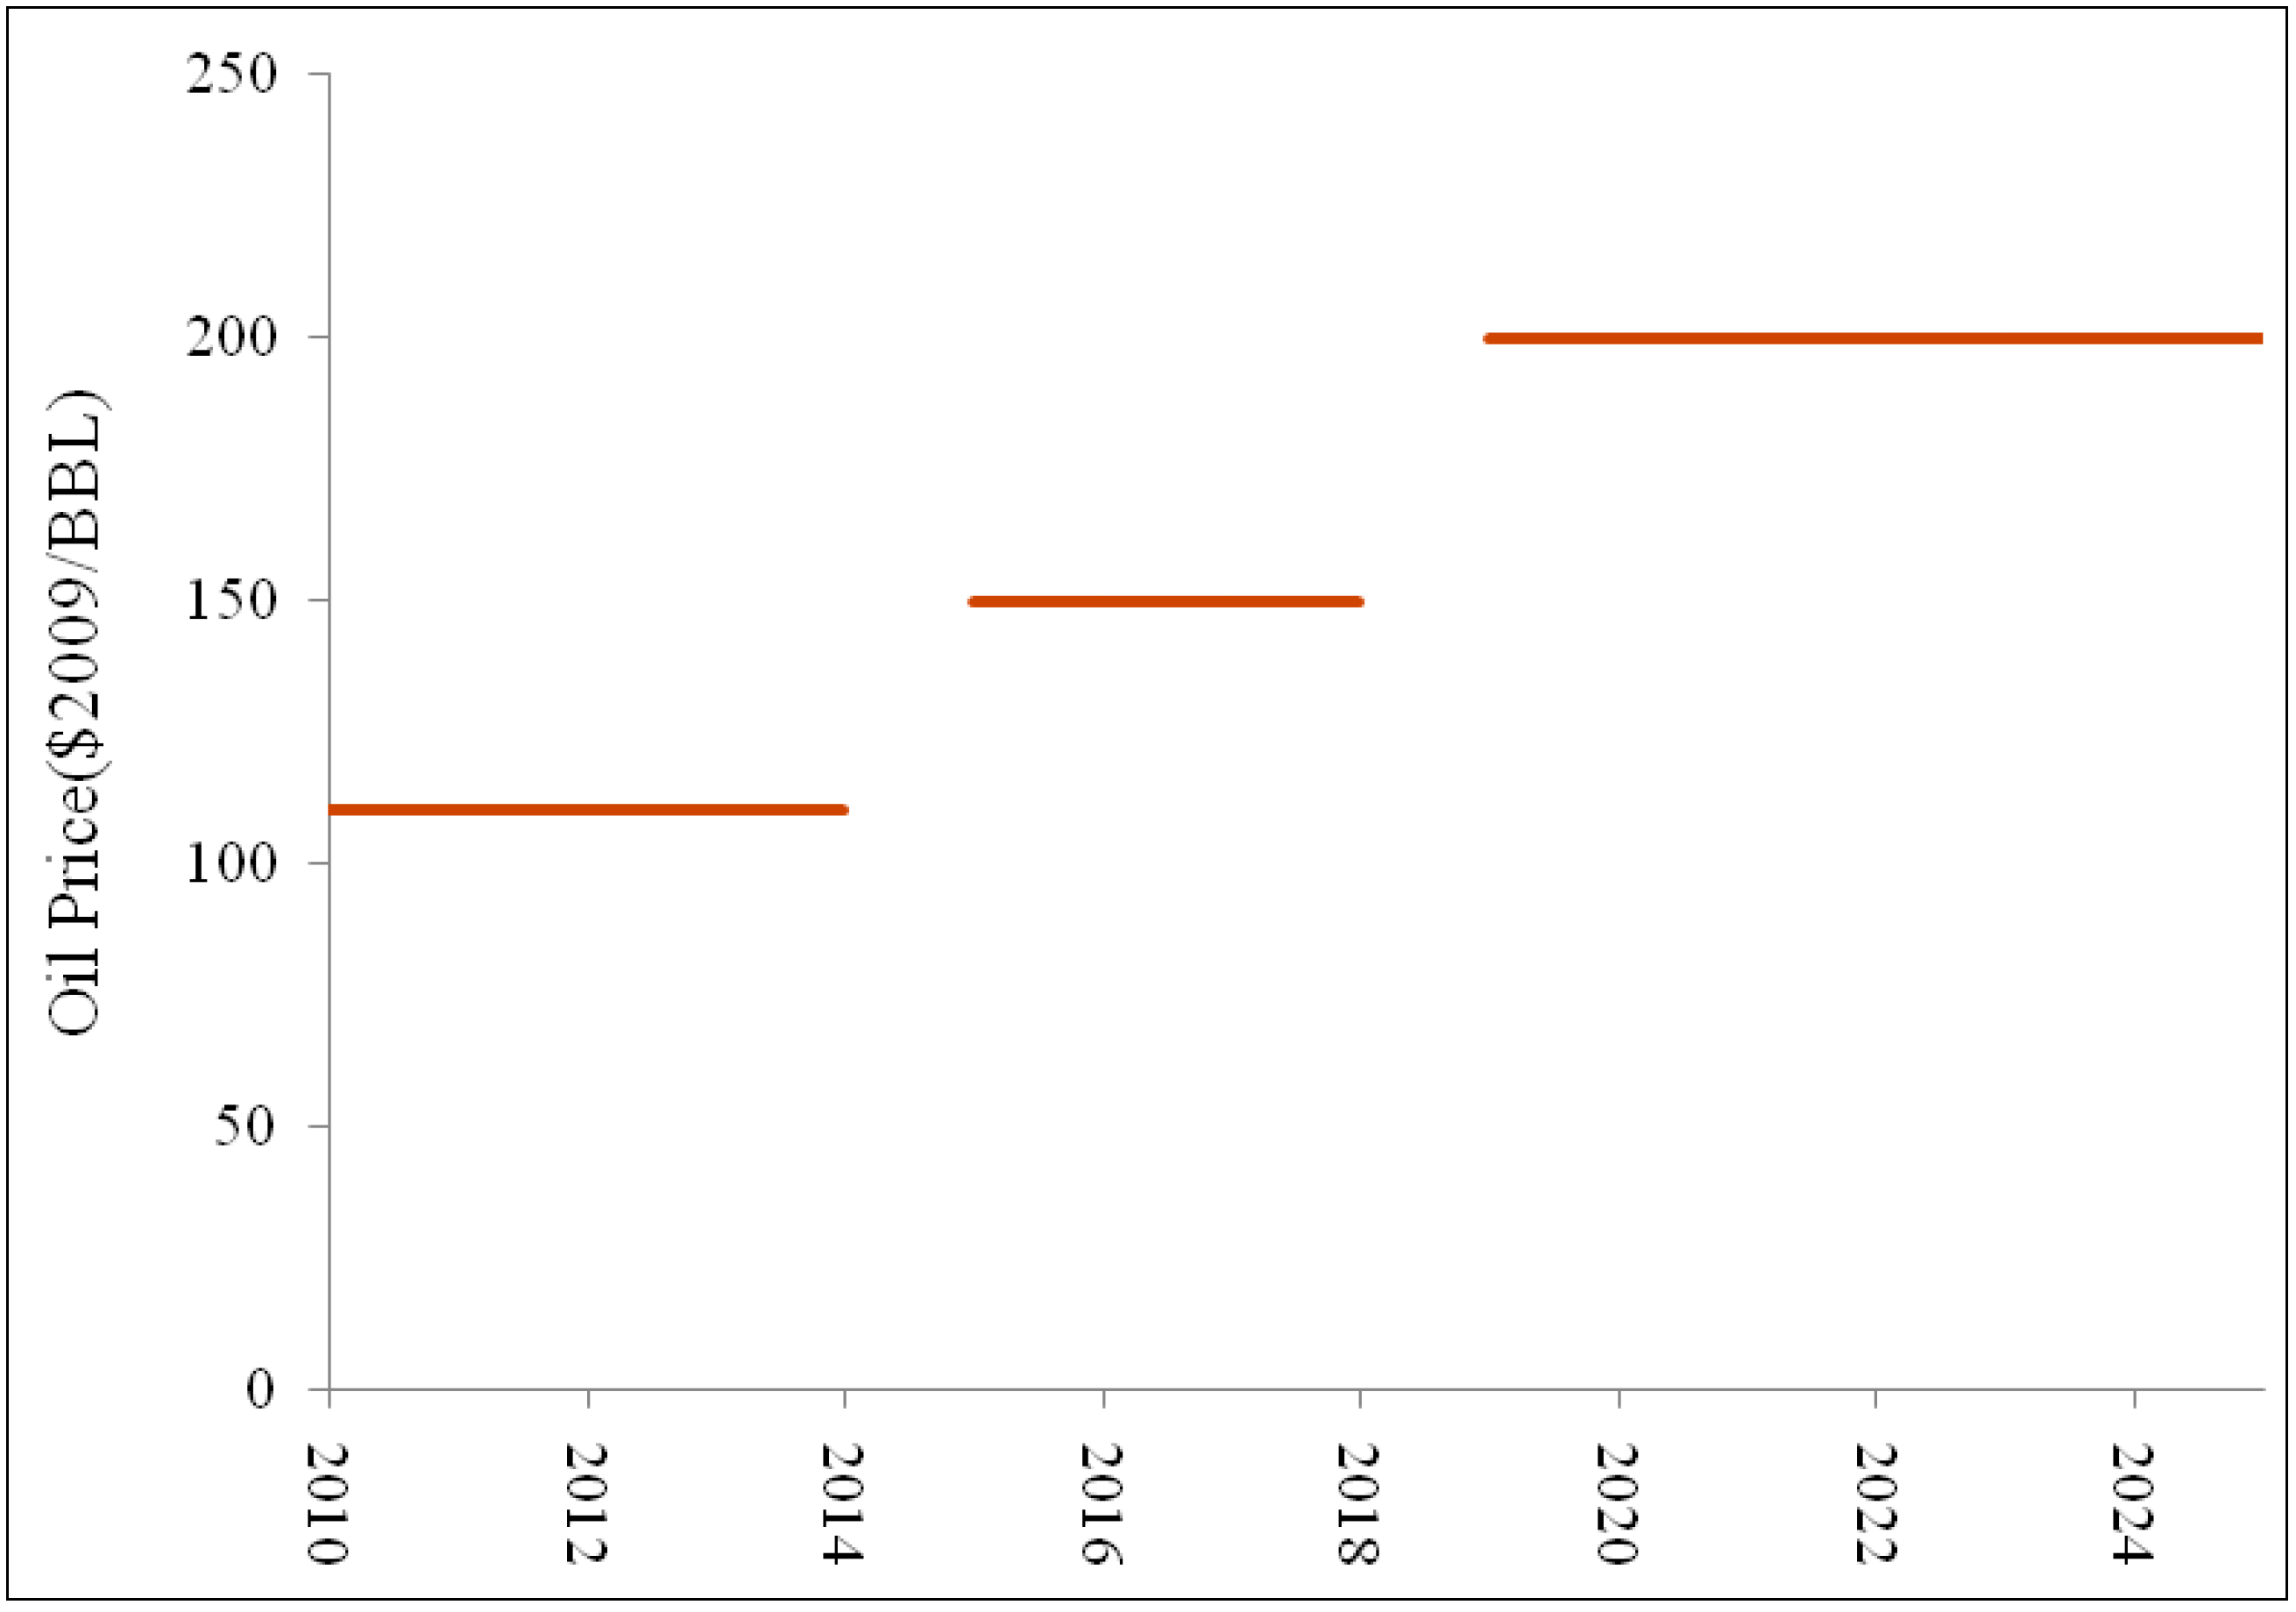
  • Group 1 with Eins =3.5 MJ/yuan and EROI = 7.3 for 2010–2014;
  • Group 2 with Eins =3.0 MJ/yuan and EROI = 6.4 for 2015–2018;
  • Group 3 with Eins =2.5 MJ/yuan and EROI = 5.3 for 2019–2025.
Note that Daqing has a relatively higher MROI than the U.S. (as stated by King et al. [37]) due to its lower unit cost of oil and gas production. This finding reflects Daqing’s realized economies of scale over its long history.
Figure 9 illustrates an example reflecting the correlation between the desired oil prices when MROI = 3.0 for the three time groups. The red line shows that if Daqing expects an MROI of 3.0 from 2019 to 2025, then the corresponding oil price must rise to approximately $200 ($2009/BBL). However, the same desired MROI from 2015 to 2018 requires an oil price of $150 ($2009/BBL), while that from 2010 to 2014 requires only $110 ($2009/BBL).
Figure 9. The relationship between the average desired oil price when MROI = 3.0 for Daqing.
Sustainability 06 08262 g009

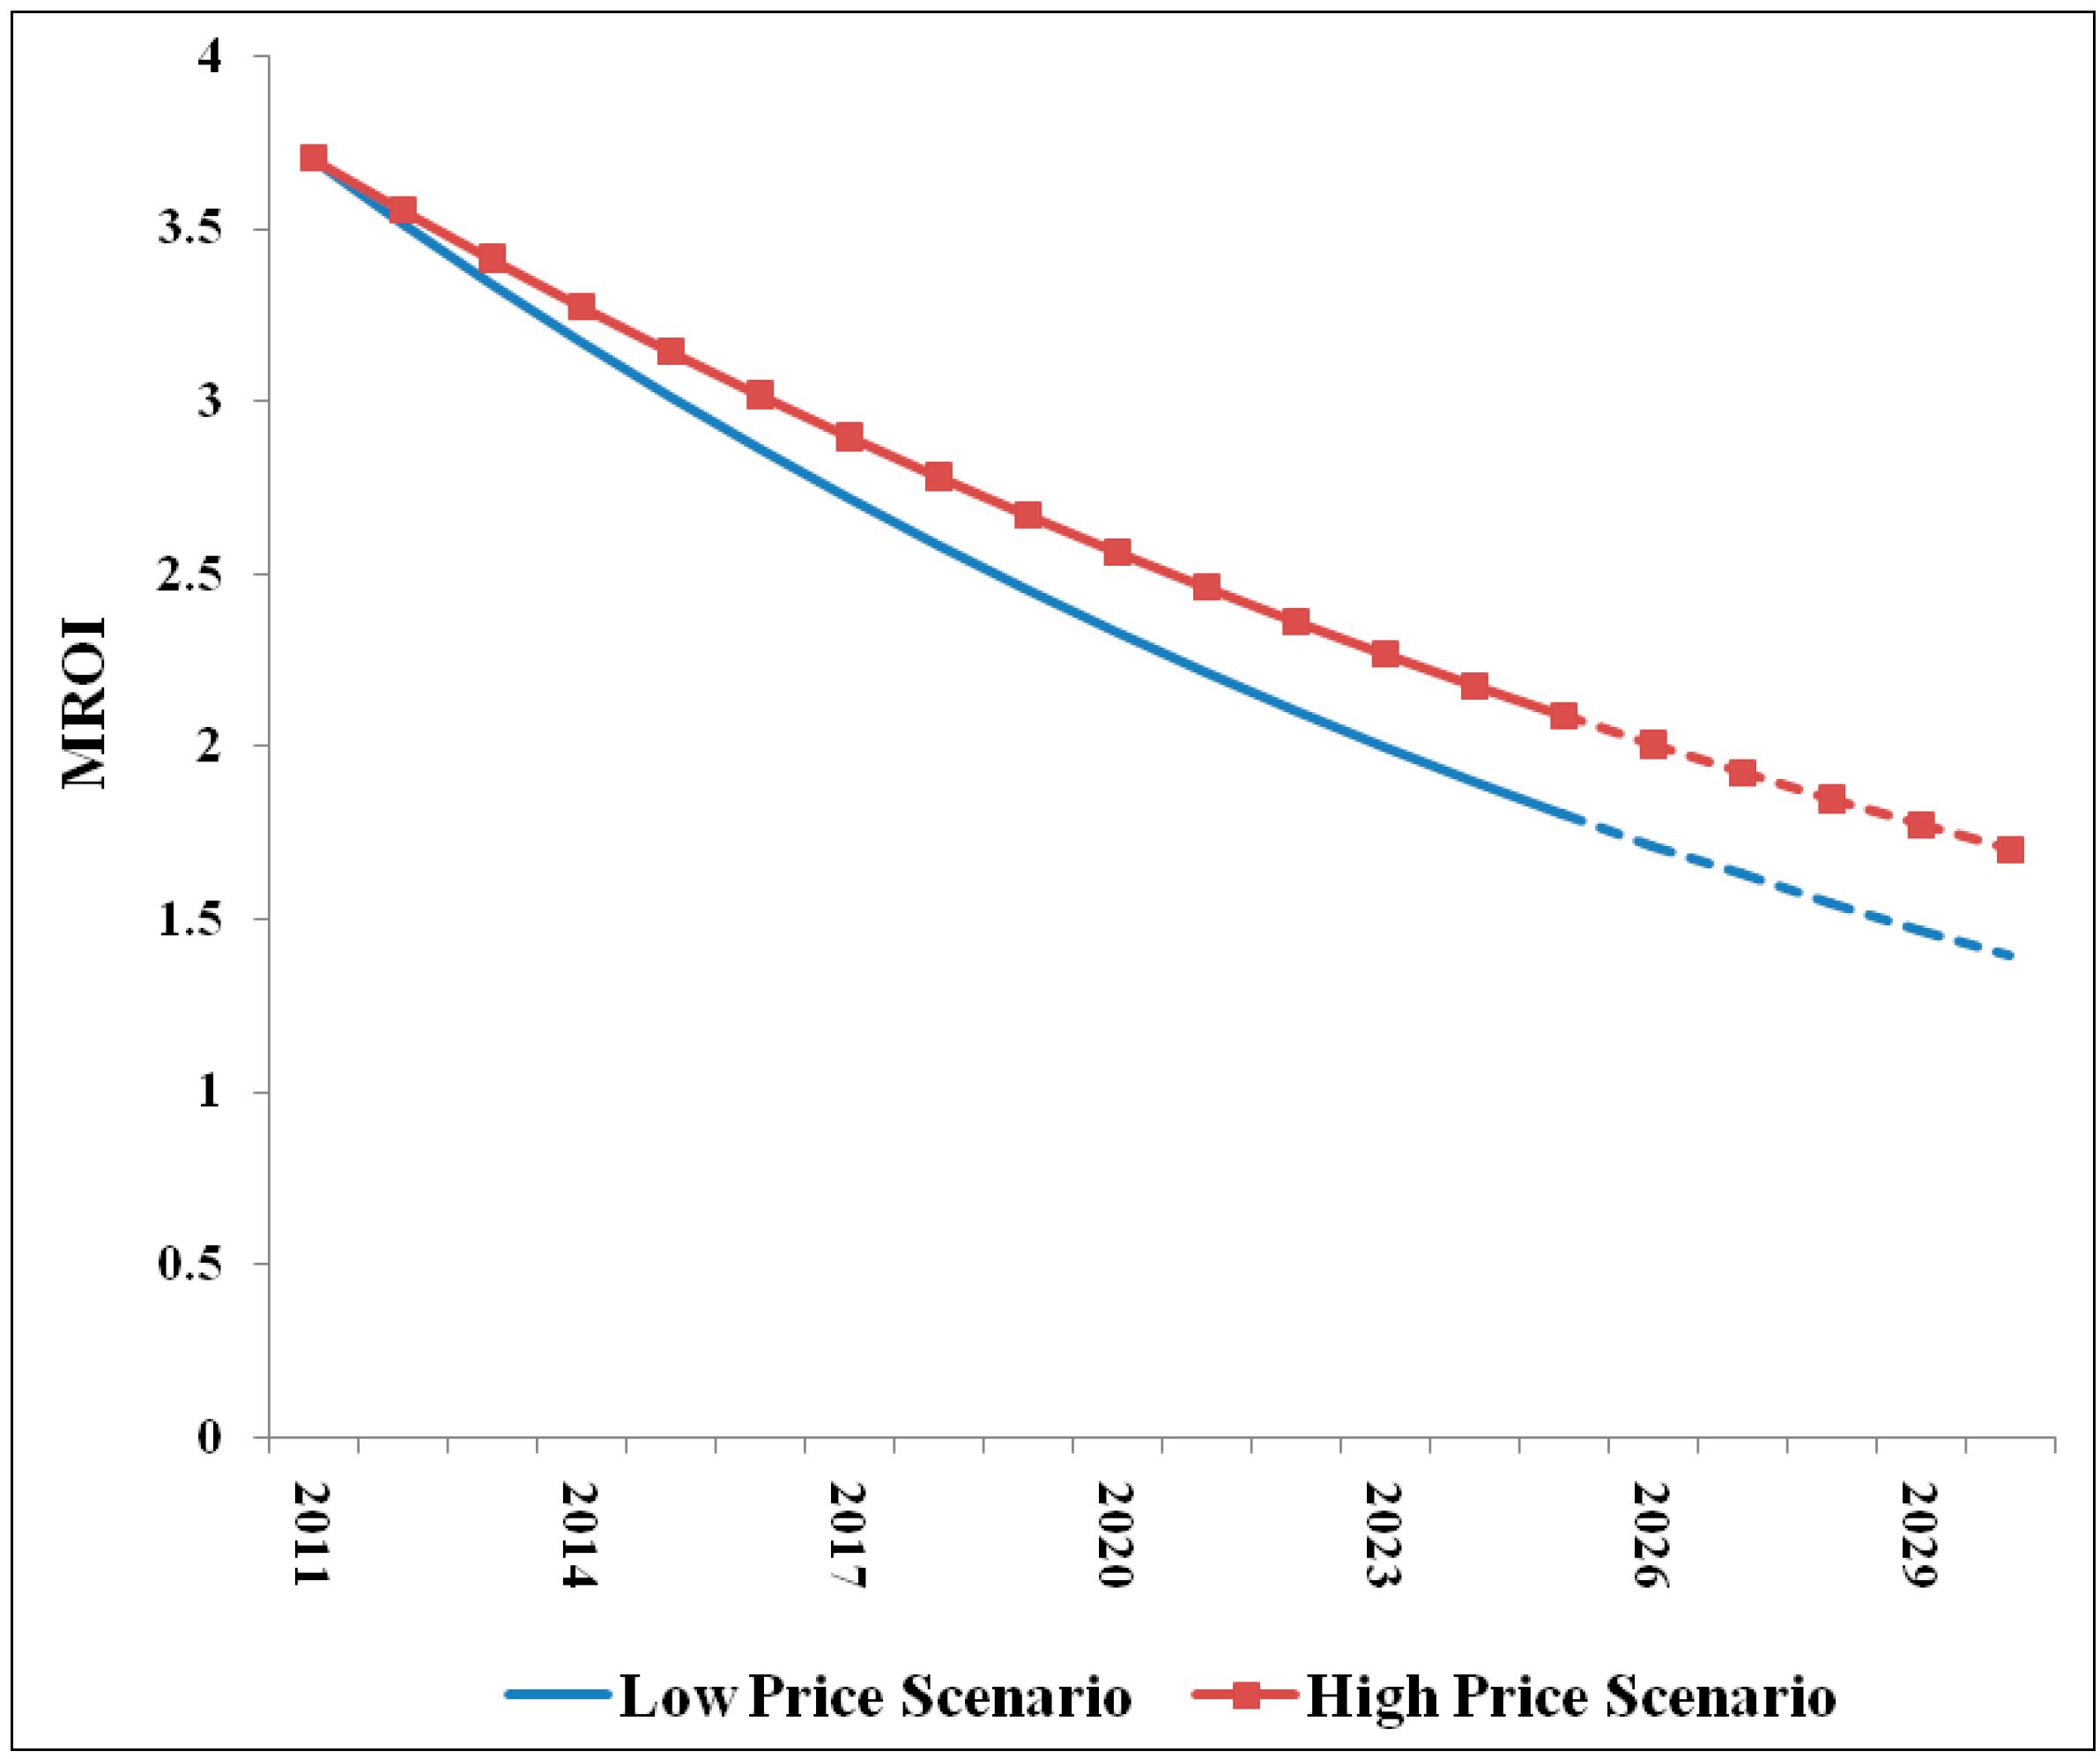
4.2. Forecasting Daqing’s MROI

By establishing a functional relationship between the estimated EROI and time, we can estimate the yearly MROI from 2013 to 2025. According to the forecast, Eins will decline by a rate of approximately 4% per year from 2011 to 2025, so we can construct the formula as:
E i n s = 3.8 × 0.96 t 2011
where the units for Eins are MJ/yuan. Substituting Equation (14) into Equation (13), we obtain Equation (15):
MROI = P ( t ) × 0.032 × 0.93 t 2011
where P(t) represents the oil price ($/BBL) as a function of time. The price of Daqing oil follows the Minas crude oil price, and the RMB exchange rate against the dollar remains at 6:1. World Energy Outlook 2013’s [38] New Policies Scenario indicates that international nominal oil prices will rise to $156 per barrel by 2025 at an annual growth rate of 2.2%. If we use this growth rate as the rise in Daqing’s oil price and assume the Low Price Scenario, then:
P ( t ) = 115.9 × 1.022 t 2011
where the units of P(t) are yuan/kg. Substituting Equation (16) into Equation (15), we obtain Equation (17):
M R O I = 3.7 × 0.95 t 2011
We also refer to World Energy Outlook 2013’s Current Policies Scenario, in which the price of oil rises 3.2% per year:
M R O I = 3.7 × 0.96 t 2011
Figure 10 illustrates the MROI trends of the two scenarios, in which the decreases of 5% and 4% reach 1.8 and 2.1, respectively. Considering the EROI trend of the High Production Scenario, we find that Daqing’s MROI changes so minimally that there is no need to distinguish it between the two scenarios.
Figure 10. Forecast trend of Daqing’s MROI by year.
Sustainability 06 08262 g010

5. Discussion

5.1. Forecast of the Production Status by EROI and MROI

Hall et al. [20] proposed the “law of minimum EROI”—the minimum energy output necessary from energy development for maintaining normal economic and social activities. Considering all of the processes that exist in energy production, transportation, refining, and sales, EROI must be kept above 3.0 to provide sufficient energy for society. In the Low Production–High Intensity Scenario, Daqing’s EROI will hit 3.0 in 2024 (see Figure 8); at that point, the production limit is reached and no energy is available for society beyond the energy required forthe oilfield itself.
In contrast to the “law of minimum EROI” due to the different activities of EPEs, a lower limit for MROI has not been established. Although the MROI of Daqing is currently 3.5, the minimum MROI for Daqing is assumed to be 2.0 considering the foreseeable effects on the environment and the speed at which the MROI declines. When Daqing’s MROI falls below 2.0, Daqing will encounter severe economic constraints unless a new wave of high prices or subsidies is introduced.
Combining the forecasts of the MROI and EROI, we find that by 2025, Daqing will encounter both the economic pressures of the declining MROI and the energy pressure of the declining EROI in the Low Production–High Intensity Scenario.

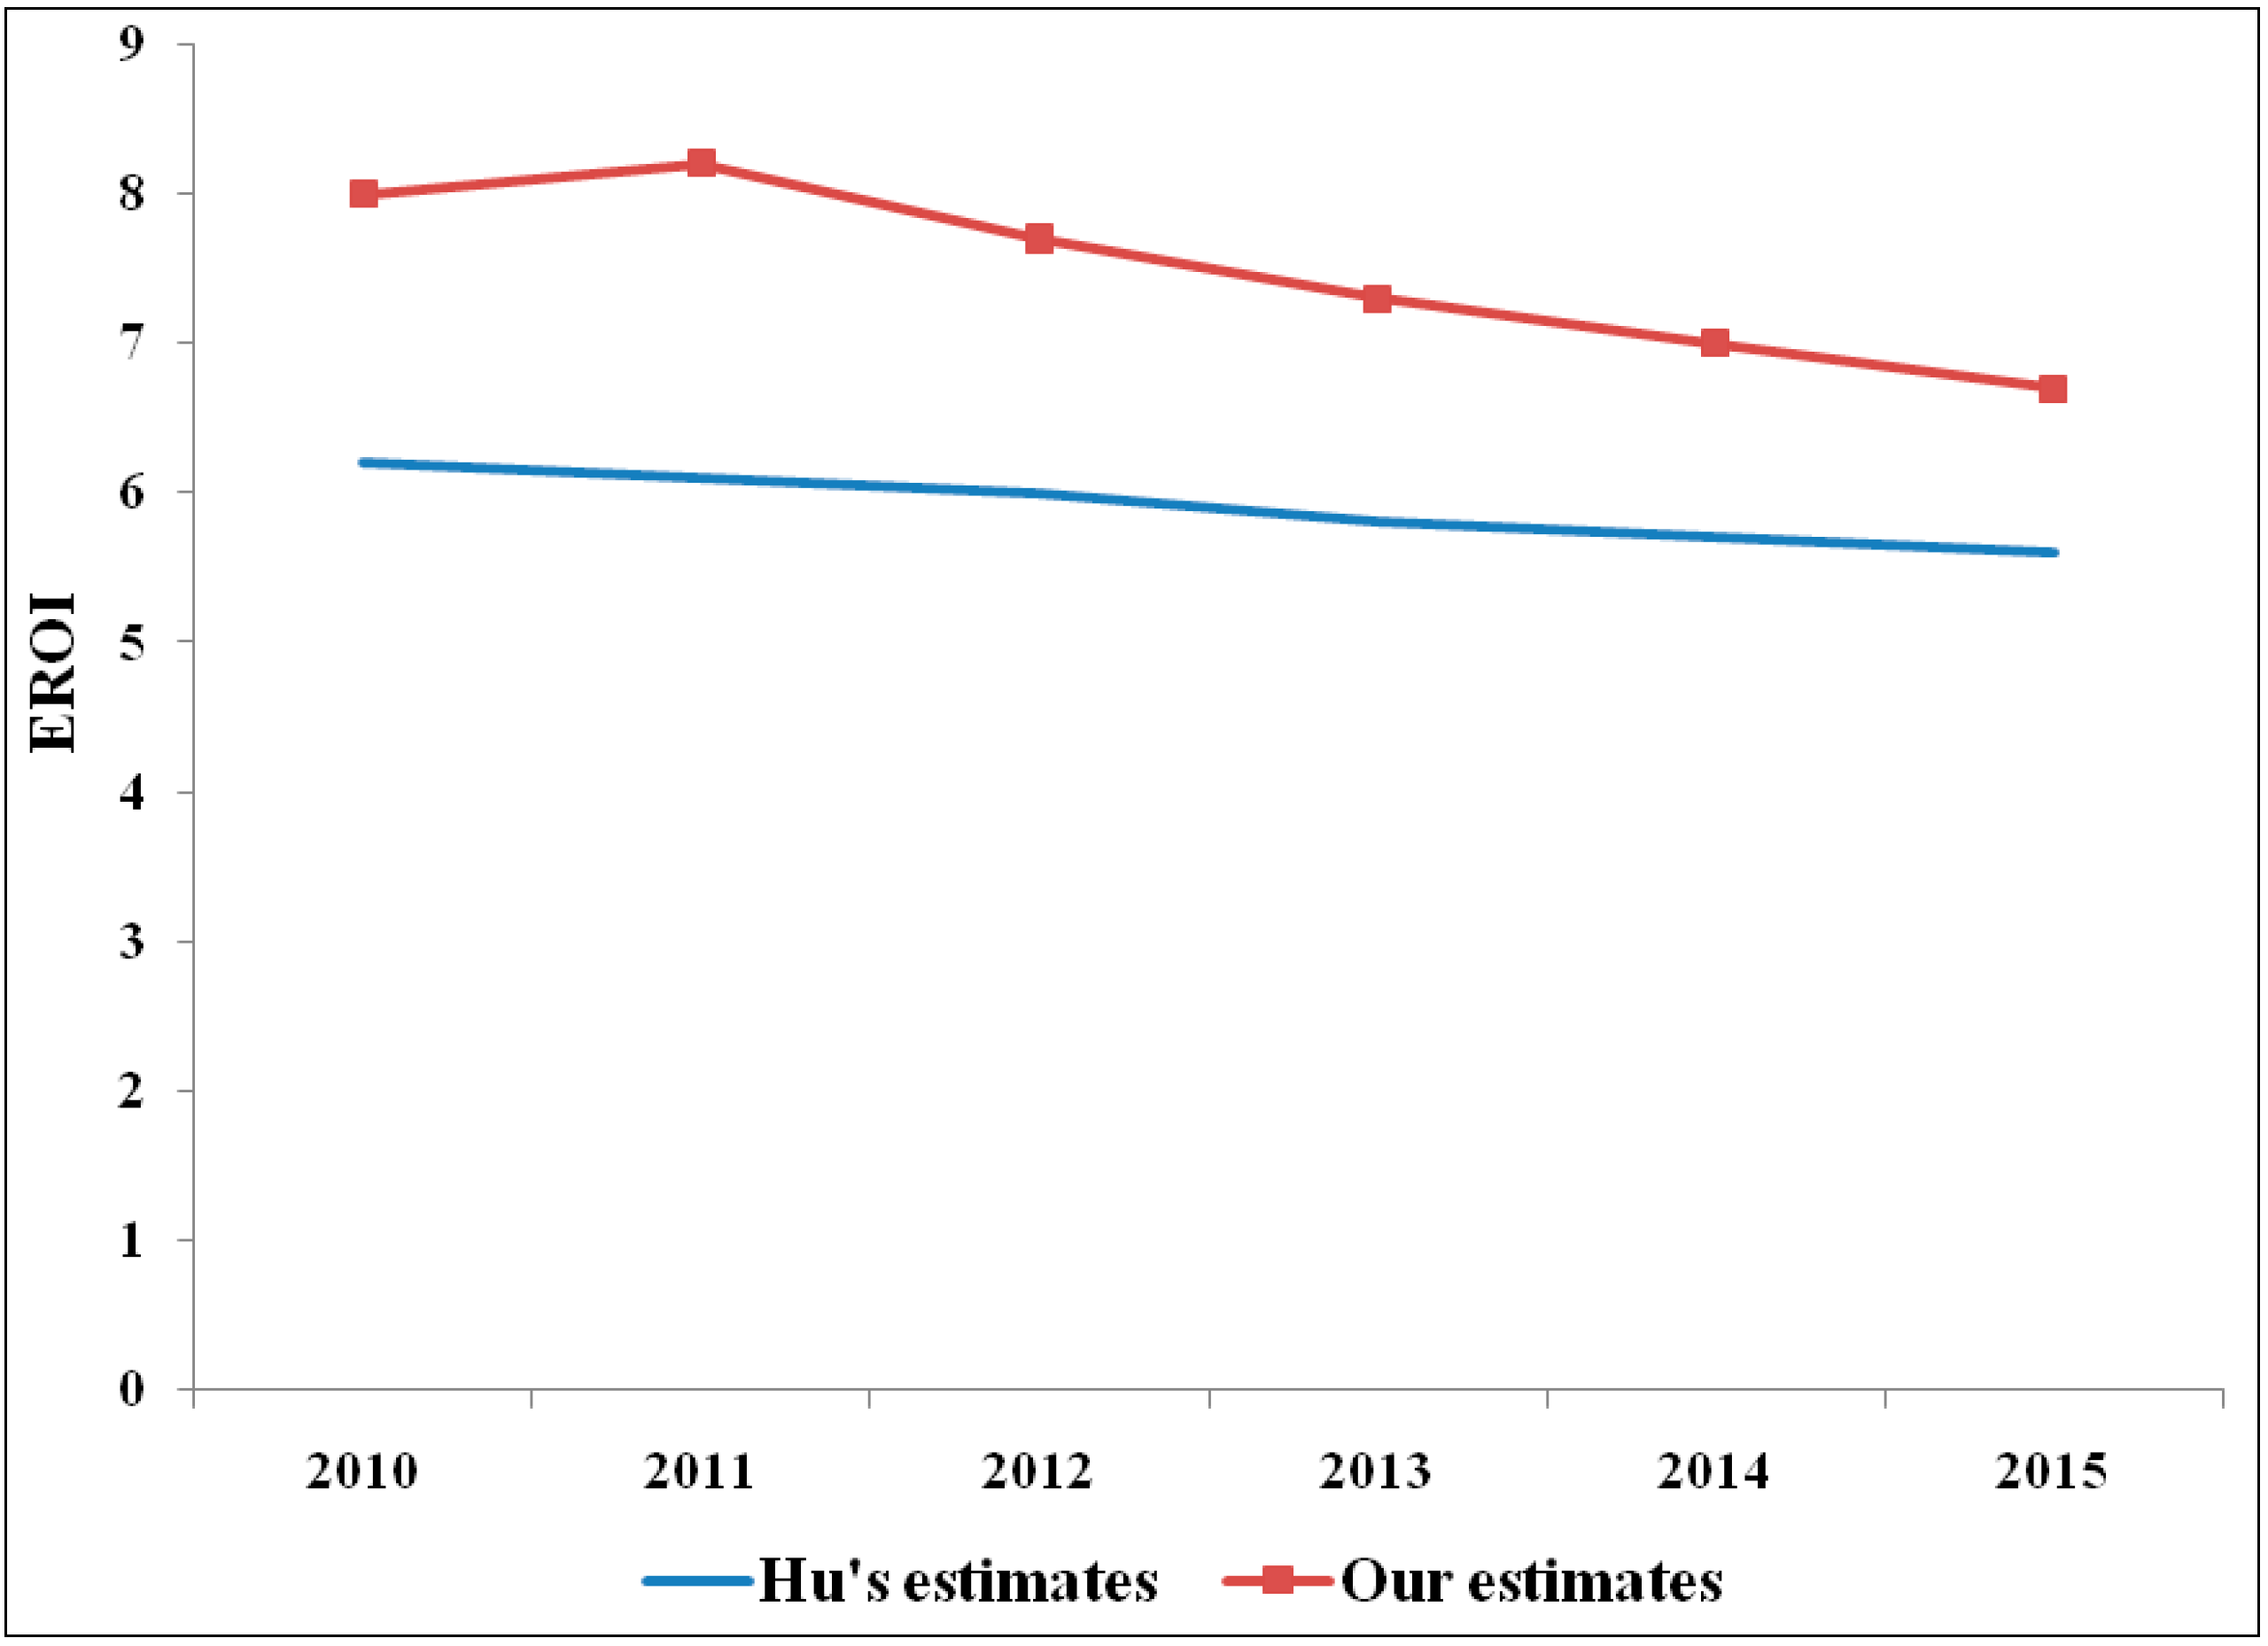
5.2. Comparison with Previous Estimates for the Daqing Oil Field

Hu et al. [19] constructed an EROI time series for Daqing from 2001 to 2009 and estimated the values up to 2015 using a simple extrapolation method (see Figure 11). However, if we use Equation (3) to estimate the EROI, then discrepancies exist between our study and Hu et al.’s study, with the largest discrepancy reaching 2.1. The discrepancy arises because we consider more factors and more complex predictions regarding production and costs. If we follow Hu et al.’s trend, Daqing’s EROI will drop to remarkably low levels—below 3.0—in the next few years. Hu et al.’s linear extrapolation of Daqing’s production may indicate that Daqing’s rate of decline is accelerating to such a degree that their estimated energy outputs are less than the amount we expect here. Furthermore, the extrapolation method neglects the continuous declining energy intensity when monetary costs increase and likely leads to an exaggerated energy input. As a result, the underestimated numerator and overestimated denominator cause a relatively lower estimated EROI. In summary, a preferred long-term forecast approach would incentivize research development of an accurate EROI that will help researchers and policymakers plan Daqing’s future.
Figure 11. Comparison of our EROI estimates with a previous study [16].
Sustainability 06 08262 g011

5.3. The Sensitivity of Daqing’s EROI and MROI

According to Equation (4), EROI is directly proportional to production and inversely proportional to energy intensity. Comparing the four scenarios (see Figure 8), we find that production and energy intensity greatly influence the sensitivity of Daqing’s EROI, first by varying energy production (high or low) and then by decreasing (or not decreasing) intensity factors. For the same energy intensity scenarios, a High Production Scenario that rapidly increases natural gas production to compensate for the decreasing oil production results in a higher EROI but a more gradual decline. Similarly, in the same production scenarios, the Low Intensity Scenarios increase EROI, which delays the time it takes the EROI to decrease to 3.0. Therefore, to prevent the EROI for the Daqing oilfield from declining to 3.0 too quickly, efforts to improve its production will be indispensable, particularly in terms of natural gas production, due to its immense resource potential. For the nation, reducing the national energy intensity is also critical to obtaining a high EROI because it directly reduces the energy input for petroleum extraction, even those inputs from other industries.
Table 2 illustrates that the MROI is most sensitive to oil prices; therefore, we can assess the differences in the individual oil price scenarios. However, when Equations (15) and (17) are obtained, the ratio of the production to the monetary costs is assumed to be fixed at one point in time. Therefore, given this premise, fluctuations in oil prices may greatly impact Daqing’s future MROI value. Additionally, we regard Daqing’s EROI and oil price as independent variables, in which the oil price is exogenous. Therefore, it is important to consider our work within a global context and to build upon other analyses, including Heun’s [41] study of the quantitative relationship between oil prices and EROI.
Table 2. Daqing’s EROI and MROI in the different scenarios in 2025.
High Oil PriceLow Oil Price
High Production–High Intensity ScenarioEROI = 3.5; MROI = 2.1EROI = 3.5; MROI = 1.8
High Production–Low Intensity ScenarioEROI = 5.7; MROI = 2.1EROI = 5.7; MROI = 1.8
Low Production–High Intensity ScenarioEROI = 2.9; MROI = 2.1EROI = 2.9; MROI = 1.8
Low Production–Low Intensity ScenarioEROI = 4.7; MROI = 2.1EROI = 4.7; MROI = 1.8

6. Conclusions

Overthe past ten years, the decline in Daqing oilfield’s EROI and net energy could not be prevented, even though China’s exploration and development technology have progressed substantially. Presently, we need to understand how important net energy and EROI are to describe numerically how much energy remains to power a modern industrial society after energy extraction, processing, and delivery.
We emphasize in the Base Scenario results that Daqing’s EROI decreases from 7.3 in 2012 to 4.7 in 2025 at a rate of nearly 4% per year. This trend is in accord with the EROI decline experienced by other giant oilfields around the world. During the same period, Daqing’s net energy decreases from 1.53 × 10¹² MJ to 1.25 × 10¹² MJ. A large decline in the energy intensity contributes to a declining rate in the monetary investment per embodied energy unit (measured in joules); thus, the EROI performance improves.
Meanwhile, a declining EROI results in a lower MROI. Combining EROI and MROI, the future of Daqing’s production is largely decided by three main factors: oil price, oil and gas production, and energy intensity. Oil prices directly reflect the economic sustainability of Daqing measured by the MROI, and these prices fluctuate in the international market, not in China. For oil and gas production, if depletion is a more powerful factor than the current technological improvements, then Daqing must confront the dilemma that its growing production will depend on a lower quality, but more expensive energy resource, which requires higher energy and material inputs. However, the reduction in the energy intensity will also be helpful for releasing the bearish EROI tension. The Chinese government is promoting energy intensity reduction as a national energy strategy and putting tremendous pressure on China’s industrial sector to achieve this lofty target quickly.
Daqing is experiencing both an EROI decline and an associated MROI decrease, which shows a risk of unsustainable fossil resource use. Therefore, Daqing must be able to foresee, understand, and plan for changes in its broad energy landscape, particularly during what researchers have characterized as post-peak oil production. Furthermore, sustainability can be effectively addressed by the emergence of a new field: Transition Engineering, which guides humans to a different thinking and good solutions to climate change, peak oil, and other environmental risks. It emerges as the way by which society reduces both fossil fuel use and the detrimental social and environmental impacts of industrialization [42,43]. Though it is still in its infancy, it should be investigated as a good direction for governments, scientists, scholars and even ordinary people.

Acknowledgments

This study has been supported by the National Natural Science Foundation of China (Grant No. 71373285/71303258) and the National Social Science Foundation of China (Grant No. 11&ZD164/13&ZD159). We are grateful to our editor, Margaret F. Sadler. Helpful comments by anonymous reviewers would be most appreciated.

Author Contributions

Bo Xu, Lianyong Feng, William X. Wei designed research; Bo Xu, Lianyong Feng, William X. Wei, Yan Hu, and Jianliang Wang performed research; Bo Xu, Lianyong Feng, William X. Wei, Yan Hu, and Jianliang Wang analyzed data; and Bo Xu, Lianyong Feng, William X. Wei, Yan Hu, and Jianliang Wang wrote the paper.

Conflicts of Interest

The authors declare no conflict of interest.

References

  1. Wang, Y. Catching hold of historical opportunities, establishing a hundred-year oilfield. Pet. Geol. Oilfield Dev. Daqing 2004, 23, 3–4. [Google Scholar]
  2. China National Petroleum Corporation. The Daqing Oilfield Sustainable Development Program; China National Petroleum Corporation: Daqing, China, 2012. [Google Scholar]
  3. Meng, Q.A.; Bentley, R.W. Global oil peaking: Responding to the case for “abundant supplies of oil”. Energy 2008, 33, 1179–1184. [Google Scholar] [CrossRef]
  4. Tang, X.; Zhang, B.; Höök, M.; Feng, L. Forecast of oil reserves and production in Daqing oilfield of China. Energy 2010, 35, 3097–3102. [Google Scholar] [CrossRef]
  5. Höök, M.; Tang, X.; Pang, X.P.; Aleklett, K. Development journey and outlook of Chinese giant oilfields. Pet. Explor. Dev. 2010, 37, 237–249. [Google Scholar] [CrossRef]
  6. Li, J.; Guo, S.; Chen, Z. A study of the incremental trend of the reserves in the Daqing oilfield and its controlling factors. Earth Sci. Front. 2009, 16, 379–383. [Google Scholar] [CrossRef]
  7. Brandt, A.R.; Dale, M. A general mathematical framework for calculating systems-scale efficiency of energy extraction and conversion: Energy return on investment (EROI) and other energy return ratios. Energies 2011, 4, 1211–1245. [Google Scholar] [CrossRef]
  8. Odum, H.T. Energy, Ecology, and Economics. AMBIO 1973, 2, 220–227. [Google Scholar]
  9. Bardiand, U.; Lavacchi, A. A Simple Interpretation of Hubbert’s Model of Resource Exploitation. Energies 2009, 2, 646–661. [Google Scholar] [CrossRef]
  10. Hall, C.A.S.; Cleveland, C.J.; Berger, M. Energy return on investment for United States petroleum, coal and uranium. In Energy and Ecological Modeling; Mitsch, W., Ed.; Elsevier: Amsterdam, The Netherlands, 1981; pp. 715–724. [Google Scholar]
  11. Dale, M.; Krumdieck, S.; Bodger, P. Net energy yield from production of conventional oil. Energy Pol. 2011, 39, 7095–7102. [Google Scholar] [CrossRef]
  12. Dale, M.; Krumdieck, S.; Bodger, P. A dynamic function for energy return on investment. Sustainability 2011, 3, 1972–1985. [Google Scholar] [CrossRef]
  13. Gagnon, N.; Hall, C.A.S.; Brinker, L. A preliminary investigation of energy return on energy investment for global oil and gas production. Energies 2009, 2, 490–503. [Google Scholar] [CrossRef]
  14. Cleveland, C.J. Net energy from the extraction of oil and gas in the United States. Energy 2005, 30, 769–782. [Google Scholar] [CrossRef]
  15. Hall, C.A.S.; Cleveland, C.; Kaufmann, R.K. Energy and Resource Quality: The Ecology of the Economic Process; Wiley-Interscience: New York, NY, USA, 1986; p. 577. [Google Scholar]
  16. Freise, J. The EROI of conventional Canadian natural gas production. Sustainability 2011, 3, 2413–2432. [Google Scholar] [CrossRef]
  17. Poisson, A.; Hall, C.A.S. Time Series EROI for Canadian Oil and Gas. Energies 2013, 6, 5940–5959. [Google Scholar] [CrossRef]
  18. Feng, L.; Hu, Y.; Hall, C.A.S.; Wang, J. The Chinese Oil Industry: History and Future; Springer: New York, NY, USA, 2013. [Google Scholar]
  19. Hu, Y.; Feng, L.; Hall, C.A.S.; Tian, D. Analysis of the energy return on investment (EROI) of the huge Daqing oil field in China. Sustainability 2011, 3, 2323–2338. [Google Scholar] [CrossRef]
  20. Hall, C.A.S.; Balogh, S.; Murphy, D.J.R. What is the minimum EROI that a sustainable society must have? Energies 2009, 2, 25–47. [Google Scholar] [CrossRef]
  21. Murphy, D.J.; Hall, C.A.S.; Dale, M.; Cleveland, C.J. Order from chaos: A preliminary protocol for determining the EROI of fuels. Sustainability 2011, 3, 1888–1907. [Google Scholar] [CrossRef]
  22. Smil, V. Energy in Nature and Society: General Energetics of Complex Systems; The MIT Press: Cambridge, MA, USA, 2008; p. 480. [Google Scholar]
  23. Yuanqian, C. The classification, contrast and evaluation of water drive curve method. Xinjiang Pet. Geol. 1994, 15, 348–355. (In Chinese) [Google Scholar]
  24. Qitai, Y. Characteristics of oil water seepage flow for several important water drive curves. Acta Petrolei Sin. 1999, 20, 56–60. [Google Scholar]
  25. Hubbert, M.K. Techniques of prediction as applied to production of oil and gas. In Proceedings of the Oil and Gas Supply Modeling Symposium, Washington, DC, USA, 18–20 June 1980; Gass, S.I., Ed.; Department of Commerce: Washington, DC, USA, 1982; pp. 16–141. [Google Scholar]
  26. Wenbo, W. The Foundation of the Forecasting Theory; The Press of the Petroleum Industry: Beijing, China, 1984. (In Chinese) [Google Scholar]
  27. Hu, J.; Zhang, D. Symposium of Practical Forecasting Method for Oil and Gas Reservoir Engineering; The Press of the Petroleum Industry: Beijing, China, 2002. [Google Scholar]
  28. Feng, L.; Li, J.; Pang, X. China’s oil reserve forecast and analysis based on peak oil models. Energy Pol. 2008, 36, 4149–4153. [Google Scholar] [CrossRef]
  29. Arps, J.J. Analysis of Decline Curves. Trans. Am. Inst. Min. 1945, 160, 228–247. [Google Scholar]
  30. Arps, J.J.; Mortada, M.; Smith, A.E. Relationship between proved reserves and exploration effort. In Proceedings of the SPE 45th Annual Fall Meeting, Houston, TX, USA; 1970; p. 5. [Google Scholar]
  31. Wang, Y. Study on the Oil and Gas Operating Costs Prediction for the Dagang oilfield. Master’s Thesis, China University of Petroleum, Tsingtao, China, April 2007. [Google Scholar]
  32. Méjean, A.; Hope, C. Modelling the costs of non-conventional oil: A case study of Canadian bitumen. Energy Pol. 2008, 36, 4205–4216. [Google Scholar] [CrossRef]
  33. Luo, D.; Zhao, X. Modeling the operating costs for petroleum exploration and development projects. Energy 2012, 40, 189–195. [Google Scholar] [CrossRef]
  34. McDonald, A.; Schrattenholzer, L. Learning rates for energy technologies. Energy Pol. 2001, 29, 255–261. [Google Scholar] [CrossRef]
  35. Sorrell, S.; Speirs, J.; Bentley, R.; Miller, R.; Thompson, E. Shaping the global oil peak: A review of the evidence on field sizes, reserve growth, decline rates and depletion rates. Energy 2012, 37, 709–724. [Google Scholar] [CrossRef]
  36. National People’s Congress. 12th Five-Year Development Plan Outline. Available online: http://www.gesep.com/News/Show_2_280136.html (accessed on 7 March 2011). (In Chinese)
  37. Yan, Q.; Liu, F. China’s 2010–2030 industrial energy consumption intensity analysis and prediction. East China Electr. Power 2011, 11, 1858–1861. [Google Scholar]
  38. International Energy Agency. World Energy Outlook 2013. Available online: http://www.worldenergyoutlook.org/publications/weo-2013/ (accessed on 12 November 2013).
  39. King, C.W.; Hall, C.A.S. Relating financial and energy return on investment. Sustainability 2011, 3, 1810–1832. [Google Scholar] [CrossRef]
  40. Energy Statistics Department of National Bureau of Statistics of China. China Energy Statistical Yearbook 2009; China Statistics Press: Beijing, China, 2009; pp. 3–15. [Google Scholar]
  41. Heuna, M.K.; de Wit, M. Energy return on (energy) invested (EROI), oil prices, and energy transitions. Energy Pol. 2012, 40, 147–158. [Google Scholar] [CrossRef]
  42. Kreith, F.; Krumdieck, S. (Eds.) Principles of Sustainable Energy; CRC Press: Boca Raton, FL, USA, 2014, 2nd ed. pp. 698–728. Available online: http://www.crcpress.com/product/isbn/9781466556966 (accessed on 19 August 2013).
  43. Krumdieck, S. Transition Engineering: Adaptation of complex systems for survival. Int. J. Sustain. Dev. 2013, 16, 310–321. [Google Scholar] [CrossRef]

