Article

Policy Incentives for the Adoption of Electric Vehicles across Countries

School of Economics and Management, North China Electric Power University, Box 80, Hui Long Guan, Chang Ping District, Beijing 102206, China
*
Author to whom correspondence should be addressed.
Sustainability 2014, 6(11), 8056-8078; https://doi.org/10.3390/su6118056
Submission received: 5 August 2014 / Revised: 30 October 2014 / Accepted: 4 November 2014 / Published: 14 November 2014

Abstract

:
Electric vehicles (EVs) have prominent advantages for reducing CO2 emissions and alleviating the dependence on fossil fuel consumption in the transport sector. Therefore, many countries have set targets for EV development in recent years and have employed a number of policies to achieve environmental objectives and alleviate the energy pressure. Despite the fact that the adoption of EVs has increased in the past few years, more policies, such as financial incentives, technology support or charging infrastructure, should be made by governments to promote broader range use of EVs. In this paper, we review the relevant policies that different countries may adopt for stimulating the market of EVs. Based on this, we analyze the relationship between the policies and the adoption of EVs by taking America as an example. In conclusion, some effective policies are summarized to spur the market. Therefore, each country should learn from each other and employ effective policies based on the actual situation.

1. Introduction

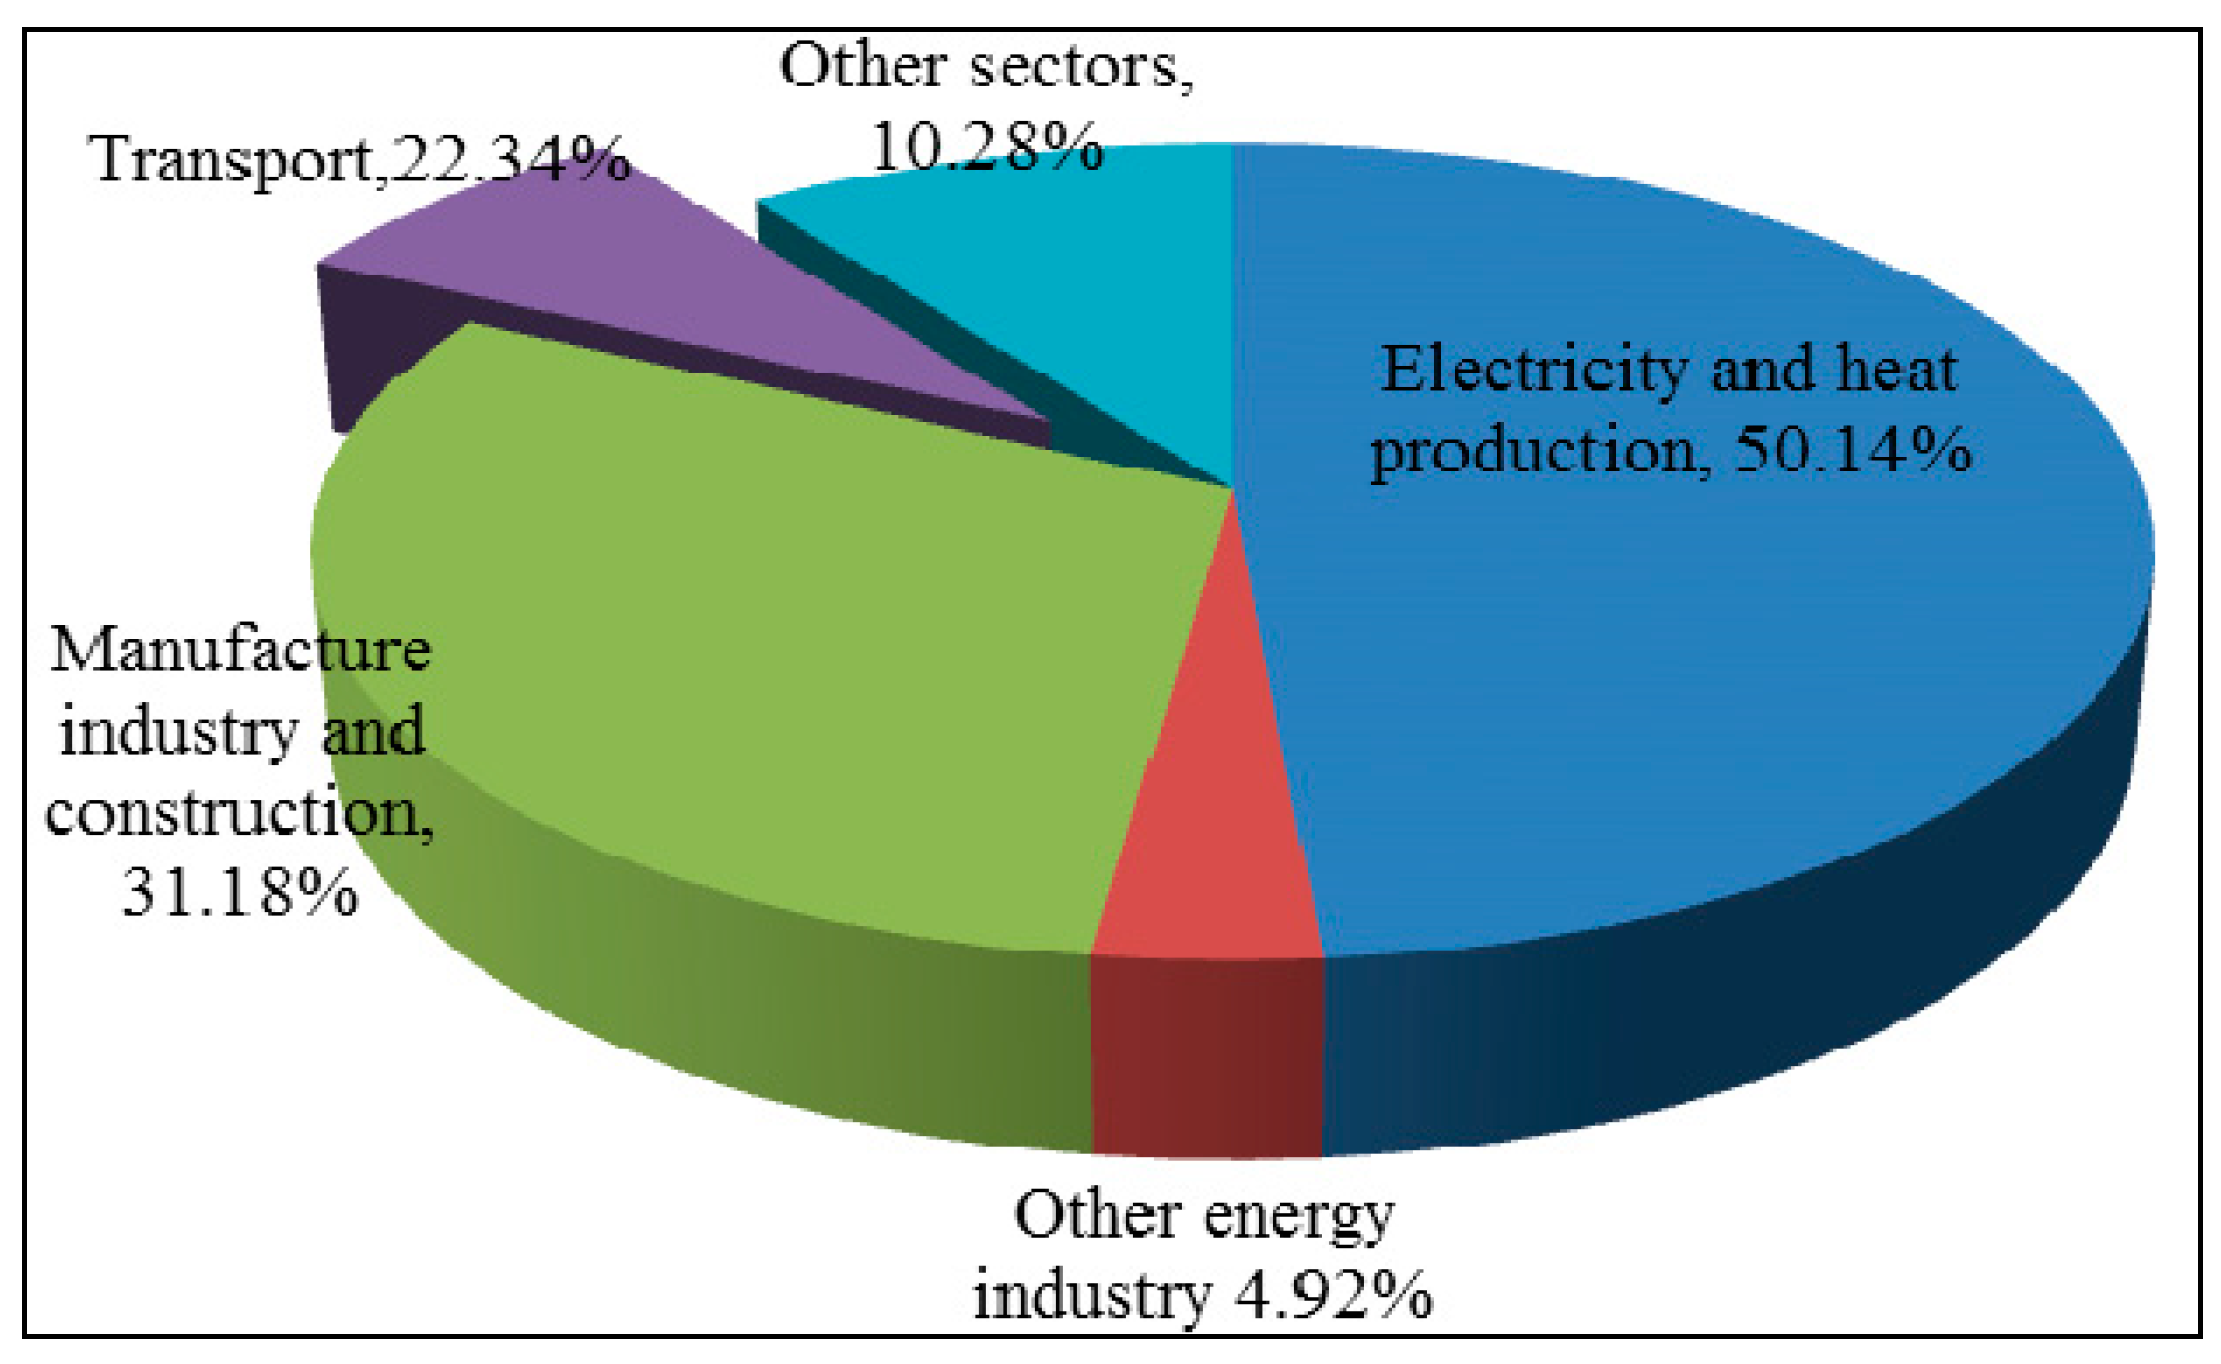
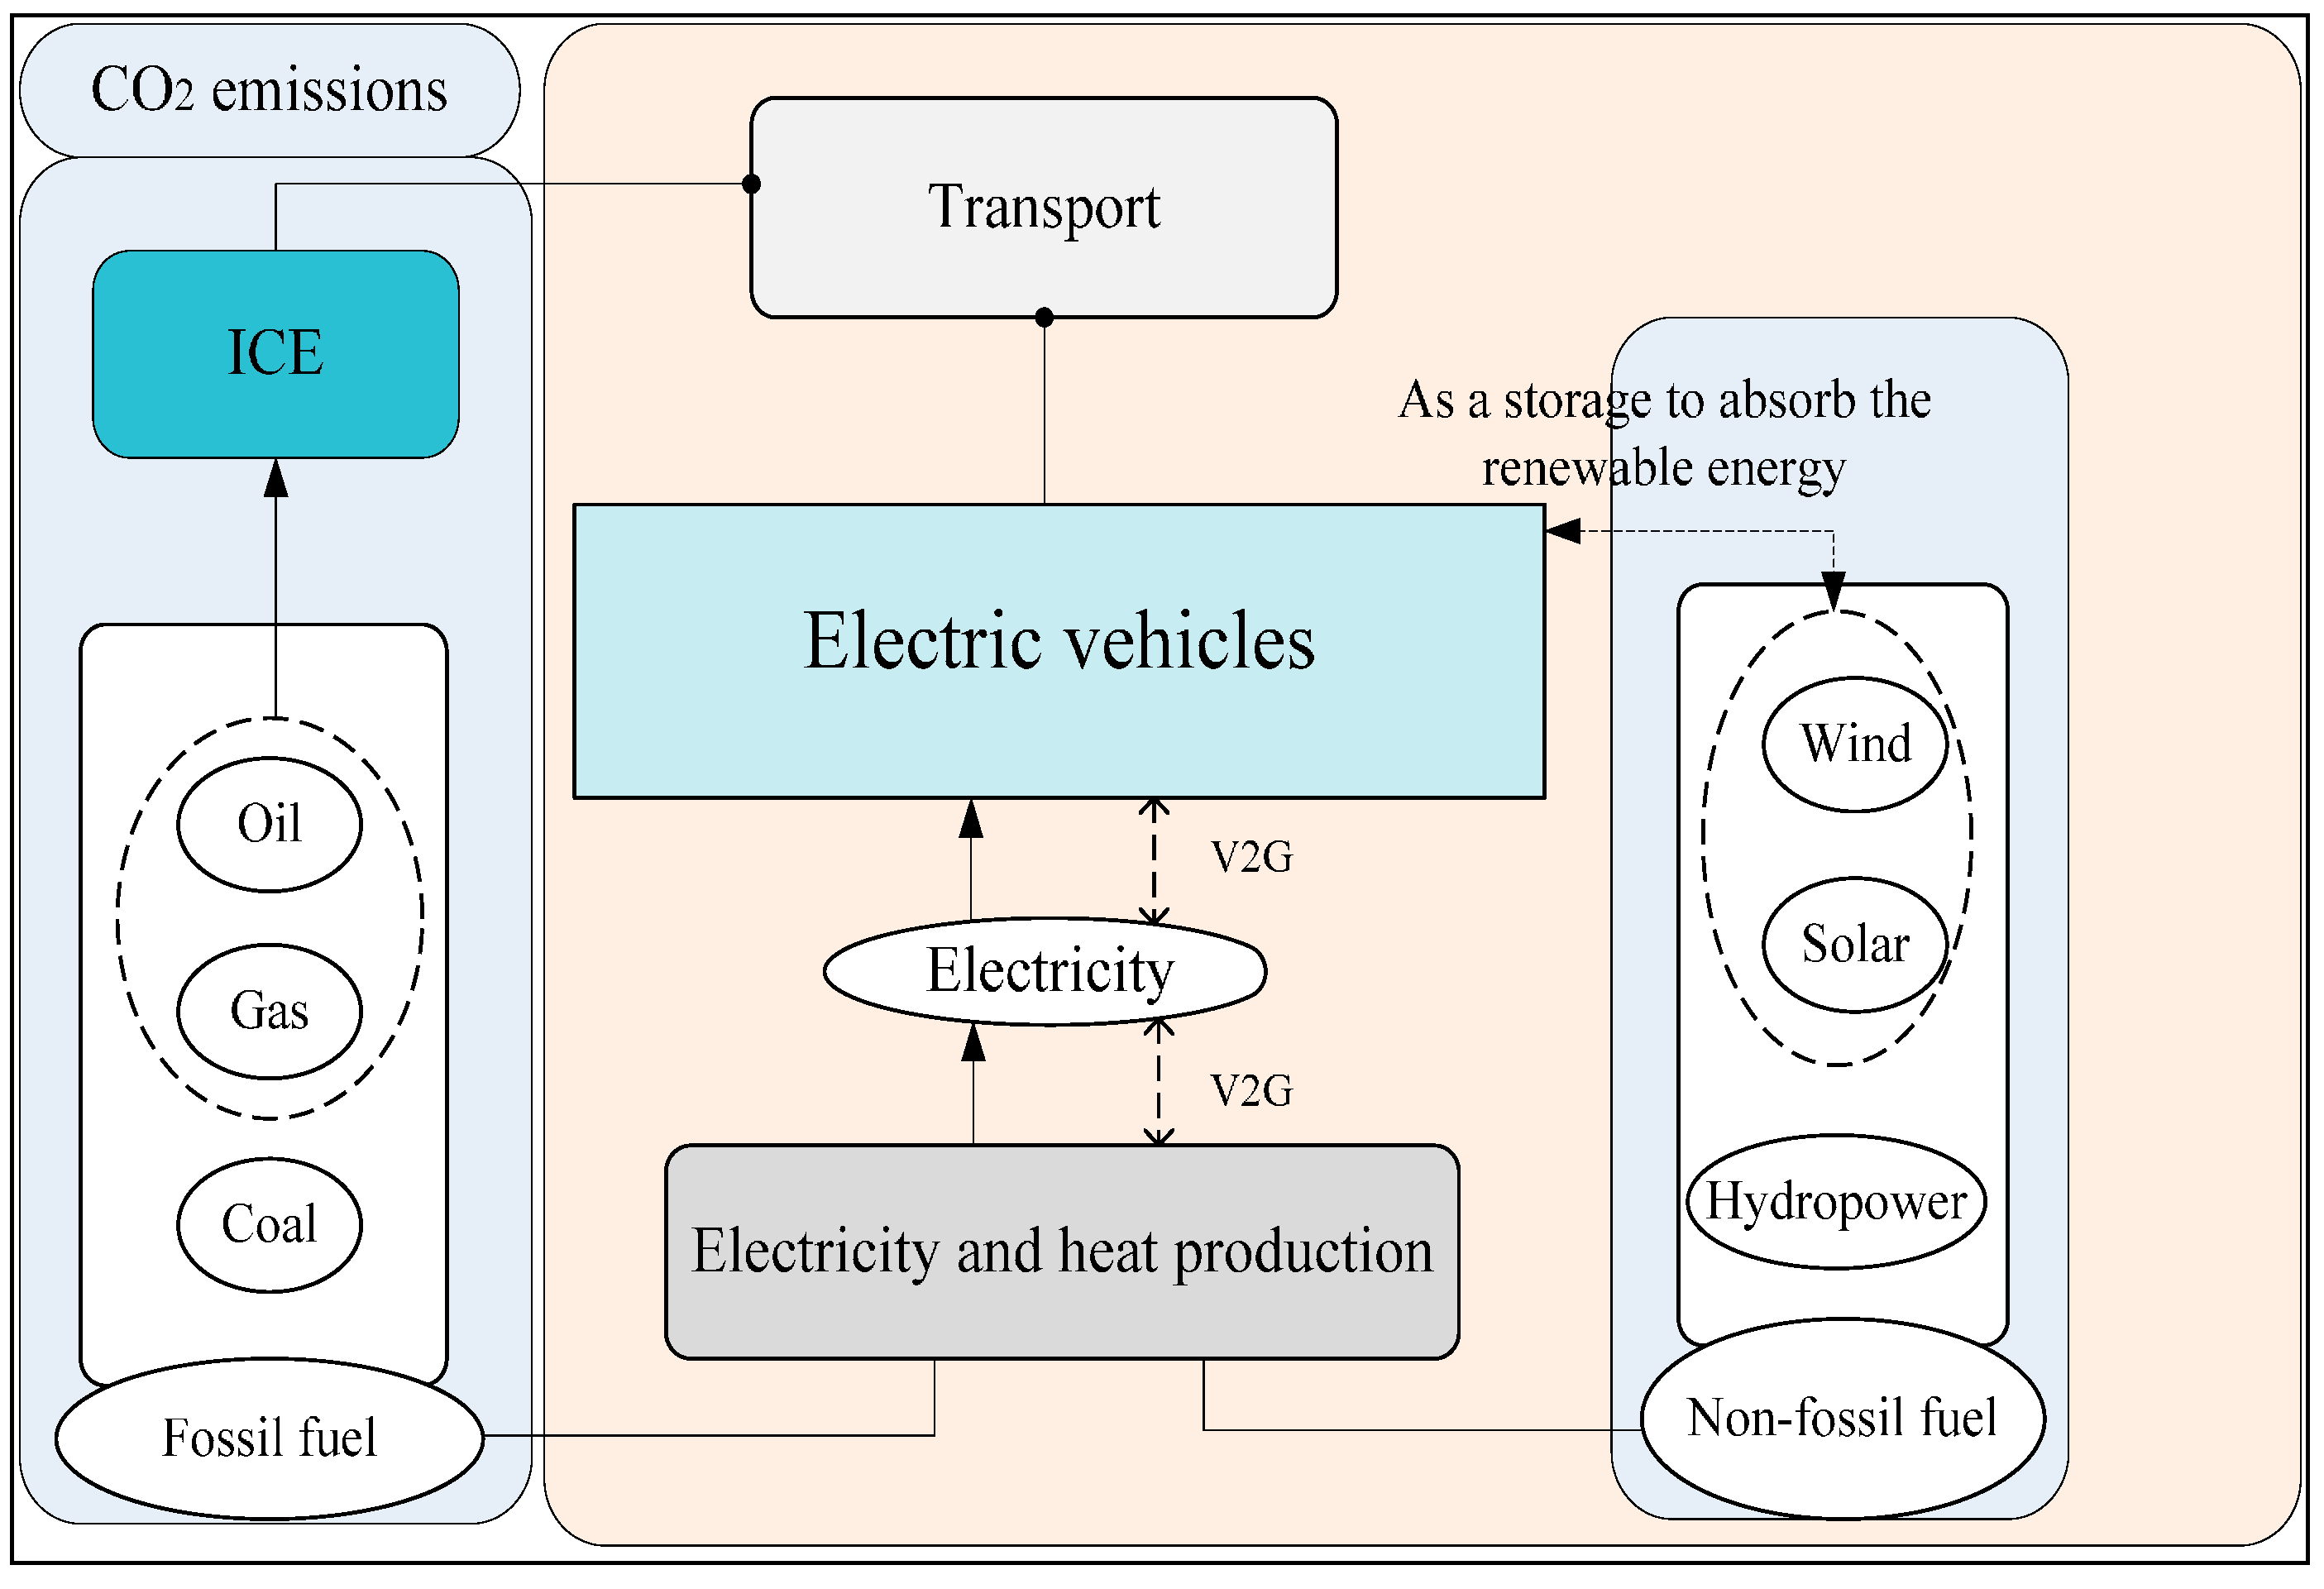
1.1. Why Do Most Countries Need to Develop EVs?

The International Energy Agency (IEA) has estimated that global CO2 emissions caused by fossil fuel combustion would rise from 31.2 gigatons (Gt) in 2011 to 37.0 Gt in 2035 in the New Policies Scenario (The scenario takes into account existing policy commitments and assumes that those recently announced are implemented, albeit in a cautious manner). However, the CO2 emissions will reach a peak at 32.4 Gt before 2020 and decline steadily to 30.5 Gt in 2035 in the Efficient World Scenario (The scenario means all energy efficiency investments that are economically viable are made and all necessary policies to eliminate market barriers to energy efficiency are adopted) [1]. The CO2 emissions mainly come from the burning of fossil fuels in the energy sector and the transport sector [2]. As is shown in Figure 1, the electricity and heat sector accounts for 50.14% and the transport sector is responsible for 22.43% of the world’s total CO2 emissions. Figure 2 displays the CO2 emissions by the two sectors in each country. The proportion of CO2 emissions ranges from 7% to 40% in the transport sector and 13% to 60% in the electricity and heat sector, respectively, in different countries.
Figure 1. CO2 emissions by different sectors. (Source: CO2 emissions from fuel combustion, International Energy Agency (IEA), 2013 [3].)
Sustainability 06 08056 g001
Figure 2. CO2 emissions by two sectors in different countries. (Source: CO2 emissions from fuel combustion, IEA, 2013 [3].)
Sustainability 06 08056 g002
For the electricity and heat sector, the energy resource that each country owns decides the energy structure. Since the energy resource is stable in each country, it is not easy to reduce the emissions in this sector in a short time. For the transport sector, the electric vehicles (EVs) provide a more promising way to solve the problem of CO2 emissions and air pollution [4,5,6]. What is more, this can be applied to different countries with various primary energy resources. Therefore, many countries could achieve their goal of reducing CO2 emissions by developing EVs.
Taking China as an example, electricity generation in China is dominated by coal-fired power, and the proportion reached 69.6% in 2013 [7]. Although China has tried its best to adjust the energy structure, the potential to reduce CO2 emissions in this sector is limited. Besides, with the development of urbanization, the CO2 emissions and other tail gas coming from internal combustion engine (ICE) will increase rapidly in transport sector, which is one of the main drivers of the serious haze problem [8].
Therefore, it is imperative to introduce EVs to solve the issues above. As is shown in Figure 3, EVs can help the CO2 emissions reduction from both two sectors. EVs, as we define in this paper, include plug-in electric vehicles (PEVs), plug-in hybrid electric vehicles (PHEVs), hybrid EVs (HEVs) and battery electric vehicles (BEVs).
From Figure 3, EVs can not only replace the conventional vehicles powered by ICE in the transport sector to reduce CO2 emissions, but also can work as energy storing device to absorb renewable energy, such as wind power and solar power, so the problem of intermittency and non-dispatchability of this power can be worked out [9]. Furthermore, EVs can sell the stored electricity back to the grid through the technology of vehicle to grid (V2G), which is also helpful to smooth the load curve [10].
Figure 3. The role of electric vehicles (EVs) in two sectors. ICE, internal combustion engine.
Sustainability 06 08056 g003

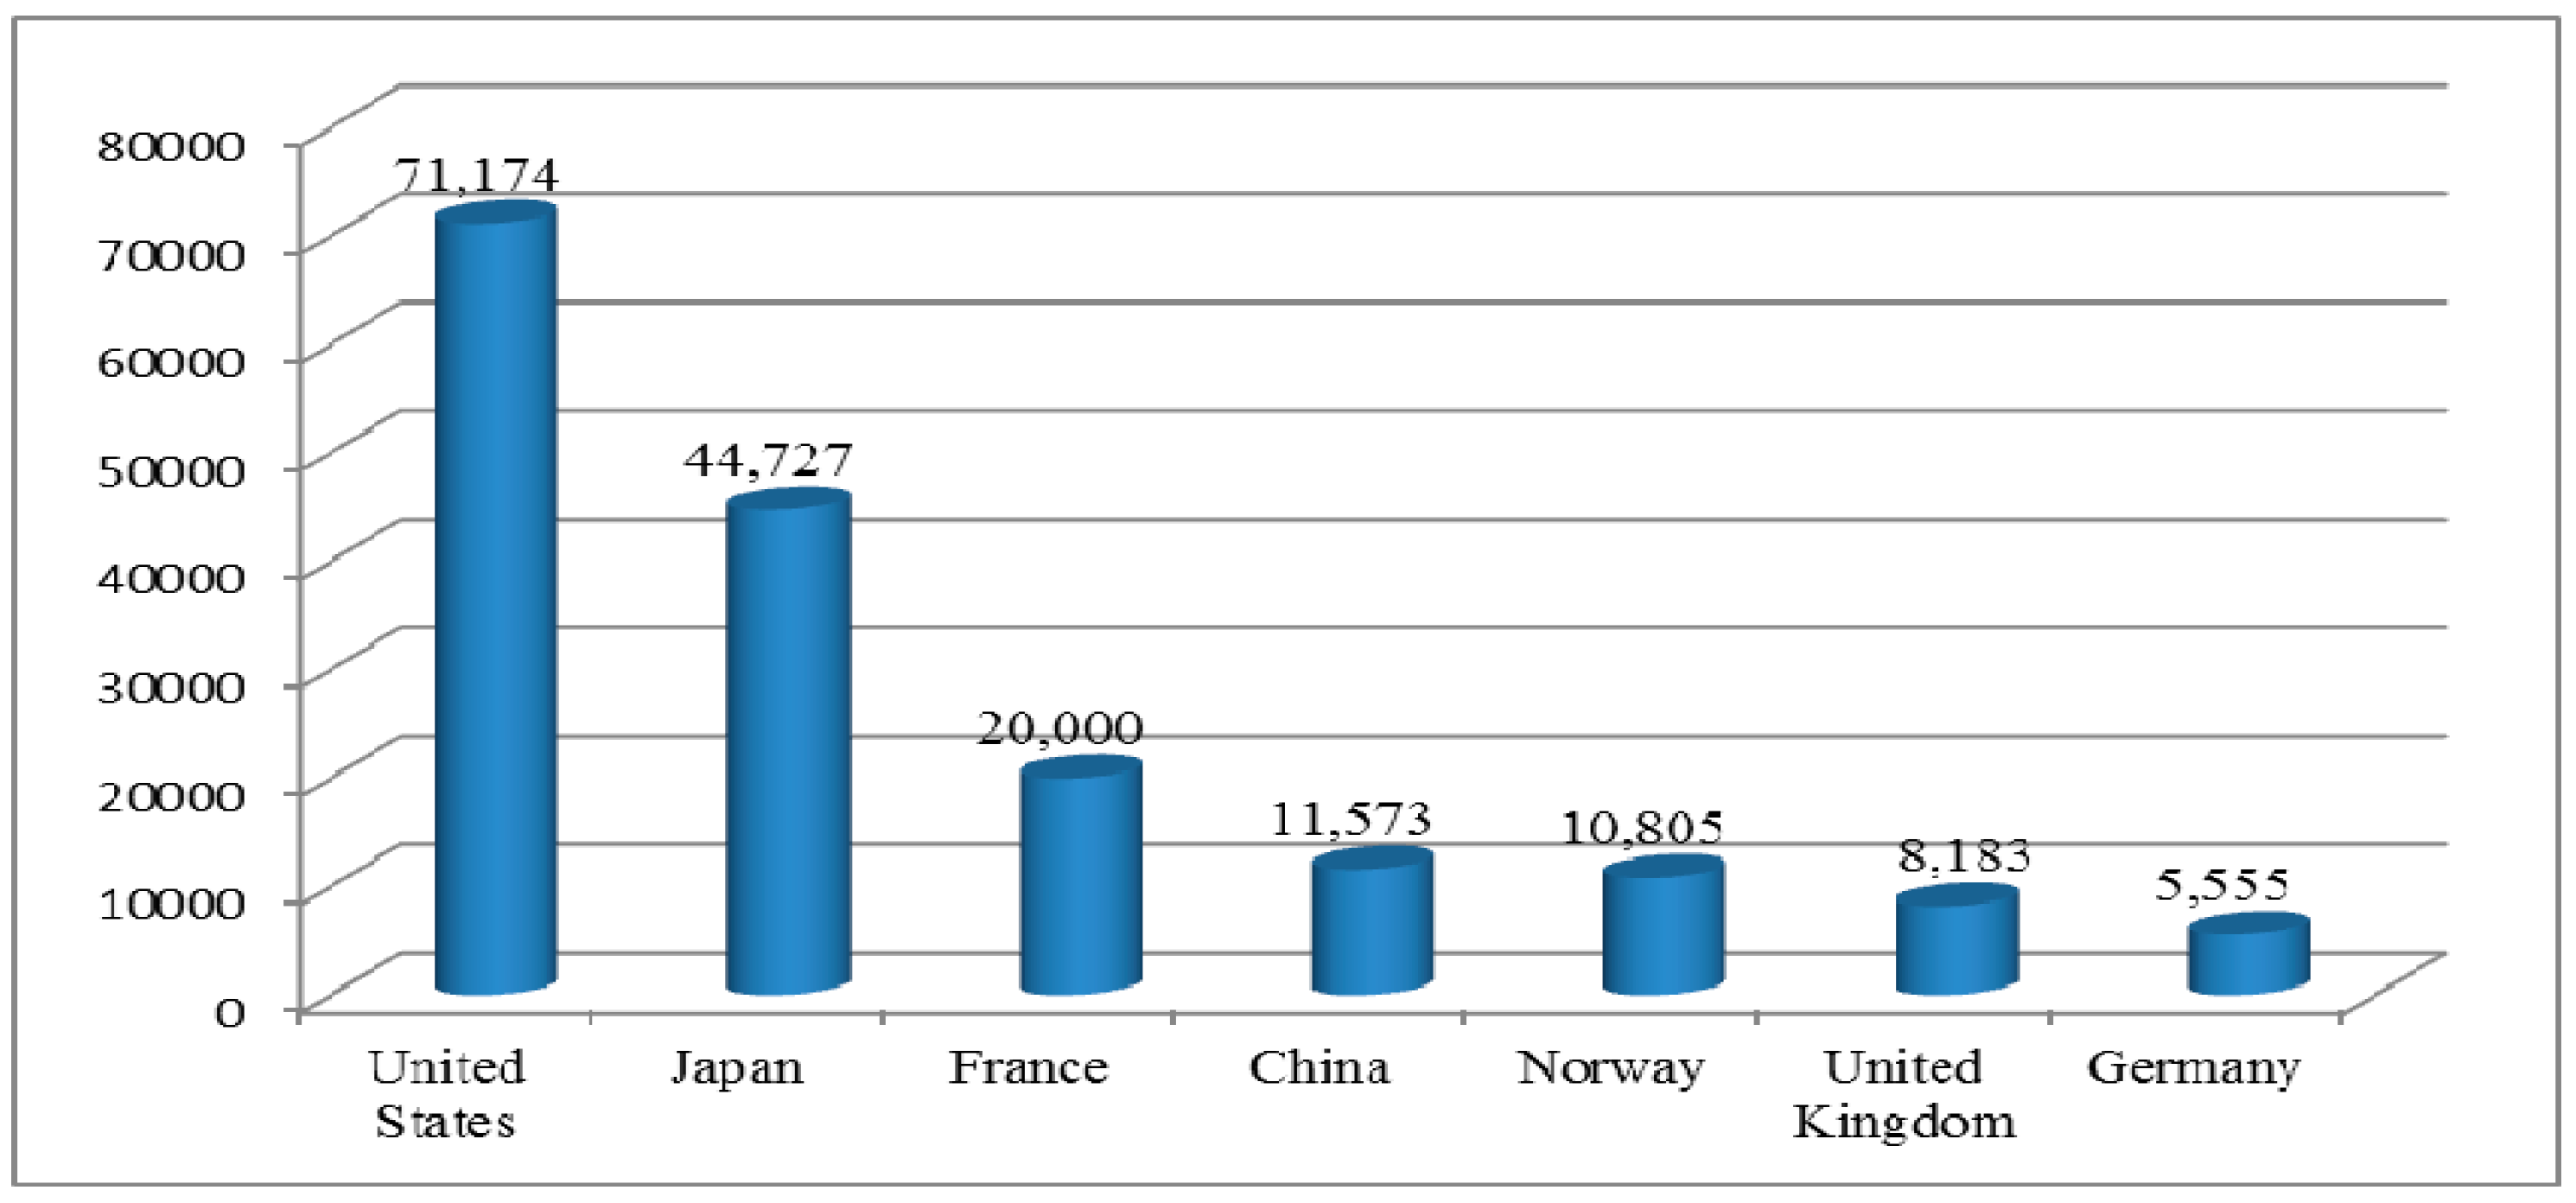
1.2. The Targets and the Current Situations of EVs in Different Countries

The widespread use of EVs is not only helpful for CO2 emissions reduction in the transport sector, but also conducive to adjusting the energy structure through increasing the proportion of non-fossil fuel energy. Therefore, many countries regard EVs as their strategic emerging industries and set their targets to promote the large-scale adoption of EVs, as presented in Table 1.
Many countries are ambitious in wanting to achieve more than one million EVs on the road before 2020, according to Table 1. The United States plans to achieve the goal of one million EVs early in 2015. Though China intends to reach only 0.5 million EVs in 2015, it is going to realize the goal of five million EVs by 2020. Besides, the U.K. government has not set targets for the number of EVs, but the Committee on Climate Change recently recommended a goal of 1.7 million EVs by 2020. According to Global EV Outlook 2013, the EVs on the road will reach nearly 20 million around the world by 2020, but the number was only more than 0.18 million by 2012 [4]. Moreover, the EVs on the road in different countries are far from the target proposed, which is shown in Figure 4.
Taking China as an example, the quantity of EVs was up to 11,573 by 2012. China intends to promote 5,000,000 EVs on the road by 2020, which means the annual sale of new EVs should reach at least 623,533 in the next eight years. Norway has made a target of 0.05 million EVs on the road by 2018, and there have been already 10,805 EVs on the road by 2012, nearly 21.61% of the target amount. Thus, it is urgent and crucial to adopt relevant policy actions and effective policy mechanisms to spur the market for EVs.
Table 1. Targets and corresponding plans in different countries. IA-HEV, Implementing Agreement for Co-operation on Hybrid and Electric Vehicles Technologies and Programmes.
CountriesTargetsDeadlinePlan or Legislation
United States (U.S.)1 million EVs2015EV Everywhere Grand Challenge Blueprint, 2012 [11]
United Kingdom (U.K.)1.7 million EVs2020Committee on Climate Change, 2010 [12]
Germany1 million EVs2020National Development Plan for Electric Mobility, 2009 [13]
France2 million EVs2020French government (IA-HEV, 2014) [14]
JapanEV market share reaches 50% in total vehicle sales2020Next-Generation Vehicle Strategy2010 [15]
China0.5 million EVs2015Energy saving and energy automobile industry planning (2012–2020) [16]
5 million EVs2020
Norway0.05 million EVs2018The Norwegian government [17]
Figure 4. Cumulative registrations of passenger EVs by 2012. (Source: Global EV Outlook, 2013 [4]; website of Gronnbil [18].)
Sustainability 06 08056 g004

1.3. The Research Status and Layout

To find the appropriate and effective policy mechanisms for EVs, some literature has analyzed one single policy or act that significantly influences the market for EVs. Jenn [19] accessed the effectiveness of the Energy Policy Act of 2005 (EPAct 2005), using econometric methods and data between 2000 and 2010. It is found that the act increased the sales of HEVs in the U.S. Diamond [20] tested the relationship between HEV adoption and a variety of variables based on the hybrid registration data from different states, which suggested that gasoline prices, not incentive policies, were more closely related to EV adoption. Krause [21] found that misperception about available policies and incentives, not incentives themselves, affects the commercialization of EVs according to the survey of 21 cities in America. Pohl [22] argued that national policy had a direct impact on the electrification of vehicles in Japan, while Yabe [5] proposed that the initial price and progress rates of batteries had a greater influence on this share. Besides, Ahman [23] suggested that there was a crucial effect of government policy on building the market for EVs.
In addition, some studied the impact of government policies and incentives, as well as legislation on the adoption of EVs from the perspective of a single country. Based on a survey with 13 pilot cities in China, Zheng [24] analyzed the effect of EV development in China after the “Plan on Shaping and Revitalizing the Auto Industry” launched in 2009. Cohen [25] demonstrated how policy entrepreneurship activities promote the introduction of EVs in Israel, while Jarvinen [26] represented the relationship between the EV market and the national policy implications in Australia.
The literature above just pointed out which policy or act may significantly influence the market for EVs, and few research institutions or articles have focused on the policy mechanism for the adoption of EVs from the perspective of multiple countries. The Implementing Agreement for Co-operation on Hybrid and Electric Vehicles Technologies and Programmes (IA-HEV) was formed in 1993 [27]. Its work was to collect the relevant policies about its 18 members, mainly including the U.S., Germany, the U.K., Italy and France, without relationship analysis. William [2] used multiple linear regression analyses to examine the relationship between policy instruments and 30 national EV market shares for 2012, but he did not consider the policy mechanism of these countries.
Therefore, it is necessary to analyze the relationship between the mechanisms of incentives and the market outcome for EVs. The countries we mentioned above generally set out their plans to promote the development of EVs based on the financial incentives, technology support and charging infrastructure, such as the EV Everywhere Grand Challenge Blueprint in America and Next-Generation Vehicle Strategy 2010 in Japan. Besides, the practices to realize the marketization of EVs in the last few years were also based on the above three aspects. What is more, William [2] found financial incentive and charging infrastructure to be significantly and positively correlated with a country’s electric vehicle market. Ahman [23] analyzes the government policy by considering technology support and infrastructure support. Therefore, we reviewed the important national policies and analyzed the policy mechanism of various countries in this paper from these three aspects. In addition, the paper links the policy incentives and mechanism to the market or growth level of EVs. Considering the development scale of EVs and the typicality of policy mechanisms, we mainly take America as an example. Finally, the paper draws a conclusion about the effectiveness of different incentive program and provides some advice for solving the problems of EV development in China.
The rest of this paper is organized as follows. Section 2, Section 3 and Section 4 review the policies and mechanisms of several typical countries from the three aspects, respectively. Section 5 analyzes the market for and development of EVs regarding these countries based on the review of policies. The final section is devoted to the conclusions.

2. Financial Incentives

Although EVs can mitigate air pollution compared to ICE vehicles, it is still difficult for consumers to accept EVs; because they are not willing to pay for social benefits that would not directly benefit themselves in the short time. In order to improve EV acceptance, governments around the world need to carry out some financial incentives to convince consumers that EVs are not only environmentally-friendly, but also economical. In the meantime, some incentives should be formulated to encourage manufacturers to actively produce EVs.
From the perspective of recipients, financial incentives can mainly be separated into two parts, namely for consumers and for manufacturers. Firstly, in terms of consumers, these mainly contain tax credits, tax reduction, tax exemption or direct subsidy [28,29] during purchasing and also include a free road tax, cheap electricity price or free parking with the use of EVs [30]. Secondly, governments should adopt some financial incentives for manufacturers, such as the reduction of the sales tax depending on the CO2 emission level and subsidies for the production of EVs, so that the targeted quality and quantity of EVs could be guaranteed [31].

2.1. The Financial Incentives in United States

2.1.1. A Policy Review of Financial Incentives in the United States

In 2005, Congress proposed the EPAct 2005 [32] and established a new set of incentives, including direct tax credit to consumers for the purchase of an HEV [22]. The “Energy Improvement and Extension Act of 2008” [33] proposed a new tax credit for PHEV, and the credit ranged from $2500 to $7500 based on the battery pack capacity for the purchase of the first 250,000 PHEVs.
Besides, the American Clean Energy and Security Act of 2009 (ACES-2009) [34], as well as the American Recovery and Reinvestment Act of 2009 (ARRA-2009) [35] had authorized federal tax credits for qualified PEVs, and the credits ranged from $2500 to $5000, depending on battery capacity.
Later, the federal government proposed the Car Allowance Rebate System (also known as Cash for Clunkers), which is an act with a $3 billion financial incentive [36]. Through this system, people would get $3500 or $4500 if they exchanged their less fuel-efficient vehicle for a higher fuel-efficiency vehicle, which includes some HEVs. In addition, many states have established incentives, including fiscal incentives and non-fiscal incentives. The fiscal incentives mainly covered tax reduction or exemptions and rebates for both BEVs and PHEVs, and the non-fiscal incentives included free access to high occupancy vehicle lanes. The financial incentives of some states are shown in Table 2.
Apart from stimulating consumers to purchase and use EVs, the government also has encouraged manufacturers to promote the development of EVs. The government proposes some policies on tax reduction, low loan interest and research and development (R&D) investment. As in the EPAct 2005, the amount of credits start a “phase-out” after a manufacturer exceeds a vehicle sales limit, which is a stepwise tax credit. The full credits are available when a manufacturer sells 60,000 qualifying vehicles, such as PEVs, and then the credits begin to decrease [32].
Table 2. Financial incentives by state [37].
StateAmount of IncentiveHigh-Occupancy Vehicle LaneType of Incentive
California$1500 for PHEVs and $2500 for BEVsNoIncome tax credit
WashingtonNoYesSales tax exemption
Massachusetts$2500 for PHEVs and BEVsNoPurchase rebate
New Jersey$4000 for BEVsYesSales tax exemption
Oregon$5000 for PHEVs and $1500 for BEVsNoIncome tax credit
Colorado$6000 for PHEVs and BEVsYesIncome tax credit
Montana$500 for PHEVs and BEVsn.a. (not available)Conversion cost credits
South Carolina$1500 for PHEVs and BEVsNoIncome tax credit
In addition, the “Energy Independence and Security Act of 2007” (EISA-2007) not only provided financial incentives, but also provided low loans for automobile manufacturers to develop EVs [38]. What is more, President Obama announced the plan of the “next generation electric vehicle” [39], which aimed to fund $1.5 billion to manufacturers to produce high efficiency batteries and their components. The plan was also to provide $500 million to produce other components needed for EVs, such as electric motors and other key components. These financial packages for manufacturers are helpful for pledging one million EVs on the road by 2015.

2.1.2. The Mechanism of Financial Incentives in the United States

Based on the reviews above, it is shown that various financial incentives are adopted by the federal and state governments to stimulate the purchase and production of EVs in United States. Egbue [40] suggested that individuals would likely be EV adopters only if they perceived that EVs were superior in performance and price compared to conventional vehicles.
In order to stimulate consumers to choose EVs, both the federal government and state governments have taken direct subsidies, tax credits or tax exemptions as the main forms of financial incentives. Other incentives, such as the high-occupancy vehicle lane and the Cash for Clunkers program also play a role in turning consumers toward choosing EVs. In addition, the Clean Vehicle Rebate Project provides rebates of up to $5000 for consumers to purchase or lease zero-emission and plug-in hybrid vehicles [41]. However, for manufacturers, the federal government is the main supporter, while the state governments have less financial incentives. The federal government has spurred the production and sales of EVs by providing the concessional load, tax credits and R&D investment for manufacturers. The state governments, especially California, have supported the production and sales of low emission vehicles (LEVs) or zero emission vehicles (ZEVs) through placing the onus on the manufacturers to reduce high tailpipe emission vehicles and imposing civil penalties on the manufacturers for non-compliance. Apart from the penalties, the companies producing and selling ZEVs could get the credits as an award [42].
Specifically, the R&D investment is separated into two ways. Firstly, investment has been made in qualified manufacturers directly, and the investment is mainly for manufactures to perform the research on the core technologies. Secondly, the manufacturers have to compete for the investment, and the investment is mainly for the relevant technology on charging infrastructure. By sorting and analyzing, the framework of financial incentives is summarized in Figure 5.
Figure 5. Framework of financial incentives in the United States.
Sustainability 06 08056 g005

2.2. The Financial Incentives in Europe

Considering the importance of reducing CO2 emissions from road transport, as well as security and oil supply, many countries in Europe regard EVs as an effective way to solve these problems and have made policy packages to promote their development. Except for incentives for the use of EVs, Europe also focuses on punishments for the use of high emission vehicles. It offers credits to carmakers that produce vehicles with less than 50 g of CO2 per kilometer and provides additional incentives for the introduction of EVs [43,44].
The U.K. government modified the tax mechanism in the car property tax in 2007, and the tax is levied based on the CO2 emissions in grams per km (g·CO2/km) [45]. In the new Ultra Low Emission Discount, the U.K. government gives a discount to electric vehicles that emit 75 g/km or less of CO2 and provides a 100% discount from the Congestion Charge for qualified vehicles [46,47]. The U.K. government attaches more attention to low CO2 emissions. Therefore, the vehicles that are qualified are eligible to enjoy the policies, even though the vehicles come from other countries [48], and the phenomenon of localism protection occurs less, which could promote the marketization of electric vehicles to some extent.
In addition, the U.K. created a subsidy program in 2011 called the Plug-In Car Grant [48] for consumers to enable the purchase of ultra-low carbon vehicles. Under the program, qualified ultra-low emission cars will receive a grant towards their cost. This is 25% off the cost of a new electric car, but not to exceed £5000. Furthermore, the U.K. proposed a vehicle scrappage scheme [49], such as Cash for Clunkers in America, to stimulate consumers to buy lower-emissions vehicles. Italy, Germany and France also have put forward similar policies, as well.
From the perspective of the mechanism of financial incentives, many countries in Europe often have proposed their financial incentives depending on CO2 emissions (Table 3 and Figure 6), and their recipients are usually customers. Moreover, the majority of countries have no penalty. Especially in France, it adopts the bonus-malus system as the financial incentive [50]. Bonus is a discount in the premium, and malus is an increase in the premium. For example, vehicles that emit 20 g/km could benefit from a premium of €6300, and for vehicles that emit between 20 and 60 g/km, the premium is €4000 [51]. This system is designed to reward the purchase of a new car emitting less CO2 via giving the bonus to consumers and punishing those who opt for a more polluting model.
There are still some countries that have not established their policies depending on the CO2 emissions, such as Germany, Demark and Norway. The framework of financial incentives in these countries is similar to America. For example, Norway not only proposed tax credits and direct subsidies, but also supplied free parking and bus lane access, such as the high-occupancy vehicle lane in the U.S. Especially, the government of Norway supplied 3200 free charging stations (namely, free electricity) for consumers [17], which is attractive to most Norwegians, because of the high petrol price.
Table 3. Tax credits in several countries of Europe [50].
CountriesCredits Based on the CO2 EmissionsTax Credits
BelgiumYesRegistration tax exemption
GermanyNoAnnual circulation tax exemption
DenmarkNoRegistration tax exemption
FinlandYesPay the minimum rate (5%) of the CO2-based registration tax.
FranceYesCompany car tax exemption
Irelandn.a.Registration tax credits
NorwayNoPurchases tax exemption
An outstanding characteristic of the policies in Europe is that the financial incentives are proposed mainly based on CO2 emissions, no matter what the incentive object is. For consumers, they could receive the incentives if they purchased the vehicles with less CO2 emissions. For manufacturers, if they wanted to gain the incentives, they should produce more effective and environmentally friendly vehicles, such as EVs, which have less emissions or even zero-emissions. For instance, European Union (EU) legislation sets mandatory emission targets for new cars, with a fleet average of 130 g·CO2/km by 2015 and 90 g·CO2/km. To achieve this goal, the manufacturers have to pay an excess emissions premium for each car registered. What is more, they could gain “super credits” if they produce vehicles with extremely low emissions. The “super credits” are that each low-emitting car will be counted as 3.5 vehicles in 2012 and 2013, 2.5 in 2014, 1.5 vehicles in 2015 and then one vehicle from 2016 to 2019, but not the money nor subsidy [51]. The framework of financial incentives is shown in Figure 6.
Figure 6. Framework of financial incentives in Europe.
Sustainability 06 08056 g006

2.3. The Financial Incentives in China

China has recently striven to develop EVs, because it owns the largest CO2 emissions in the world, and also, China has the largest market room for EVs [8]. In China, the government encourages purchasing public vehicles at the primary stage and then supports exploiting the private EV market in some pilot cities. In 2009, China announced a trial program to provide incentives for EVs, including up to RMB 60,000 for purchasing private BEV and RMB 50,000 for purchasing PHEV in Shanghai, Shenzhen, Hangzhou, Hefei and Changchun [52]. Compared to the mechanism of Europe, the subsidies are not an open green light to all EVs. The phenomenon of local protectionism is serious in the pilot cities of China, which hinders the development of EVs [8].
The financial incentives to promote EVs in the market are separated into two parts, namely government purchase and private purchase. The promotion of EVs at first mainly follows the policy of government purchase. For instance, in the 2008 Olympic Games and the 2010 Shanghai World Expo, China put many EVs, such as electric sightseeing cars or electric sanitation cars, into practice through government purchase [53,54].
Recently, the government, on the one hand, tried to limit the purchase of conventional vehicles for private purchase by a vehicle registration lottery and traffic controls that mainly included “odd-even” traffic restrictions, peak restrictions and the specified lane restrictions. To address the traffic jams and the haze problem in the big cities, such as Beijing, Shanghai and Tianjin, the local government adopted traffic controls for conventional vehicles [55]. On the other hand, financial incentives for EVs, such as subsidies, no license-plate lottery and no traffic controls, have been proposed to attract consumers to choose EVs [56]. The framework is shown in Figure 7.

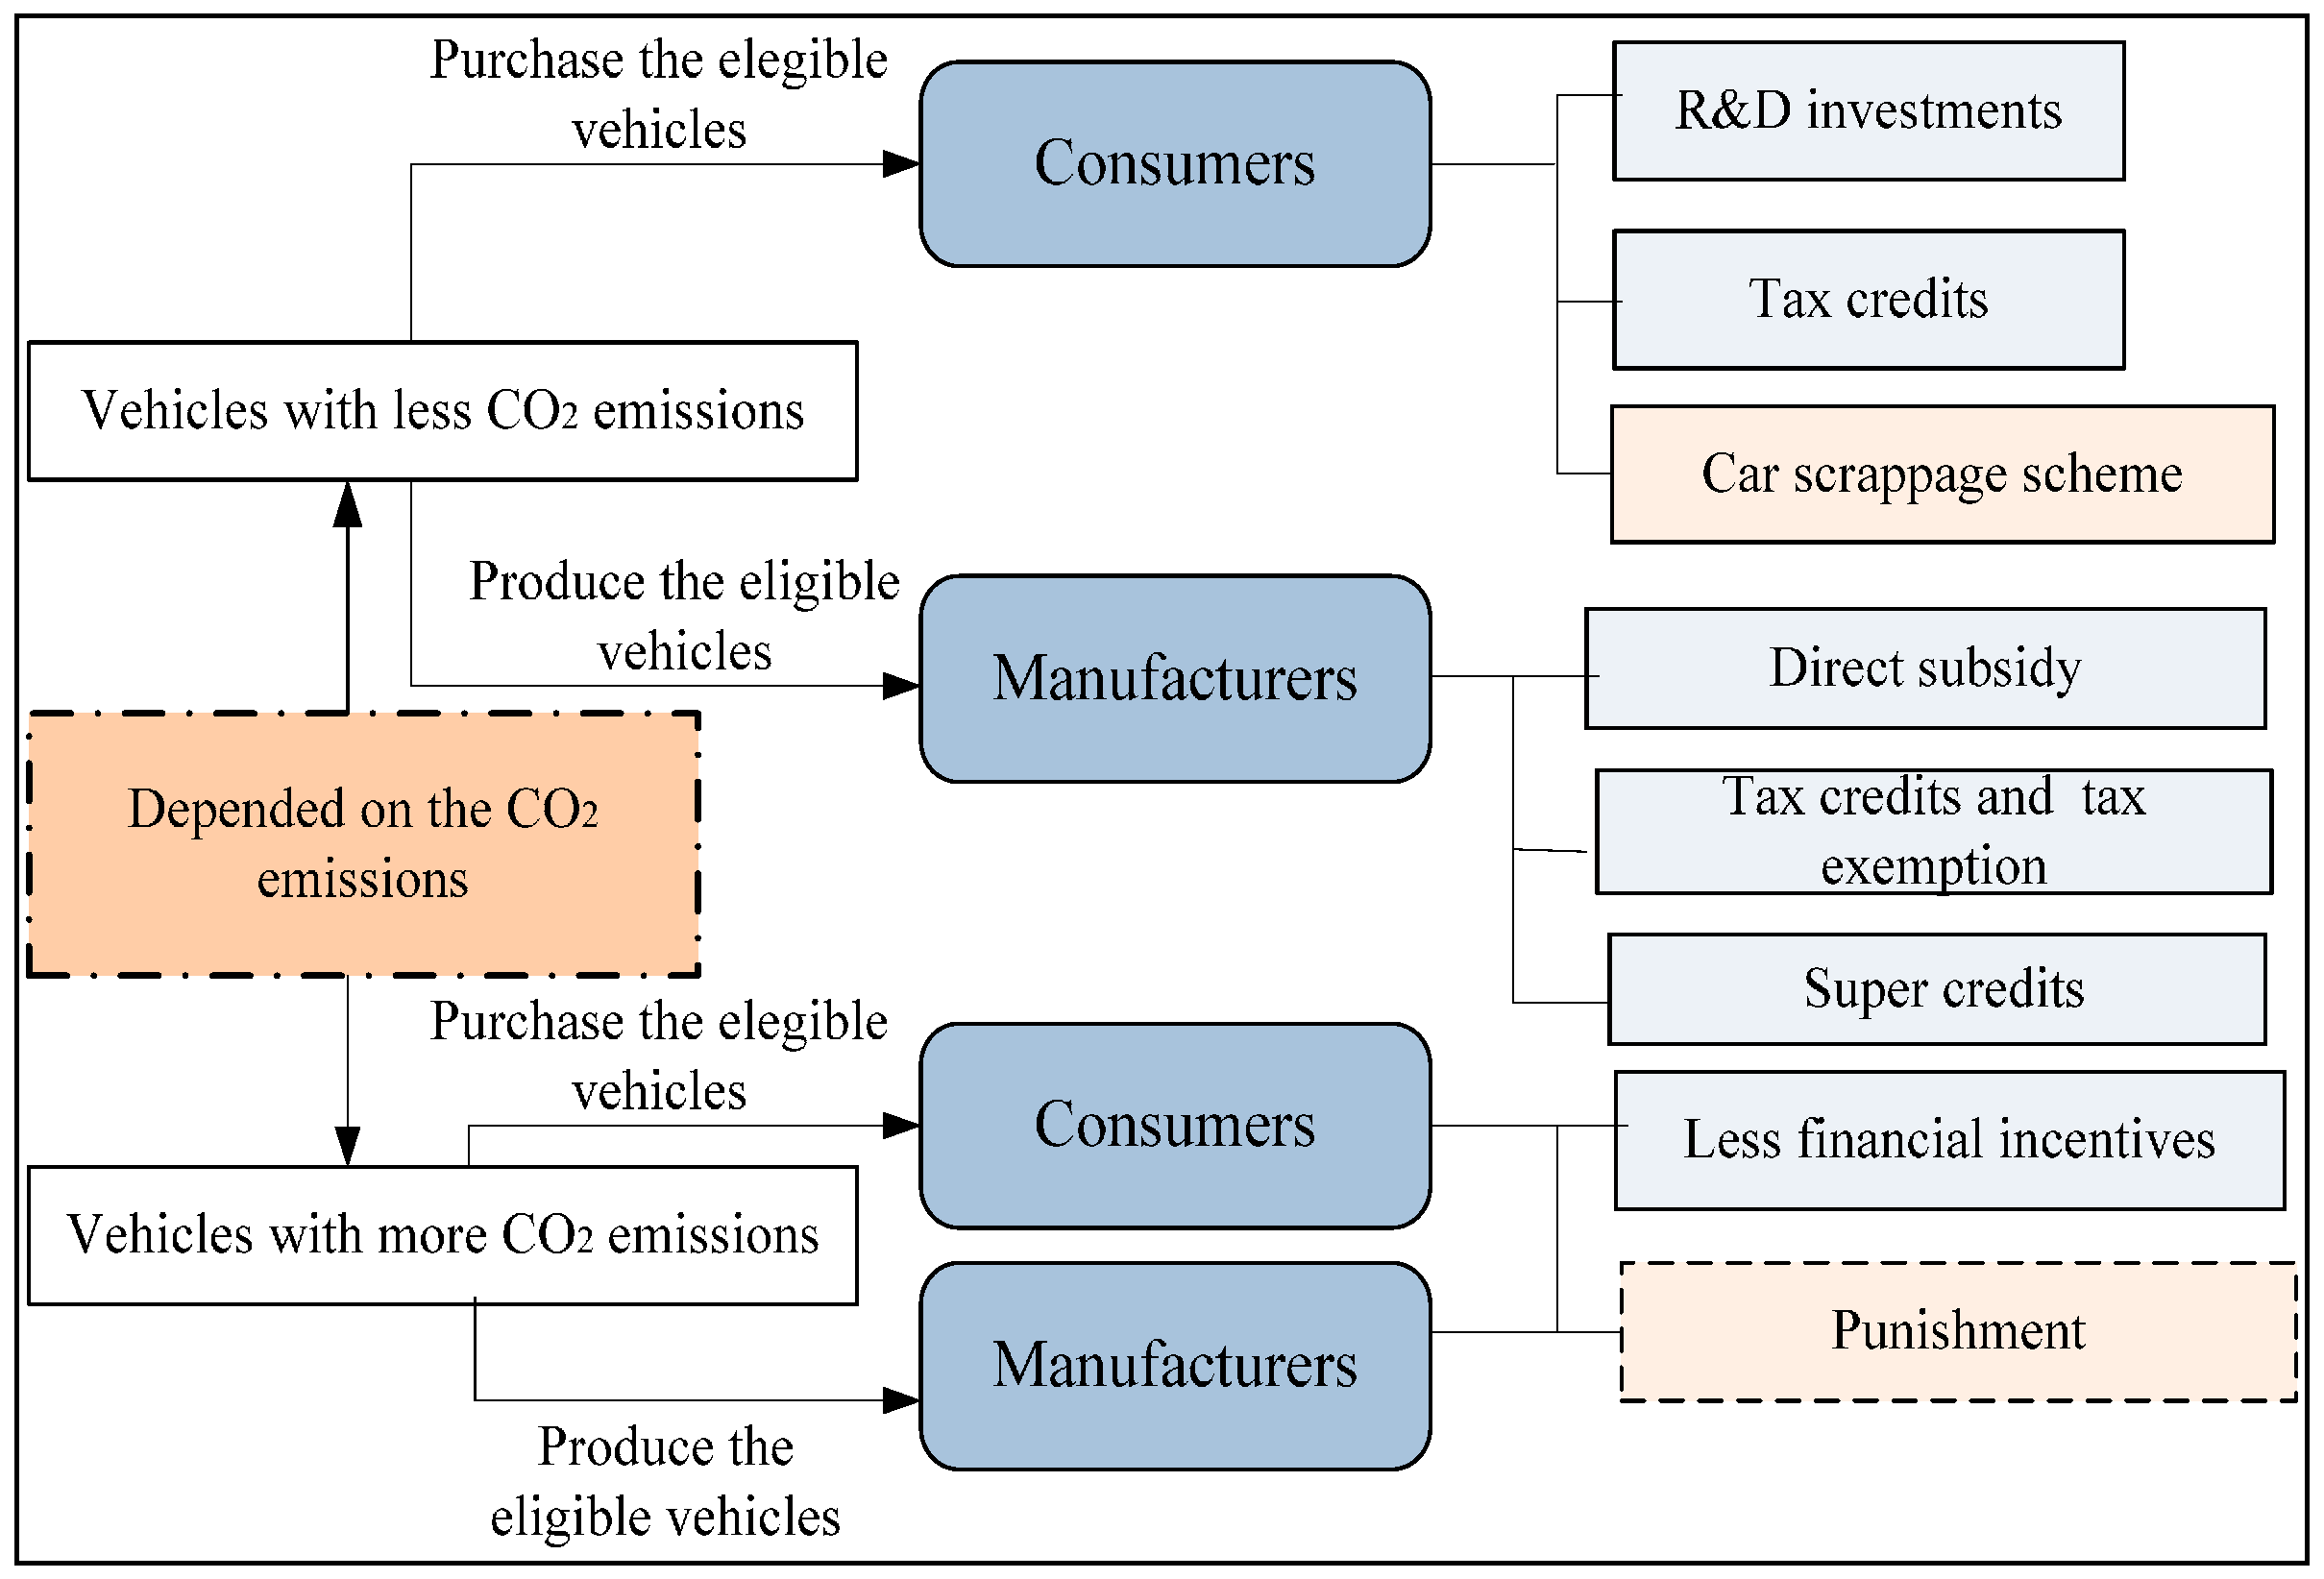
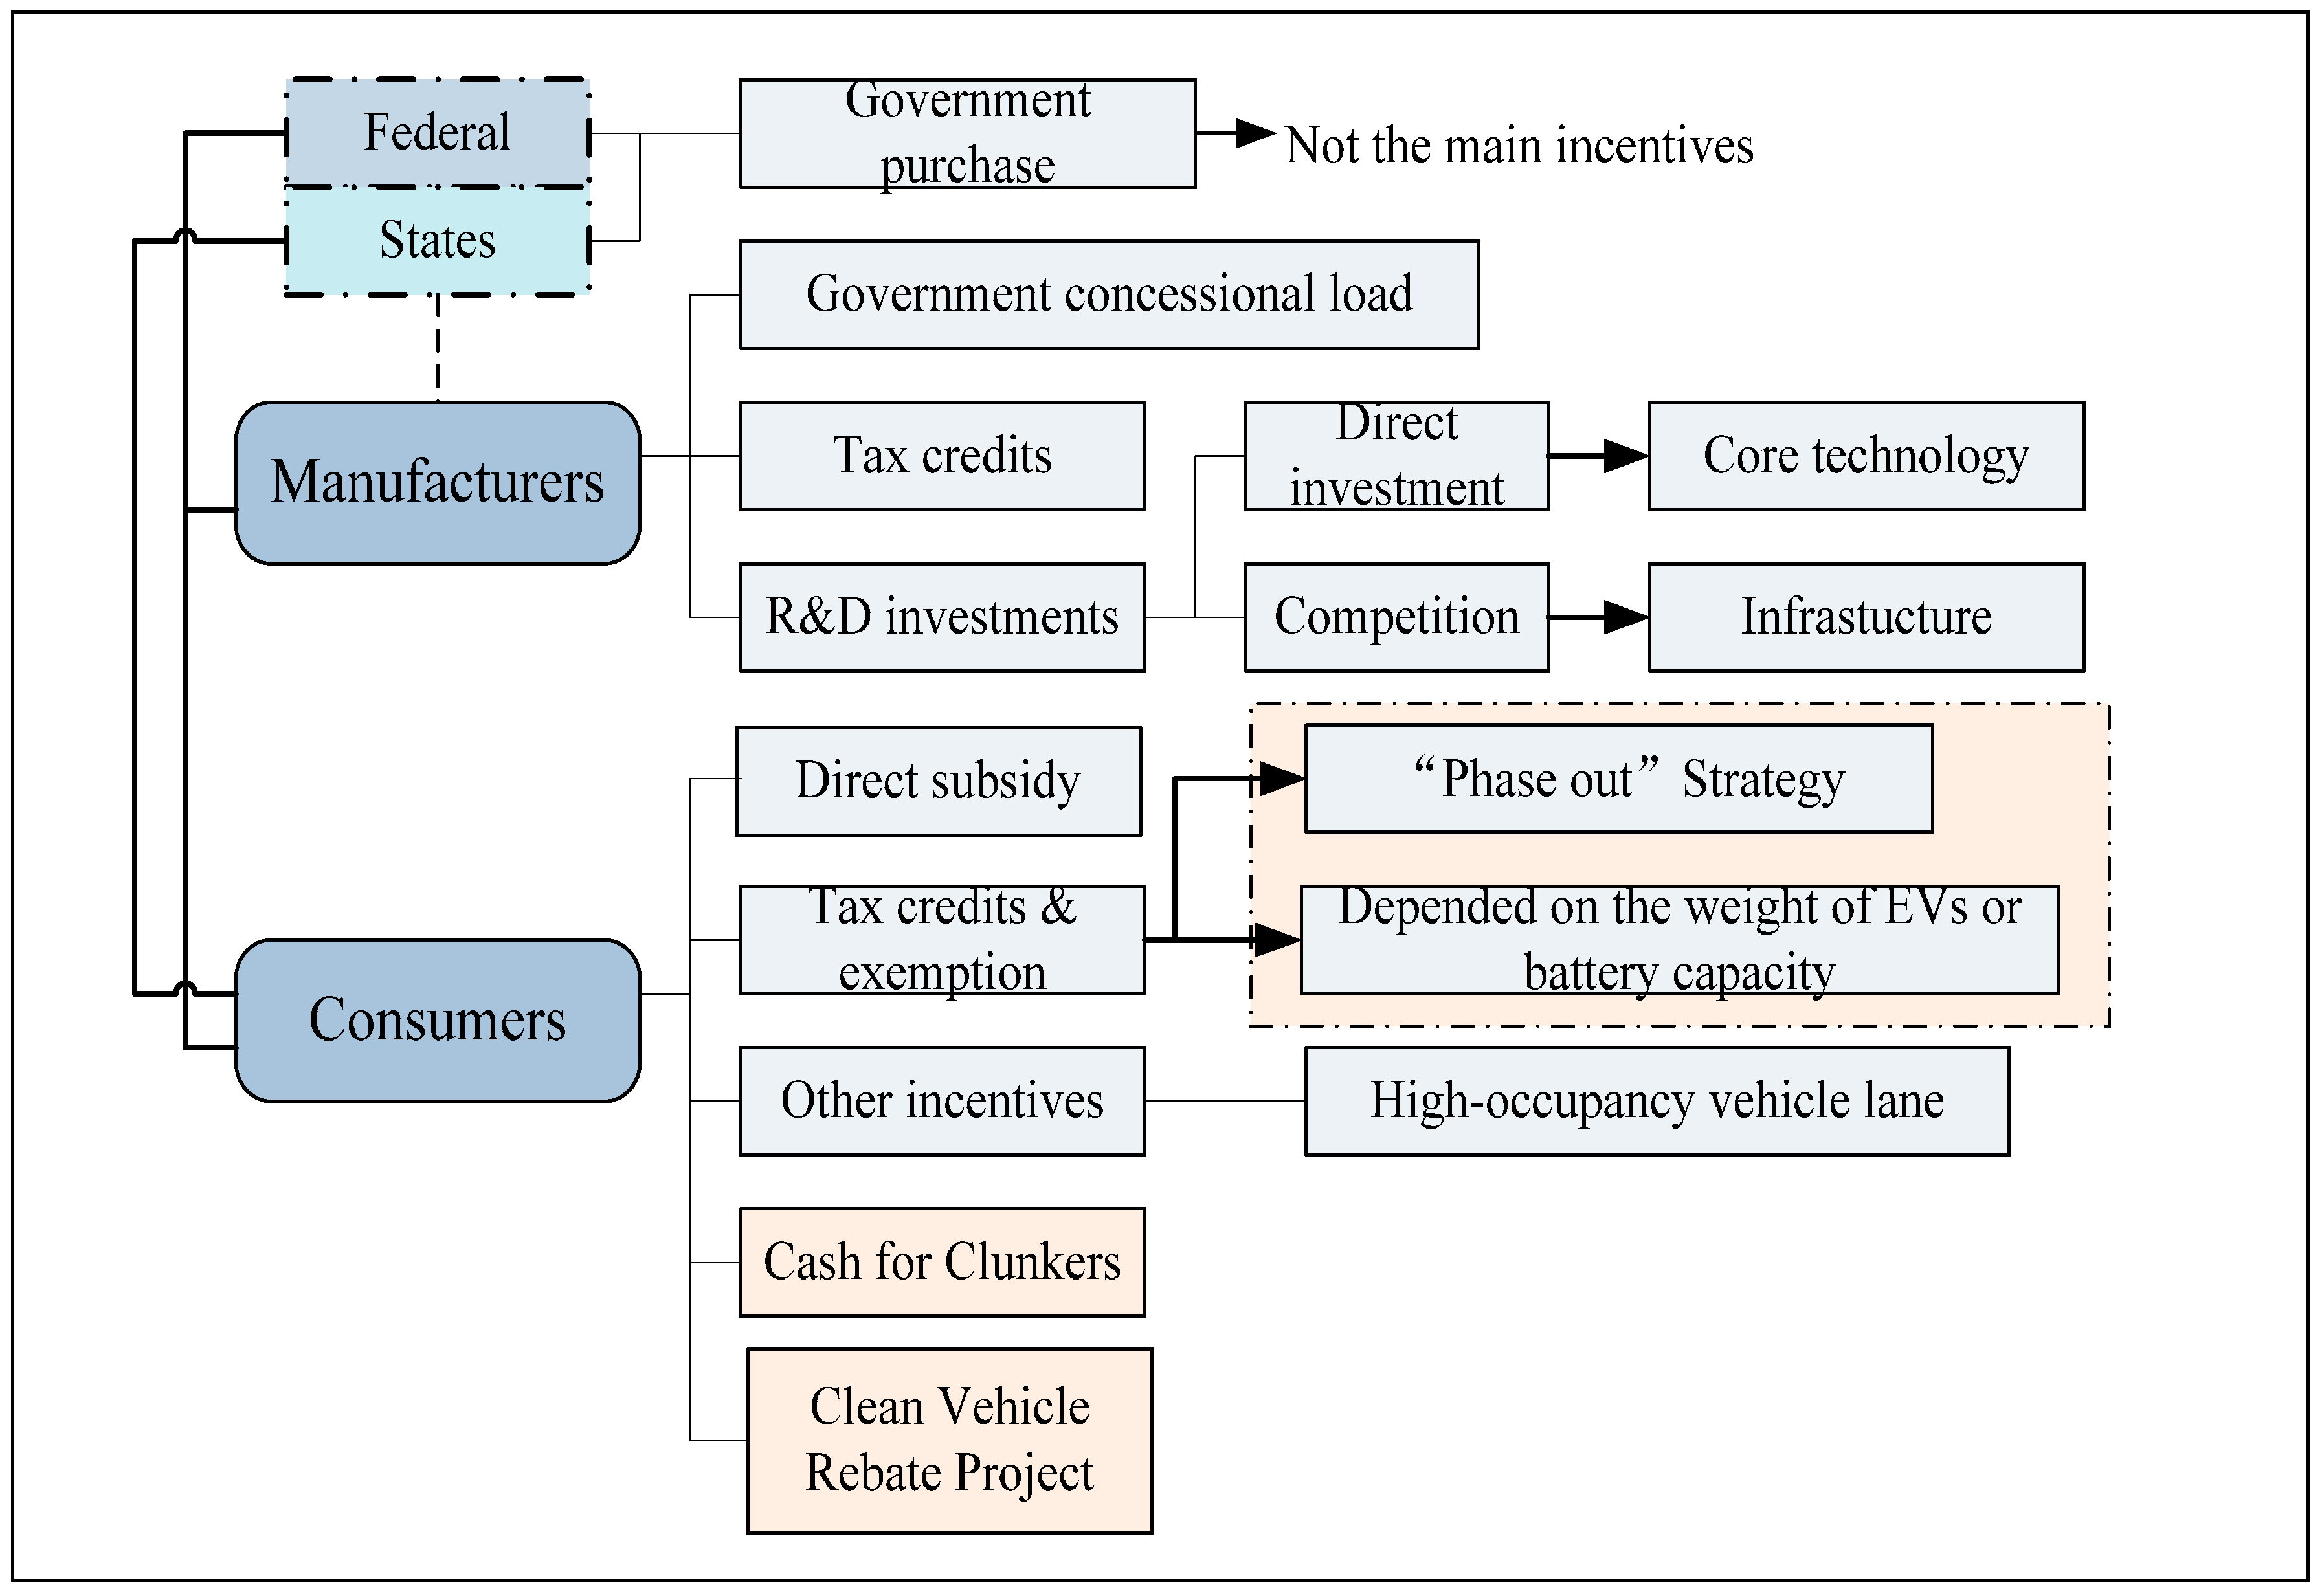
2.4. The General Framework of Financial Incentives

Based on the reviews and the analyses of different countries, we conclude that the general framework of financial incentives is as shown in Figure 8. The framework provides various ways to promote the development of EVs, and each country can use it as a reference based on the current situation. The financial incentives mainly involve the consumers’ incentives and manufacturers’ incentives from the perspective of recipients. The specific financial incentives include direct subsidies, fiscal incentives, fuel cost savings and other incentives, as is shown in Figure 8.
Figure 7. Framework of financial incentives in China.
Sustainability 06 08056 g007
Figure 8. Framework of financial incentives.
Sustainability 06 08056 g008
The direct subsidy means a one-time bonus or investment, and the fiscal incentives refer to the tax credits or tax exemptions of EVs. For fuel cost savings, it is sensible that EVs would be regarded as substitute products for consumers if the petrol price were high. Likewise, the cheap electricity price will be attractive for consumers.

3. Support for Technology

3.1. The Importance of Technology Support

The price of EVs in the infancy stage is high to consumers because of the immature technology, high investment of R&D and high cost of production. Therefore, the rational price that the consumers could accept has to be supported by tax reductions and subsidies from the government. However, the long-term development of EVs depends on key technology, fundamentally, and the cost of EVs would be indeed reduced through technological progress. Thus, many countries, such as America, Germany, Japan and China, have attached great importance to the R&D of relevant technology for EVs. These countries have proposed some plans and policies on technological progress based on their technical resources and their national development strategies.

3.2. Technology Support in United States

According to the EV Everywhere Grand Challenge Blueprint [11], the Obama government is willing to promote EVs in the next few years. This blueprint provides the technical targets, which includes R&D on batteries and electric drive systems, vehicle light weighting technology and advanced climate control technology. The first three technologies are the core technologies, and the details are shown in Table 4.
Table 4. Technical targets in the Blueprint. Source: EV Everywhere Grand Challenge Blueprint (2012) [11].
TechnologyTargets(by 2022)
BatteryReduce cost from $500/kWh in 2012 to $125/kWh
Electric drive systemReduce cost from $30/kWh in 2012 to $8/kWh
Vehicle weight reductionReduce vehicle weight by nearly 30%; includes body, chassis, interior, electric drive components
To better achieve these specific targets, well-coordinated mechanisms, including governments, researchers and companies, are required. In America, the mechanism to develop new technology is mainly based on the project. The government proposed the project and gathered the relevant companies, research institutions and some universities, which were chosen by the government or are in competition to complete the project together (Figure 9). For instance, the government is going to provide $120 billion over the next five years to fund the new Joint Center for Energy Storage Research (JCESR), which is led by the Argonne National Laboratory in Chicago with five national labs, five universities and four private-sector enterprises [57].
Finally, in order to better promote innovations, it is necessary to standardize various technologies. The Society of Automotive Engineers (SAE) is the main institution to unify the standard for EV technologies. For example, America has devoted itself to research on hydrogen fuel cells for several years since the Bush administration. Additionally, in April, 2014, SAE developed two new standards on hydrogen fuel cell vehicle technology: SAE J2601, light gaseous hydrogen vehicles agreement; and SAE-J2799, standards of software and hardware on hydrogen fuel cells. These two standards are cutting-edge in this field [58].
Figure 9. The mechanism to develop technology in America.
Sustainability 06 08056 g009

3.3. Technology Support in Other Countries

The technology incentive in Japan is similar to the United States. Japan has paid more attention to the relevant technologies of EVs, especially the battery. Moreover, it owns core technology on many aspects of EVs, such as the lithium-ion battery and the fuel cell. At first, many automobile companies used lead acid batteries as the power source for propulsion and then turned to the lithium-ion battery. The lithium-ion battery has more advantages, such as a longer driving range and a shorter charging time. Based on the Next-Generation Vehicle Strategy 2010 [15], the R&D was led by the private sector before 2010, namely the enterprises would do the research on what the market needs. Then, the mechanism of R&D will be a government-industry-academia collaboration by 2015. In this strategy, R&D on battery technologies would focus on improving the performance of lithium-ion batteries and developing successors to this battery, as well as creating an environment for the secondary use of batteries.
In Europe, Germany has some certain advantages on the innovation of batteries. Germany has proposed a framework, whose main body is a multitude of projects and measures or stimulus packages made by four ministries, combined with some active participation of businesses and civil organizations. Additionally, the four ministries are the Federal Ministry of Economics and Technology (FMET), the Federal Ministry of Transport, Building and Urban Development (FMTBUD), the Federal Ministry for the Environment, Nature Conservation and Nuclear Safety (NCNS) and the Federal Ministry of Education and Research (FMER) [59]. FMER sponsored the Lithium-ion Battery Alliance to gather resources in 2008, and FMET brought the battery storage plan into effect in 2009 [60]. Besides, the four ministries would combine small and medium-sized enterprises and civil organizations to display the new technology and to promote the knowledge of EVs for citizens through various activities.

4. Support for Charging Infrastructure

Charging infrastructure is assumed to be most strongly related to EV adoption. Sierzchula [2] analyzed the relationship between the charging infrastructure and the adoption of EVs in different countries. It was suggested that the construction of a charging station for every 100,000 residents could have twice the impact on a country’s EV market share than the financial incentives of $1000 to consumers. In addition, all of the policymakers who participated in the group decision room (GDR) system recognized that the advancement of charging infrastructure is necessary for the introduction of EVs [61]. However, the support of charging infrastructure faces the “chicken-and-egg” problem in that the providers will not invest in infrastructure until there is a large-scale adoption of EVs, and people would not choose EVs if there was not enough charging infrastructure. Therefore, from the perspective of government, investment in public charging infrastructure should consider both sides to better realize the adoption of EVs.
There are various modes to support the charging infrastructure. However, the main differences include two parts: the investors and managers; and the suppliers. The overall mode is shown in Figure 10. A country or a city could regard it as a public work, or establish a public-private partnership with one or more service providers, or only depend on private companies.
Figure 10. The modes of developing charging infrastructure.
Sustainability 06 08056 g010
American, Japan and France are under the modes of public-private partnership. In these countries, the governments are usually the investors, but the managers can be other stakeholders, which means that the market for constructing and managing charging stations is open to all companies. These companies can enter this area through fair competition. Besides, the electricity or battery suppliers can be state-owned enterprises or privately-owned companies.
However, in China, the market is monopolized by the State Grid Corporation of China (SGCC) or the China Southern Power Grid (CSPG). SGCC is not only the manager, but also the supplier, and it had already built 400 charging stations and 19,000 charging outlets by the end of 2013 [62]. The advantage of this mode is that it is simple and easy to manage. However, it may hinder the development of the EV market because of there being no competition.

5. The Relationship between the Adoption of EVs and Policies

To better promote the development of EVs, the government of the United States has proposed various policies in recent years. Through the implementation of the policies, America has achieved some success and always maintains the position of having the largest market for EVs in the world [4]. Thus, we take America as a typical example to analyze the relationship between the adoption of EVs and policies.
From the perspective of annual EV sales, it can be seen that the sales of EVs showed an increase overall from 2007 to 2013 (Figure 11). This trend of increase suggests that the relevant policies have had an impact on the use of EVs. Besides, the percentage of EVs of the total vehicle sales presents a growing trend, as well, which implies that consumers have begun to turn their attention towards EVs.
Figure 11. Annual EV sales and the percentage of EVs of total vehicle sales. (Source: Hybridcars [63])
Sustainability 06 08056 g011
However, due to the impact of the subprime mortgage crisis in 2008, many people suffered from unemployment [64]. Therefore, the sales had dropped slightly from 2008 to 2010. What is noteworthy is that the percentage of EVs of total vehicle sales had a small increase, from 2.37% in 2008 to 2.78% in 2009, albeit with decreased sales. This is because of the policy packages of financial incentives, such as ACES-2009 [34] and ARRA-2009 [35], and the program Cash for Clunkers [36] (mainly for HEVs), which was implemented from June to September in 2009 (Figure 12). These policies stimulated more consumers to choose EVs and then improved the percentage of EVs of all vehicles, although the total vehicle sales had decreased. However, the sales of HEVs fell sharply when the program Cash for Clunkers ended on August 24, 2009 [65], as is shown in Figure 12. This indicates that Cash for Clunkers had significantly influenced the purchase of EVs.
With the recovery of the economy and various support by the government, the amount of EV sales tended to grow rapidly from 2011 to 2013. To be specific, the government issued a goal of one million EVs by 2015 in a federal report from February, 2011 [28]. Various policies that mainly involved specific financial incentives, technology support and the construction of charging infrastructure were detailed in the report. Furthermore, the government proposed the EV Everywhere Grand Challenge Blueprint [11] in 2012 to provide the steps and ways to achieve the targeted amount. In the meantime, each state has adopted different incentives to spur the market. In addition, the advanced technology applied in EVs and the wide range of charging infrastructure also confirm the confidence of consumers with respect to EVs.
From the perspective of the types of EVs, successive administrations before the Obama administration had focused on HEVs since the announcement of the Energy Independence and Security Act of 2007(EISA-2007) [66], but the Obama administration mainly focused on PHEVs and BEVs from 2009 [67,68]. The government leaned on developing HEVs in the primary stage, because the technology of this type was more mature than PHEVs and BEVs. Therefore, there are scarcely any sales of PHEVs and BEVs from 2007 to 2011, as is shown in Figure 12. This suggests that technology support is crucial to developing EVs. With much of the R&D investment in batteries, the driving range and performance of PHEVs and BEVs have greatly improved.
Figure 12. The relationship between policies and the adoption of EVs in the United States. ACES-2009, American Clean Energy and Security Act of 2009; ARRA-2009, American Recovery and Reinvestment Act of 2009. (Source: Hybridcars [63].)
Sustainability 06 08056 g012
Especially after the Chevrolet Volt (PHEV) and Nissan Leaf (BEV) were put onto the market in 2011 [69,70], the sales of PHEVs and BEVs increased rapidly in the next two years, as is shown in Figure 12 and Figure 13. However, from 2011 to 2012, the speed of growth of the sales of PHEVs was higher than for BEVs. There were two main reasons to explain this phenomenon. First of all, there was the worry of the driving range, which influences the purchase of BEVs [71]. Secondly, there was the high price, which hindered consumers’ purchases, though the financial incentives were place on BEVs [72]. In addition, the inconvenience of charging BEVs may also influence the purchase intention. However, from 2012 to 2013, conversely, the speed of growth of BEVs was much higher than PHEVs. This is because the financial incentives of each state tend to support BEVs, and the amount is higher than PHEVs (Table 2). Besides, the charging infrastructure is improving, which supports power for BEVs [72].
Figure 13. Annual sales of PHEV and BEVs in the United States (Source: Hybridcars [63].)
Sustainability 06 08056 g013
To reduce petroleum dependence and enhance environmental stewardship, President Obama called for putting one million EVs (referring to PHEVs and BEVs) on the road by 2015 in his 2011 State of the Union Address. From then on, many policies that we reviewed above have been implemented to better achieve the goal. Given the difficulty of collecting the number of EVs on the road, we take the cumulative sales from 2011 to 2013 as the reference in this paper. From Figure 13, the cumulative total sales had reached 167,272 by the end of 2013. The distance from the target number of EVs is 832,728. From Figure 13, the growth rate reached 197.9% from 2011 to 2012 and 83.03% from 2012 to 2013. Based on the average growth rate of the last two years, we estimate that the cumulative sales will reach more than one million by the end of 2016 if the policies keep going for the development of EVs. The development of EVs in the past three years has made great progress, which can be proven by the growth rate, even though America cannot realize its target in time.

6. Conclusions and Further Research

6.1. Conclusions

The purpose of this paper is to explore the policy mechanism or the framework of several countries whose policies are typical and effective. To conclude the review of the characteristics of the policy mechanisms, we reviewed the mechanisms from three aspects of policy (that is, financial incentives, technology support and charging infrastructure) on the adoption of EVs in different countries. We qualitatively demonstrated the relationship between the policies and the adoption of EVs by taking America as an example, because the United States has the largest sales of EVs and the number of its EVs on road is close to the target of one million. Descriptive analysis indicated how policies, such as government financial incentives or technology support, could dramatically affect the adoption of EVs, as is shown in Figure 12. This analysis provides the visual endorsement of each specific policy as a way to significantly encourage the purchase of EVs.
We summarized the advantages and disadvantages of different countries in the process of developing EVs based on the classified framework and mechanism. Therefore, countries can learn from each other to better develop EVs of their own.
China has been the largest CO2 emitter in the world, and the serious haze problem has recently invaded a lot of cities. China therefore is chosen as an example in this paper. It is more urgent and necessary to adopt effective policies to accelerate the development of EVs. Based on our summary of the mechanisms, the advantage in China is that it intends to decrease the purchase of conventional vehicles by traffic controls or a registration lottery. In addition, China had proposed subsidies to consumers who bought EVs. However, the disadvantage is that the subsidies are strictly limited because of local protectionism. For example, only ten types of EV could enjoy the subsidies in Beijing. However, the Chevrolet Volt (PHEV) and Nissan Leaf (BEV), as two most popular models in America and Europe, did not get any subsidies or enjoy any policies [73]. On the contrary, the subsidies are given to the qualified vehicles that emit less emissions in Europe or in America. Therefore, China should open its arms to welcome good models to spur the desire of people to purchase EVs, which could really relieve the fog and haze problems in the big cities. Besides, there is scarcely no onus nor credits for manufacturers or the stakeholders in China, which affects the enthusiasm of producers and sellers. China could establish the mechanisms by imitating the practices of the U.K. or France: reward the manufacturers who produce and sell a new car that emits less CO2 emissions and punish those who produce a more polluting model. These policies can also stimulate the innovation of automobile companies to produce EVs.
In terms of technology support, Japan tends to concentrate on the core technology. The companies will decide their research direction and utilize their own funds or some investment given by government to gather the research institutions to exploit new technology. The advantage of this way, dominated by the companies, is that good theoretical research allows the easy realization of practical applications. However, the factors, such as the system of the nation or educational level, which influence innovation, are comprehensive and complicated. Therefore, it is difficult to imitate the mechanism of technology support totally in a short time, not like the financial incentives. However, in this paper, we still supply some mechanisms and the innovation direction of advanced countries, as is seen in Section 3, to be used as a reference for developing countries with weaker technology.
From the perspective of the mechanism of constructing the charging infrastructure, the market was monopolized by two large-sized power grid companies, and the electricity was supplied by these two companies in China. The advantage is that the charging infrastructure could be constructed in a short time, and it is easier to manage and maintain the infrastructure. Besides, the earnings are simple to calculate, because they belong to the power grid companies, which could avoid a conflict of interest. However, this may hinder the development of charging infrastructure and the quality of service because of the lack of competition. Therefore, China should open the market to stakeholders gradually, and the government should establish an effective competition mechanism to attract investors, as America does. In addition, the government should pay more attention to the layout of the charging infrastructure, because a reasonable charging infrastructure layout would support the charging demand and strengthen consumers’ confidence in the future of EVs.

6.2. Further Research

This study combed the policy mechanisms and frameworks of financial incentive, technology support and construction of charging infrastructure through qualitative analysis of some typical countries. In our next work, we would use a quantitative analysis method, such as econometric analysis or comprehensive evaluation, to identify which policies are important to a country’s market of EVs and assess the effectiveness of the policies in a country based on the policies that we studied in this paper. Further research is necessary to collect more data from different countries, or if there are other policies that also need to be presented, but were not included in this paper. For example, the mechanisms of the industrial chain, which may influence the production of EVs, and the mechanisms of electricity pricing or petroleum pricing, which may influence the purchasing of EVs.

Acknowledgments

The authors would like to thank the anonymous referees and the editor of this journal. The authors gratefully acknowledge the financial support by the National Natural Science Foundation of China (Grant Nos. 71173075 and 71473083), Beijing Natural Science Foundation of China (Grant No. 9142016), Beijing Planning Project of Philosophy and Social Science (Grant No. 13JGB054), the Ministry of Education Doctoral Foundation of China (Grant No. 20110036120013), the Program for New Century Excellent Talents in University (NCET-12-0850) and the Fundamental Research Funds of the Central Universities of China (Grant No. 2014XS61).

Author Contributions

In this paper, Xingping Zhang developed the research ideas and implemented the research programs. Jian Xie committed to figuring out how to analyze the relationship between the adoption of EVs and the policies and completed the writing work of Section 1 and Section 5. Rao Rao made the relevant tables and figures and provided some advice on this paper. Yanni Liang collected the relevant policies, including the financial incentives and technology support, and completed the writing work of the corresponding parts.

Conflicts of Interest

The authors declare no conflict of interest.

References

  1. International Energy Agency. World Energy Outlook 2012; OECD/IEA: Paris, France, 2012. [Google Scholar]
  2. Sierzchula, W.; Bakker, S.; Maat, K. The influence of financial incentives and other socio-economic factors on electric vehicle adoption. Energy Policy 2014, 68, 183–194. [Google Scholar] [CrossRef]
  3. International Energy Agency. CO2 Emissions from Fuel Combustion; IEA: Paris, France, 2013. [Google Scholar]
  4. Clean Energy Ministerial; Electric vehicles initiative; International Energy Agency. Global EV Outlook: Understanding the Electric Vehicle Landscape to 2020; OECD/IEA: Paris, France, 2013. [Google Scholar]
  5. Yabe, K.; Shinoda, Y.; Seki, T. Market penetration speed and effects on CO2 reduction of electric vehicles and plug-in hybrid electric vehicles in Japan. Energy Policy 2012, 45, 529–540. [Google Scholar] [CrossRef]
  6. Gass, V.; Schmidt, J.; Schmid, E. Analysis of alternative policy instruments to promote electric vehicles in Austria. Renew. Energy 2014, 61, 96–101. [Google Scholar] [CrossRef]
  7. National Thermal Power Installed Capacity Returns to Account for Less than 70% in 2013. Available online: http://www.coalstudy.com/news/dlhgzx/dl/2013-12-09/1364.html (accessed on 6 June 2014). (In Chinese)
  8. Zhang, X.P.; Rao, R.; Xie, J.; Liang, Y.N. The current dilemma and future path of China’s electric vehicles. Sustainability 2014, 6, 1567–1593. [Google Scholar] [CrossRef]
  9. Bellekom, S.; Benders, R.; Steef, P.; Moll, H. Electric cars and wind energy: Two problems, one solution? A study to combine wind energy and electric cars in 2020 in The Netherlands. Energy 2012, 45, 859–866. [Google Scholar] [CrossRef]
  10. Battistelli, C.; Baringo, L.; Conejo, A.J. Optimal energy management of small electric energy systems including V2G facilities and renewable energy sources. Electr. Power Syst. Res. 2012, 92, 50–59. [Google Scholar] [CrossRef]
  11. US Department of Energy. EV Everywhere Grand Challenge Blueprint; U.S. Department of Energy: Washington, DC, USA, 2013.
  12. Intelligent Grid Interfaced Vehicle Eco-Charging: Project Description. Available online: http://igive.wikidot.com/project-description (accessed on 3 April 2014).
  13. Germany Federal Government’s National Electro Mobility Development Plan. Federal Ministry for the Environment, Nature Conservation, Building and Nuclear Safety. Available online: http://www.bmub.bund.de/fileadmin/bmu-import/files/pdfs/allgemein/application/pdf/nep_09_bmu_en_bf.pdf (accessed on 15 May 2014).
  14. France. Available online: http://www.ieahev.org/by-country/france/ (accessed on 13 April 2014).
  15. Next-Generation Vehicle Strategy 2010. Ministry of Economy, Trade and Industry. Available online: http://www.meti.go.jp/english/press/data/pdf/N-G-V2.pdf (accessed on 17 May 2014).
  16. The State councial of China. Energy Saving and Energy Automobile Industry Planning (2012–2020); The State Council: Beijing, China, 2014. Available online: http://www.china.com.cn/policy/txt/2012-07/09/content_25855476_3.htm (accessed on 21 June 2014).
  17. Norwegian Parliament Extends Electric Car Initiatives Until 2018. Available online: http://www.avere.org/www/newsMgr.php?action=view&frmNewsId=611&section=&type=&SGLSESSID=tqiice0pmjdclt7l4q0s3s1o27 (accessed on 18 October 2014).
  18. Over 20,000 Rechargeable Electric Cars on Norwegian Road. Available online: http://www.gronnbil.no/nyheter/over-20-000-ladbare-biler-pa-norske-veier-article366-239.html?redirect=invalidurl (accessed on 18 October 2014). (In Norwegian)
  19. Jenn, A.; Azevedo, I.L.; Ferreira, P. The impact of federal incentives on the adoption of hybrid electric vehicles in the United States. Energy Econ. 2013, 40, 936–942. [Google Scholar] [CrossRef]
  20. Diamond, D. The impact of government incentives for hybrid-electric vehicles: Evidence from US states. Energy Policy 2009, 37, 972–983. [Google Scholar] [CrossRef]
  21. Krause, R.M.; Carley, S.R.; Lane, B.W. Perception and reality: Public knowledge of plug-in electric vehicles in 21 US cities. Energy Policy 2013, 63, 433–440. [Google Scholar] [CrossRef]
  22. Pohl, H.; Yarime, M. Integrating innovation system and management concepts: The development of electric and hybrid electric vehicles in Japan. Technol. Forecast. Soc. Chang. 2012, 79, 1431–1446. [Google Scholar] [CrossRef]
  23. Ahman, M. Government policy and the development of electric vehicles in Japan. Energy Policy 2006, 34, 433–443. [Google Scholar] [CrossRef]
  24. Zheng, J.; Mehndiratta, S.; Guo, J.Y. Strategic policies and demonstration program of electric vehicle in China. Transp. Policy 2012, 19, 17–25. [Google Scholar] [CrossRef]
  25. Cohen, N.; Naor, M. Reducing dependence on oil? How policy entrepreneurs utilize the national security agenda to recruit government support: The case of electric transportation in Israel. Energy Policy 2013, 56, 582–590. [Google Scholar] [CrossRef]
  26. Jarvinen, J.; Orton, F.; Nelson, T. Electric Vehicles in Australia’s National Electricity Market: Energy Market and Policy Implications. Electri. J. 2012, 25, 63–87. [Google Scholar] [CrossRef]
  27. Multilateral Technology Initiatives, Known as Implementing Agreements. Available online: http://www.ieahev.org/about/ (accessed on 14 April 2014).
  28. Mock, P.; Yang, Z.F. Driving Electrification: A Global Comparison of Fiscal Incentive Policy for Electric Vehicles; White Papers. The International Council on Clean Transportation: San Francisco, CA, USA, 2014. Available online: http://www.theicct.org/driving-electrification-global-comparison-fiscal-policy- electric-vehicles (accessed on 5 June 2014).
  29. Hybrid and Electric Vehicles: The Electric Drive Gains Traction. Available online: http://www.ieahev.org/assets/1/7/IA-HEV_Annual_Report_May_2013_3MB.pdf (accessed on 13 June 2014).
  30. Chevy Volt gets a Low Emissions Package for California; HOV Lanes Access. Available online: http://www.greencarcongress.com/2011/11/volt-20111117.html (accessed on 6 June 2014).
  31. $1Billion Plug-In Incentives Will Speed Auto Industry’s Transformation. Available online: http://www.calcars.org/calcars-news/1008.html (accessed on 8 June 2014).
  32. Energy Policy Act of 2005; U.S. Department of Energy: Washington, DC, USA, 2005. Available online: http://www. afdc.energy.gov/laws/epact_2005 (accessed on 25 June 2014).
  33. Energy Improvement and Extension Act of 2008. Available online: http://en.wikipedia.org/wiki/Energy_Improvement_and_Extension_Act_of_2008#Energy_Improvement_and_Extension_Act_of_2008 (accessed on 25 June 2014).
  34. Notice 2009-89. New Qualified Plug-in Electric Drive Motor Vehicle Credit. In Internal Revenue Bulletin: 2009-48. Available online: http://www.irs.gov/irb/2009-48_IRB/ar09.html (accessed on 17 June 2014).
  35. US Department of Energy. American Recovery and Reinvestment Act of 2009; U.S. Department of Energy: Washington, DC, USA, 2009. Available online: http://www.afdc.energy.gov/laws/arra.html (accessed on 29 June 2014).
  36. Cash for Clunkers. Available online: http://en.wikipedia.org/wiki/Cash_for_Clunkers (accessed on 17 May 2014).
  37. State & Federal Incentives: United States Incentives Map. Available online: http://www.pluginamerica.org/incentives (accessed on 27 June 2014).
  38. Energy Independence and Security Act of 2007; U.S. Department of Energy: Washington, DC, USA, 2007. Available online: http://www.afdc.energy.gov/laws/eisa.html (accessed on 27 June 2014).
  39. President Obama Announces $2.4 Billion in Grants to Accelerate the Manufacturing and Deployment of the Next Generation of U.S. Batteries and Electric Vehicles. Available online: http://www.whitehouse.gov/the_press_office/2.4-Billion-in-Grants-to-Accelerate-the-Manufacturing-and-Deployment-of-the-Next-Generation-of-US-Batteries-and-Electric-Vehicles (accessed on 13 June 2014).
  40. Egbue, O.; Long, S. Barriers to widespread adoption of electric vehicles: An analysis of consumer attitudes and perceptions. Energy Policy 2012, 48, 717–729. [Google Scholar] [CrossRef]
  41. Clean Vehicle Rebate Project. Available online: http://energycenter.org/programs/clean_vehicle_rebate_project (accessed on 15 October 2014).
  42. Zero-Emission Vehicle Standards for 2018 and Subsequent Model Year Passenger Cars, Light-Duty Trucks, and Medium-Duty Vehicles. Available online: http://www.arb.ca.gov/msprog/zevprog/zevregs/1962.2_Clean.pdf (accessed on 10 October 2014).
  43. Reducing CO2 Emissions from Vans. Available online: http://ec.europa.eu/clima/policies/transport/vehicles/vans/index_en.htm (accessed on 15 June 2014).
  44. Wilde, H.P.J.; Kroon, P. Policy options to reduce passenger cars CO2 emissions after 2020. Available online: http://www.ecn.nl/docs/library/report/2013/e13005.pdf (accessed on 3 June 2014).
  45. Green Car&Van Guide. Website of Green Wise Weekly. Available online: http://www.greenwisebusiness.co.uk/resources/green-car-and-van-guide-10.aspx (accessed on 5 June 2014).
  46. Changes to the Congestion Charge. Available online: http://www.tfl.gov.uk/modes/driving/congestion-charge/changes-to-the-congestion-charge (accessed on 5 June 2014).
  47. London to Introduce New Ultra Low Emission Discount for Congestion Charge Scheme; Countering Dieselization. Available online: http://www.greencarcongress.com/2013/04/uled-20130424.html (accessed on 7 October 2014).
  48. Plug-in Car and Van Grants. Available online: https://www.gov.uk/plug-in-car-van-grants/eligibility (accessed on 7 October 2014).
  49. Scrappage Scheme Boosts Car Sales. Available online: http://news.bbc.co.uk/2/hi/business/8186992.stm (accessed on 17 June 2014).
  50. Overview of Purchase and Tax Incentives for Electric Vehicles in the EU. Available online: http://www.acea.be/uploads/publications/Electric_vehicles_overview_2014.pdf (accessed on 19 June 2014).
  51. Reducing CO2 Emissions from Passenger Cars. Available online: http://ec.europa.eu/clima/policies/transport/vehicles/cars/index_en.htm (accessed on 29 September 2014).
  52. The Subsidy Policy of New Energy Vehicles in Seven Cities of China. Available online: http://news.ddc.net.cn/newsview_48562.html (accessed on 29 June 2014). (In Chinese)
  53. Thousands of Electric Sanitation Cars Were Purchased for Building the Green City in Beijing. Available online: http://www.360che.com/news/130105/24401.html (accessed on 13 June 2014). (In Chinese)
  54. New Day Electric Vehicles became the Sponsors of Shanghai Expo to Reflect the Concept of Low Carbon in the expo. Available online: http://www.expo2010.cn/a/20091229/000009.htm (accessed on 21 June 2014). (In Chinese)
  55. What Type of BEVs in Beijing? The Brands and Government Subsidies. Available online: http://bj.bendibao.com/news/2013521/104206.shtm (accessed on 10 October 2014). (In Chinese)
  56. Double Policies to Buy Electric Vehicles in Beijing. Available online: http://www.qqddc.com/html/news/201207/news_24839.html (accessed on 12 October 2014). (In Chinese)
  57. Team Led by Argonne National Lab Selected as DOE’s Batteries and Energy Storage Hub. Available online: http://energy.gov/articles/team-led-argonne-national-lab-selected-does-batteries-and-energy-storage-hub (accessed on 23 June 2014).
  58. New SAE International Technical Standards Help Harmonize Hydrogen Fueling Across the Globe. Available online: http://www.prweb.com/releases/2014/03/prweb11672351.htm (accessed on 25 May 2014).
  59. Mobility and Transport Technologies: The Third Transport Research Programme of the German Federal Government. Federal Ministry of Economics and Technology (BMWi). Available online: http://www.bmwi.de/English/Redaktion/Pdf/mobility-and-transport-technologies,property=pdf,bereich=bmwi2012,sprache=en,rwb=true.pdf (accessed on 12 June 2014).
  60. Research and Innovations for Germany: Results and Outlook. Federal Ministry of Education and Research. Available online: http://www.bmbf.de/pub/forschung_und_innovation_fuer_deutschlan_en.pdf (accessed on 3 July 2014).
  61. Bakker, S.; Jacob, T.J. Policy options to support the adoption of electric vehicles in the urban environment. Transp. Res. Part D Transp. Environ. 2013, 25, 18–23. [Google Scholar] [CrossRef]
  62. State Grid Corporation of China Submits the Report: 400 Charging Station and 190,000 Charging Outlets Were Built. Available online: http://xiehui.cpsa.com.cn/Html/37886_1.html (accessed on 17 June 2014).
  63. Hybridcars. Available online: http://www.hybridcars.com/june-2014-dashboard/ (accessed on 1 July 2014).
  64. The Subprime Mortgage Crisis. Available online: http://www.christianet.com/interestrates/subprimemortgagecrisis.htm (accessed on 1 July 2014).
  65. Cash for Clunkers: Only Hours Remain. Available online: http://www.money.cnn.com/2009/08/24/autos/cash_for_clunkers_final_day/index.htm (accessed on 27 June 2014).
  66. Shen, H.C. The Top Institutions of AMERICA Promote the Policies of Electric Vehicles Industry. Available online: http://www.cet.com.cn/wzsy/gysd/1230641.shtml (accessed on 19 May 2014).
  67. Zhu, Y.F.; Fang, H.F. Research on the electric vehicles’ policies in America and the significance to apply in China. Auto Ind. Res. 2013, 8, 30–33. (In Chinese) [Google Scholar]
  68. Zhang, F.Z.; Cooke, P. The Green Vehicle Trend: Electric, Plug-in Hybrid or Hydrogen Fuel Cell; Centre for Advanced Studies: Cardiff University, UK. Available online: http://www.dime-eu.org/files/active/0/Cooke-09-Fang-Green-vehicle-Review.pdf (accessed on 27 June 2014).
  69. Nissan Leaf. Available online: http://en.wikipedia.org/wiki/Nissan_Leaf (accessed on 27 June 2014).
  70. Cheverolet Volt. Available online: http://en.wikipedia.org/wiki/Chevrolet_Volt (accessed on 27 June 2014).
  71. Axsen, J.; Kurani, K.S. Hybrid, plug-in hybrid, or electric-What do car buyers want? Energy Policy 2013, 61, 532–543. [Google Scholar] [CrossRef]
  72. Philip, R.; Wiederer, A. Policy Options for Electric Vehicle Charging Infrastructure in C40 Cities. Available online: http://www.innovations.harvard.edu/cache/documents/11089/1108934.pdf (accessed on 2 July 2014).
  73. The Models that Enjoy the Subsidies in Beijing. Refuse the Imported Electric Vehicles. Available online: http://news.ddc.net.cn/newsview_49285.html (accessed on 9 October 2014).

