1. Introduction
Poyang Lake is one of the largest wetlands in China and is an important water source providing residential and industrial water use for more than 10 million people. In addition to water supply, the lake plays an important role in almost every aspect of environmental system, such as bio-diversification, watershed protection, and forest conservation. The Chinese government realized the importance of the lake and, therefore, in December 2009, the State Council gave an official statement that supported the establishment of Poyang Lake Eco-Economic Zone. This is the first national development program in the history of the Jiangxi Province, focusing on sustainable environmental, social, and economic development for both current and future generations. As the sector that more than 50% of residents in the Jiangxi Province are engaged in, agriculture is the least profitable industry in China. The country has been helping those rural areas and enhancing standard of farmers’ living for many years; however, due to the historical, geographical, and climatic reasons, farmers’ living standards have not been improved significantly. The government subsidy does help increase people’ living standards in this area, but is not a sustainable way to alleviate poverty and enhance residential incomes. Therefore, in order to enhance farmers’ sustainable incomes and improve sustainability of future development, it is necessary to make changes to existing agricultural production patterns.
Biochar is a by-product from the pyrolysis system, where pyrolysis is an important form in bioenergy production. Biochar, found to enhance the fertilizer and irrigation efficiency, increase crop yields, and store carbon in a more stable form [
1,
2], can be used to reduce the environmental degradation in the Poyang Lake Eco-Economic Zone. To achieve the above economic and environmental benefits, pyrolysis, combined with biochar, used as a soil amendment, can be a preferred technology that, not only, provides domestic produced renewable energy, but also results in a more sustainable environmental system for current and future generations. Due to substantial cropland available in the Poyang Lake Eco-economic Zone, renewable energy productions in a form of biochar/pyrolysis could be applied without lack of energy feedstocks.
After rapid and continuous economic development since the late 1990s, the Chinese government has attached greater importance to environmental protection. In the 12th five-year plan of China, reducing consumptions in fossil fuels and emissions of carbon dioxide is a definite target for public policy marking. For example, the Chinese agricultural sector has been intensively using chemicals and N fertilizers to increase crop yields for many years. However, many studies have shown that N fertilizers will increase N
2O emissions due to nitrification and denitrification process [
3,
4]. Therefore, in order to fully analyze the overall Greenhouse Gases (GHG) emissions from the agricultural sector, it is necessary to consider the emissions from the use of N fertilizers. Moreover, conventional tillage releases significant amounts of fertilizers and chemicals to adjacent watershed through rainfalls and runoffs, which increases the nitrogen density and reduces the overall water quality. One way to alleviate the NO
x emissions from cropland and consequent water pollution is the use of biochar as it enhances nutrients and irrigation efficiency, which reduce the leakage of fertilizers from runoffs and rainfalls [
5].
First of all, this study focuses on quantifying the benefits to farmers from biochar production and application in the Poyang Lake Eco-Economic Zone in China. Specifically, the study examines (1) changes on farmers’ revenue via kernel, partial linear, and single index estimators; (2) hauling costs of biochar production and application; (3) potential cost savings in fertilizer and irrigation during crop cultivation; and (4) potential cost saving from water purification in Poyang Lake. The increased benefits after biochar utilization are defined as net additional incomes (NAI hereafter). Instead of estimating the net GHG emissions offset and bioenergy production, we estimate NAI based on the kernel, the partial linear, and the single index estimators. Furthermore, we examine the performance of three estimators on the estimation of NAI. Due to the outperformance among three methods, the kernel estimator is employed to forecast the potential NAI under various scenes. The results indicate that biochar utilization can potentially increase farmers’ incomes if rice is planted, and NAI can be achieved up to ¥114,900. Farmers make more NAI if the pyrolysis plant is built in the south than in the north. This study makes contributions by providing information about how biochar contributes to the enhancement of farmers’ living standards, and cost savings of maintaining water quality. The results also provide useful information for related agricultural and environmental policy decisions. The paper is organized as follows: The next section outlines the relevant literature on biochar.
Section 3 presents the properties resulted from the application of biochar to the Poyang Lake Eco-Economic Zone, as well as data used in the empirical analysis.
Section 4 and
Section 5 present the empirical methodology and the results, respectively. The last section concludes the paper.
2. Literature Review
Currently the main methods of producing renewable energy from cropland are in the forms of bioethanol, bio-diesel, and bioelectricity. In addition to the conventional bioelectricity, an alternative technology, called pyrolysis, emerged and has demonstrated its potential on bioelectricity production and GHG emissions reduction [
5,
6,
7]. Pyrolysis is a process involving heating organic materials at elevated temperature in the absence of oxygen to generate products commonly called bio-oil, biogas, and biochar, all of which can be used in energy production. This process involves recycling of carbon rather than net emission of stored fossil energy storing carbon. Furthermore the biochar can be used as a soil additive and has been found to improve the retention of nutrients and water, enhance crop yields, plus sequester carbon in stable form [
1,
2].
During pyrolysis, biomass is converted into three products:
- (1)
A liquid product that is commonly called bio-oil, pyrolysis oil, or bio-crude;
- (2)
A solid char that can be used in a range of applications, including use as a soil additive (and in that use is commonly called “biochar”) or as a source of energy in the conversion process;
- (3)
A non-condensable gas product containing carbon monoxide (CO), carbon dioxide (CO2), hydrogen (H2), methane (CH4), and higher hydrocarbons, which has been called “biogas”, “syngas”, or “pyrolysis gas”.
Wright
et al. [
8] indicate that fast pyrolysis yields about 15 percent biochar, 70 percent bio-oil, and 13 percent syngas. Slow pyrolysis yields relatively more biochar, but less bio-oil. Ringer
et al. [
9] indicate that, under slow pyrolysis, about 35 percent of the feedstock ends up with biochar, 30 percent as bio-oil, and 35 percent as syngas. In both cases, the bio-oil can then be cleaned and further processed to produce higher-quality fuels, used to produce electricity, or refined to produce chemical feedstocks, such as resins and slow-release fertilizers [
10]. Each of these is a potential source of value. However, outputs from pyrolysis would change depending on the feedstocks used in the pyrolysis process.
Although studies found that biochar has multiple environmental benefits on cropland, land applications of biochar are not a new concept. Sombroek [
11] shows that, in the Amazon Basin, soil has received large amounts of charred materials, and Erickson [
12] shows that these biochar applications are most likely results of both habitation activities and deliberate soil applications by native populations before the arrival of Europeans. Biochar has the potential to improve nutrient retention. Deluca
et al. [
13] present a potential mechanism for how biochar modifies nutrient transformations. They indicate that bio-available C may be adsorbed to biochar surfaces, thereby reducing the potential for immobilization of nitrates formed under biochar stimulation of nitrification. Thus, adding biochar to soil with an organic N source yields an increase in net nitrification. Fire also induces a short-term influence on N availability, but biochar may act to maintain this effect for years to decades.
Chan
et al. [
2] show that if N fertilizer is not added, biochar application does not increase yields of radishes, even with a 100 t·ha
−1 biochar rate. They find that, however, if biochar and N fertilizer are applied together, the biochar/nitrogen fertilizer interaction is significant and biochar can improve the N fertilizer efficiency of the plant. For example, in their experiment the dry material of radishes increases from 95% to 266% under different biochar application rates (10, 50, and 100 t·ha
−1).
Lehmann
et al. [
5] show that biochar is a relatively stable form of C and can stay in soil from several hundred to several thousand years. When converting biomass C to biochar C, it leads to sequestration of about 50% of the initial C compared to the low amounts retained after burning and biological decomposition (less than 10%–20% after 5–10 years). The carbon dioxide emissions offset is calculated to be 12%–84% greater if biochar is put back into the soil instead of being burned to offset fossil fuel use [
5]. McCarl
et al. [
6] show that pyrolysis can have offset efficiency greater than 100% when compared with the emissions of the fossil fuel inputs that are replaced. Pyrolysis is emphasized in this study because it brings, not only, bioelectricity, but also environmental benefits from its by-products, the biochar.
Applications of biochar (or similar materials, such as volcanic ash) on crop yields have been studied since 1980 [
14,
15,
16,
17,
18]. Crops that have been studied include maize, soybeans, Sugi trees, Bauhinia trees, peas, cowpeas, and Mung beans. Throughout these studies, there is no consensus on how much biochar should be applied. Biochar has been applied ranging from 0.5 to 135 t per hectare and most of these applications result in the increase of crop yields except for Kishimoto and Sugiura [
15]. In addition to biochar, the yields and properties of the generated liquid product depend on the feedstocks, the process types and conditions, and the efficiency of product collection [
19].
Based on previous studies, pyrolysis is an option to provide bioenergy and offset more GHG emissions and, thus, it is a potential bioenergy technique that China may be interested in.
3. Background of the Poyang Lake Eco-Economic Zone and Data
3.1. Advantages and Disadvantage of Regional Biochar Production
Biochar/pyrolysis is an alternative way of bioenergy production in Poyang Lake Eco-Economic Zone. Agricultural commodities produced in this area provide significant amounts of inputs to the plant and can be used to produce renewable energy for regional use. Reductions on irrigation and fertilizer application and seed purchase bring economic and environmental benefits. However, transportation and plant construction may be obstacles for this new technology as they involve large initial investments.
3.1.1. Advantages
Biochar application can reduce fertilizer use and decrease the rate of nutrient leakage underground. This is a particularly important property of biochar as the watershed receives less chemical pollutants from cropland if biochar is applied in soil. Reductions in water pollution have both economic and environmental benefits to the people living in this area. For example, costs on water purification are reduced, the risk of water-related diseases is smaller and, thus, associate social expenses, such as medicare, are reduced. In addition, bioenergy can be produced using crop residues and selling residues is another way that increases farmer’s revenues. These tangible and intangible benefits increase social welfare.
3.1.2. Disadvantages
Although biochar/pyrolysis is a potential and feasible method to increase bioenergy production and enhance farmer’s living standards in the Poyang Lake Eco-Economic Zone, it is not easy to apply. Feedstock collection and transportation is a serious problem due to lack of infrastructure in this area. Hauling costs increase with hauling distances. Another difficulty of adopting pyrolysis/biochar in the Poyang Lake Eco-Economic Zone is the feedstock classification. To operate a pyrolysis plant, stable feedstock input is required. However, it is difficult to collect, classify, and store similar crop residues throughout the year, thus, making the supply of raw materials unstable. Although biochar is found to have many environmental and economic benefits, and can last for several thousands of years, it is not guaranteed to stay in the same place. Major
et al. [
20] indicate that biochar may lose up to 50% due to rainfalls and ground runoffs.
3.2. Data
The data of production costs come from the China Agricultural Yearbook, Annual Regional Statistics, and 246 surveys from local farmers. Due to the absence of real biochar application in China, benefits from biochar application are collected from previous studies [
1,
5,
7]. Based on real conditions of the Poyang Lake Eco-Economic Zone, 13 crops such as rice, cotton, sweet potato, and other agricultural commodities from 11 counties are collected in this eco-economic zone. Production and processing data for each production period are collected as some crops, such as rice and watermelon are planted multiple times per year. Transportation, plant construction, and operation and feedstock storage costs are calculated based on French’s [
21] and McCarl
et al.’s [
6] studies.
In the analysis of bioenergy, there are various benefits and costs associated with the procedure of producing and using bioenergy. The main benefits and costs of biochar application are given as follows.
Benefits:- B1
Reduced costs of water purification;
- B2
Farmers’ extra benefits due to increments of crop output from biochar;
- B3
Reduced irrigation costs in conventional cropland production (conventional crops mean rice, sugarcane, corn, etc., not energy crop itself);
- B4
Reduced costs for fertilizer use in conventional crops.
Costs:- C1
Additional labor costs for energy crop production;
- C2
Additional costs for irrigation water;
- C3
Additional costs for seeds, fertilizer, and nutrients;
- C4
Bioenergy feedstock collection and storage costs;
- C5
Transportation costs for bioenergy feedstocks where the density of energy crops should play an important role; the study uses the following equation to represent their relation; hauling
![Sustainability 06 00267 i003]()
where
Y is the yield per hectare,
DEN is the density of a cultivated land for a specific agricultural commodity in the region,
M is the feedstock requirement, and Load Size is 23 t per truck load. The other constants cover loading and travel costs.
- C6
Construction costs for pyrolysis plant (should be affected by inflation, input prices (steel, concrete, etc.), labor supply, and wages);
- C7
Plant operation costs (wage, electricity, and water bills).
As the most important benefits of producing bioenergy in Poyang Lake Eco-economic Zone are to decrease watershed pollution (
B1) and to enhance farmers’ revenues (
B2), this study considers the sum of
B1 and
B2, the benefits that farmers can eventually obtain related to the biochar used (that is, NAI), as the dependent variable due to their values are estimated in output. Other benefits and costs are used as independent variables as they are all related to production and processing activities.
B3,
B4, and
![Sustainability 06 00267 i004]()
are examined individually as they are costs associated with productions of agricultural commodities and biochar. The vector
Z = (
X1,X2,X3,X4) is used as indexes for the benefits and costs from pyrolysis.
X1 and
X2 stand for irrigation savings (B3) and fertilizer savings (B4), respectively; whereas
X3 and
X4 stand for production costs including additional seed, energy, and labor costs (
C1 + C2 + C3), and biochar application costs including transportation, storage, plant construction, and operation costs (
C4 + C5 + C6 + C7), respectively. As our data are collected from three periods, eleven locations, and thirteen crops, dummies are applied, denoted by
![Sustainability 06 00267 i005]()
,
![Sustainability 06 00267 i006]()
, and
![Sustainability 06 00267 i007]()
to address these qualitative attributes. The study analyzes how Z, along with
![Sustainability 06 00267 i005]()
,
![Sustainability 06 00267 i006]()
, and
![Sustainability 06 00267 i007]()
influence NAI (
B1 +
B2)and then forecast NAI if some economic factors change.
As the benefits and costs are estimated based on literatures in which environmental conditions are not the same as China, it is necessary for this study to adjust the values of the variables to reflect the possible boundary where the actual value may locate. As the irrigation and fertilizer efficiency can be enhanced by up to 10% [
5], the study assumes that the benefits from irrigation saving (variable
X1) and reduction of fertilizer use (variable
X2) are adjusted to 5%, 10%, and 20%, where 10% is the baseline from Lehmann
et al. [
5].
X3 represents costs on producing feedstocks that will be used in pyrolysis. As energy and labor costs vary with inflation and other macroeconomic factors, the production costs are assumed to increase or decrease by 10%.
X4 reflects that the biochar application costs may fluctuate up by 5% if inflation happens. The plant location is another factor that must be considered. As the Poyang Lake Eco-Economic Zone is about 5560 km
2, the location of the pyrolysis plant does not affect the production costs of feedstocks, but the hauling costs. In addition, the local soil and weather conditions in the north of Poyang Lake Eco-Economic Zone are different from those in the south. Soil in southern counties is relative barren compared to the north and, therefore, more irrigation and fertilizer application is needed for the southern counties. For these reasons, two possible plant locations are set and see how the change of plant location affects the NAI. This study presents 108 scenarios under the consideration of irrigation and fertilizer savings, production costs, biochar application costs, and plant locations. Specifically, the study considers scenarios including combinations of three types of irrigation savings, three types of fertilizer savings, three types of production costs, two types of biochar application costs, and two possible locations of plant (see
Appendix for the set up of each scenario).
4. Methodology
This study utilizes the nonparametric kernel regression model to analyze how various factors influence NAI and to forecast NAI given some economic conditions. In addition, two semiparametric regression models are employed, which are partially linear and single index, for comparison.
The nonparametric model takes the form:
where
Y is the sum of
B1 and
B2,
f is a smooth function, and ε is the error term.
X includes (Z,
![Sustainability 06 00267 i005]()
,
![Sustainability 06 00267 i006]()
,
![Sustainability 06 00267 i007]()
). In the nonparametric estimation, the study uses the local constant kernel estimator [
22]. The estimator is given by:
where
i,
j, and
k stand for the period, the location, and the type of crop, respectively.
h is the bandwidth, which is used as a smoothing parameter and
K(·) is the kernel function. The Gaussian kernel function is selected in our study and the optimal bandwidth is chosen by the least squares cross-validation.
In addition, semiparametric partial linear and single index regression models are used for comparison. For preventing from multicollinearity in the estimation of the parametric part, the dummies
P3,
L11, and
S13 are dropped. The following are functional forms of semiparametric partial linear and single index models.
where X = ﹛Z,Pi,Lj,Sk﹜, Z = (X1,X2,X3,X4), i = 1, 2, j = 1, 2,…,10, and k = 1, 2,.., 12. γ is the vector of unknown parameters. g and h are smooth functions, and v and u are error terms.
The partial linear model uses a combination of Ordinary Least Square (OLS) and nonparametric regression to estimate the coefficients in the parametric part, denoted by
![Sustainability 06 00267 i008]()
,
![Sustainability 06 00267 i009]()
, and
![Sustainability 06 00267 i010]()
in Equation (3). The model imposes the restriction that the relation between each dummy variable and the dependent variable is linear to separate qualitative effects from quantitative effects. The coefficients
![Sustainability 06 00267 i008]()
,
![Sustainability 06 00267 i009]()
, and
![Sustainability 06 00267 i010]()
identify how the period, the location, and the category of crop influence NAI. The nonparametric part of partial linear model is estimated in terms of the local constant kernel estimator and the optimal bandwidth is chosen based on the least squares cross-validation. On the other hand, the single index model takes the form of Equation (4). This model is a generalization of linear regression model and is a restriction of the nonparametric regression model. The study implements the method proposed by Ichimura [
23] via joint estimation of the bandwidth and coefficient vectors.
5. Results
This section provides the estimation of NAI and the goodness-of-fit measure of estimation in terms of mean squared error (MSE) for the kernel, the partial linear and the single index estimators. By selecting the minimal MSE among three estimators, the kernel estimator is chosen for the NAI forecasting.
The simulation to forecast NAI of using bioenergy is conducted. As the rice is the most widely cultivated crop in the research zone, the experiment is concerned with forecasts of NAI of rice in all scenarios, where possible changes could occur to benefits and costs of using bioenergy.
5.1. Estimation and Model Selection
The estimation of NAI by the kernel, the partial linear and the single index estimators is provided in this sub-section. As there are two places that are possible for building a pyrolysis plant, estimation result is reported in
Table 1a,
Table 1b and
Table 1c.
Table 1a.
Comparisons between original net additional incomes (NAI) with estimated NAI.
Table 1a.
Comparisons between original net additional incomes (NAI) with estimated NAI.
| P | L | C | Original | Kernal | Partial linear | Single index |
|---|
| North | South | North | South | North | South |
|---|
| 1 | 1 | 1 | 4809 | 4763.33 | 4793.422 | 4974.345 | 5007.314 | 4946.746 | 5103.482 |
| 1 | 2 | 1 | 4721 | 4736.208 | 4735.79 | 5359.961 | 5530.222 | 4665.057 | 5308.671 |
| 1 | 3 | 1 | 5676 | 5676 | 5676 | 5648.252 | 5670.761 | 6322.859 | 5676.712 |
| 1 | 4 | 1 | 4716 | 4744.914 | 4719.294 | 5020.843 | 4753.295 | 5058.764 | 4536.993 |
| 1 | 5 | 1 | 6206.456 | 6206.454 | 6205.743 | 6185.272 | 6196.773 | 6205.985 | 6204.738 |
| 1 | 7 | 1 | 4721 | 4748.088 | 4721.008 | 4768.767 | 4722.958 | 4649.366 | 4702.983 |
| 1 | 8 | 1 | 5376.846 | 5376.846 | 5376.846 | 5354.741 | 5373.769 | 5770.384 | 10161.25 |
| 1 | 9 | 1 | 4741 | 4802.156 | 4739.501 | 4743.71 | 4723.214 | 4947.976 | 4819.863 |
| 1 | 10 | 1 | 5981 | 5851.078 | 5641.661 | 4681.945 | 4866.568 | 4846.922 | 5111.227 |
| 1 | 11 | 1 | 5694.334 | 5694.376 | 5694.334 | 5787.274 | 5698.371 | 11838.35 | 5768.29 |
| 2 | 1 | 1 | 4899.6 | 4899.64 | 4899.639 | 5615.957 | 5766.677 | 5122.615 | 5781.586 |
| 2 | 2 | 1 | 4751 | 4750.674 | 4736.835 | 5501.576 | 5635.678 | 4610.312 | 5310.85 |
| 2 | 3 | 1 | 5895 | 5895 | 5895 | 5977.669 | 5907.267 | 7274.263 | 5895 |
| 2 | 4 | 1 | 4708.66 | 4716.49 | 4717.046 | 5740.328 | 5281.908 | 5060.164 | 4607.302 |
| 2 | 11 | 1 | 5861 | 5861 | 5861 | 5950.721 | 5861 | 5701.543 | 6346.944 |
| 2 | 10 | 1 | 5261 | 5261.83 | 5605.26 | 4781.498 | 4763.869 | 4939.753 | 5093.003 |
| 2 | 5 | 1 | 5988.2 | 5986.885 | 5988.913 | 6077.416 | 5998.339 | 5988.671 | 5989.208 |
| 2 | 8 | 1 | 5449.4 | 5450.717 | 5449.4 | 5537.79 | 5470.663 | 5449.464 | 5858.416 |
| 3 | 10 | 1 | 7361 | 7346.821 | 7350.594 | 5900.71 | 7028.352 | 5055.674 | 5555.877 |
| 3 | 8 | 1 | 4961 | 4961.876 | 4960.915 | 4708.693 | 4577.51 | 4683.471 | 4963.44 |
| 3 | 3 | 1 | 5041 | 5040.415 | 5040.923 | 4891.528 | 4562.846 | 5040.499 | 5425.669 |
| 1 | 11 | 2 | 5636 | 5366.982 | 5455.195 | 5425.867 | 4986.908 | 5072.267 | 5152.384 |
| 1 | 8 | 2 | 5061 | 5040.343 | 5060.896 | 4670.54 | 4688.648 | 4951.743 | 4919.161 |
| 1 | 10 | 2 | 4961 | 5043.958 | 4961.013 | 4894.653 | 4984.844 | 5055.561 | 5589.02 |
| 1 | 5 | 2 | 4857.7 | 5001.743 | 4931.743 | 4839.726 | 4444.167 | 4927.286 | 5275.227 |
| 1 | 4 | 2 | 4952.7 | 5087.716 | 4965.946 | 5576.177 | 5219.25 | 4916.047 | 4947.132 |
| 1 | 3 | 2 | 4931 | 4932.116 | 4921.896 | 4864.275 | 4871.558 | 4650.74 | 4491.082 |
Table 1b.
Comparisons between original NAI with estimated NAI.
Table 1b.
Comparisons between original NAI with estimated NAI.
| P | L | C | Original | Kernal | Partial linear | Single index |
|---|
| North | South | North | South | North | South |
|---|
| 1 | 1 | 2 | 5231 | 5171.993 | 5152.137 | 4830.031 | 4707.25 | 4979.677 | 5163.495 |
| 2 | 3 | 2 | 4861 | 4861.118 | 4904.665 | 4870.855 | 4794.196 | 4725.777 | 4748.784 |
| 3 | 3 | 2 | 4861 | 4861.172 | 4910.253 | 5029.364 | 4876.95 | 4731.433 | 4748.578 |
| 1 | 8 | 3 | 4811 | 4778.934 | 4811.002 | 4883.107 | 4803.294 | 4936.716 | 4735.904 |
| 1 | 3 | 3 | 4414.333 | 4414.323 | 4414.333 | 4483.631 | 4380.755 | 4725.223 | 4912.234 |
| 1 | 1 | 3 | 4401 | 4434.149 | 4401.068 | 4521.42 | 4461.863 | 4871.878 | 5625.385 |
| 1 | 4 | 3 | 4081 | 4081.518 | 4081.012 | 4342.818 | 4102.52 | 4932.72 | 4609.078 |
| 1 | 3 | 4 | 4116 | 4116.145 | 4116.047 | 4762.833 | 4923.758 | 4536.783 | 4965.084 |
| 1 | 4 | 4 | 4284.75 | 4458.761 | 4284.808 | 4727.395 | 4482.09 | 4985.7 | 4742.311 |
| 1 | 8 | 4 | 5151 | 4977.044 | 5150.99 | 4832.424 | 5111.077 | 4926.685 | 4731.594 |
| 1 | 1 | 4 | 4701 | 4701.521 | 4701.114 | 6110.228 | 5967.954 | 4923.338 | 4532.092 |
| 1 | 3 | 5 | 4723.5 | 4739.195 | 4723.495 | 4734.058 | 4922.715 | 4692.482 | 5425.172 |
| 1 | 5 | 5 | 4206 | 4336.651 | 4513.197 | 4682.083 | 4347.022 | 4975.715 | 5574.496 |
| 1 | 1 | 5 | 6501 | 6485.166 | 6501.027 | 6814.416 | 7114.593 | 5028.668 | 5182.155 |
| 1 | 10 | 5 | 4251 | 4514.751 | 4251.051 | 4348.362 | 4351.963 | 4983.538 | 5564.688 |
| 1 | 4 | 5 | 5623.5 | 5269.085 | 5316.144 | 4634.735 | 4428.217 | 4868.871 | 4907.047 |
| 1 | 10 | 6 | 4213.5 | 4169.365 | 4213.589 | 4373.028 | 4441.95 | 4739.142 | 5116.852 |
| 1 | 3 | 6 | 5887.5 | 5887.509 | 5887.493 | 6164.023 | 6299.372 | 4985.716 | 5612.682 |
| 1 | 4 | 6 | 14301 | 14296.72 | 14299.84 | 7570.877 | 7824.61 | 6260.284 | 5630.698 |
| 1 | 8 | 6 | 3951 | 3972.75 | 3951.196 | 4519.755 | 4633.532 | 4930.291 | 4730.929 |
| 1 | 5 | 6 | 3913.5 | 3931.411 | 3913.517 | 4346.492 | 4081.562 | 4887.906 | 5625.432 |
| 1 | 2 | 6 | 5301 | 5301.759 | 5301 | 5330.049 | 5497.558 | 4938.97 | 4589.367 |
| 1 | 3 | 7 | 4787.8 | 4787.814 | 4787.807 | 4831.364 | 4864.722 | 4961.888 | 5942.709 |
| 1 | 4 | 7 | 4831 | 4901.056 | 4831.599 | 6521.545 | 6644.07 | 6408.586 | 5621.434 |
| 1 | 8 | 7 | 5801 | 5799.727 | 5800.713 | 4557.139 | 4715.78 | 4936.78 | 4686.115 |
| 1 | 1 | 7 | 5801 | 5800.623 | 5800.848 | 6189.62 | 5996.479 | 4659.713 | 4582.278 |
| 1 | 10 | 7 | 5001 | 4932.426 | 5001.04 | 7506.026 | 5385.39 | 5902.506 | 5241.082 |
Table 1c.
Comparisons between original NAI with estimated NAI.
Table 1c.
Comparisons between original NAI with estimated NAI.
| P | L | C | Original | Kernal | Partial linear | Single index |
|---|
| North | South | North | South | North | South |
|---|
| 2 | 3 | 7 | 3801 | 3801.077 | 3801.14 | 4502.205 | 4449.213 | 4109.337 | 4411.933 |
| 1 | 3 | 8 | 5401 | 5401.716 | 5401.001 | 5345.82 | 5400.064 | 4871.943 | 5440.143 |
| 1 | 5 | 8 | 35,801 | 35,797.66 | 35,800.65 | 35,775.36 | 35,800.84 | 21378.9 | 21,639.53 |
| 1 | 1 | 8 | 25,801 | 25,799.1 | 25,801 | 25,131.92 | 24,773.66 | 22,103.57 | 21,816.37 |
| 1 | 10 | 8 | 19,801 | 19,801.94 | 19,801 | 14,475.72 | 19,783.86 | 18,493.33 | 19,022.68 |
| 1 | 5 | 9 | 3903.5 | 3956.887 | 3902.979 | 4373.381 | 4241.146 | 4761.519 | 4639.112 |
| 1 | 8 | 9 | 4101 | 4022.455 | 4101.132 | 4357.287 | 4547.025 | 4846.916 | 4539.135 |
| 1 | 3 | 9 | 5301 | 5295.89 | 5300.822 | 4414.927 | 4497.079 | 4694.662 | 5257.987 |
| 1 | 4 | 9 | 3901 | 3944.296 | 3901.66 | 4471.052 | 4388.206 | 5090.297 | 5146.917 |
| 1 | 4 | 10 | 4900.995 | 4809.269 | 4844.69 | 5324.919 | 5241.122 | 7011.599 | 4972.81 |
| 1 | 10 | 10 | 4101 | 4108.502 | 4101.129 | 4271.16 | 4501.985 | 5854.5 | 4403.919 |
| 1 | 11 | 10 | 4401 | 4201.194 | 4400.998 | 4277.461 | 4397.282 | 5586.776 | 5557.421 |
| 1 | 5 | 10 | 3943.5 | 4093.179 | 3943.516 | 3832.693 | 3977.395 | 4622.555 | 4384.608 |
| 1 | 8 | 10 | 3951 | 4024.529 | 3951.155 | 4297.177 | 4490.315 | 4920.935 | 4560.099 |
| 1 | 1 | 10 | 4326 | 4414.562 | 4382.506 | 4600.964 | 4762.073 | 4790.538 | 4541.403 |
| 1 | 3 | 10 | 4138.8 | 4139.12 | 4138.871 | 4340.392 | 4461.165 | 4507.51 | 5688.612 |
| 1 | 8 | 11 | 9926 | 9926 | 9926 | 9903.895 | 9924.406 | 9926 | 9926 |
| 1 | 3 | 11 | 6301 | 6301.418 | 6300.999 | 6049.623 | 6225.372 | 4916.595 | 5866.917 |
| 1 | 4 | 11 | 8801 | 8798.007 | 8798.505 | 8329.813 | 7977.961 | 7419.698 | 6289.73 |
| 1 | 1 | 11 | 6801 | 6805.396 | 6803.814 | 6972.373 | 7171.796 | 9499.524 | 6742.784 |
| 1 | 3 | 12 | 3994.75 | 3994.884 | 3994.857 | 4273.722 | 4434.465 | 4542.38 | 6865.798 |
| 1 | 5 | 12 | 3907.25 | 3908.053 | 3912.015 | 4517.931 | 4407.045 | 5973.36 | 4794.026 |
| 1 | 1 | 12 | 4176 | 4176.307 | 4171.554 | 4942.636 | 5158.758 | 4823.163 | 4572.895 |
| 1 | 10 | 12 | 3926 | 3926.238 | 3926.172 | 4199.373 | 4429.32 | 6006.317 | 4782.971 |
| 1 | 3 | 13 | 4151 | 4165.604 | 4151.036 | 4405.151 | 4731.051 | 4984.349 | 5922.175 |
| 1 | 4 | 13 | 7801 | 7827.343 | 7889.111 | 8922.301 | 6350.853 | 7391.761 | 5677.705 |
| 1 | 4 | 13 | 8801 | 8772.415 | 8720.303 | 8850.908 | 8796.092 | 15657.21 | 17,952.18 |
| 1 | 1 | 13 | 8801 | 8788.445 | 8799.545 | 6588.264 | 7097.306 | 6412.002 | 5556.133 |
It is seen that, in both cases, the estimated NAI by the kernel estimator are very close to the original NAI. However, the estimated NAI by the other estimators slightly differ from the original ones. Through the visual examination of estimated NAI, the kernel estimator dominates the others.
In order to further evaluate the performance of three estimators, the MSE of all estimators on the estimation of NAI is computed. The results are reported in
Table 2. It can be observed that the kernel estimator apparently outperforms the others in the sense of MSE. This result is consistent with the visual examination and it convinces us that the kernel estimator is optimal among three estimators for the forecasting analysis in this study.
Table 2.
Mean squared error (MSE) of NAI estimation.
Table 2.
Mean squared error (MSE) of NAI estimation.
| North | South |
|---|
| kernel | partial linear | single index | kernel | partial linear | single index |
| 6483 | 1,308,538 | 5,345,207 | 6012 | 835,535 | 5,694,548 |
5.2. Forecasting and Interpretation
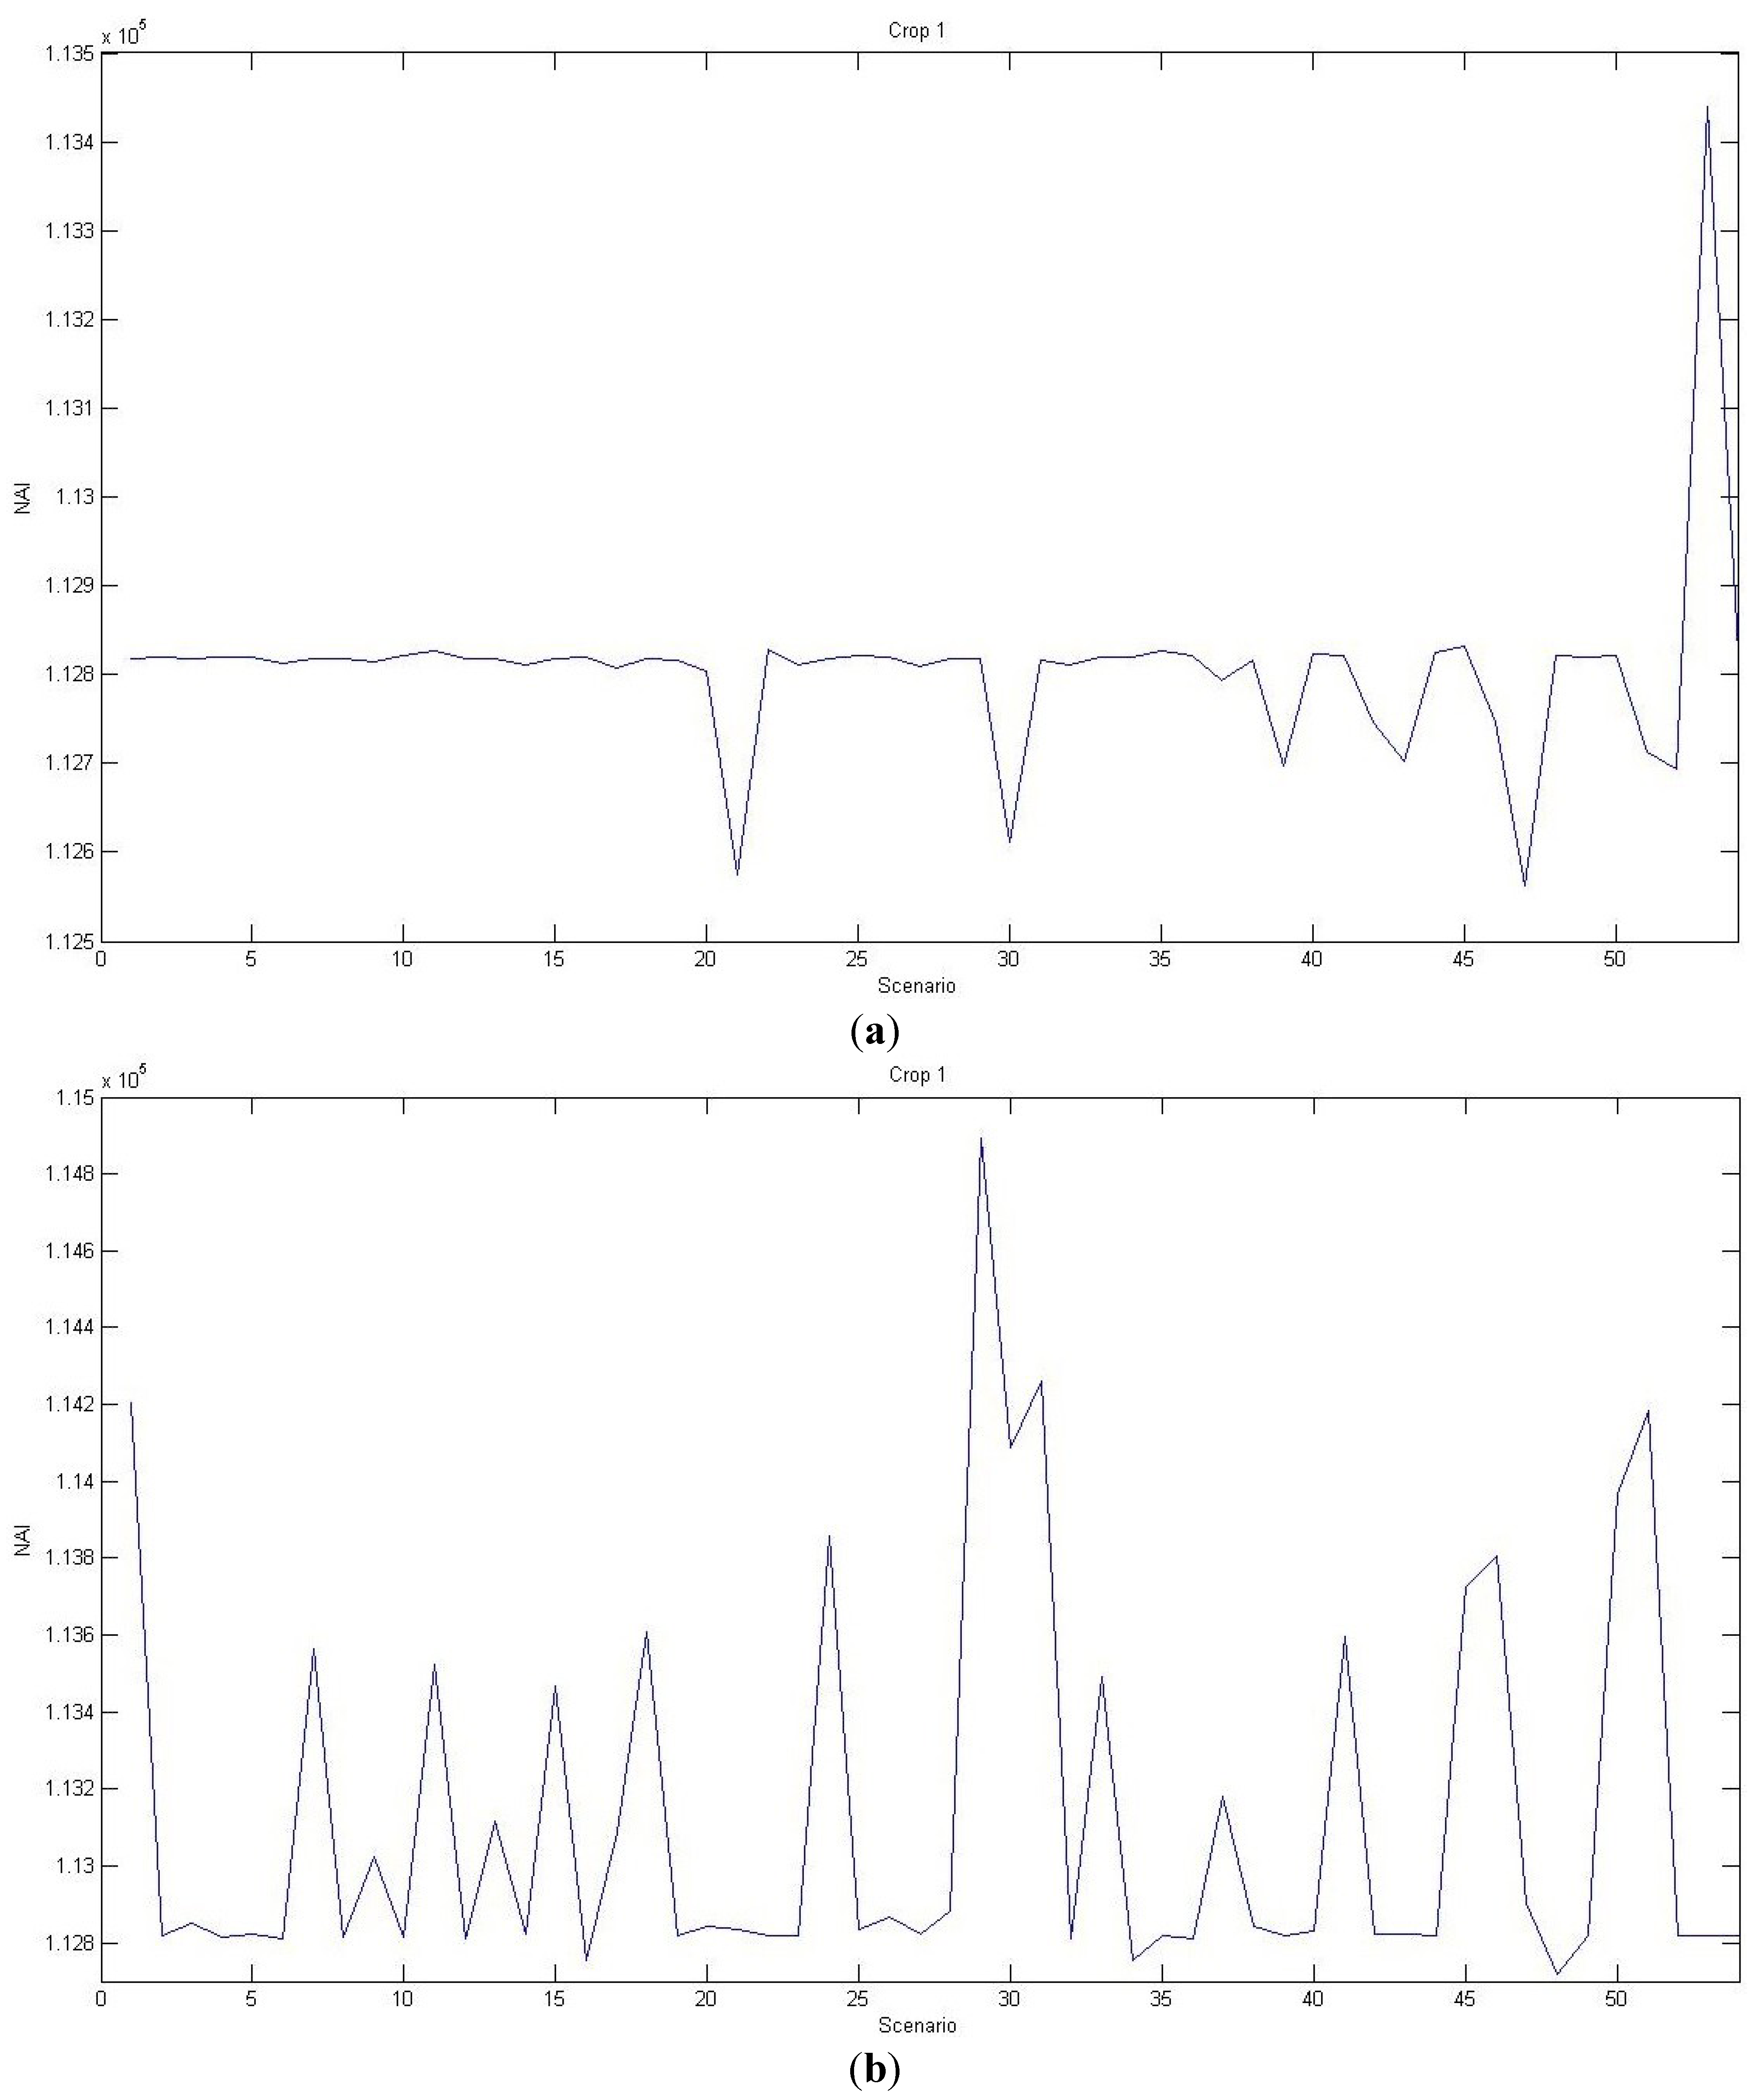
NAI from biochar utilization vary across 108 scenarios under different locations of pyrolysis plant, where 54 scenarios are for the pyrolysis plant built in the north, and 54 scenarios are for the plant built in the south.
Figure 1a shows the forecasted NAI when the pyrolysis plant is in the north. When all associated costs are relative high and fertilizer use is inefficienct (
i.e., 0.5
X2,1.1
X3,1.05
X4), benefits go up if farmers could improve irrigation savings. However, when biochar application costs are low and production costs are high, given efficient irrigation (2
X1,1.1
X3,
X4), NAI is higher if they could improve fertilizer savings. Moreover, given efficient irrigation and fertilizer applications (2
X1,2
X2), NAI could be higher due to factors that make biochar application costs increase under low production costs or factors that make production costs increase under high biochar application costs. Moreover, given high irrigation and fertilizer savings from biochar (2
X1,2
X2), higher NAI can occur due to factors that make biochar application costs increase under low production costs, or factors that make production costs increase under low biochar application costs. It is of interest to see why NAI could rise when production costs increase. This happens when biochar application costs are low, marginal benefits from producing additional output are higher than marginal costs.
NAI could be improved, based on low irrigation and fertilizer savings (0.5X1,0.5X2), by lowering all costs. Furthermore, NAI could rise due to factors that make all associated costs increase given that irrigation and fertilizer savings are high (2X1,2X2) or factors that improve the savings of irrigation and fertilizer use given that all costs are high (1.1X3,1.05X4). Similarly, the reason for increasing NAI if associated costs are rised is that marginal benefits are higher than marginal costs given the level of productions.
Figure 1b demonstrates the forecasted NAI when the pyrolysis plant is in the south. When irrigation and fertilization technologies are relatively efficient and production costs are low (2
X1,2
X2,0.9
X3), NAI go up if farmers could reduce biochar application costs. In addition, NAI is higher by using the same strategy when irrigation and fertilization technologies are inefficient and production costs are high (0.5
X1,0.5
X2,1.1
X3). The result indicates that, if the pyrolysis plant is built in the south of the Poyang Lake Eco-Economic Zone, NAI forecasted in most of scenarios are more than those when the pyrolysis plant is built in the north.
For instance, when irrigation savings are only half of standard level (0.5X1), the forecasted NAI when the plant is in the south outperforms those when the plant is in the north for most secenarios. This is explained as when the irrigation costs are higher in southern counties, lower irrigation savings reduce more NAI. NAI in the south counties are larger due to higher cost savings. On the other hand, the variation of NAI caused by change of 1% irrigation saving in the south is higher than that in the north and, therefore, every loss of 1% irrigation saving in southern counties affects NAI more.
Figure 1.
(a) Forecasted NAI from rice plantation for the pyrolysis plant located in the north of the Poyang Lake Eco-Economic Zone; (b) Forecasted NAI from rice plantation for pyrolysis plant located in the south of the Poyang Lake Eco-Economic Zone.
Figure 1.
(a) Forecasted NAI from rice plantation for the pyrolysis plant located in the north of the Poyang Lake Eco-Economic Zone; (b) Forecasted NAI from rice plantation for pyrolysis plant located in the south of the Poyang Lake Eco-Economic Zone.
5.3. Discussion
Due to geographical conditions, counties located in the north of Poyang Lake can access to water resource easier than southern counties and therefore, when the pyrolysis plant is built in the south, the property of biochar that helps reserve water in soil reduces more costs that farmers need to spend in irrigation. If the pyrolysis plant is built in the north, most of biochar will be applied in adjacent northern counties rather than transported to southern counties as high transportation costs offset NAI. A similar NAI effect happens for fertilizer application as fertilizer costs in southern counties are higher than those in the northern counties. For relative barren soil in southern counties, the fertilizer expense is one of the major costs related to production activities and, therefore, greater reductions in fertilizer use bring more NAI. It indicates that reductions on irrigation and fertilizer costs from using biochar bring higher NAI in the southern counties than in the northern counties. As in
Figure 1a,b, the profile of NAI over all scenarios in the north is more smooth than that in the south. The simulation results show that biochar hauling cost plays an extremely role on the profile of NAI. If the pyrolysis plant is built in the north, which has fertile soil and requires less irrigation and fertilizer, reductions on these costs due to the use of biochar is not as significant as when the plant is in the south. Although biochar can be transported to the south where the land is barren, hauling costs reduce NAI. If the pyrolysis plant is built in the south, hauling costs can be ultimately be reduced and NAI is enhanced.
When the pyrolysis plant is located in the north, a small increase in production and biochar application costs do not have the significant impact on NAI gained by farmers. However, for counties that are closer to the pyrolysis plant, increases in irrigation and fertilizer efficiency generally bring higher NAI. Moreover, for the pyrolysis plant located in the south, if all costs and benefits from biochar are increased (2X1,2X2,1.1X3,1.05X4), NAI are positive but smaller than those of the benchmark scenario (X1,X2,X3,X4) as increases in biochar application costs and production costs outweigh the increased irrigation and fertilizer savings brought from biochar application. However, if costs and benefits decrease, NAI will increase because a 1% decrease in biochar application costs and production costs outweigh the 1% loss in benefits from irrigation and fertilizer saving. If the plant is located in the north, the above NAI effect is not significant for most of scenarios. The study indicates that biochar application can potentially raise farmers’ revenue, reduce production costs, and bring environmental benefits by avoiding water degradation and eutrophication. However, to what extent the benefits can be achieved depend on the local soil condition, annual precipitation, and cultivation patterns. For example, a region with high precipitation may erode biochar and eventually achieve lower economic and environmental benefits.
6. Conclusions
Biochar/pyrolysis is a feasible method to produce clean and renewable energy, along with substantial environmental and economic benefits, including reductions of production and biochar application costs and decreases of irrigation and fertilizer costs. However, there are also difficulties in biochar application due to transportation, feedstock collection and storage. The study examines how biochar, produced from either the northern or the southern pyrolysis plant, is beneficial to farmers around the Poyang Lake Eco-Economic Zone by translating the benefits from using biochar as a soil amendment into quantitative measures. In terms of goodness-of-fit measures of NAI estimation of the kernel, the partial linear and the single index estimators, the kernel estimator dominates the others. It guides us to employ the kernel estimator to forecast NAI of rice under different scenarios. The results indicate that biochar enhances farmers’ income significantly in this area, especially for rice plantation. Nevertheless, due to the land fertility, the location of pyrolysis plant is an important factor as it affects the total amount of hauling costs. If the pyrolysis plant is built in the south, biochar application reduces more costs in irrigation and fertilizer with a low hauling cost. Therefore, hauling cost in biochar transportation is the most important factor affecting NAI and water quality enhancement. As the pyrolysis plant is not widely constructed, the data used in this study are based on the European data and may deviate from real costs if it is built in China. Field investigation on constructing a pyrolysis plant in China is needed. Other countries are able to achieve economic and environmental benefits from pyrolysis and biochar application but investigations, including regional geographical and weather conditions, along with biochar dynamics to quantify the gains and losses, may be needed.


 are examined individually as they are costs associated with productions of agricultural commodities and biochar. The vector Z = (X1,X2,X3,X4) is used as indexes for the benefits and costs from pyrolysis. X1 and X2 stand for irrigation savings (B3) and fertilizer savings (B4), respectively; whereas X3 and X4 stand for production costs including additional seed, energy, and labor costs (C1 + C2 + C3), and biochar application costs including transportation, storage, plant construction, and operation costs (C4 + C5 + C6 + C7), respectively. As our data are collected from three periods, eleven locations, and thirteen crops, dummies are applied, denoted by
  ,
,  , and
, and  to address these qualitative attributes. The study analyzes how Z, along with
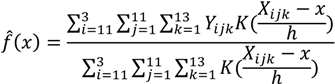
 ,
,  , and
, and  in Equation (3). The model imposes the restriction that the relation between each dummy variable and the dependent variable is linear to separate qualitative effects from quantitative effects. The coefficients
