Article

Pilot Experimentation with Complete Mixing Anoxic Reactors to Improve Sewage Denitrification in Treatment Plants in Small Communities

1
Department of Biotechnologies and Life Sciences, University of Insubria, Via G.B. Vico 46, Varese I-21100, Italy
2
Department of Civil and Environmental Engineering, University of Rome La Sapienza, Via Eudossiana 18, Rome I-00184, Italy
*
Author to whom correspondence should be addressed.
Sustainability 2014, 6(1), 112-122; https://doi.org/10.3390/su6010112
Submission received: 31 October 2013 / Revised: 10 December 2013 / Accepted: 13 December 2013 / Published: 23 December 2013

Abstract

:
This paper reports the results of two sewage treatment tests in a community of 15,000 inhabitants. The sewage treatment plant is subject to strong fluctuations in load (BOD5, COD, TKN), and in particular in the BOD5/TKN ratio. These fluctuations adversely affect the biological denitrification, as demonstrated by many pilot and real-scale plants. The plants we tested were subjected to two treatment types: anoxic-aerobic and simultaneous denitrification. Both processes are designed for complete mixing conditions in the reactors in order to level the fluctuations in the load and thus improve the denitrification efficiency. The results prove that an average denitrification efficiency of up to 80% can be achieved with the sludge loading close to 0.1 kg BOD5 (d∙kgMLVSS)−1. The effect of the sludge loading and dissolved oxygen on the denitrification efficiency is highlighted.

1. Introduction

The strong diurnal fluctuation in BOD5 and TKN loads, of small sewage communities is detrimental to achieving a high denitrification performance.
The influence of variations in sewage quality on the performance of biological processes has been studied since the 1970s. Of particular interest are the experiences described by US-EPA, which shows how to upgrade plants in order to achieve fluctuation control [1], and in which more cautious design criteria are recommended for wastewater treatment plants (WWTPs) serving small communities [2]. With specific reference to the effects on biological denitrification, the scientific literature provides abundant information on nitrogen removal [3,4,5,6,7,8,9,10,11], but rarely refers to small WWTPs. The effects of raw sewage C/N ratio variations in small community WWTPs have been highlighted in the technical literature [12,13,14], which also show the possible negative side effects of dissolved oxygen accumulation in the denitrification stage. In addition, in 2006, in a Life project, the EU emphasized the effects of sharp fluctuations in the quality of raw sewage on the efficiency of biological processes [15].
We have examined this kind of problem in several operating plants serving 5,000–20,000 inhabitants, whose biological denitrification performance was well below expectations. We thus studied an experimental plant with a capacity of about 15,000 inhabitants, located in northern Italy [16,17,18]. The aim was to assess the technical solutions capable of limiting the effects of the strong diurnal fluctuation of BOD5 and TKN charges, thus improving the efficiency of the biological denitrification.
The strong diurnal fluctuations of loads in biological denitrification involve periods with very low values of the BOD5/TKN and BOD5/NO3-N ratios which limit the efficiency of the process, particularly in the evenings and at night. On the other hand, in the middle of the day such ratios were largely in excess of the typical BOD5/NO3-N = 4 ratio required for the appropriate development of sewage denitrification.
Raboni et al. [19] highlighted this problem in a study of a pre-denitrification system served by sewage from a community of 15,000 people, located in northern Italy in a densely urbanized area with several environmental problems leading to significant social consequences [20]. Average denitrification efficiencies of 60.2% were achieved, with isolated peaks of 75%. In addition to the strong variability of loads, the considerable accumulation of oxygen in the denitrification was also highlighted. This occurred mainly in the periods of lower BOD5 input, at the beginning of the day and at night (with peak values of 1.2 mg·L−1) and inhibited the denitrification rate, which is significant at concentrations of 0.2 mg·L−1 or even lower [6,7].
Biological denitrification is normally achieved in a series of anoxic compartments with a power input for mixing limited to 10–12 W·m−3, which is sufficient to maintain the mixed-liquor in suspension and at the same time prevent the transfer of oxygen. From a hydrodynamic point of view these systems, as well as other similar ones applied in most real scale plants, are very different from complete mixing and thus the leveling effect of the fluctuations of load input on the reactor is somewhat limited.
The aim of our research was to test typologies of denitrification reactors with a very similar hydrodynamic behavior to complete-mixing by examining the impact on performance. A modified oxidation ditch reactor with rotating brushes was thus used.

2. Materials and Methods

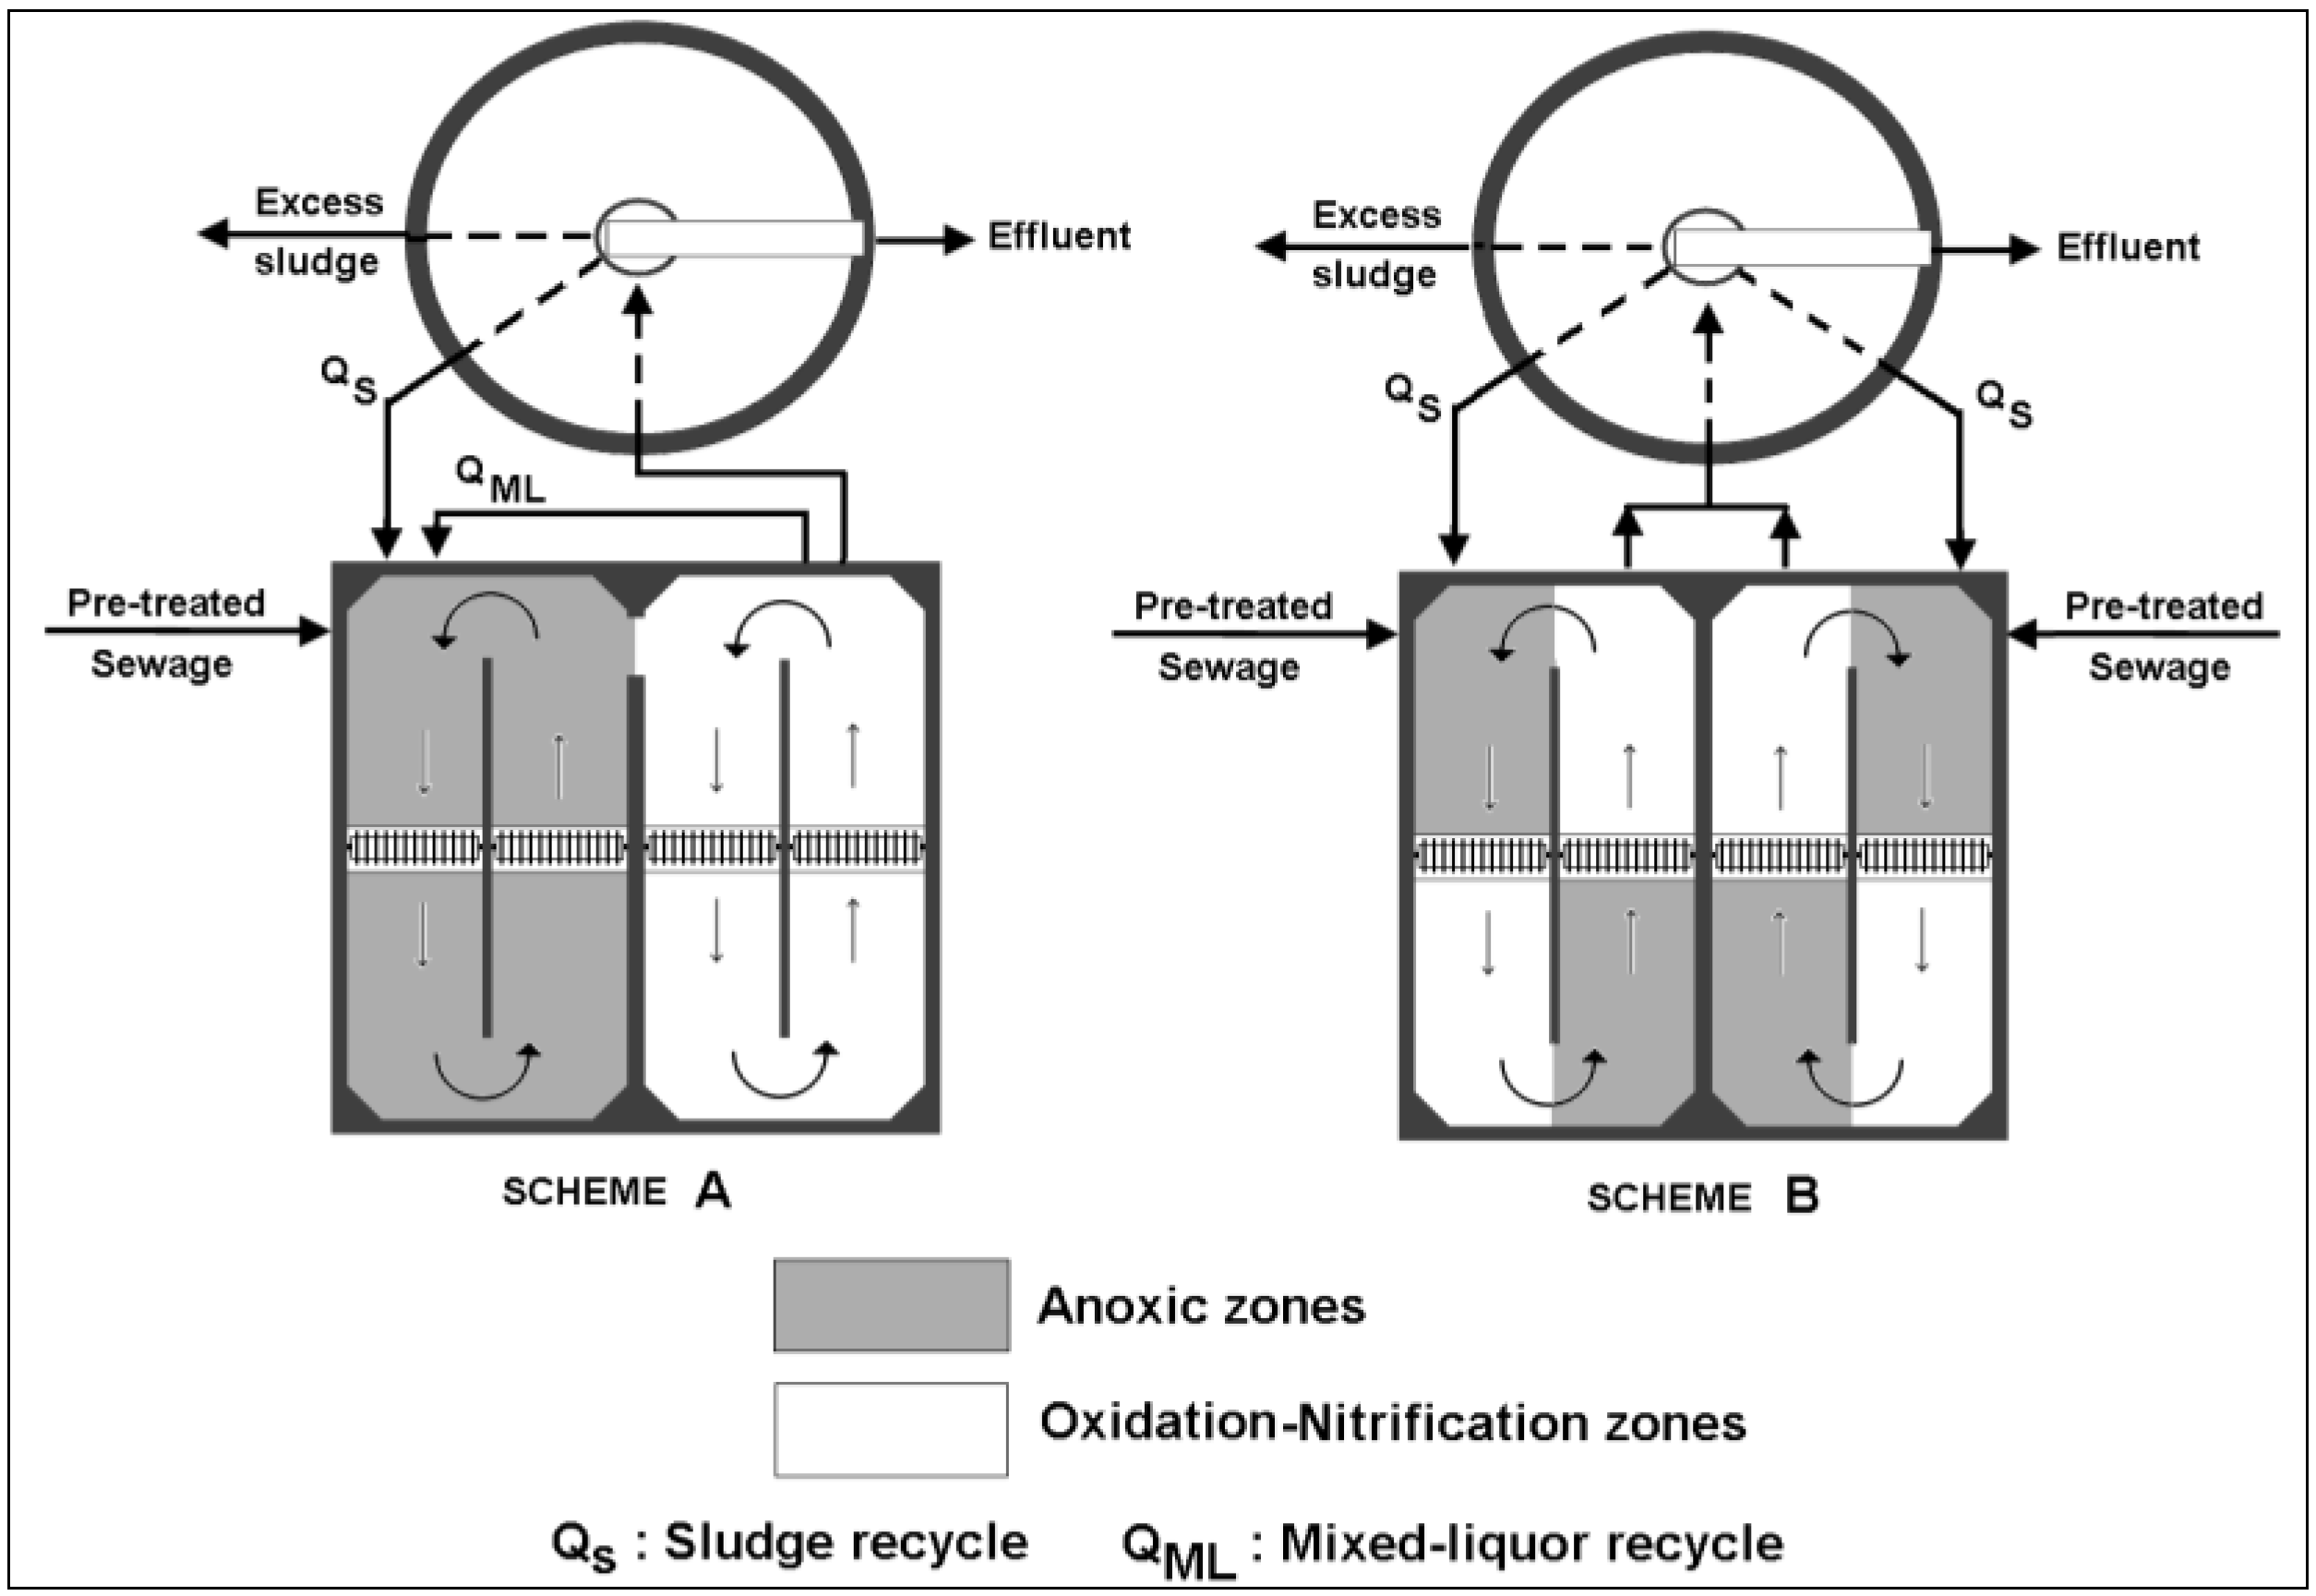
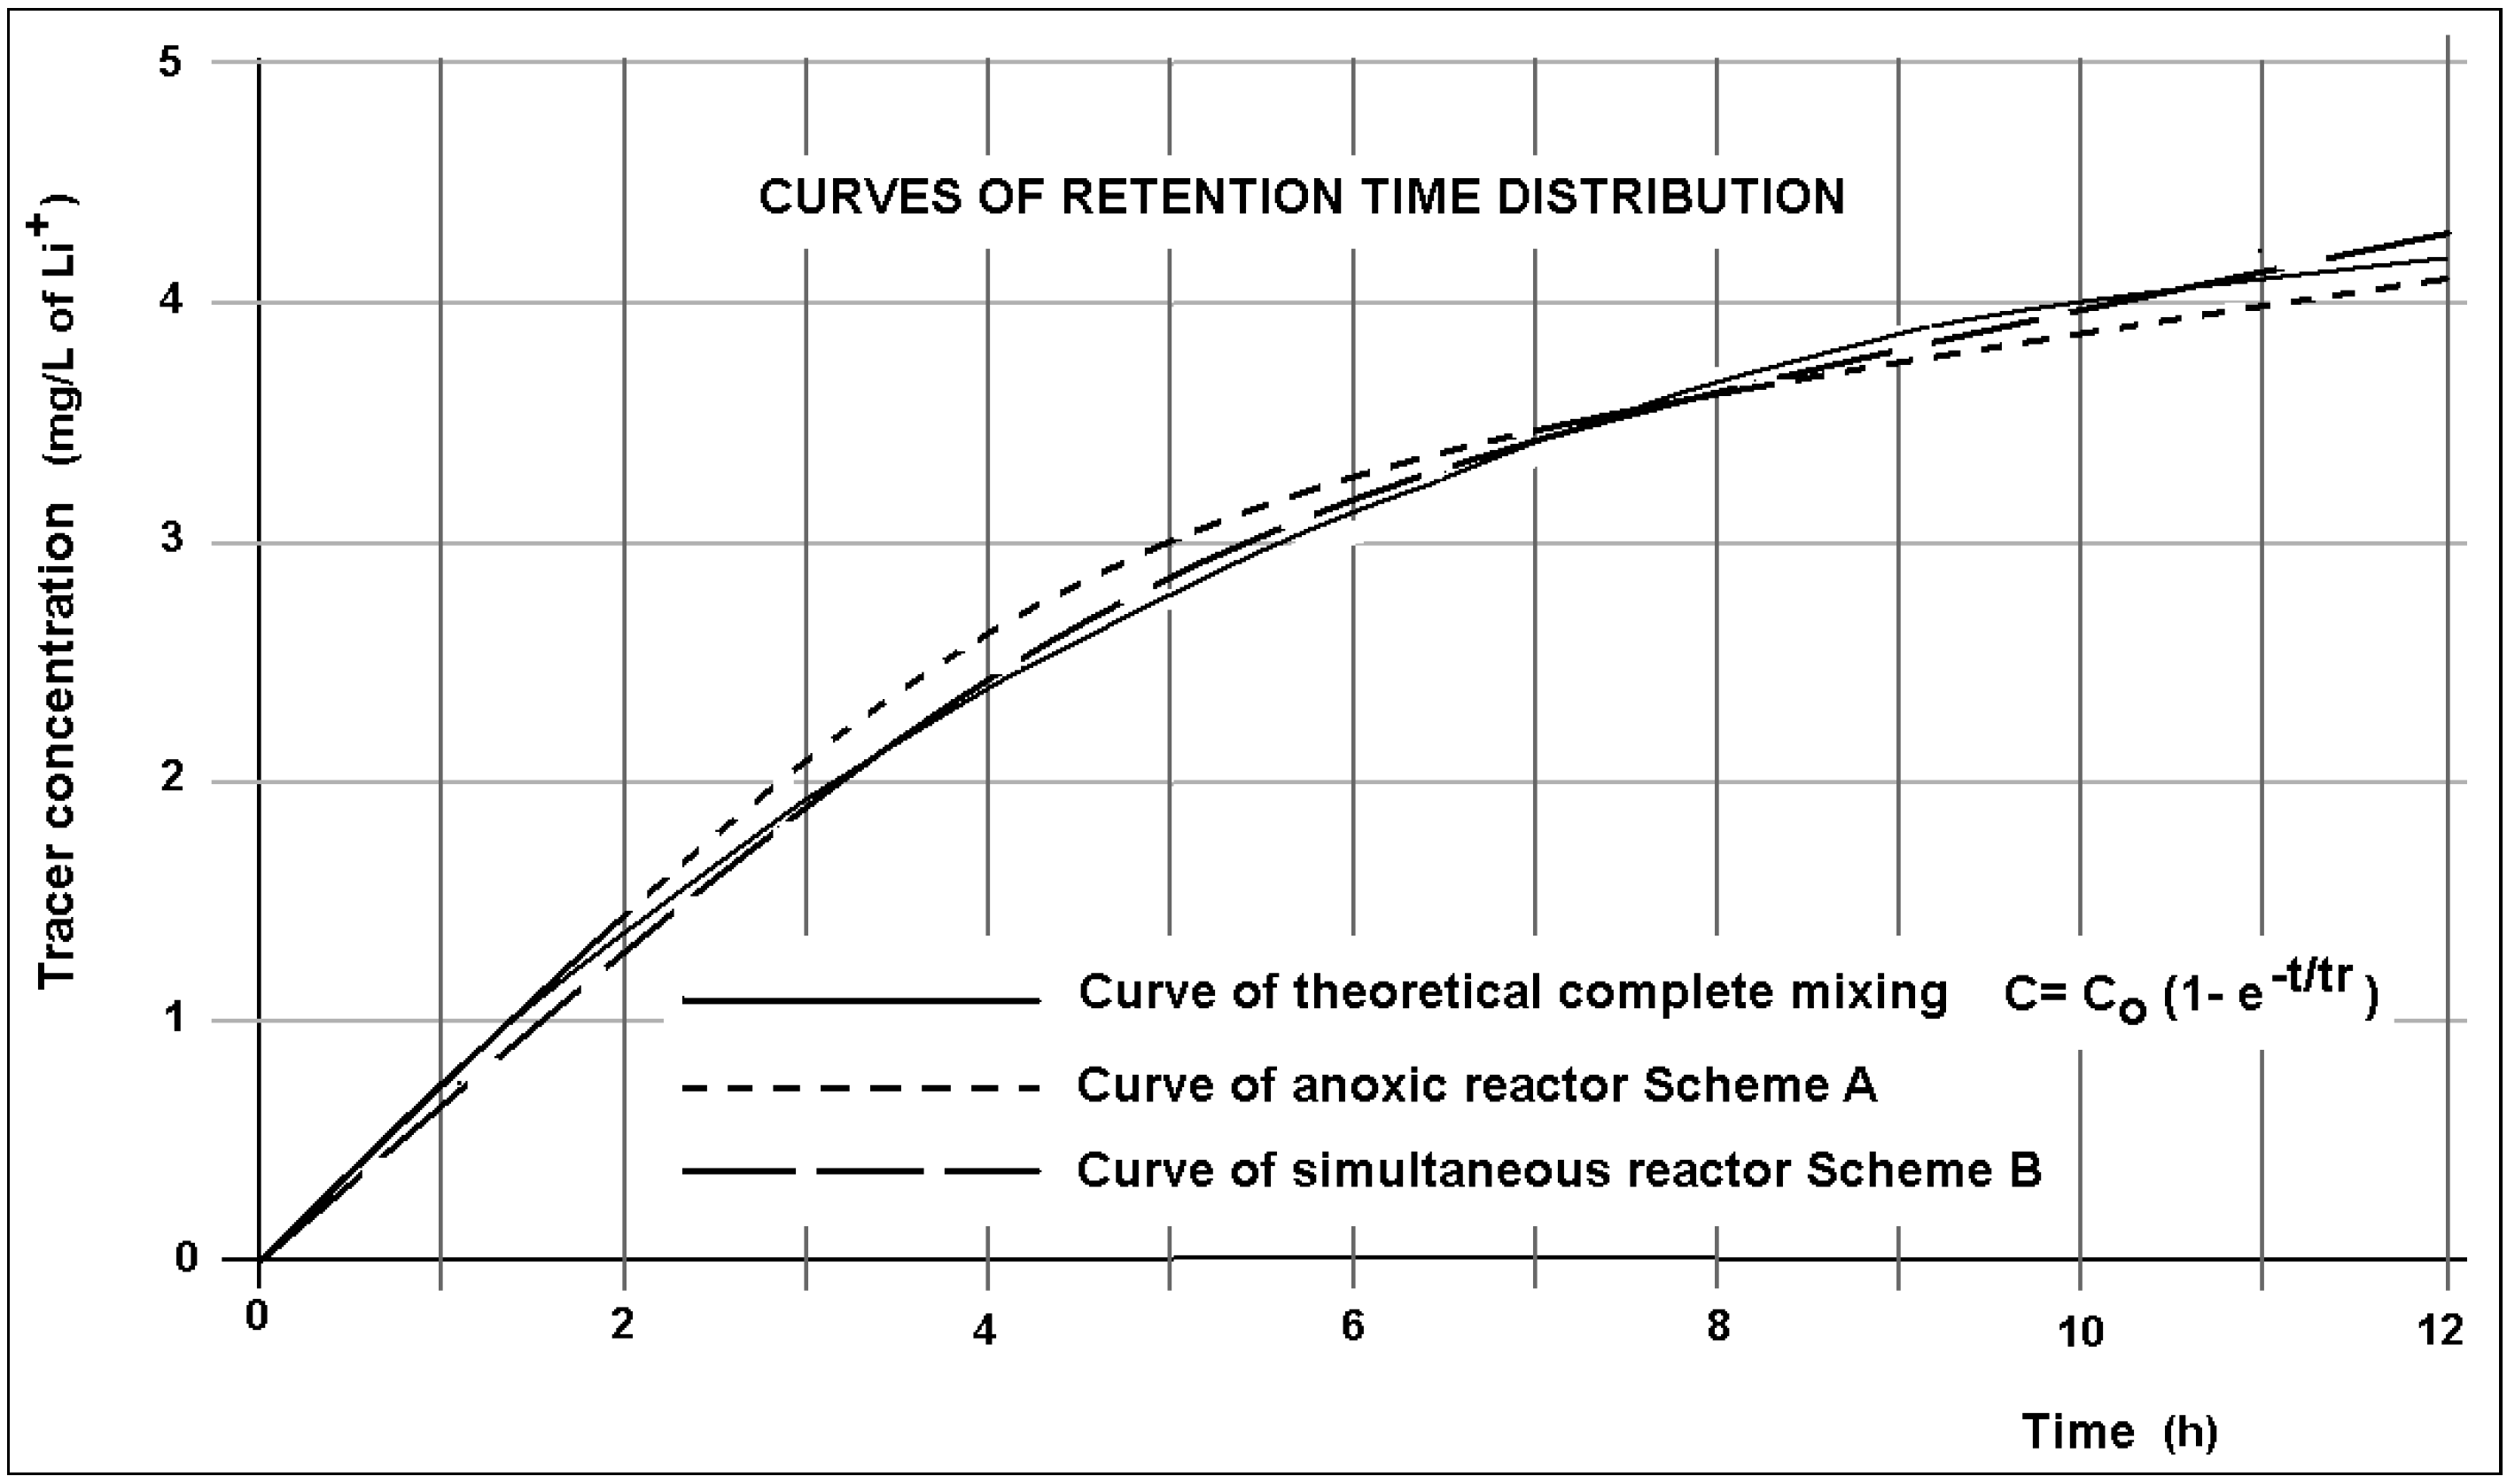
2.1. Pilot Plant Description

The research was based on the use of the activated sludge plant in Figure 1, fed by pre-treated sewage (screening and aerated grit chamber).
Figure 1. Modified base plant used for the tests.
Sustainability 06 00112 g001
This base plant was modified in order to obtain the two alternative processes shown in Figure 2:
Figure 2. Alternative processes after the modifications of the base plant.
Sustainability 06 00112 g002
Scheme A: anoxic-aerobic process for pre-denitrification followed by separate oxidation-nitrification. One of the two units was thus converted to the anoxic phase for the biological denitrification. The brush aerator was modified and almost entirely submerged in order to improve the thrust of the mixed-liquor, thus preventing significant oxygenation effects. No change was made to the second unit for oxidation-nitrification. For the two units, the power input was 23 W·m−3 (anoxic) and 30 W·m−3 (oxidation-nitrification).
Scheme B: simultaneous denitrification in both units operating in parallel. By adjusting the level of submergence of the brush-rotors and with just a few changes to the brushes, alternating anoxic and aerobic zones were created where oxidation-nitrification and denitrification can be achieved, respectively. Various tests were performed since at different submergence levels of the rotors there are different extensions of the anoxic and aerobic zones, which are also variable over time. Consequently, the dissolved oxygen was mapped in several points of the basin in order to identify the optimal solution. With this process, the entire biological reactor (complete with the alternating phases of oxidation-nitrification and denitrification) acts as a complete fully mixing system leading to an even more pronounced leveling effect of the load peaks. For the two units, the power input was 25 W·m−3.
Before starting the main experiment, the retention time distribution of the units equipped with denitrification was verified, through the step dosing of lithium chloride solutions (5 mg·L−1 of Li+), and measuring the trend over time of the concentration of lithium in the output. The flow rate was 200 m3·h−1 with a corresponding mean retention time Tr = 6.25 h. The results in Figure 3 show an excellent overlap between the experimental curves and the theoretical curve representing the ideal complete mixing. This would seem to demonstrate that complete mixing is achieved in the mixed-liquor inside the reactors.
Figure 3. Retention time distribution curves of the tested units, compared with the theoretical complete-mixing curve (step dosing of 5 mg·L−1 of Li+ as a tracer).
Sustainability 06 00112 g003

2.2. Pilot Plant Operating Conditions and Testing Methods

The pilot plant ran for a continuous period of six months, in which the two experimental processes were tested consecutively.
In both cases the operational efficiency of the process was evaluated in terms of BOD5, COD, TN, TKN, NO3-N, NH4-N, as a function of the sludge loading relative to the total volume (DEN + OX-NIT). The sewage flow rate was made to vary from a minimum of 160 m3·h−1 up to a maximum of 400 m3·h−1. The flow rate was gradually increased by 20 m3·h−1 steps, each 15 days, independently from the wastewater quality. The concentration of mixed-liquor was maintained at 2.5 kgVSS·m−3. The VSS/SS ratio was found in the range 0.62–0.64 throughout the experiment period.
The sludge recycle flow rate was maintained at Qs = 250 m3·h−1. The ratio of mixed-liquor recycle was maintained at QML/Q = 4.
In order to assess the effects of the daytime sewage quality variations on the denitrification efficiency, two main types of sampling were performed:
  • Automatic daily average samplings of the raw wastewater and the treated effluent;
  • Manual instantaneous samplings (at 8 AM, 12 AM and 4 PM respectively) at the sewage input.
The following measurements were also made:
  • pH of raw sewage (fixed probe with automatic calibration, accuracy ±0.01 pH, ±1.8 °F/±1 °C);
  • Dissolved oxygen (DO) in various parts of the reactors denitrification and nitrification-oxidation (fixed immersed electrochemical probes with resolution 0.01 mg L−1, automatic calibration and temperature compensation);
  • Temperature of the mixed-liquor in denitrification (fixed probe, accuracy < 0.08%, Pt100 class A).
During the experiment, the temperature of the mixed-liquor was measured in the range 15–16 °C.
Sampling and chemical analyses were carried out in compliance with the official Italian methods issued by the IRSA-National Council of Research [21].

3. Results and Discussion

3.1. Sewage Quality

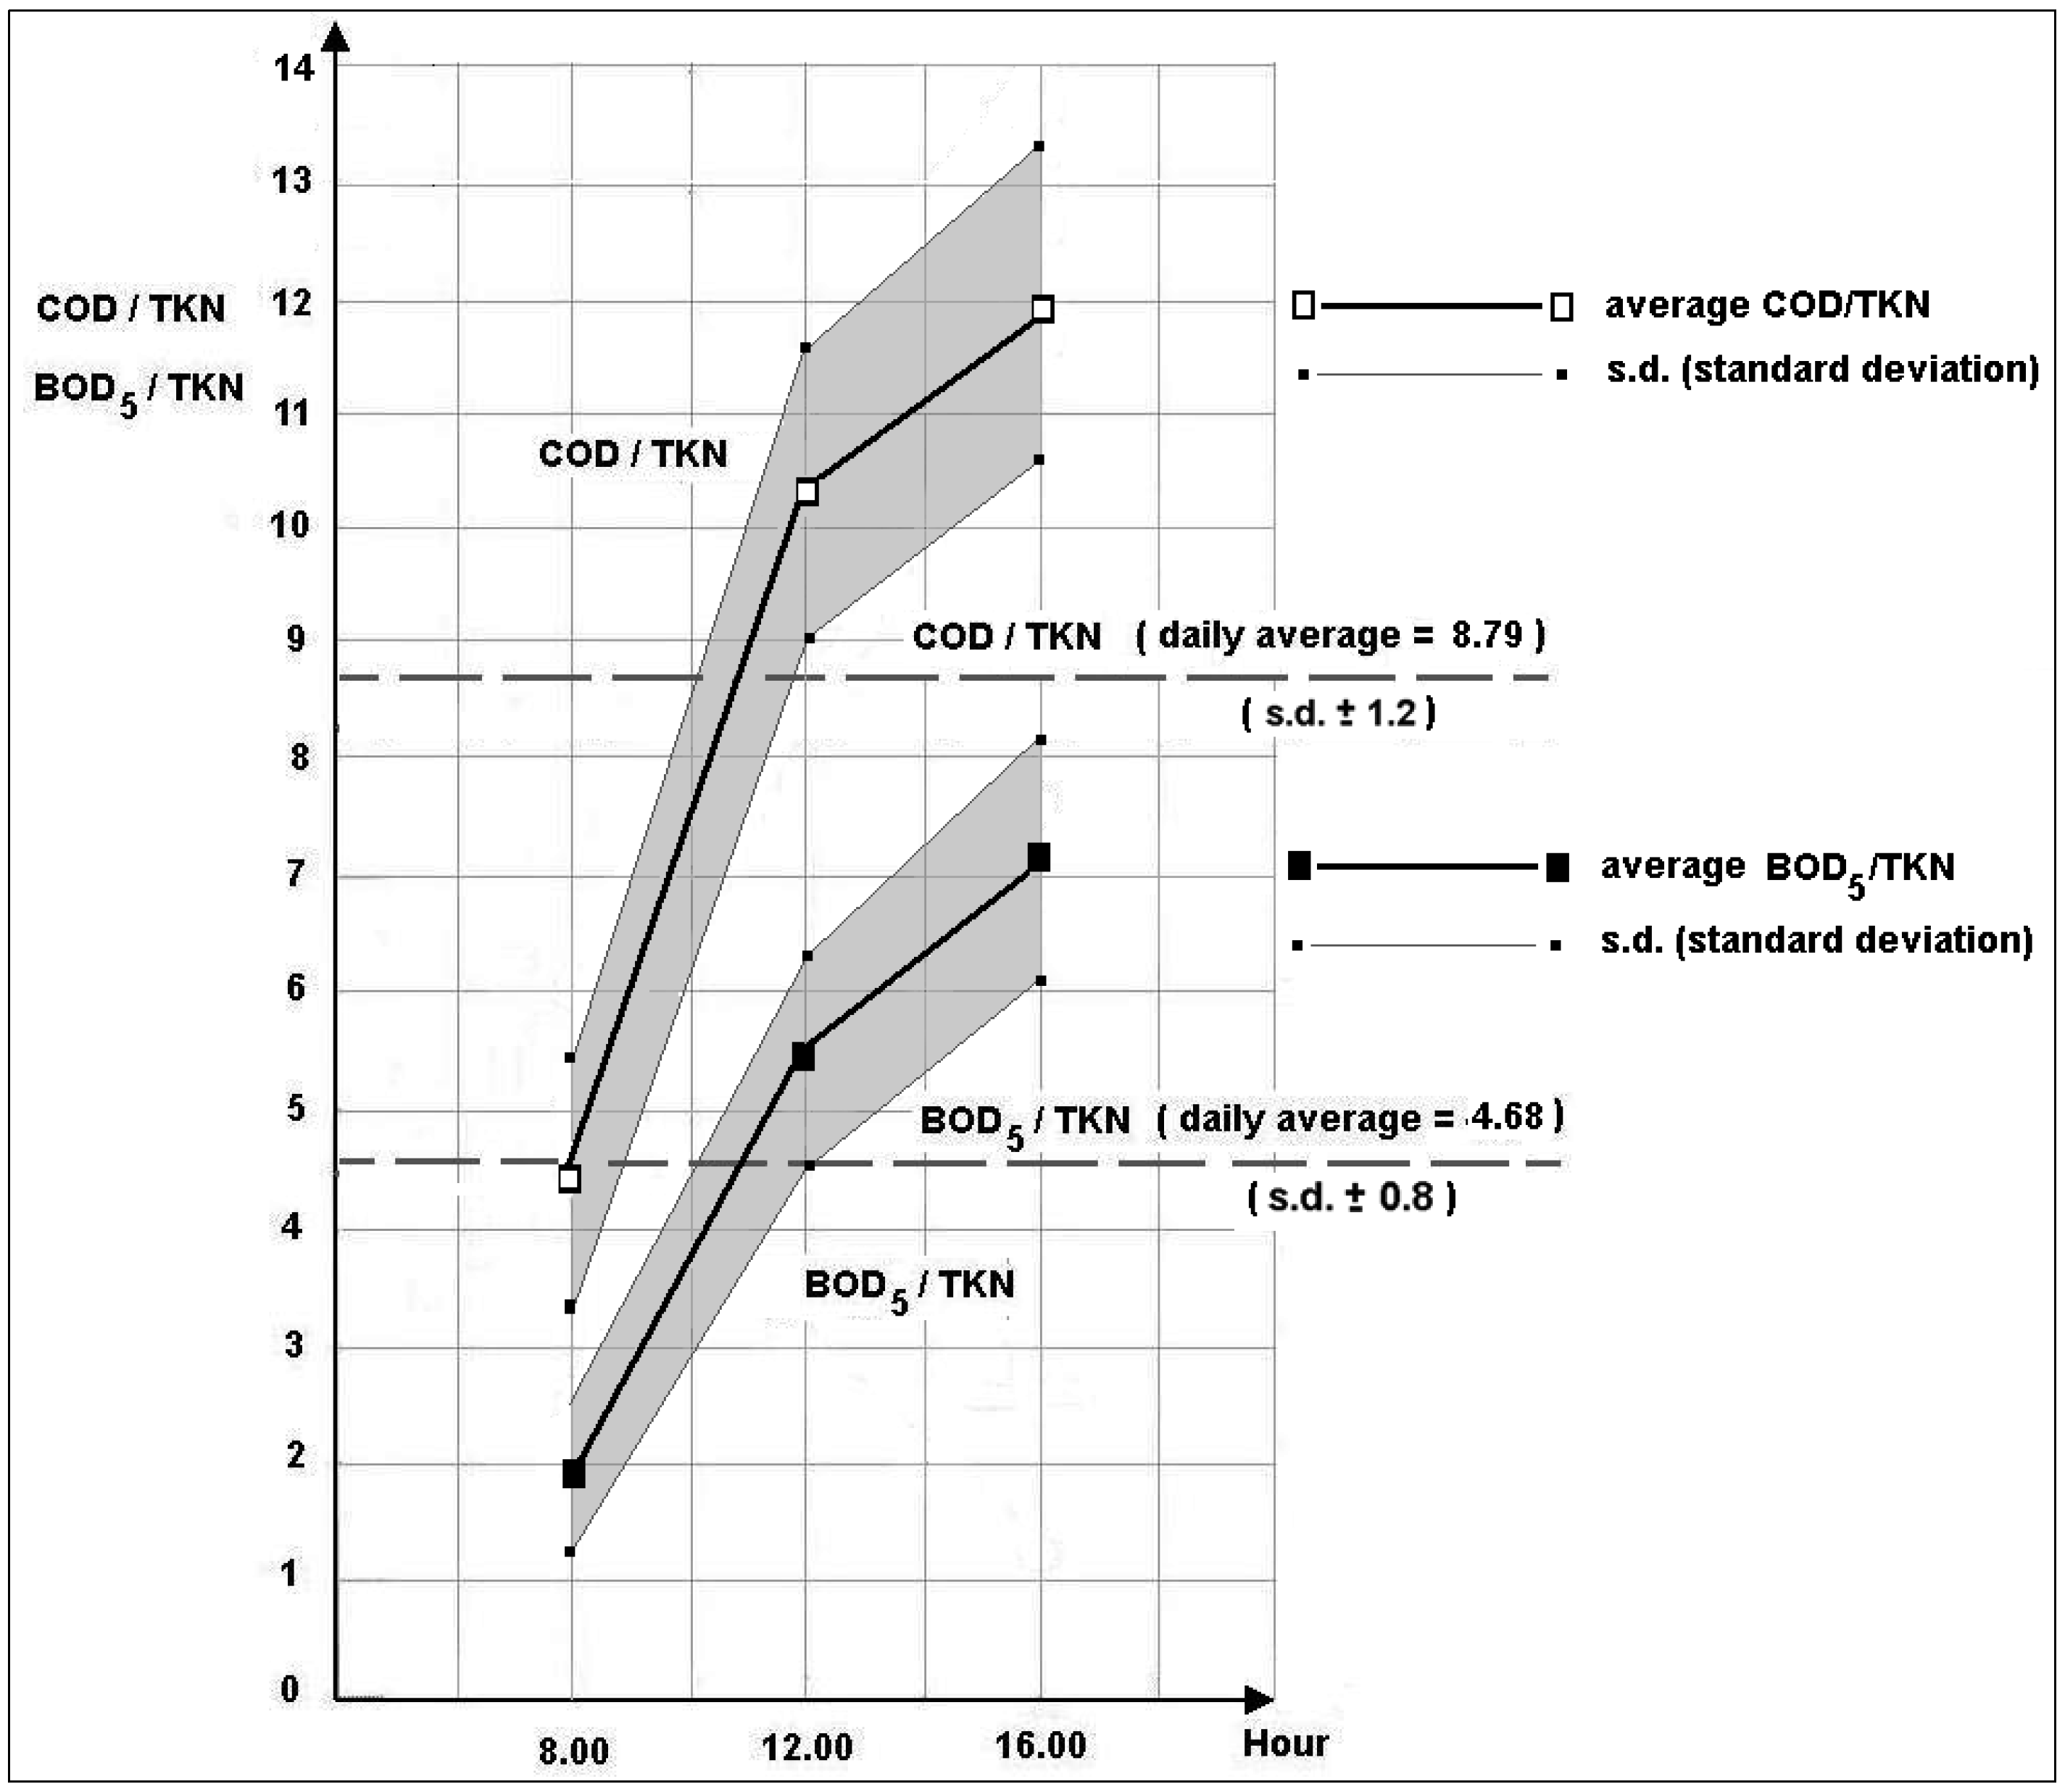
3.1.1. Average Daily Quality and Daytime Fluctuations in Sewage Quality

Table 1 lists the mean and standard deviations of the raw sewage main parameters (COD, BOD5 and TN = TKN).
Table 1. COD, BOD5 and TN concentrations (means and standard deviations) of the raw sewage.
ParameterTime of sampling
Daily average (1)Hour 8.00 (2)Hour 12.00 (2)Hour 16.00 (2)
CODin (mg·L−1)248.0 (σ ± 59.3)85.9 (σ ± 18.8)397.0 (σ ± 130.2)320.0 (σ ± 82.6)
BOD5in (mg·L−1)132.0 (σ ± 42.0)37.8 (σ ± 12.5)215.0 (σ ± 65.0)193.0 (σ ± 39.8)
TNin = TKNin (mg·L−1)28.2 (σ ± 5.7)19.20 (σ ± 3.8)38.8 (σ ± 8.3)26.7 (σ ± 5.0)
The results show a “low strength” influent. The BOD5/TKN ratio of 4.68 is a little lower than the value normally expected in Italian sewage [5]. The value can be explained by the presence of several old houses with septic tanks that are still connected to the sewage system. The incidence of these units on sewage quality may be more, or less, significant with respect to the type (septic tanks with one or more chambers), size and maintenance criteria. When these septic tanks work normally, a BOD5 and suspended solids reduction of about 10% and 40% is considered reasonable [22]. In contrast, the reduction in TKN should, in practice, be considered as zero because the nitrogen subtracted from the settled solids is then released as NH4+ by the sediment fermentation. The release takes place by enzymatic hydrolysis, at a rate of 0.02–0.06 mgNH4-N·mg−1 COD [19]. In addition, the presence of these septic tanks explains the very low mean value of the COD/BOD5 ratio (only 1.87).
Table 1 shows the large fluctuation, throughout the day, of the organic parameters (COD and BOD5) in terms of the daily average values. COD and BOD5 peaks (occurring at 12.00 AM) were 68.2% and 62.8% greater than the daily average values, respectively. In contrast, minimum values (occurring at 8.00 AM) in the COD and BOD5 were 65.3% and 71.3% less than the daily average values, respectively. Such variations were much smaller for TN.
Figure 4 shows the trends of both the mean COD/TKN and BOD5/TKN ratios during the day.
Figure 4. Trends of day-time mean COD/TKN and BOD5/TKN ratios in the raw sewage.
Sustainability 06 00112 g004
The lowest values occurred at 8.00 AM (4.47 and 1.96, respectively for COD/TKN and BOD5/TKN), while more than fourfold higher values occurred at 12.00 AM (10.23; 5.54) and 4.00 PM (11.88; 7.22).

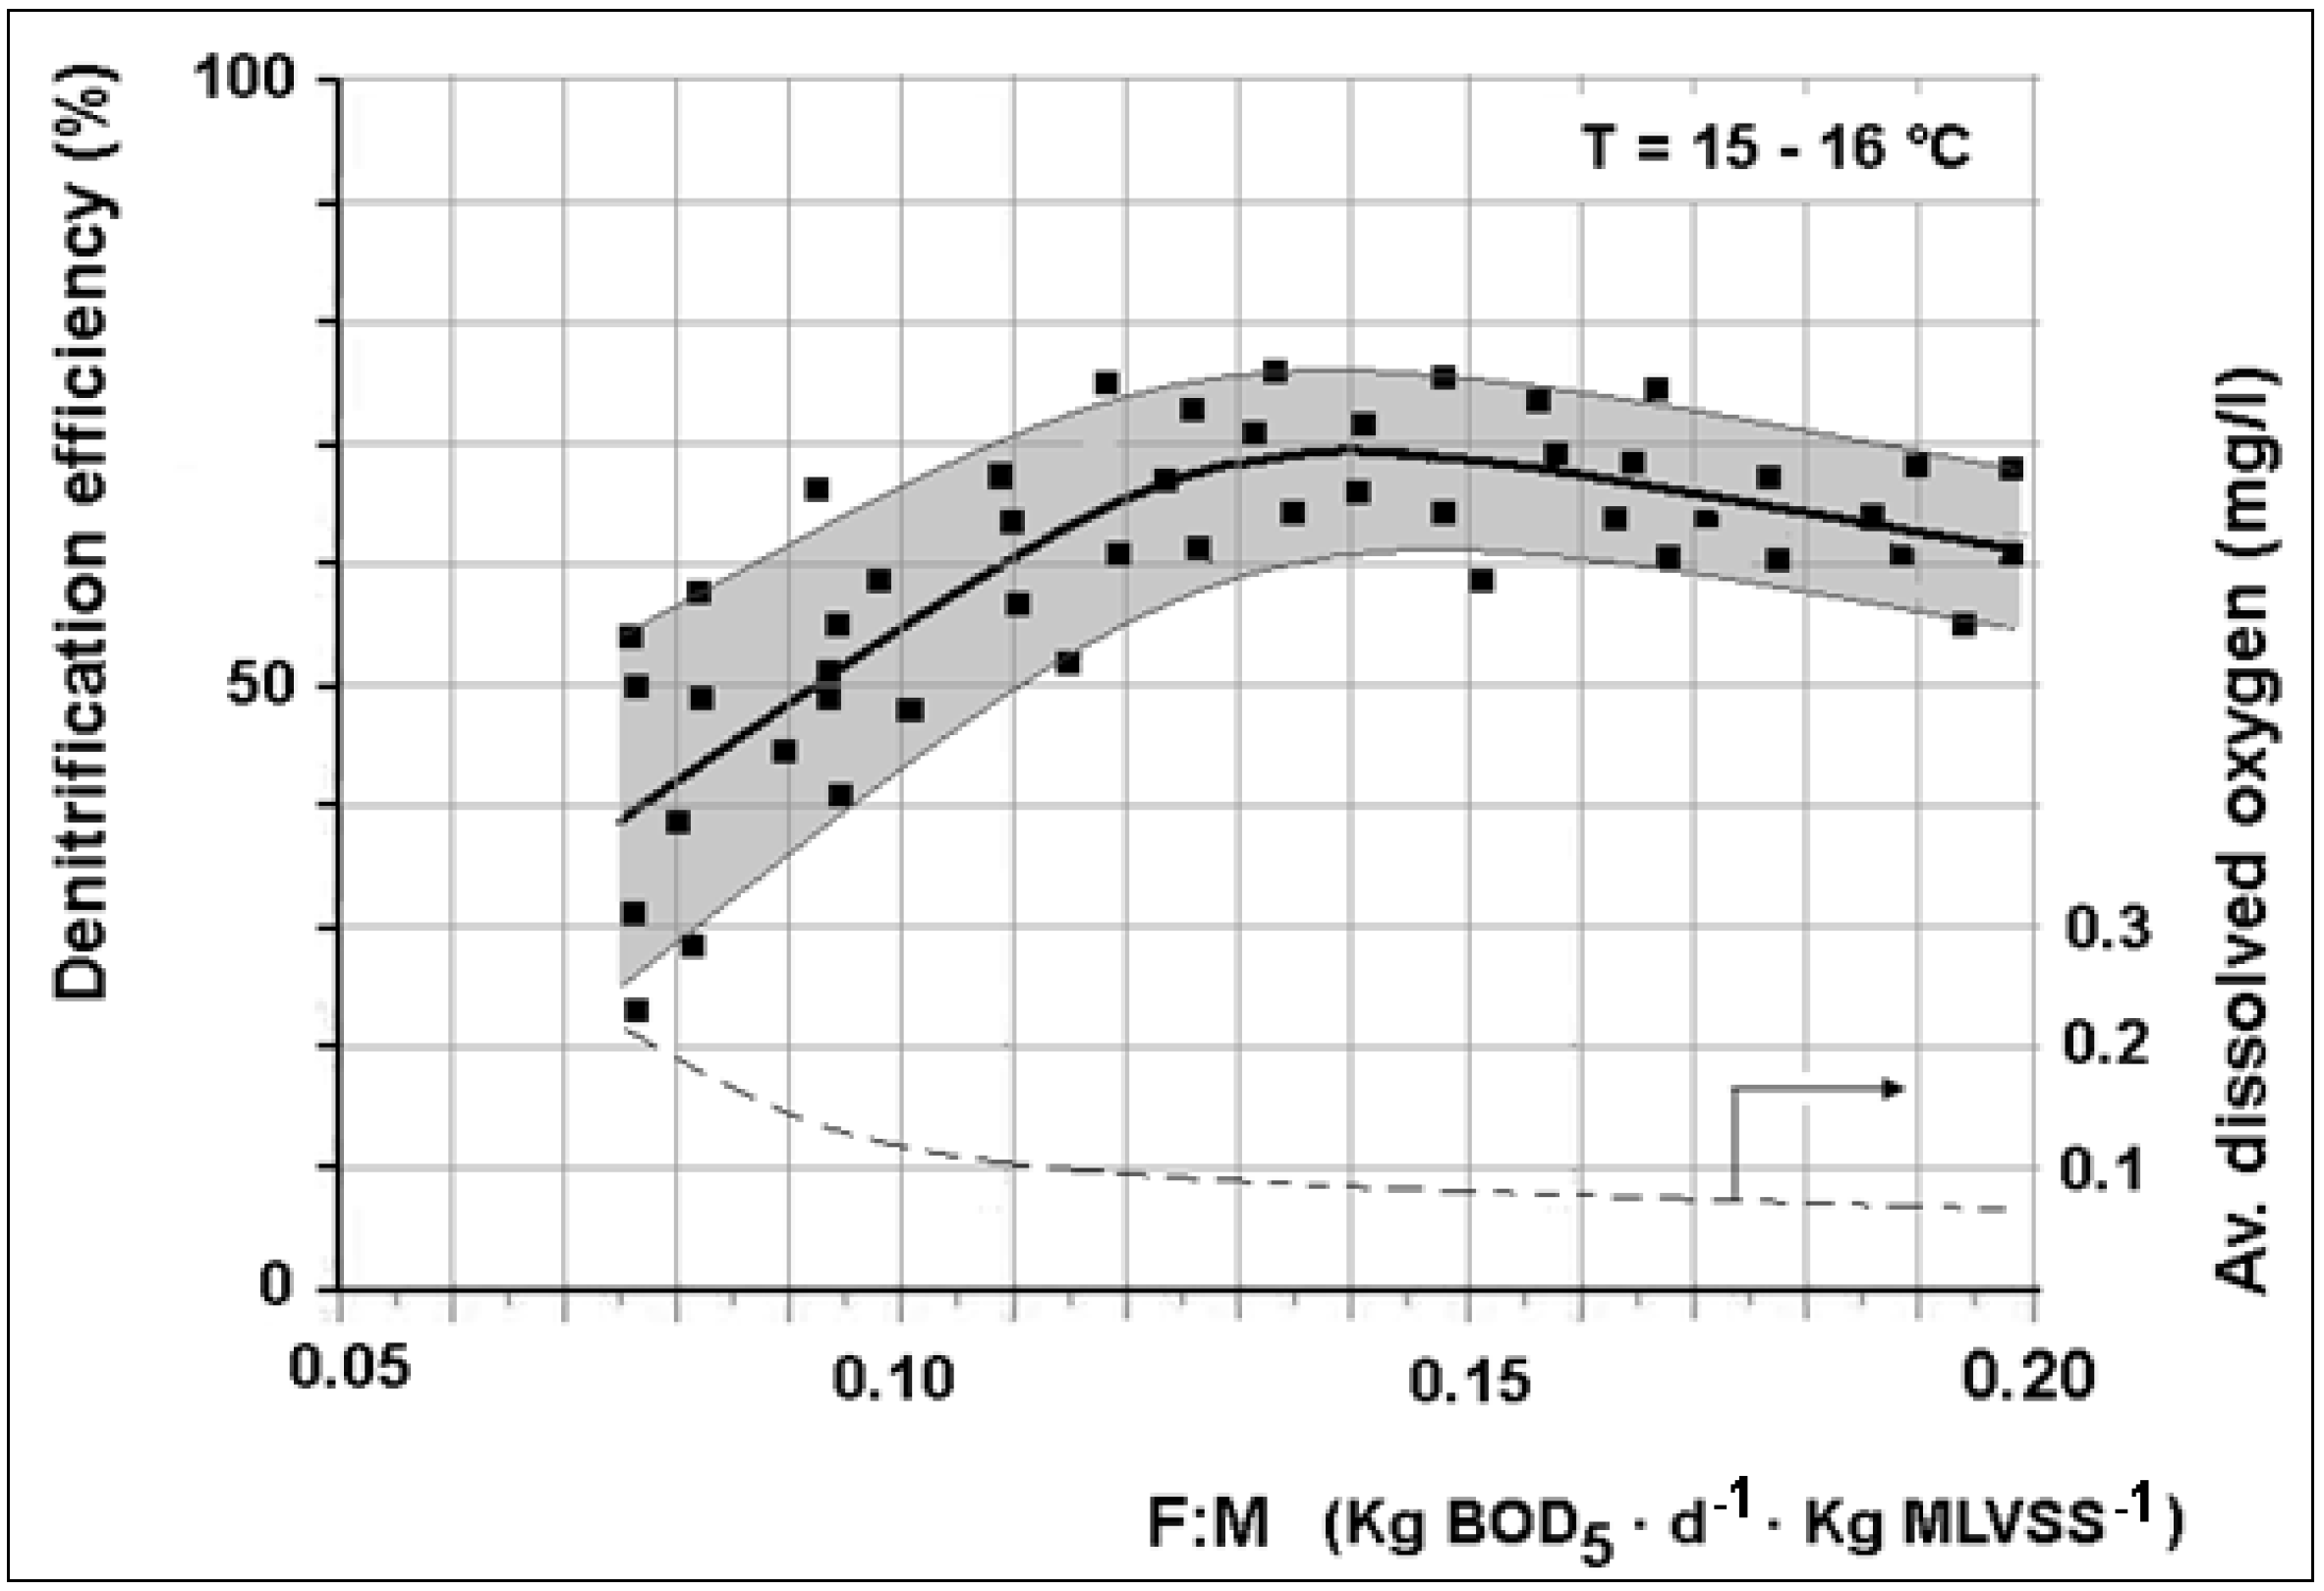
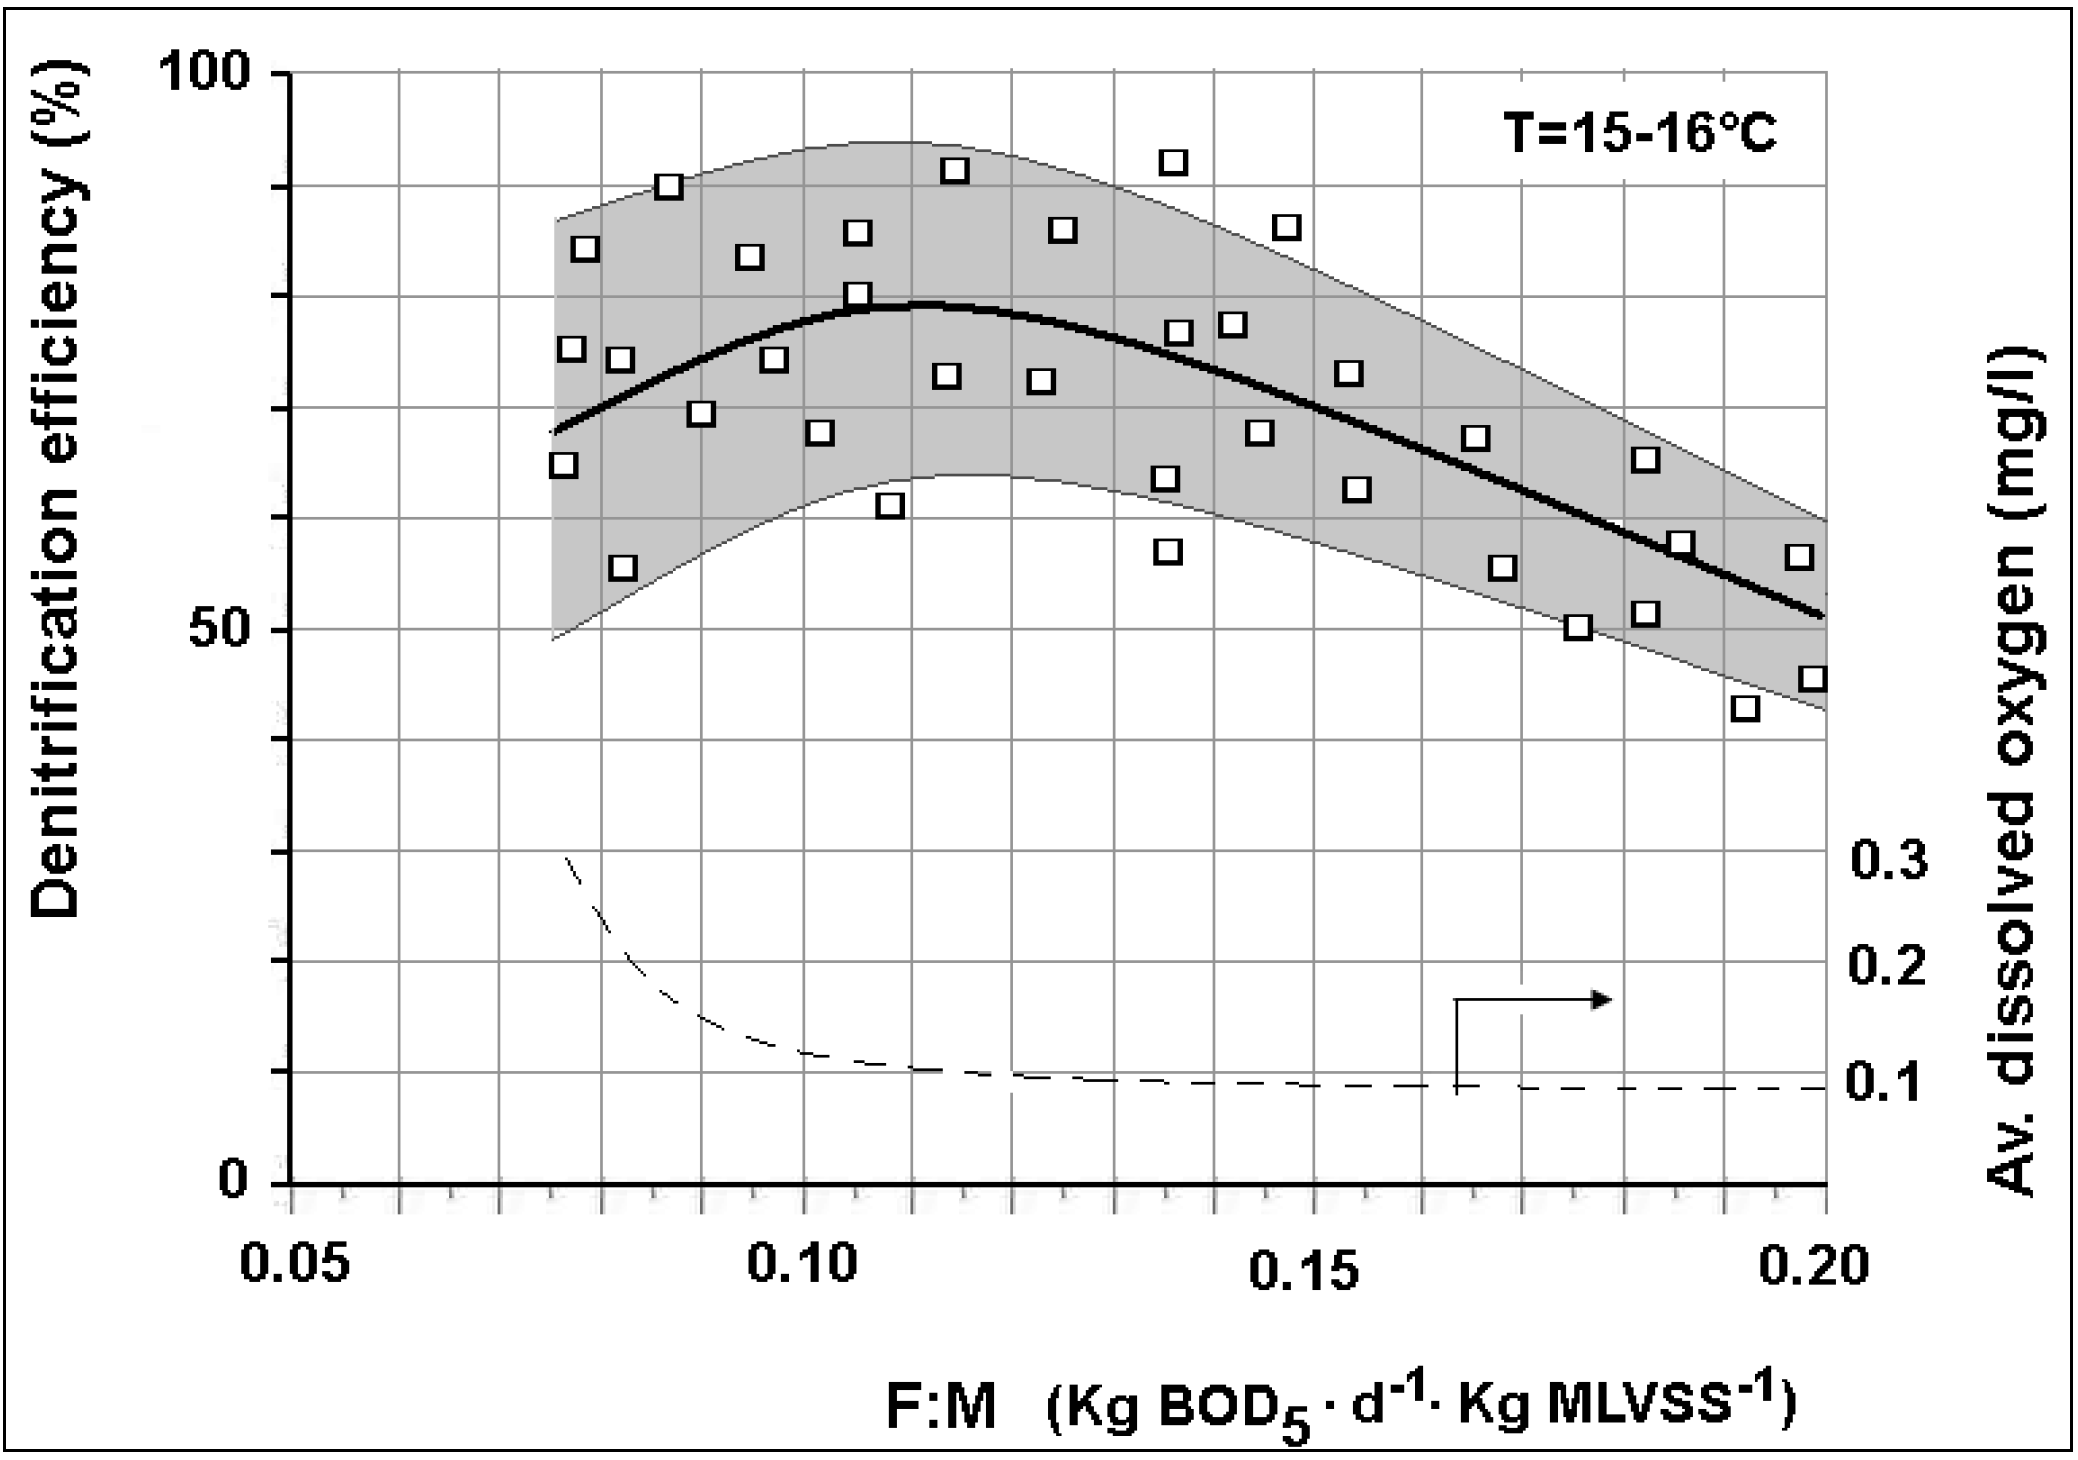
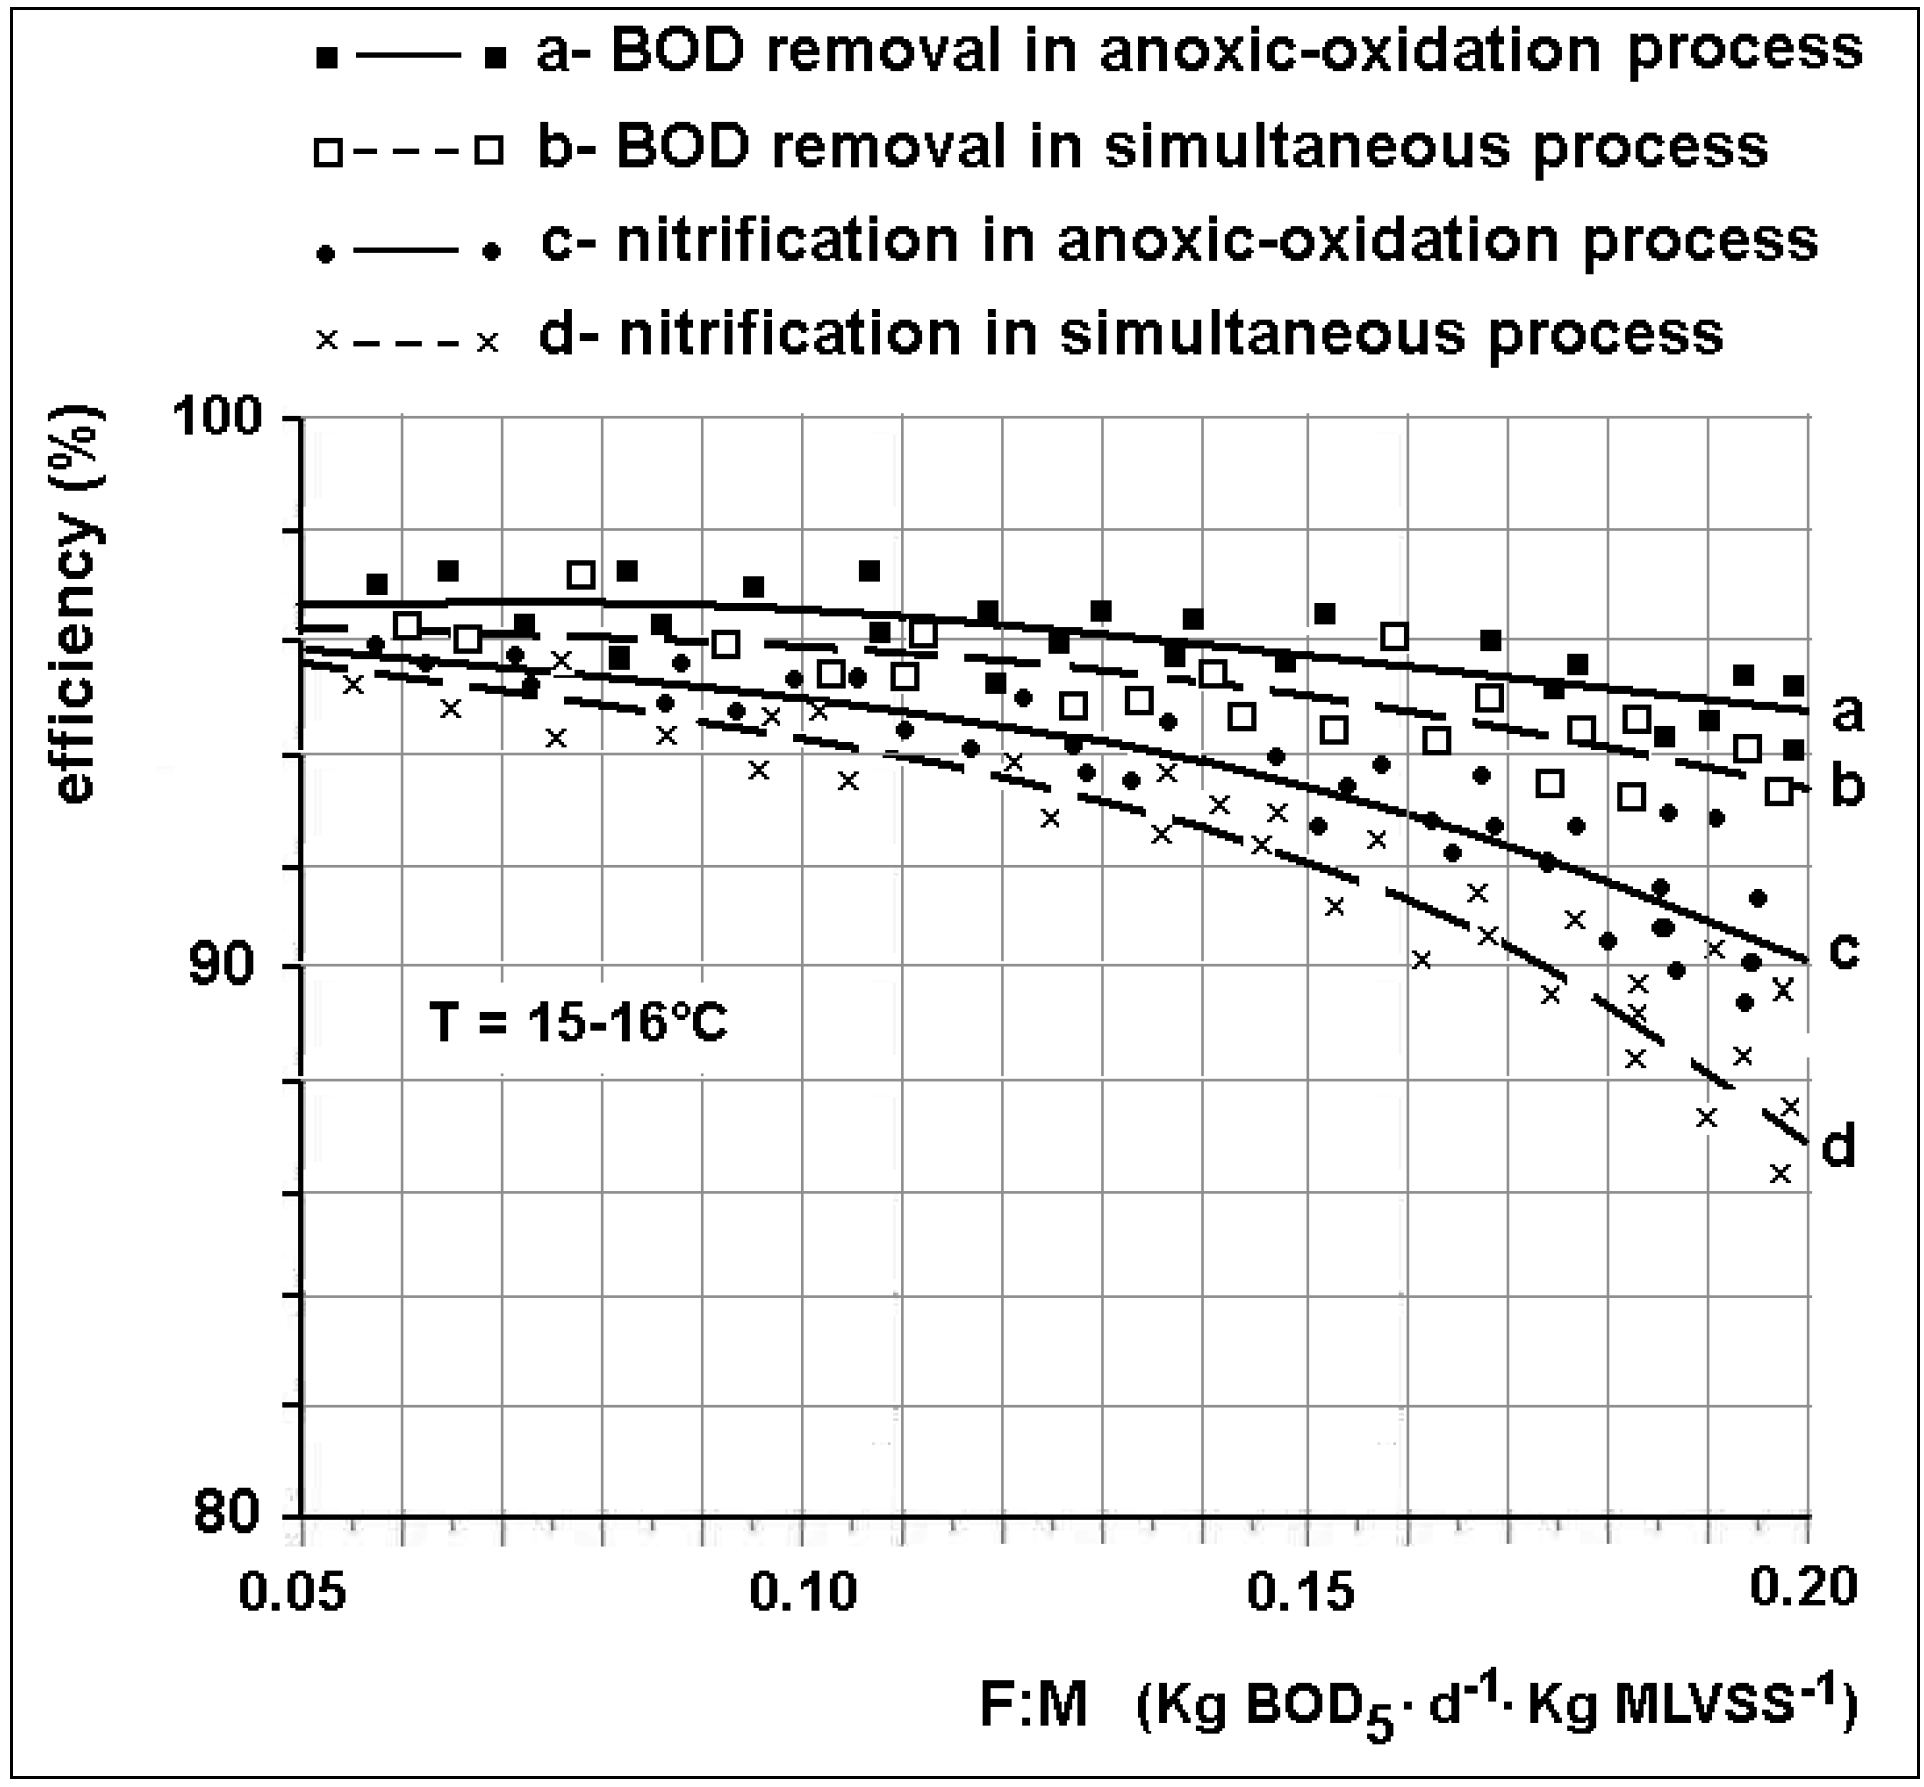
3.2. Denitrification Efficiency

Figure 5 and Figure 6 show the denitrification efficiency of the two processes, in function of the sludge loading (or F:M,) Food to Microrganism ratio). The graphs also give the trends of the average concentrations of dissolved oxygen in the denitrification compartments.
Figure 5. Efficiency of denitrification in the anoxic-aerobic process (Scheme A).
Sustainability 06 00112 g005
Figure 6. Efficiency of denitrification in the simultaneous process (Scheme B).
Sustainability 06 00112 g006
Both curves show an increasing trend with the sludge loading and then decreases at the end with values of F:M ratio greater than 0.11–0.14 kgBOD5 (d·kgMLVSS)−1. The growth phase can be related to two factors:
  • A greater specific denitrification rate at high values of F:M ratio, according to the known semi-empirical equation [5,6,7]:
    SDNR20°C (kgBOD5 · d-1 · kg-1MLVSS)=0.03 F/M + 0.26
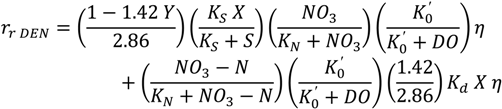
  • The lower content of DO in the denitrification reactor in relation to higher F:M ratios, reduces the inhibition of the denitrification rate (higher effects at low F:M ratios). The inhibitory effects of DO on the kinetics of the process were postulated in 1975 by USEPA in its first report on the removal of nitrogen [3]. In subsequent reports [5,6] USEPA highlighted this effect by inserting an inhibition factor K’0/(K’0 + DO) in the expression of the denitrification rate:
    Sustainability 06 00112 i001
where:
rDENdenitrification rate (NO3-N removal by dissimilation) [mg/(L·h)−1];
Yetherotrophic bacteria synthesis yield (mgVSS/mg substrate consumed);
Kmaximum specific rate of substrate utilization (h−1);
Xbiomass concentration (mgMLVSS·L−1);
Ssoluble degradable substrate concentration (mg·L−1);
Kssubstrate utilization half-velocity coefficient (mg·L−1);
NO3-Nnitrate concentration, as N (mg·L−1);
KNnitrate half velocity coefficient (mg·L−1);
K’0DO inhibition constant for nitrate reduction (mg·L−1);
DOdissolved oxygen (mg·L−1);
ηfraction of etherotrophic bacteria that use nitrate in lieu of oxygen.
Thobanogolus et al. [7] extended this equation by considering complete denitrification in both respects, dissimilation and assimilation (cell synthesis), as follows:
Sustainability 06 00112 i002
with Kd is endogenous decay coefficient (h−1).
DO inhibition on denitrification has been shown at DO concentrations of 0.20 mg·L−1 by Dawson and Murphy [23]. The DO inhibition constant K’0 is considered variable in a wide range depending on the floc size and structure, in the range 0.02–0.2 mg·L−1 [24]. In any case, the mere presence of 0.2 mg·L−1 of DO can theoretically lower the denitrification rate up to 40% compared to the maximum value in the absence of inhibition [7]. Other studies have highlighted the effect of inhibition [25,26,27]. In particular, Oh and Silverstein noted a significant effect of inhibition at a DO concentration of only 0.09 mg·L−1 with a corresponding 35% reduction in the denitrification rate [25].
The decrease phase is mainly due to the loss of nitrification efficiency, as shown in Figure 7 at a higher sludge loading (lower sludge age).
The two curves in Figure 5 and Figure 6 reveal a 70% average efficiency for the pre-denitrification and an 80% average efficiency for the simultaneous denitrification. The latter result is likely due to the greater capacity of simultaneous denitrification reactors in leveling the peak load. For this same reason the difference in efficiency is particularly high for a low F:M ratio, in fact with these values the effect of equalization-homogenization is more pronounced. The efficiencies reported are much higher than those achieved with the aforementioned pilot study on the same sewage (60.2% as average) [19] in which the pre-denitrification consisted in four reactors in series with a specific input power of 11 W·m−3.
Once the maximum value is reached, the simultaneous denitrification curve has a more pronounced decrease, likely determined by the lower nitrification efficiency (Figure 7) as a result of both the lower content of dissolved oxygen in aerobic zones (values of 1.0–1.5 mg·L−1 detected at high F:M ratios) and the combined presence of heterotrophic bacteria responsible for BOD removal, together with nitrification bacteria.
Figure 7. Efficiency of BOD5 removal and of nitrification for the two processes studied.
Sustainability 06 00112 g007

4. Conclusions

The study confirmed that sharp fluctuations in BOD5 and TKN loads (and in particular the BOD5/TKN ratio fluctuation), typical of low capacity sewage treatment plants (small communities), limit the achievement of high denitrification efficiencies. In periods of low loads such fluctuations also cause dissolved oxygen to increase in the anoxic compartments leading to the inhibition of the denitrification rate.
We examined two processes each potentially capable of limiting the effects of these fluctuations:
  • An anoxic-aerobic process, creating conditions of complete mixing in the anoxic stage so that some of the input load fluctuations can be absorbed;
  • Simultaneous denitrification in which aerobic and anoxic zones are alternated in conditions of complete mixing. In this case the entire volume of the reactor helps to absorb the fluctuation of the input load.
The two processes were tested by feeding pre-treated sewage (screening and aerated grit chamber) from a community of 15,000 people. In the two cases the denitrification efficiency curves were reconstructed as a function of the sludge loading in relation to the whole biological reactor.
The simultaneous denitrification achieved the best performance with a peak value of 80% at a sludge loading of 0.08 kgBOD5·(d·kgMLVSS)−1. By contrast the pre-denitrification reached the maximum value of 70% efficiency at a sludge loading load of 0.10 kgBOD5·(d·kgMLVSS)−1. In both cases, the choice of the correct sludge loading value was fundamental for the optimization of the process.
These results are considerably better than those achieved in a previous pilot study that we had carried out on the same sewage (60.2% average) in which the pre-denitrification consisted of four reactors in series with a power input of 11 W·m−3.
Overall, these results are positive in terms of the advantages of using complete mixing systems to improve the efficiency of denitrification in small sewage treatment plants subject to strong fluctuations in quality.

Conflicts of Interest

The authors declare no conflict of interest.

References

  1. United States Environmental Protection Agency. Process Design Manual for Upgrading Existing Wastewater Treatment Plant; Water Resource Center: Jefferson, MO, USA, 1974.
  2. United States Environmental Protection Agency. Wastewater Treatment Facilities for Sewered Small Communities—Process Design Manual; Water Resource Center: Jefferson, MO, USA, 1977.
  3. United States Environmental Protection Agency. Process Design Manual for Nitrogen Control; Water Resource Center: Jefferson, MO, USA, 1975.
  4. United States Environmental Protection Agency. Manual: Nitrogen Control; Water Resource Center: Jefferson, MO, USA, 1993.
  5. Cadmus Group. Nutrient Control Design Manual: State of Technology Review Report; The Cadmus Group, Inc.: Watertown, MA, USA, 2009. [Google Scholar]
  6. Cadmus Group. Nutrient Control Design Manual; The Cadmus Group, Inc.: Watertown, MA, USA, 2010. [Google Scholar]
  7. Metcalf & Eddy, Inc.; Tchobanoglous, G.; Burton, F.L.; Stensel, H.D. Wastewater Engineering: Treatment and Reuse, 4th ed.; McGraw-Hill Education: New York, NY, USA, 2003. [Google Scholar]
  8. Tan, C.; Ma, F.; Ang, L.; Qiu, S.; Li, J. Evaluating the effect of dissolved oxygen on simultaneous nitrification and denitrification in polyurethane foam contact oxidation reactors. Water Environ. Res. 2013, 85, 195–202. [Google Scholar]
  9. Liu, Y.; Shi, H.; Xia, L.; Shi, H.; Shen, T.; Wang, Z.; Wang, G.; Wang, Y. Study on operational conditions of simultaneous nitrification and denitrification in a Carrousel oxidation ditch for domestic wastewater treatment. Bioresour. Technol. 2010, 101, 901–906. [Google Scholar]
  10. Zhou, X.; Han, Y.; Guo, X. Enhanced total nitrogen removal performance in a modified Orbal oxidation ditch system with internal nitrate recycle. Chem. Eng. J. 2013, 228, 124–131. [Google Scholar] [CrossRef]
  11. Hedayati Moghaddam, A.; Sargolzaei, J. A review over diverse methods used in nitrogen removal from wastewater. Recent Pat. Chem. Eng. 2013, 6, 133–139. [Google Scholar]
  12. Liu, Y.; Shi, H.; Wang, Z.; Fan, L. Approach to enhancing nitrogen removal performance with fluctuation of influent in an oxidation ditch system. Chem. Eng. J. 2013, 219, 520–526. [Google Scholar] [CrossRef]
  13. Watanabe, Y.; Matsuda, S.; Ishiguro, M. Simultaneous nitrification and denitrification in micro-aerobic biofilms. Water Sci. Technol. 1992, 26, 511–522. [Google Scholar]
  14. Yang, P.Y.; Zhang, Z. Nitrification and Denitrification in the Wastewater Treatment System. In Proceedings of the UNESCO—University of Tsukuba International Seminar on Traditional Technology for Environmental Conservation and Sustainable Development in the Asian-Pacific Region, Tsukuba Science City, Japan, 11–14 December 1995.
  15. Water Information System for Europe—WISE. Wastewater Treatment Improvement and Efficiency in Small Communities. Available online: http://www.wise-rtd.info/en/info/waste-water-treatment-improvement-and-efficiency-small-communities (accessed on 31 October 2013).
  16. Torretta, V. PAHs in wastewater: Removal efficiency in a conventional wastewater treatment plant and comparison with model predictions. Environ. Technol. 2012, 33, 851–855. [Google Scholar]
  17. Torretta, V.; Katsoyiannis, A. Occurrence of polycyclic aromatic hydrocarbons in sludges from different stages of a wastewater treatment plant in Italy. Environ. Technol. 2013, 34, 937–943. [Google Scholar]
  18. Torretta, V.; Urbini, G.; Raboni, M.; Copelli, S.; Viotti, P.; Luciano, A.; Mancini, G. Effect of powdered activated carbon to reduce fouling in membrane bioreactors: A sustainable solution. Case study. Sustainability 2013, 5, 1501–1509. [Google Scholar]
  19. Raboni, M.; Torretta, V.; Urbini, G. Influence of strong diurnal variations in sewage quality on the performance of biological denitrification in small community wastewater treatment plants (WWTPs). Sustainability 2013, 5, 3679–3689. [Google Scholar] [CrossRef] [Green Version]
  20. Di Mauro, C.; Bouchon, S.; Torretta, V. Industrial risk in the Lombardy Region (Italy): What people perceive and what are the gaps to improve the risk communication and the partecipatory processes. Chem. Eng. Trans. 2012, 26, 297–302. [Google Scholar]
  21. IRSA-CNR. Analytical Techniques. Available online: http://www.irsa.cnr.it/ShPage.php?lang=it&pag=metod/ (accessed on 31 October 2013).
  22. Bonomo, L.; Pastorelli, G.; Zambon, N. Advantages and limitations of duckweed-based wastewater treatment systems. Water Sci. Technol. 1997, 35, 239–246. [Google Scholar]
  23. Dawson, R.N.; Murphy, K.L. The temperature dependency of biological denitrification. Water Res. 1972, 6, 71–83. [Google Scholar] [CrossRef]
  24. Rössle, W.H.; Pretorius, W.A. A review of characterization requirements for in-line prefermenters Paper 1: Wastewater characterization. Water SA 2001, 27, 405–412. [Google Scholar]
  25. Oh, J.; Silverstein, J. Oxygen inhibition of activated sludge denitrification. Water Res. 1999, 33, 1925–1937. [Google Scholar] [CrossRef]
  26. Plósza, B.G.; Jobbágy, A.; Grady, C.P.L. Factors influencing deterioration of denitrification by oxygen entering an anoxic reactor through the surface. Water Res. 2003, 37, 853–863. [Google Scholar]
  27. Badstreet, K.A.; Jhonson, G.R. Study of Critical Operational Parameters for Nitrogen Reduction at Municipal Wastewater Treatment Plant. In Proceedings of the Water Environment Federation 67th annual Conference & Exposition, Chicago, IL, USA, 15–19 October 1994.

