1. Introduction
The issue of barriers to domestic energy efficiency has been well covered by the literature over the past several decades. A number of policy solutions have been enacted to address these barriers in various ways. Yet despite the considerable academic and policy focus, there continues to be significant unrealized and cost effective savings in the existing domestic stock. Policies are frequently said to have had mixed success [
1]. This paper contends that this is in part caused by a lack of consensus on how to define success, and that part of the reason for this is a shortage of policy evaluation studies that seek not only to evaluate the success of an individual program, but extrapolate those results to a theory can be used to inform future efforts. Such comparative studies are typically fraught with methodological hurdles due to variations between programs that prevent like for like comparisons. This work circumnavigates many such hurdles by considering a case study from Efficiency Maine in the United States, in which a grant program transitioned into a financing program.
This work seeks to provide a view on the different ways in which public funding allocation can be evaluated, and the ways in which these factors influence the market transformation potential for a program. The term “barrier” is often considered insufficient to describe the degree of imperfections in the housing and energy efficiency retrofit market. This paper considers only the financial components such barriers, while recognizing that cultural and social factors are also critical. A comprehensive view of retrofit market transformation strategies must additionally consider the sociology of retrofitting, which is beyond the scope of this study.
To begin, a brief description of the underlying barriers will explore the policy context for this work, as well providing a brief explanation of the differences between grant and finance program structure. This paper will then describe the approach through which this work attempts to define the success of a retrofit program and some of the indicators with which success can be measured. Finally, the details of the Efficiency Maine programs will be presented, along with a comparative analysis and a discussion of whether the grant program or the financing program should be considered more successful.
1.1. Barriers to Effective Retrofit Programs
It is a well accepted truth that a range of market barriers adversely impact energy efficiency in the built environment [
1,
2,
3,
4,
5,
6]. Among these barriers, the low priority of energy issues, lack of information, upfront cost barriers, and split incentives are particularly relevant to attempts to retrofit existing dwellings [
7,
8,
9]. These barriers are pervasive and will not be addressed by any single policy mechanism or financial instrument. Despite much positive progress, a significant energy efficiency gap remains [
8]. While it is estimated that U.S. energy use today is approximately half of what it would have been without energy efficiency improvements over the past 40 years, it is noted that much greater savings are still possible [
10].
It is often stated that in order to address the diverse range of barriers present, energy efficiency policies should be part of broader market transformation strategies [
11,
12,
13]. Market transformation programs strive for a lasting change in the market even after the policy has been removed [
14]. There are a number of key factors that influence the overall impact that a retrofit program can have [
15]. While there is a well-developed literature on the theory of policy evaluation [
16], defining success is often difficult [
17]. Additionally, it is also possible for a policy to fail in some regards, even against its stated objectives, yet still contain individual programs that succeed [
18]. Since evaluation studies are often most relevant to the program planners, research in this area should strive to find trends that can be adapted to theory or useful to other policies in the future [
19].
1.2. Grants versus Financing
While policies designed to encourage retrofits often include elements of engagement strategies and information campaigns, the core of most energy efficiency retrofit programs is a system of financial incentives intended to overcome the upfront cost barrier. These exist in a range of forms, but can broadly be divided into two categories: grants and financing. Here the term grants refers to rebates, giveaways, subsidies, or tax credits, in which the financial incentive offered is not expected to be repaid. Financing, on the other hand, occurs in the form of a loan that must be repaid. Financing programs often make use of public funds either for direct lending, or as credit enhancements such as interest rate buy downs or loan loss reserves. In bill financing differs from typical financing in that the loan is repaid through the savings in the utility bills. Revolving loan funds operate in this way such that the loan repayments replenish the original funding block on a revolving basis [
20].
One such example is the Property Assessed Clean Energy (PACE) financing scheme, in which the value of the loan is tied to the home instead of the individual. In the wake of the housing crisis PACE loans are uncommon in the United States, as the Federal Housing Finance Agency stated that PACE presents safety and soundness concerns to the housing finance industry and instructed Fannie Mae and Freddie Mac to employ more restrictive underwriting criteria [
21]. PACE loan programs still exist, but in reduced numbers.
1.3. Efficiency Maine
The state of Maine is a useful source for case studies in domestic energy efficiency programs. Maine has a population of 1,328,361, a land area of 30,862 square miles, and total of 704,578 housing units [
22]. It is therefore a state with a relatively low population and housing density located in towns and small cities with populations not exceeding 64,000. The aging housing stock offers significant potential for cost effective improvements in most homes. Energy efficiency programs for both commercial and domestic buildings are run by the independent Efficiency Maine Trust, which primarily funded through the systems benefit charge levied on all electrical bills [
23].
In addition, Efficiency Maine has also received two funding blocks from the national Department of Energy (DOE) through the American Recovery and Reinvestment Act (ARRA). The first was a $10 million grant in 2009 under the State Energy Program (SEP). This was used to operate a rebate and direct install program called Home Energy Savings Plan (HESP). HESP delivers subsidised energy audits and light retrofits such as insulation upgrades and weatherization, and is available to any residence in the state of Maine.
In addition, the DOE awarded Efficiency Maine a second ARRA funding block of $30 million through the Better Buildings Neighborhood Program in June 2010. The Better Buildings funding application was based using the funds primarily being used to finance PACE loans for similar retrofit products and services [
24].
In April 2011, the rebate funds for HESP were exhausted, and the program began the transition to the PACE loan program. The transition from a rebate program to a financing program offers a useful comparison between two approaches to retrofits among the same population.
2. Method
As noted, there is confusion over how to define success for a retrofit program. It is therefore important to clarify the metrics against which the Efficiency Maine case studies will be measured. This paper will compare the HESP grant program and the PACE financing program on the basis of not only the energy savings and cost effectiveness they deliver, but also on their surrounding market impacts such as market penetration, job creation, leveraging of private investments, and project size.
The HESP program operated from 01/01/2010 through 30/06/2011, when it transitioned to the on-going PACE program. The HESP program was completed closed by 30/09/2011. This work will carry out its comparison based on publicly released performance data from the Cadmus Group’s HESP Final Evaluation Report [
25], the Opinion Dynamic PACE Interim Process Report [
21], and the 2011 and 2012 Efficiency Maine Trust Annual Reports [
26,
27]. However, note that since PACE is an on-going program many of the performance figures will have changed since the 2012 annual report. The author has therefore supplemented this data through private communications with the program organizers [
28], and will add qualitative comments where appropriate. All costs are given in USD.
3. Program Description—HESP
The HESP program provided whole house energy efficiency measures and was available to any dwelling in the state of Maine. The measures covered by HESP include weatherization, air sealing and insulation, heating system replacement, hot water system replacement, controls, window, door, and renewable energy systems. The program offered a direct rebate of up to $1,500 for projects that saved at least 25% and up to $3,000 for projects saving at least 50%. The projected savings were calculated from a thermal model created by the home energy auditor or contractor [
25]. It is therefore important to note that all savings calculated through this work are anticipated savings that have not been confirmed through metering or billing data.
The program relied primarily on traditional outreach and marketing strategies such as television, radio, and print advertising. In response to the low initial uptake of the program, Efficiency Maine introduced a time limited bonus of $1000 during the summer of 2010. The Cadmus review determined that by the end of the program, HESP had high recognition rates and brand identification even among non participants [
25].
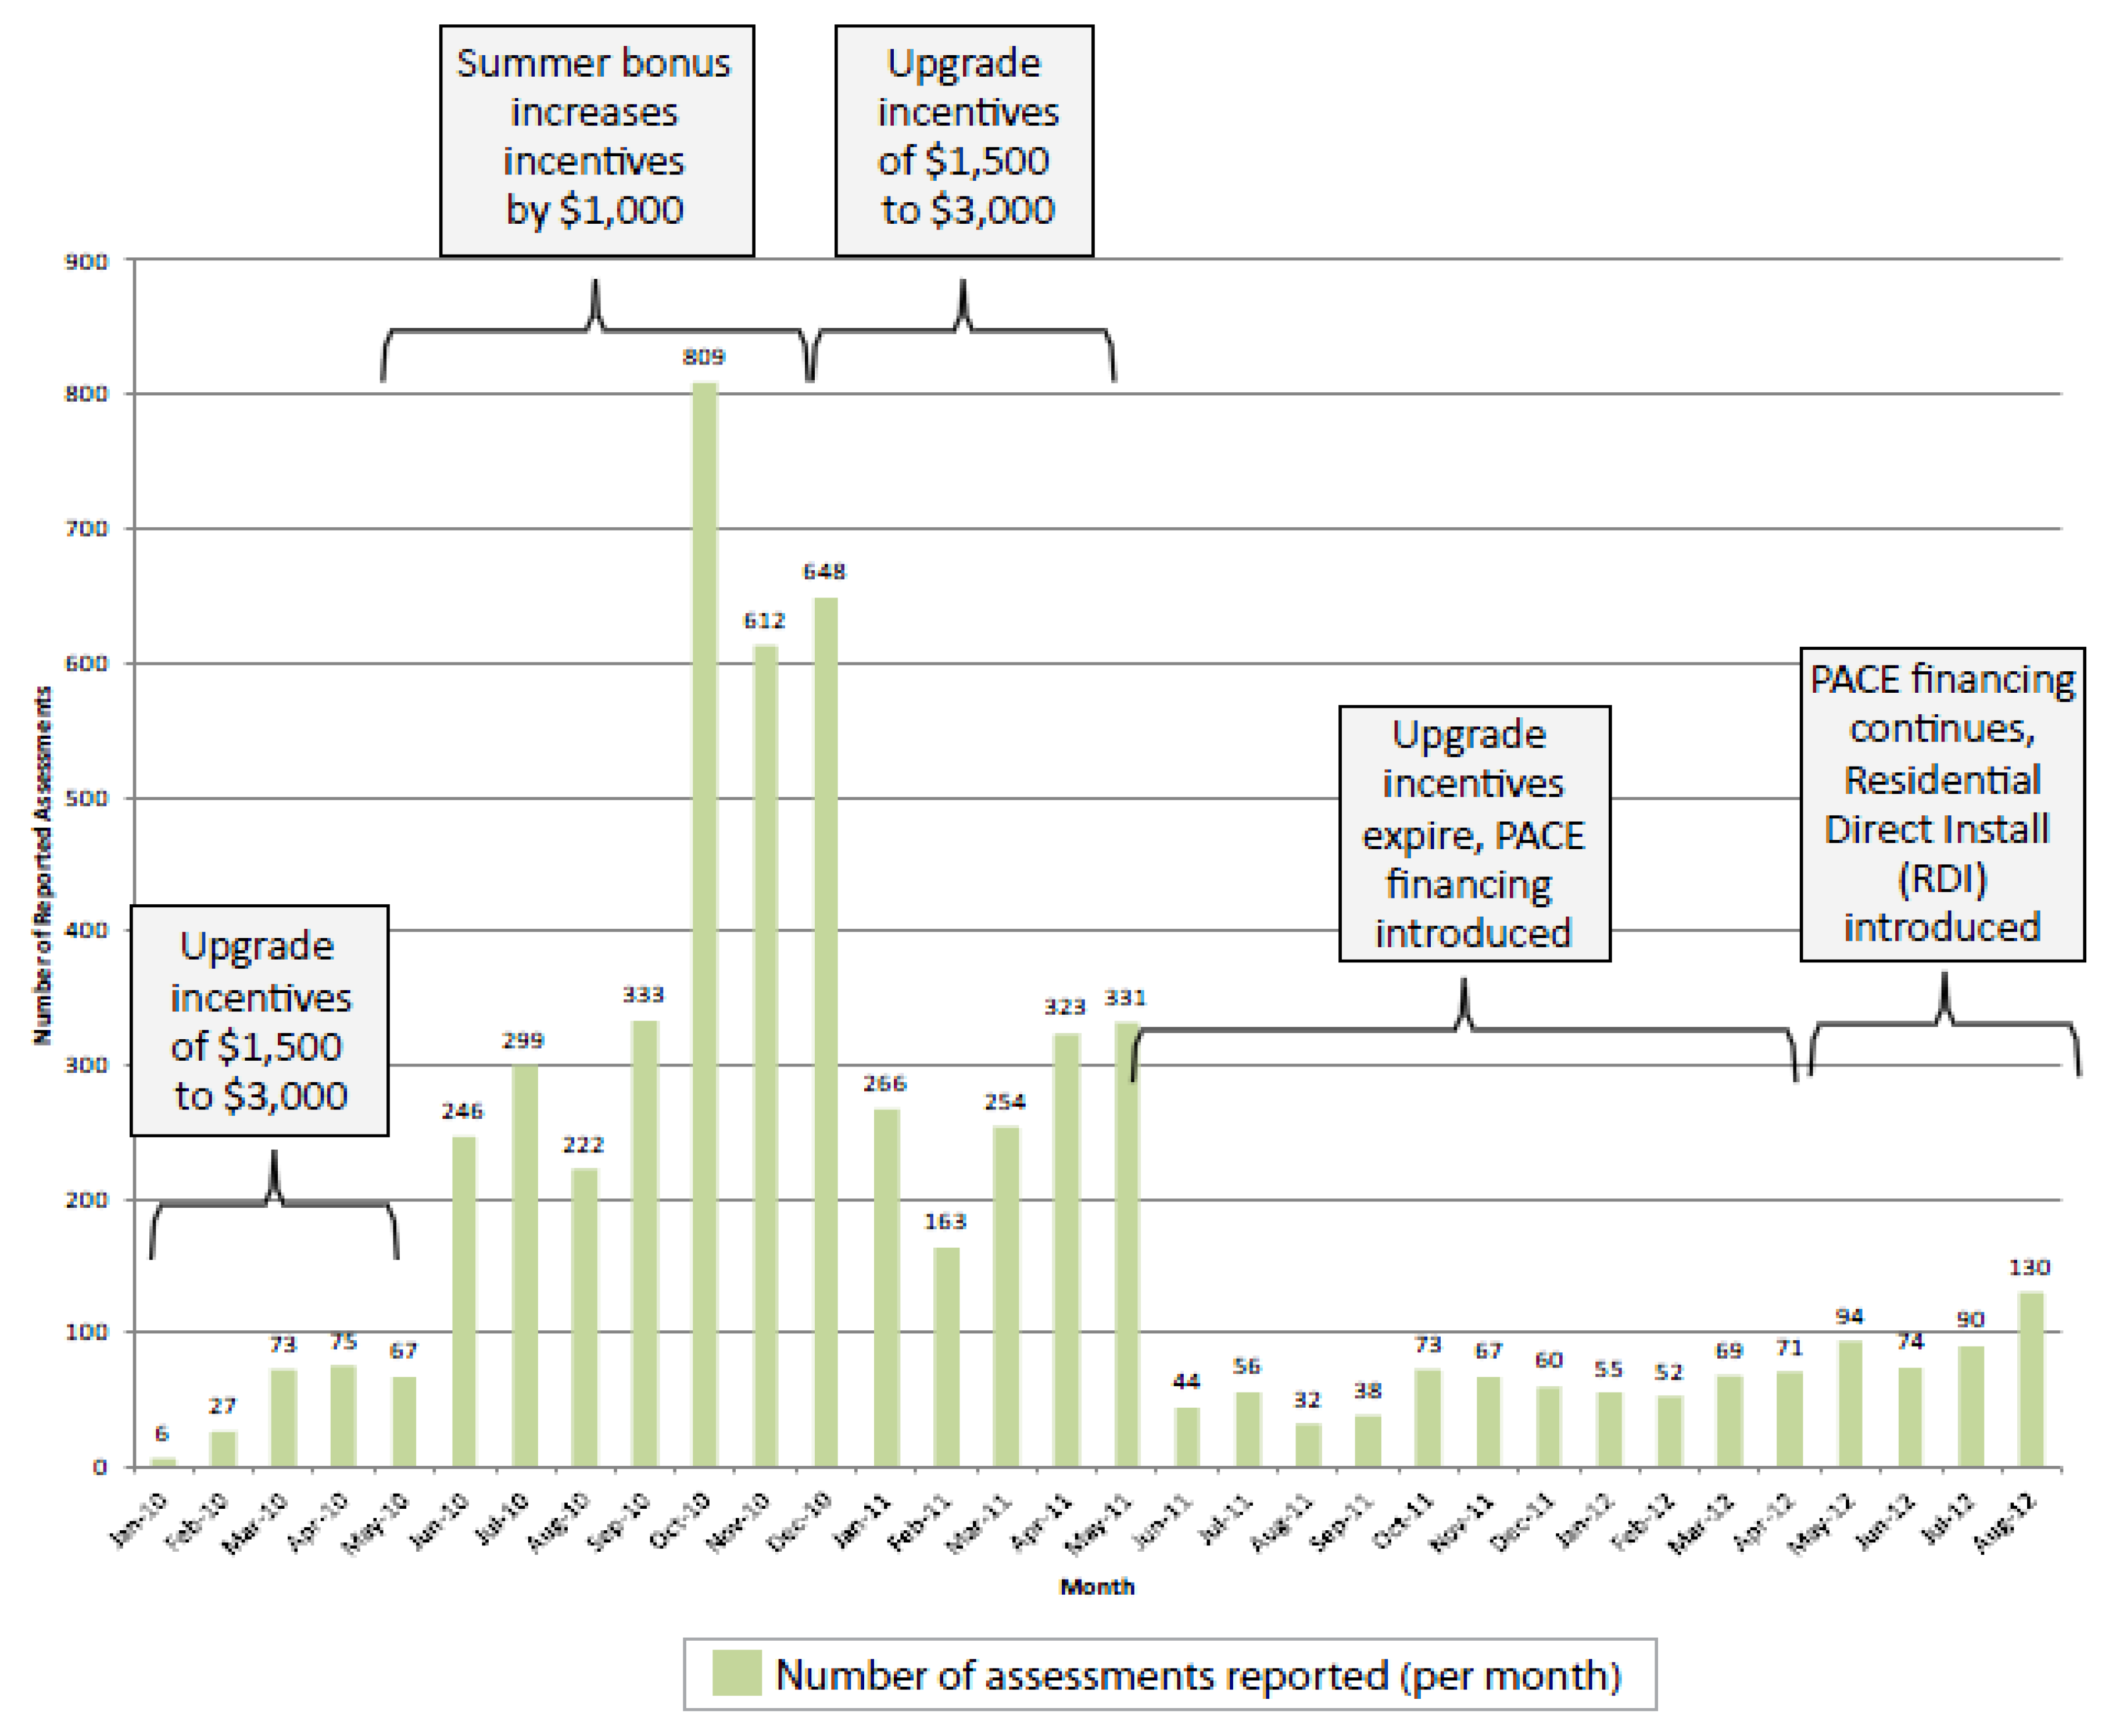
The plot in
Figure 1 describes the number of initial assessments throughout the project timelines for both the HESP and PACE programs. Note that this is the number of initial applications, not the final number of completed retrofits. This shows the initial slow response, followed by the increase in interest in HESP with the addition $1000 summer bonus period. It also shows the sharp drop-off with the transition to PACE, as well as the gradual increase in interest since the introduction of the Residential Direct Install (RDI) program.
The data in
Table 1,
Table 2 summarize the HESP results according to the Efficiency Maine Fiscal Year 2011 Annual Report [
26]. This covered the program period from 01/01/2010–30/09/2011. Note that reported energy savings are estimated using the engineering calculations and modeling projections that are part of the internal program process.
Figure 1.
Number of reported assessments throughout project transition from Home Energy Savings Plan (HESP) to Property Assessed Clean Energy (PACE) [
29].
Figure 1.
Number of reported assessments throughout project transition from Home Energy Savings Plan (HESP) to Property Assessed Clean Energy (PACE) [
29].
Table 1.
HESP results (01/01/2010–30/09/2011)—Annual Report FY11 [
26].
Table 1.
HESP results (01/01/2010–30/09/2011)—Annual Report FY11 [26].
| Total | Lifetime Energy Savings | Efficiency | Participant | Lifetime Energy | Benefit to |
|---|
| Units | (MMBtu) | Maine Costs | Costs | Benefit | Cost Ratio |
|---|
| 3,127 | 4,820,173 | $8,588,496 | $20,368,825 | $101,335,965 | 3.5 |
Table 2.
HESP expenditures (01/01/2010-30/09/2011)—Annual Report FY11 [
26].
Table 2.
HESP expenditures (01/01/2010-30/09/2011)—Annual Report FY11 [26].
| Incentive | Technical Support | Marketing | Administrative | Total |
|---|
| $6,024,706 | $1,984,572 | $357,371 | $221,848 | $8,588,497 |
Efficiency Maine commissioned a comprehensive program evaluation by the Cadmus Group, which visited 41 HESP project sites in order to verify the installed measures. They also performed their own energy simulations and engineering analyses to compare with those projected by the home energy auditors and contractors carrying out the work. This analysis determined a 90% realization rate between the reported and verified measures. [
25] Note that the realisation rate refers to third party calculations using the same methodology, not the realisation rate between the modelled savings and those confirmed through metering and billing data.
In addition, the Cadmus review analyzed a limited number of energy bills, and finally, carried out a survey of both participants (N = 70) and partial-participants (N = 30) from the program in order to determine participant motivations and quantify free-ridership for those that would have pursued retrofit measures regardless of the program’s interventions. The ratio of the total participants to those that participated due to the program’s interventions it termed the net to gross ratio. This analysis found a net to gross ratio of 86% [
25].
The cost effectiveness of the program was then measured based on both the Total Resource Cost (TRC) test as well as the DOE’s State Energy Program Recovery Act Cost (SEP-RAC) test. The TRC test is a common cost effectiveness test which compares the avoided energy costs to the program administration and customer costs. The SEP-RAC test states that all ARRA funded programs must offset at least 10 net MMBtus per year per $1,000 of public expenditure. The Cadmus Review calculated a TRC ratio of 2.56 and a SEP-RAC expenditure rate of 13.41 MMBtu/$1000. This means that the HESP program was verified to be cost effective by both the TRC test and the SEP-RAC test, accounting for the 90% realization rate and 86% net to gross ratio [
25].
The Cadmus review used the reported estimated useful lifetime of the efficiency measures included in the program data in order to calculate the lifetime net energy savings. While the methodologies for the calculations contained in the Annual Report are not explicitly defined, the overall figures agree closely enough with the details in the Cadmus Review that similar methodologies can be assumed.
In addition to the energy savings and cost effectiveness objectives, it was a stated goal for the HESP program to recruit and train 100 new participating energy advisors. Many sources have previously noted the links between strong contractor networks and the delivery of high volumes of loans in financing programs [
30]. Knowing this, Efficiency Maine focused on preparing contactors for the transition from HESP to PACE, as many planned to roll back home performance work in their business models.
4. Program Description—PACE
From the $30 million ARRA Better Buildings funding, $20.4 million was allocated for the PACE revolving loans. As of February 2013, a total of 158 Maine municipalities had passed PACE ordinances and entered into an agreement with Efficiency Maine to administer the loan program on their behalf, accounting for 74% of the state population [
28]. PACE loan are available in 5, 10, or 15 year terms at a fixed interest rate of 4.99% APR. Participants may borrow from $6,500 to $15,000, up to 100% of their home equity. Most participants were those in the top 35% of income by household. Projects below $7,500 are typically financed directly by the homeowner [
21].
Shortly after the rollout of the PACE program, Efficiency Maine introduced the PowerSaver Loan Program and the Residential Direct Install Program (RDI) in spring 2012 to expand the eligible participants. Both programs are also funded by the ARRA Better Buildings grant [
21]. The PowerSaver Program covers the same home energy improvements as PACE, but offers a wider range of loan amounts, is available state-wide, and has slightly different eligibility criteria. While some sources have distinguished between the PACE and PowerSaver Loan sign-up rates, most treat the programs collectively, as will be done in this work.
The PACE/PowerSaver loans begin with an energy audit that takes a long term view at the potential retrofit measures. A Building Performance Institute (BPI) certified contractor will perform a survey of the possible measures including the generation of a thermal model that simulates the potential savings and payback periods. The proposed measures must demonstrate a minimum savings of 20% to be eligible for the loan.
The audit typically costs around $500 and is part of the loan application procedure, but does not include any on the spot improvements. The program designers hoped that customers would use the RDI direct install program (described below) as a stepping stone to the deeper retrofit measures of the PACE/PowerSaver loans.
The results in
Table 3,
Table 4 give the lifetime savings and cost effectiveness for the PACE program based on the Efficiency Maine fiscal year 2012 Annual Report. Note that what is denoted as Incentive costs in
Table 4 for accounting expenditures, are in fact the participant costs which will be repaid over the loan lifetime. The calculations indicate saving homeowners an average of 40% over their prior energy consumption levels. As an interim program review, the Opinion Dynamics report was not able to conduct the same TRC and SEP-RAC cost effectiveness verifications that were carried out by Cadmus for the HESP program. Calculation methodologies for the results shown are assumed common between the 2011 and 2012 Annual Reports.
Table 3.
PACE and PowerSaver Loans (01/07/2011–30/06/2012)—Annual Report FY12 [
27].
Table 3.
PACE and PowerSaver Loans (01/07/2011–30/06/2012)—Annual Report FY12 [27].
| Approved | Lifetime Energy | Efficiency | Participant | Lifetime Energy | Benefit to |
|---|
| Loans | Savings (MMBTU) | Maine Costs | Costs | Benefit | Cost Ratio |
|---|
| 236 | 320,313 | $787,812 | $2,542,421 | $6,199,253 | 1.86 |
Table 4.
PACE and PowerSaver Loan expenditures (01/07/2011–30/06/2012)—Annual Report FY12 [
27].
Table 4.
PACE and PowerSaver Loan expenditures (01/07/2011–30/06/2012)—Annual Report FY12 [27].
| Incentive | Technical Support | Marketing | Administrative | Total |
|---|
| $2,542,421 | $314,054 | $401,964 | $71,795 | $3,330,233 |
As noted in
Figure 1, initial outreach was slow, as of July 2012, the PACE program had only issued 26% of its $20.4 million Better Buildings funding in PACE and PowerSaver Loans [
21]. However, the rate of monthly loan closures has for the most part steadily increased since the 2012 Annual Report was issued. As of 10/02/2013, the PACE and PowerSaver programs have closed a total of 389 loans totaling a value of $4,993,806, with an average loan value of $12,838 [
28].
The only exception to the upward trend in monthly loan closures is a slight decrease in early 2013. This decrease is presently unexplained, though it is possibly correlated with the dramatic increase in RDI uptake over the same period, and the constrained resources of contractors being unable to meet the demand of both programs simultaneously [
28].
The RDI program was designed as an add-on partway through the PACE program process. It initially offered a $300 rebate for six hours of work, which was increased to $600 in September 2012. The measures include a blower door test, thermal imaging, combustion safety testing, and air sealing and weatherization measures. The retrofit measures targeted by the RDI program are meant to be direct install options with little follow-up or long term planning, but were meant to serve as a lead in to the PACE loan application process. To incentivize the coordination between PACE/PowerSaver and RDI, homeowners may count their RDI measures as meeting the 20% energy savings threshold required for the loan, thus removing a barrier to the application process [
28].
There have been a total of 2752 RDI completions as of 07/03/2013 and the rate of monthly completions has increased steadily since the program’s inception, with a more dramatic increase since the incentive was increased to $600. Program organizers are conducting a rigorous phone campaign to follow up on RDI participants, and have received anecdotal confirmations that a number of participants come to PACE loans through RDI lead-ins. Note that at the time of writing there is insufficient data to assign a causal link and that this is simply a correlation noted by program staff [
28].
5. Findings
This paper aims to compare a grant program to a financing program on the basis of their overall impacts on the domestic retrofit market. This section will first compare the energy savings and cost effectiveness of each program according to the Efficiency Maine Annual Reports [
26,
27]. The data in
Table 5 summarizes the comparison between the HESP grant program and the PACE loan program.
Note that while the unequal time periods for the two programs, as well as the fact that the PACE program is still ongoing, prevent comparisons between the two in absolute terms, there are nonetheless useful relative comparisons that can be made between them.
Table 5.
HESP versus PACE program summaries.
Table 5.
HESP versus PACE program summaries.
| Program | HESP | PACE |
|---|
| Program Period | (01/01/2010–30/09/2011) | (01/07/2011–30/06/2012) |
| 21 months | 12 months |
| Source | Annual Report FY11 | Annual Report FY12 |
| Total Participants/Loans | 3,127 | 236 |
| Lifetime Energy Savings (MMBtu) | 4,820,173 | 320,313 |
| Average Energy Savings Per Household (MMBtu) | 1,541 | 1,357 |
| Efficiency Maine Costs | $8,588,496 | $787,812 |
| Participant Costs | $20,368,825 | $2,542,421 |
| Total Cost | $28,957,321 | $3,330,233 |
| Benefit in Lifetime Energy Offset | $101,335,965 | $6,199,253 |
| Benefit to Total Cost Ratio | 3.5 | 1.9 |
| Benefit to Efficiency Maine Cost Ratio | 11.8 | 7.9 |
| Participant to Public Cost Ratio | 2.4 | 3.2 |
| Efficiency Maine Costs per Lifetime MMBtu Offset | 1.8 | 2.5 |
| Average Project Size | $9,260 | $12,739 |
Both of the programs have benefit to total cost ratios above one, indicating that they are both objectively successful. The benefit to total cost ratio of the HESP grant program at 3.5 is nearly double that of the PACE benefit to cost ratio of 1.9. However, since the bulk of the PACE expenditures are due to be repaid as loans, the benefit to public cost ratios are closer for the HESP and PACE programs at 11.8 and 7.9 respectively.
Both the HESP grant program and the PACE loan program deliver comparable average energy savings per household, again noting that all energy savings are estimated using the engineering calculations and modeling projections that are part of the internal program process. The grant program is more cost effective than the loan program in terms of public expenditures per unit energy savings over the lifetime of the measures, with HESP and PACE achieving $1.8/MMBtu and $2.5/MMBtu respectively. Note that this calculation differs from the SEP-RAC test, which uses a different calculation methodology and considers a one year evaluation period.
The next theme that will be considered is market penetration. As seen in
Figure 1, the grant program had considerably higher uptake rates than the financing program. This is to be expected, as there are clear draws to a financial giveaway both in terms of the upfront cost barrier, and in the perceived complexity of a loan. In order to drive interest in the PACE loan program, Efficiency Maine introduced the popular RDI direct install program and the results thus far indicate increasing monthly loan closures, possibly driven by RDI lead ins.
According to the savings and cost effectiveness metrics in
Table 5 the HESP grant program has outperformed the PACE loan program, however, as previously noted, there are many ways with which to define success. This work also seeks to assess the programs’ broader impacts in terms of the job market, private investments leveraged, and project size.
This program demonstrates the common pattern of grant program benefits drying up once the funding ceases, as evidenced by the experience of the contractors delivering HESP and PACE products and services.
It was a stated goal in the HESP program to recruit and train 100 new participating energy advisors. To evaluate job impacts, the Cadmus review used the DOE’s analytical protocol which assumes one job-year is created for every $92,000 in program spending. Given $8,549,371 in total ARRA expenditures, the program is assumed to have created 93 job years during the examination period.
Throughout HESP, Efficiency Maine offered support and training to help contractors close a retrofit sale. Methods included working with program partners to offer professional development courses, free dedicated sales training, creating a standard assessment checklist, and delivering monthly program webinars. Throughout summer 2010, sales training led to an increase from 10% to 60% of conversion rates for customers moving from initial assessments to purchasing the recommended retrofit measures [
31].
Despite this positive progress, as the transition from the HESP to the PACE program approached, many contractors expressed skepticism that the workload would continue, and began to transition their business models back towards more traditional home renovation work and away from energy efficiency retrofits. The contractors’ lack of faith in the workflow being maintained during the HESP to PACE transition is a symptom of the way in which grant programs create a temporary stimulus without lasting market changes.
The Opinion Dynamics interim review could not include total job years in their calculations; however, interviewed contractors stated that PACE loans account for 20% of their business. While this is not quantitatively compared to the HESP program, many interviewed contractors claimed not to see a significant increase in demand for their services and products from the PACE program, particularly when compared to the HESP program. Some contractors suggested that the increase in demand for energy efficiency projects may have more to do with Efficiency Maine’s overall marketing efforts than with the PACE program itself [
21].
Overall, the Opinion Dynamics review found that the PACE loan financing is driving some demand increases for registered vendors of retrofit products and services, however, its overall impact on their operations is minimal. However, the energy assessors have shown a more notable increase in demand for their services, in part generated by the program requirement for participants to undertake an energy audit [
21].
The majority of contractors have reported that the PACE loan program has thus far not motivated them to make significant changes to their operations. Most contractors interviewed for the PACE review had been active in HESP before PACE. One contractor summarized the difference between the programs and their impacts by saying: “As time goes on and more people experience the positive effect of [the PACE loan program], it will grow. But it’s not going to be the lit gasoline that the HESP program turned out to be.” [
21].
While the data in
Table 1 cast the HESP program as more cost effective than the PACE program in terms of benefits per public expenditure, it is feasible that this will change as the PACE program grows and becomes more efficient. While this is not indicated by the present data, loan programs are typically more cost effective and more sustainable over their lifetime than grant programs. Based on the data in
Table 2,
Table 5, the HESP program spent $410,000 in public funds per month during its operation. Comparatively, the data in
Table 4 indicates that the PACE program has spent $277,500 per month, the majority of which will be repaid over the lifetime of the loans. If loan costs are excluded, then the PACE program has spent only $66,000 per month. The PACE loans are therefore a more sustainable source of funding on an ongoing basis.
Another indicator for the sustainability of a funding stream is the ratio of public to private expenditures that a program delivers. In this case, the ratio of private to public expenditures for the PACE program exceeds those of the HESP program by 3.2 to 2.4. Furthermore, the average project size increased under PACE from $9,260 to $12,739, which increases the demand for the products and services incentivized by the program.
6. Conclusions
The domestic retrofit programs operated by Efficiency Maine offer an interesting opportunity to compare the performance of grants and financing both in terms of the energy savings and cost effectiveness they deliver, as well as in terms of their broader and more lasting impacts to theretrofit market.
The HESP and PACE programs both constitute very successful examples of retrofit programs, both of which are shown as being cost effective by the Efficiency Maine Annual Reports, with lifetime benefit to total cost ratios of 3.5 and 1.9 respectively.
The efficacy of the HESP program has been externally verified by the Cadmus review. The PACE program is ongoing and has not been externally verified at the time of writing. However, the results available in the Annual Report are positive and the tracking data provided by program organizers shows that the uptake rates have only increased since 2012. This is furthermore aided by the introduction of the increasingly successful RDI direct install initiative.
The HESP program is more cost effective than PACE on the basis of lifetime benefits per unit of public spending with ratios of 11.8 and 7.9 respectively. This is a somewhat surprising result, as grant programs are typically costly, whereas much of the cost in loan programs is repaid. As was shown, in
Table 4, the bulk of the non-recuperated program expenditures for PACE occur in marketing the program, which may decrease over time as program awareness increases.
The two programs created somewhat different impacts to the surrounding markets. The HESP program spent far more public funds per month of its operation than the PACE program has so far. And while the rate of spending on PACE has increased since the data presented, and will continue to increase as the program attempts to use the remainder of its $20.4 million in ARRA funds, the bulk of this will be repaid on a revolving basis through the lifetime of the loans. HESP is therefore analogous to a rainstorm, whereas PACE behaves more like slow trickle of rain. This produces two distinct effects on the surrounding market as demonstrated by the experience of the contractors working to supply both HESP and PACE services. While HESP succeeded in creating nearly 100 jobs, many contracting firms were unsure they would maintain the high demand for energy efficiency retrofit services. The slow, gradual impact that the PACE program has will likely deliver a more lasting change to their business models, though this has yet to be demonstrated.
Another aspect of the lasting change to the market can be measured through the average project size, which increases the products and services demanded by the program, as well as the ratio of public to private expenditures, which again suggest the degree to which the program can be sustained beyond public funds. Both of these measures cast favorably for the PACE loan program in the long term.
Overall, the results of this analysis suggest quantitatively that the HESP grant program was more successful than the PACE loan program on the basis of energy savings and cost effectiveness, while qualitatively, the PACE program will likely have more long term effects on the market. Further work should investigate this once the PACE program has completed in late 2013.
It could be argued that the HESP program should be extended in order to maximize its effects. The funding stream for the PACE loans however sets out a distinct set of operating criteria centered on goals of long term market transformation. The successful HESP program, while unsustainable long term, very likely injected more life into the retrofit market than the PACE loan program could have accomplished initially on its own. The progression from the grant program, through a financing program, and now finally to a hybrid financing program with a small direct install lead-in incentive is an effective example of how a retrofit program can evolve.

