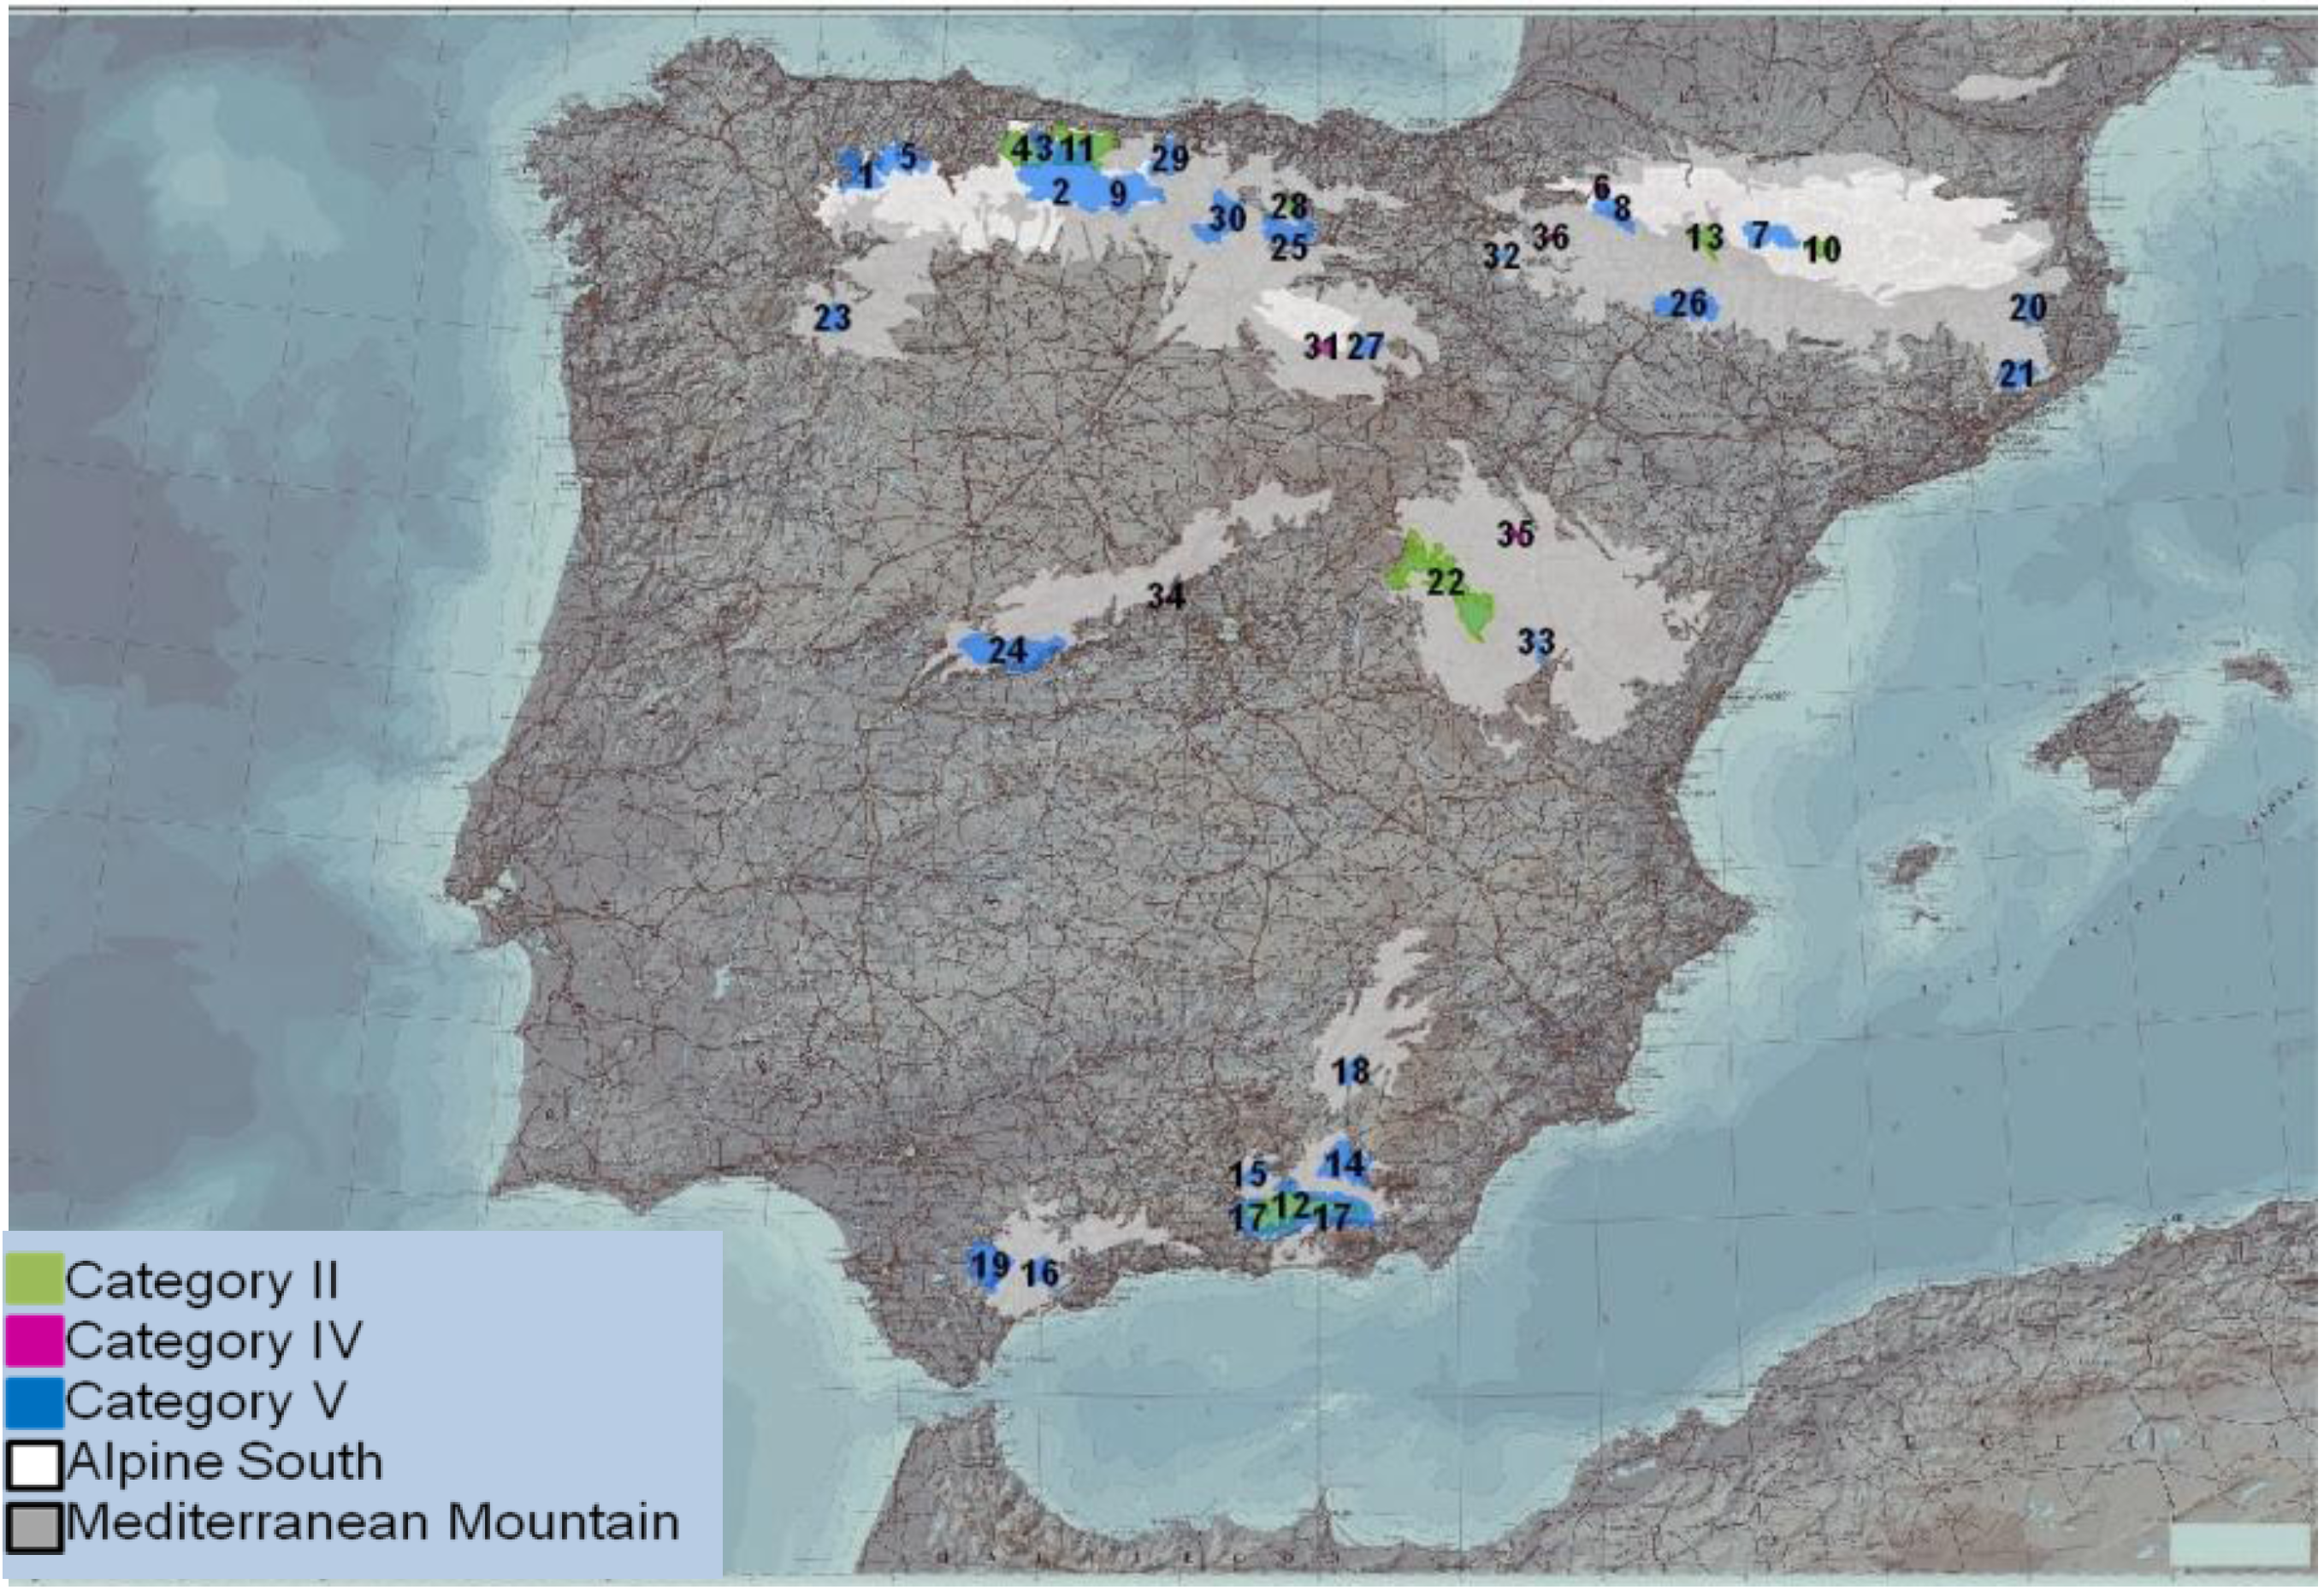
Figure 2.
Map of the selected PAs. Source: LANMAP2 (Alterra [
23]) and EUROPARC maps (Background from ©INSTITUTO GEOGRÁFICO NACIONAL DE ESPAÑA [
50]), redrawn in ESRI ArcGIS 10.0. The numbers correspond to the PAs.
The EUROPARC-España maps included 109 PAs larger than 10 km
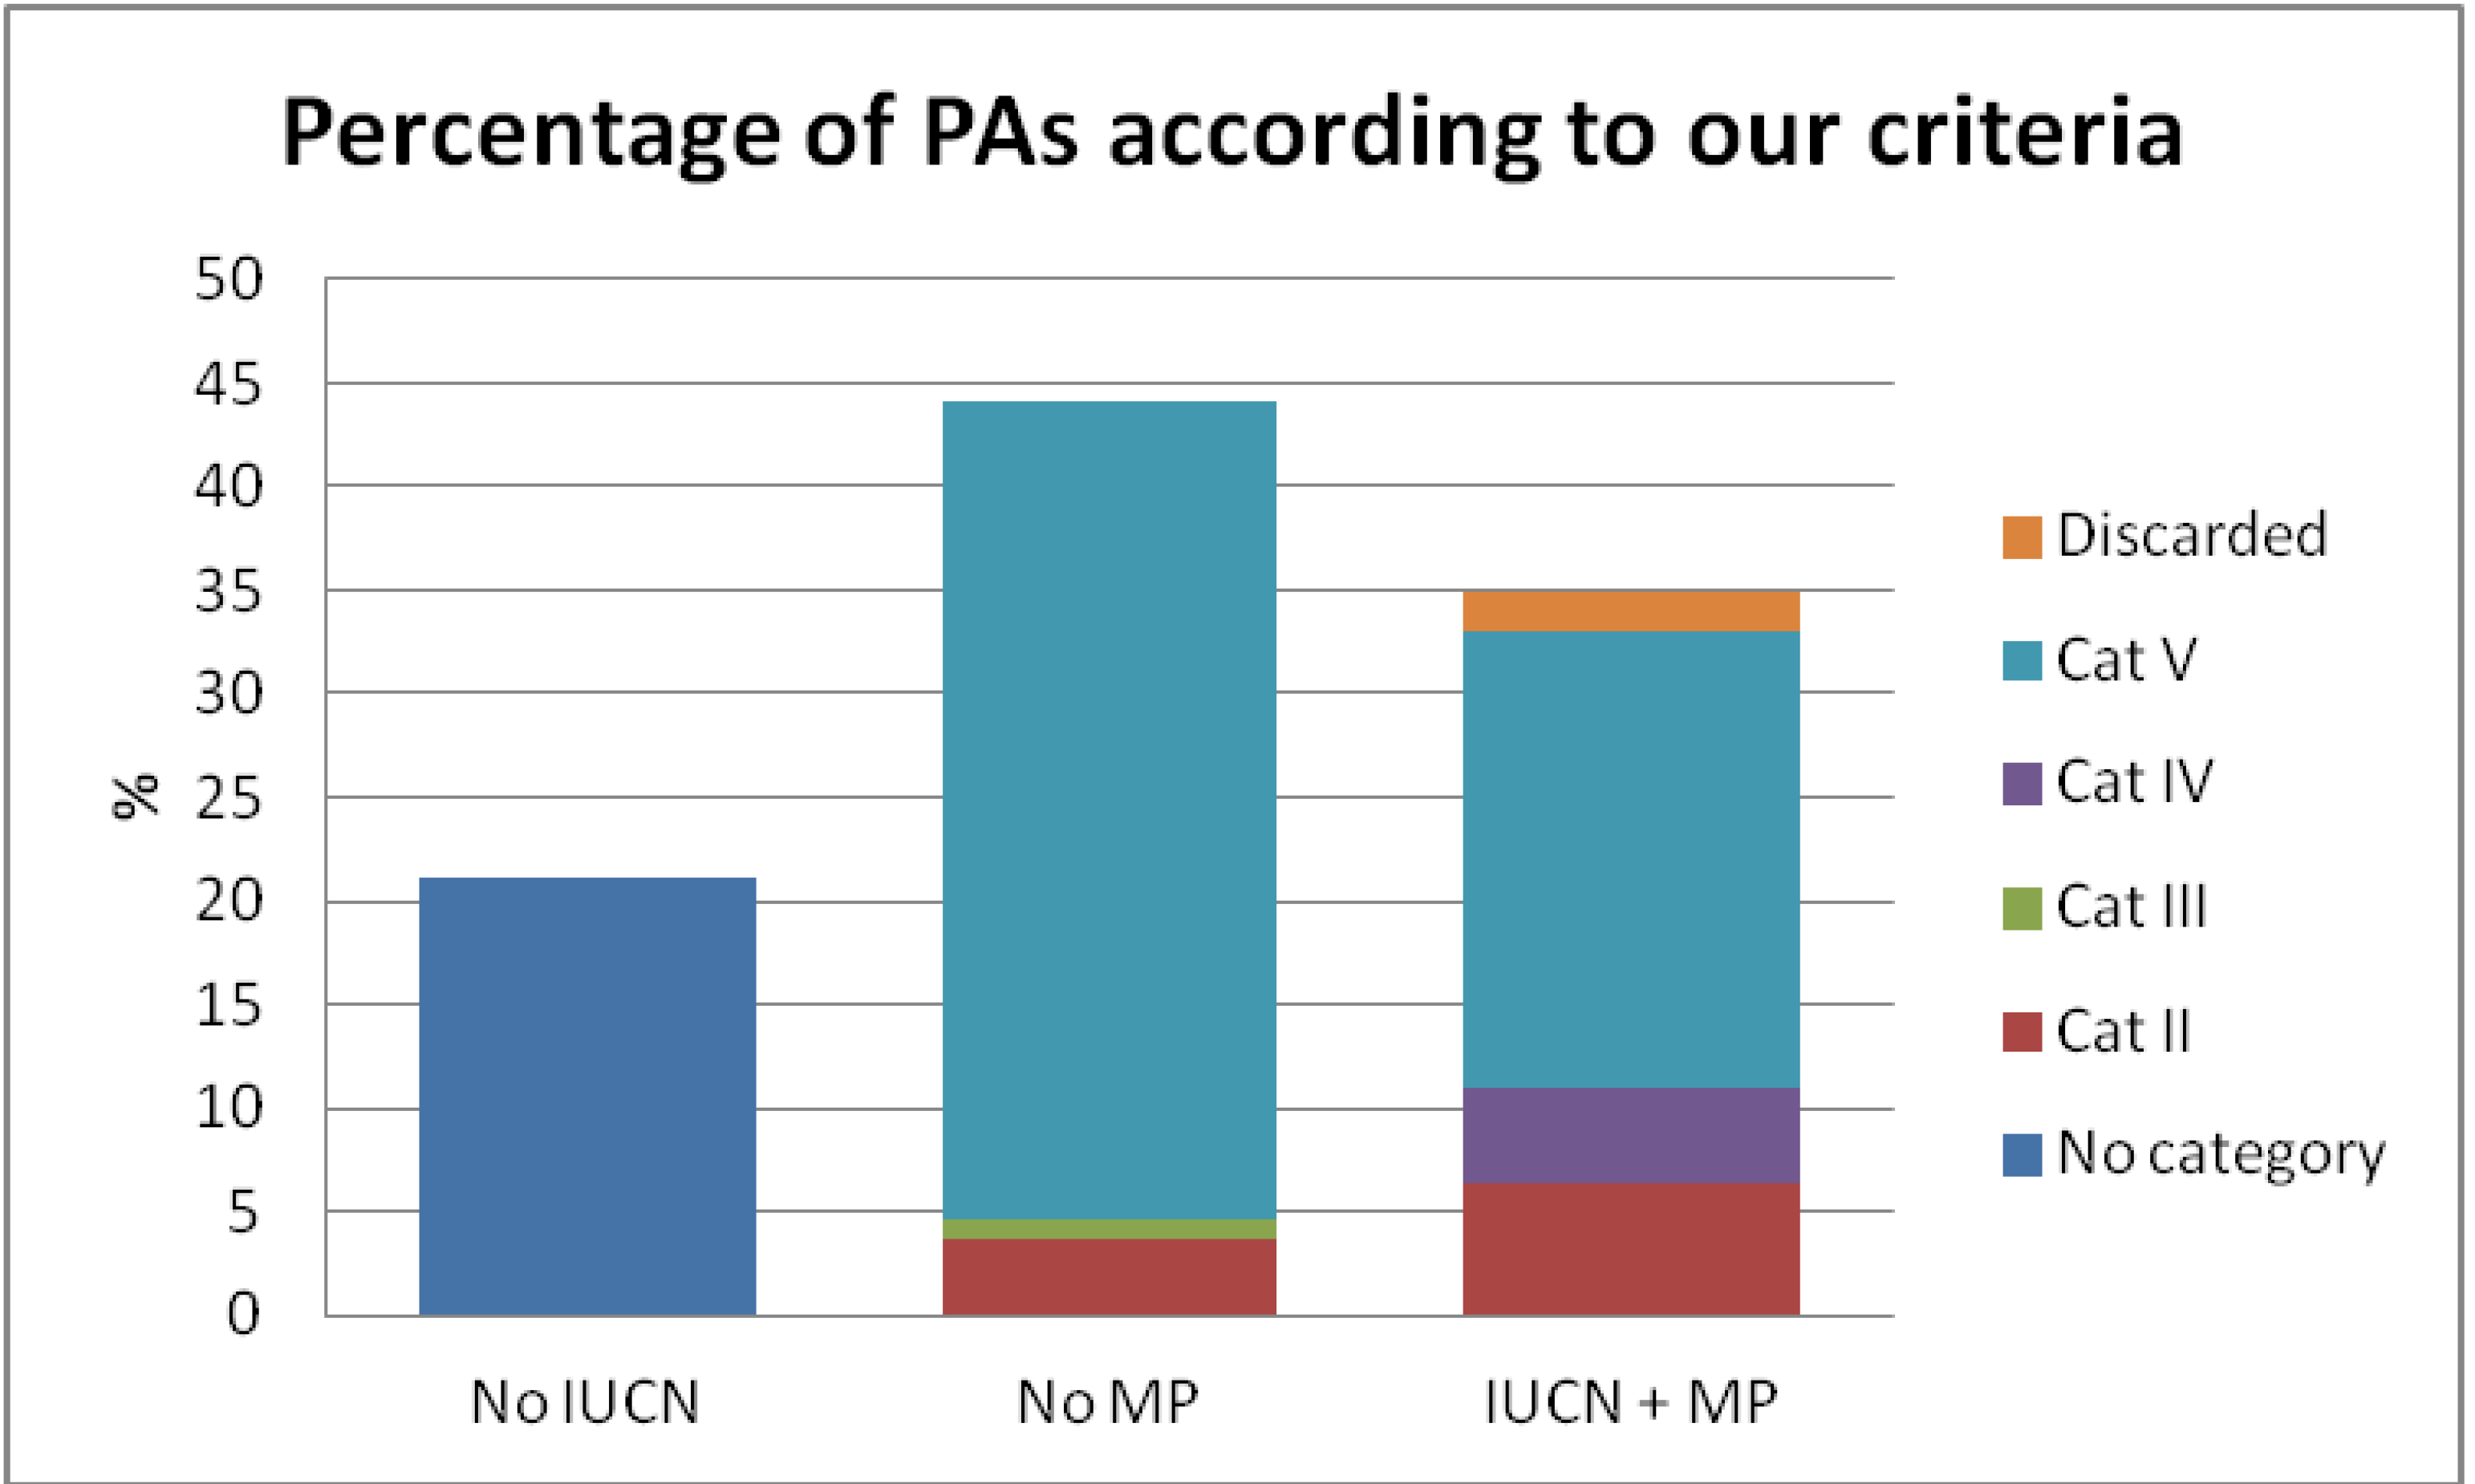
2 with more than 50% of their area in the Alpine south and/or Mediterranean mountain zones. Of these PAs, 21% were not associated with an IUCN category (
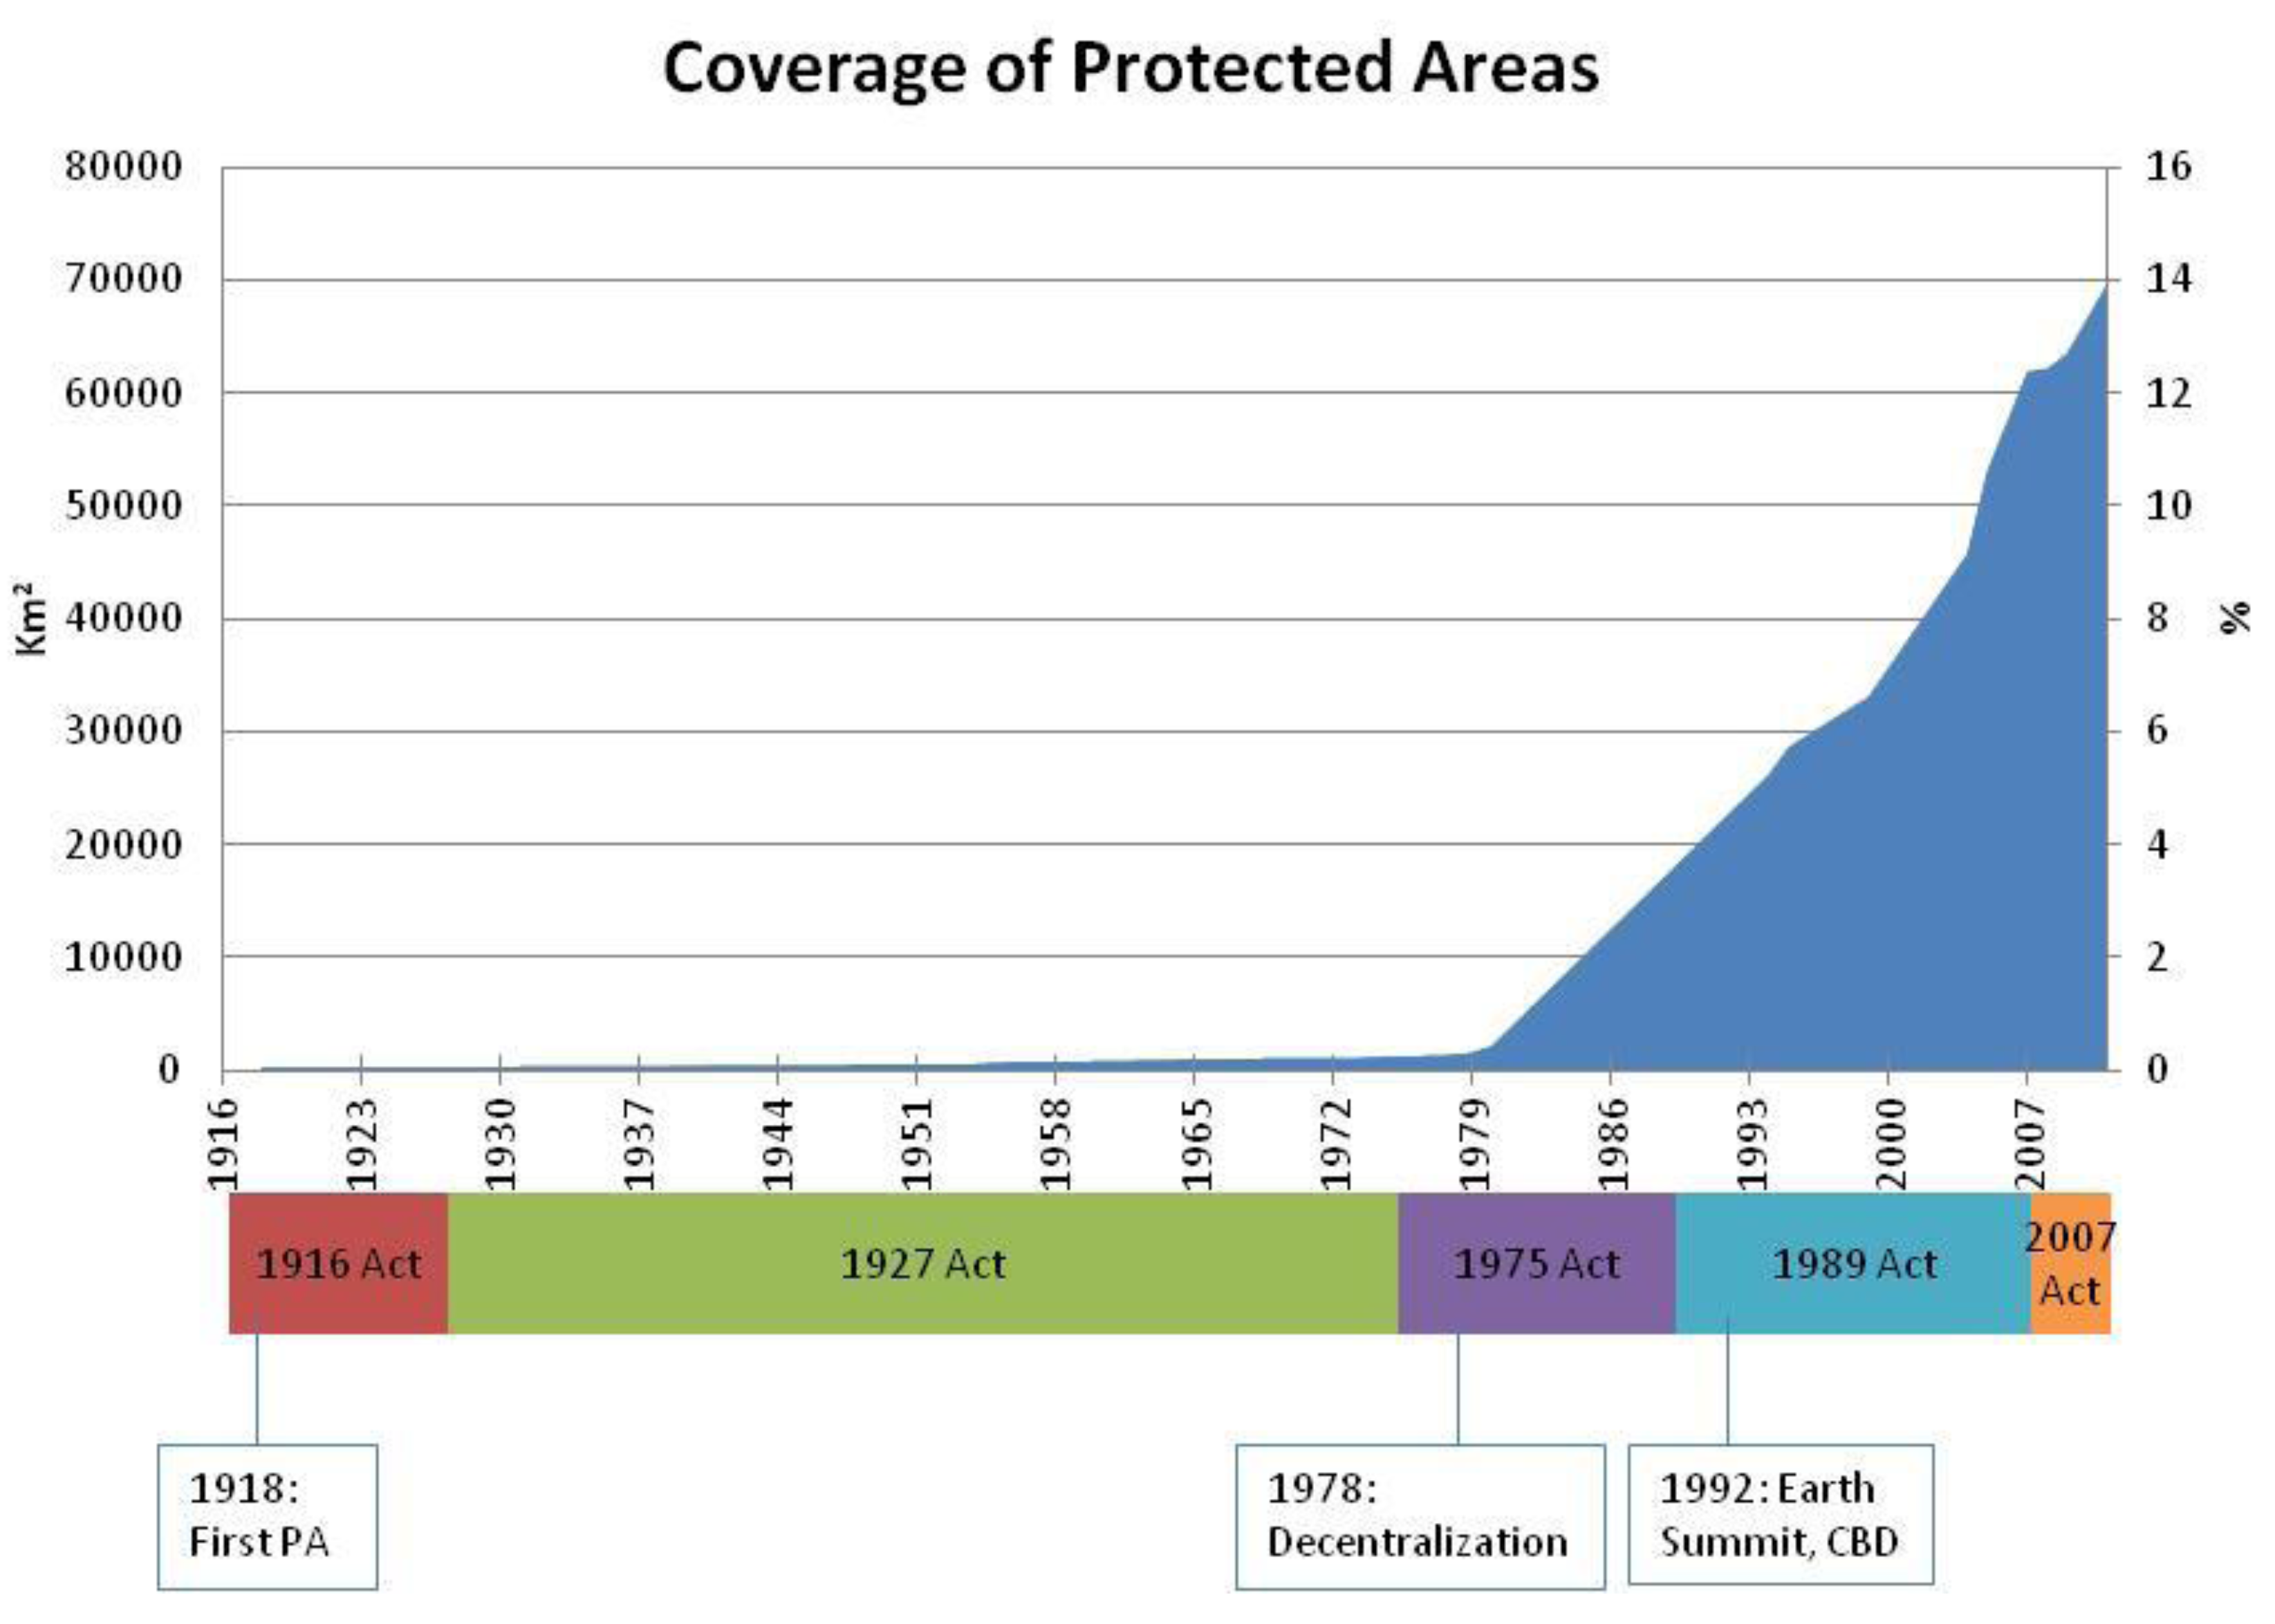
Figure 3). Of the remaining PAs, 45% lacked a management plan and were therefore discarded from our analysis. These PAs were mainly category V, corresponding to the PEIN class in Catalonia, which generally lack individual management plans such as PORNs or PRUGs. In total, 38 PAs were assigned an IUCN category and had a management plan available in either Spanish or English, thus meeting our study criteria. Two parks from this set were discarded because there was only one park in each category (one in category Ib and another in category III). Of the PAs selected, 91% were established after 1978, which means that the majority were created by the autonomous communities. The proportion of parks in category V was also higher (66.67%) than the proportions of parks in categories II or IV.
Figure 3.
Selection of PAs larger than 10 km2 located in Alpine zones. The percentage of PAs that have no IUCN category assigned (No IUCN) and the distribution of IUCN categories among parks without a management plan (NoMP) and with management plans available (IUCN+MP) are shown.
3.2. Management Regulations
The effects of the IUCN categories, vegetation zones and autonomous communities on management practices in the parks were analyzed using 12 different categories of regulation of human activities. In general, the management practices exhibited greater diversity than did the aims. While the aims were partially correlated with the IUCN category, the IUCN category explained less of the variance in management practices (7.89%) than did the autonomous communities (9.85%) (
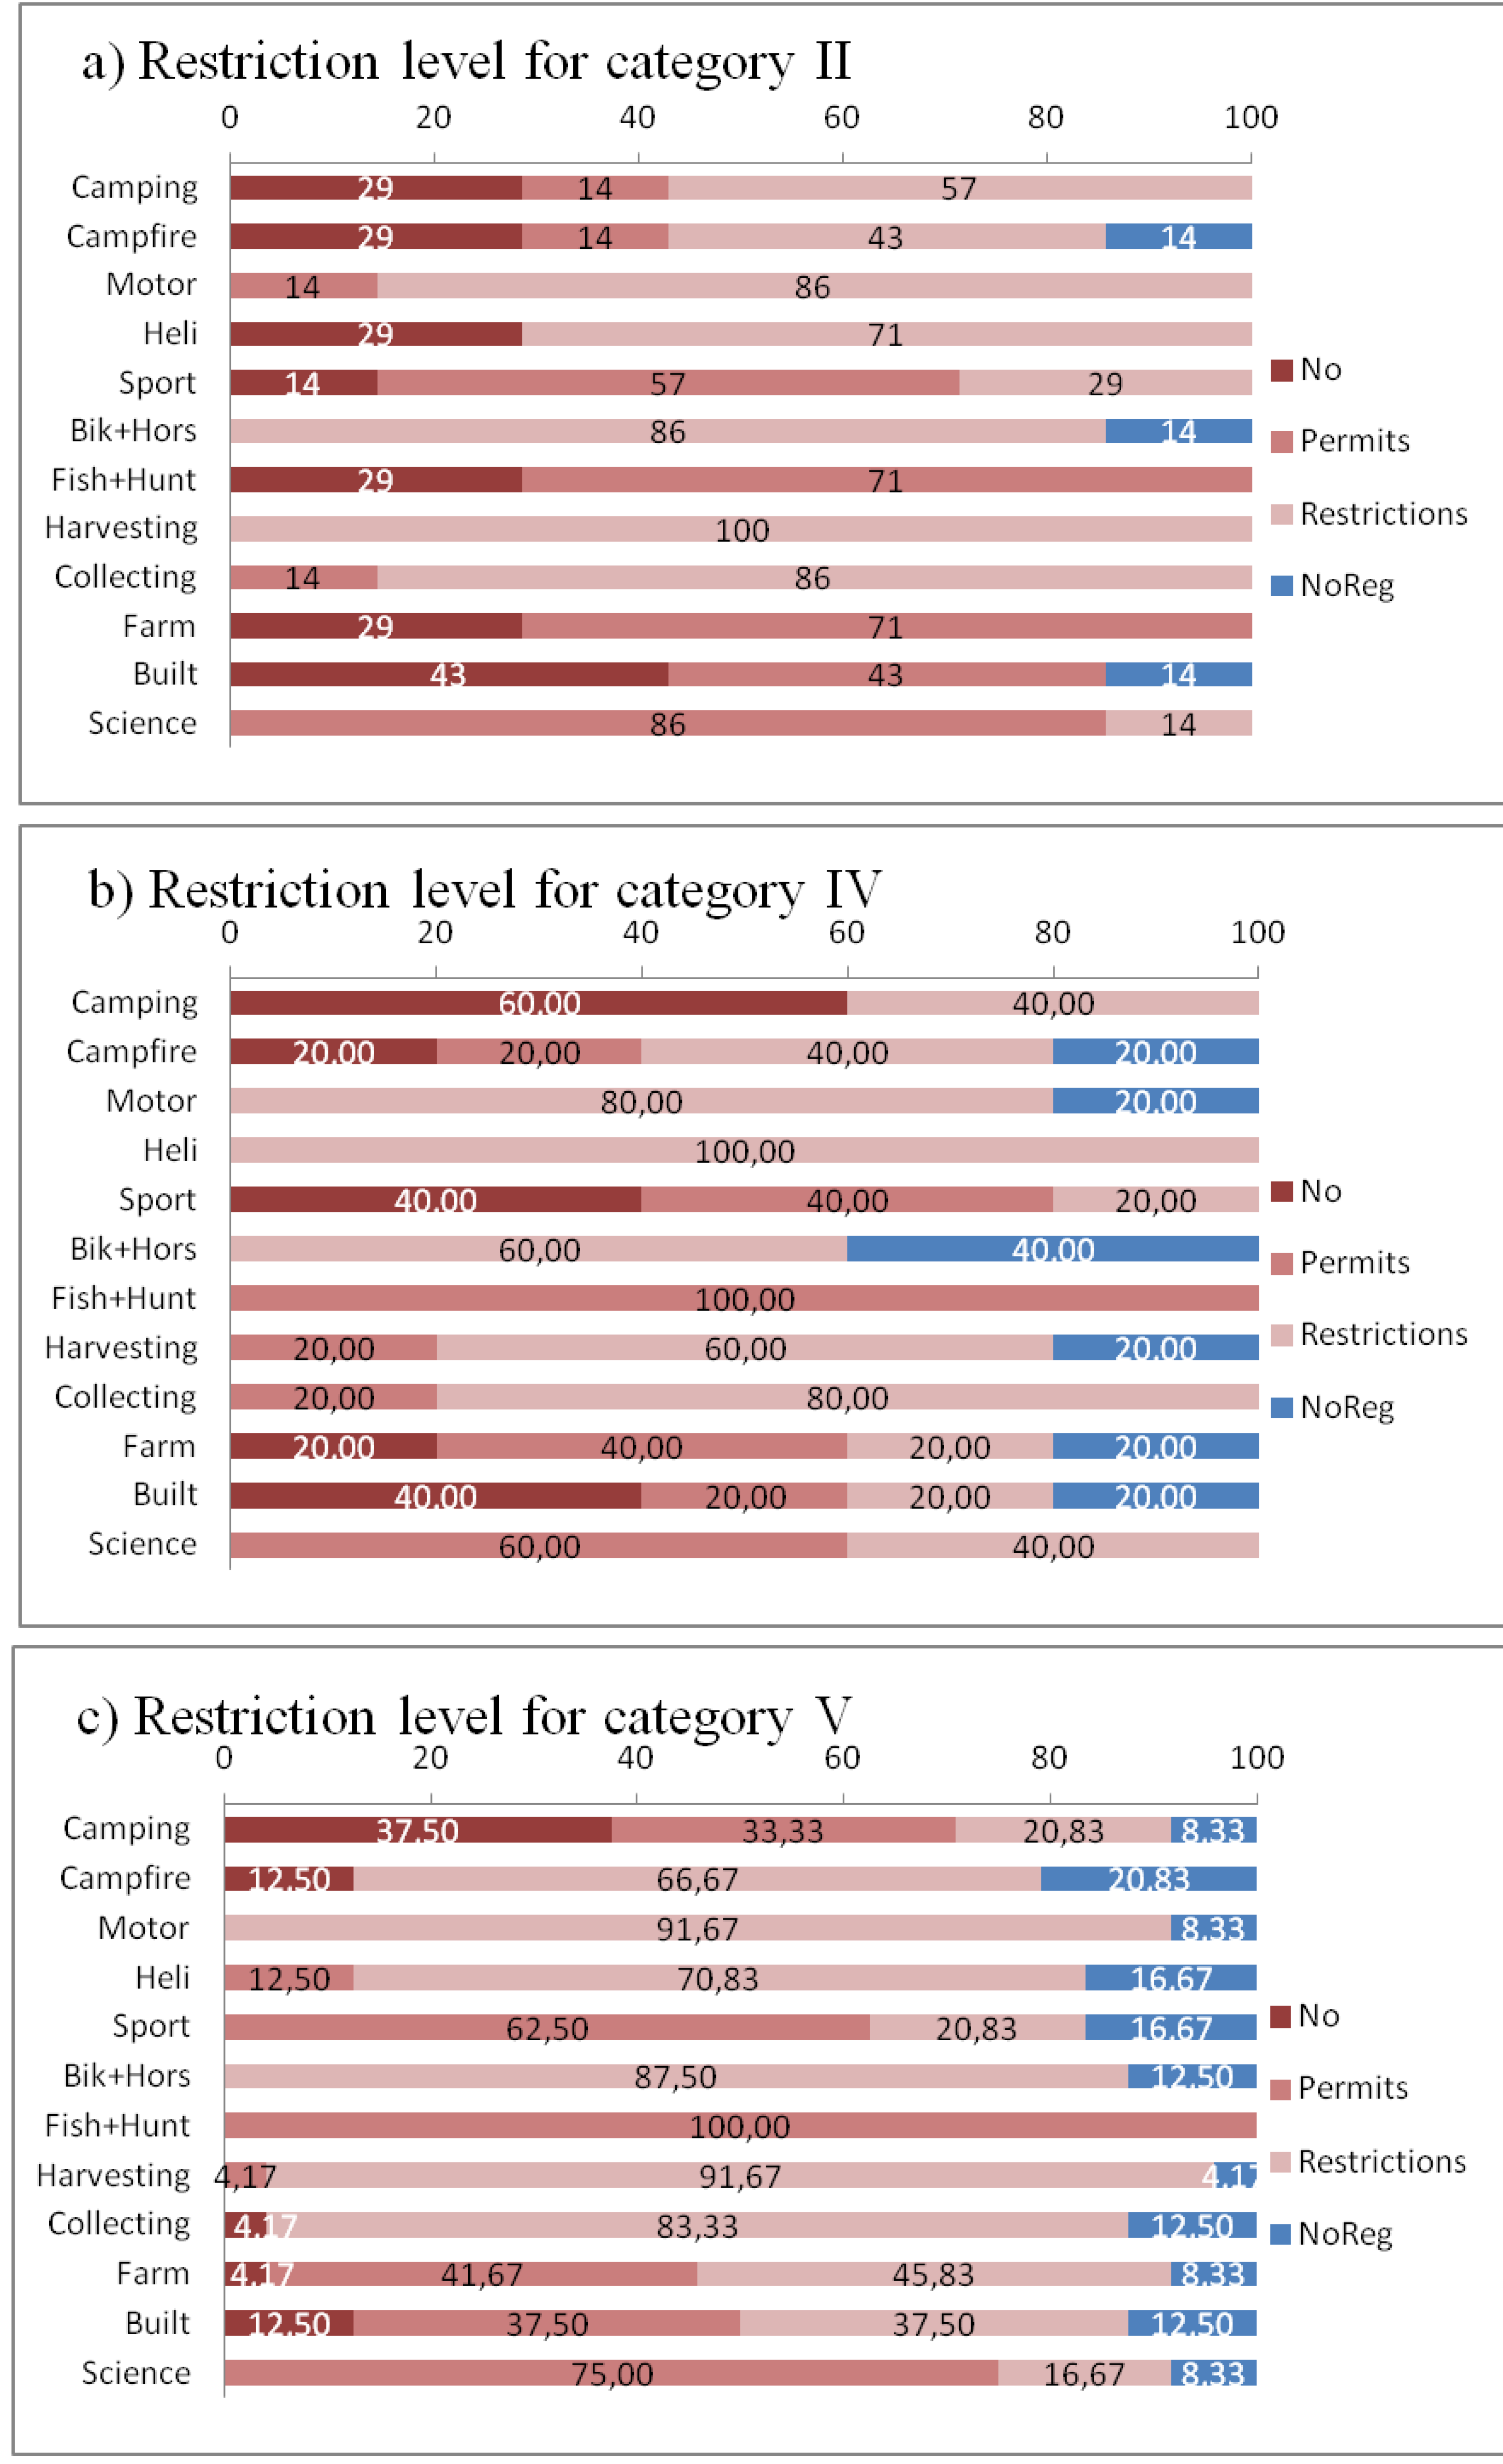
Table 2). There were, however, some weak gradients that could be explored further. The parks in categories II and IV have higher frequencies of activities classified as “No” and “Permits” (
Figure 5), such as campfire building, sport competitions, fishing and hunting activities and intensive farming and building. Category V parks also tend to lack regulation of some activities. Camping is generally restricted in all categories, and the use of motorized vehicles is usually limited to local residents. Low-impact activities, such as biking, horse riding and extensive harvesting and collecting, are generally not restricted in any category of park due to the low risk of damage to the PA. The use of resources for scientific purposes requires a permit in most of the parks.
Figure 5.
Percentage of the different levels of restriction (“No”, dark red; “Permits”, light red; “Restrictions”, pink; “Not regulated”, blue) for each regulated activity in the IUCN category II, IV and V PAs.
Figure 5.
Percentage of the different levels of restriction (“No”, dark red; “Permits”, light red; “Restrictions”, pink; “Not regulated”, blue) for each regulated activity in the IUCN category II, IV and V PAs.
The autonomous communities that established their own management policies at earlier dates tend to feature more restrictive management of human activities (higher percentages of “No”; see
Table 3). The vegetation zone explains only a small part of the variance (3.52%), which could be associated with somewhat more restrictive policies in the Alpine vegetation zones (see
Table 3). However, according to the CAiv analyses of regulations, there are no strong patterns related to any of our three response variables (
Table 2).
Table 3.
Percentage of management regulations at each restriction level in each autonomous community and vegetation zone (Alp, Alpine south; Med, Mediterranean mountains).
Table 3.
Percentage of management regulations at each restriction level in each autonomous community and vegetation zone (Alp, Alpine south; Med, Mediterranean mountains).
| | Not Regulated | Restrictions | Permits | No |
|---|
| Autonomous Community |
| 1 | 22.22 | 27.78 | 30.56 | 19.44 |
| 2 | 6.48 | 55.86 | 29.94 | 7.72 |
| 3 | 11.11 | 52.78 | 33.33 | 2.78 |
| Vegetation Zone |
| Alp | 6.82 | 50.76 | 28.03 | 14.39 |
| Med | 10.67 | 51.00 | 31.33 | 7.00 |
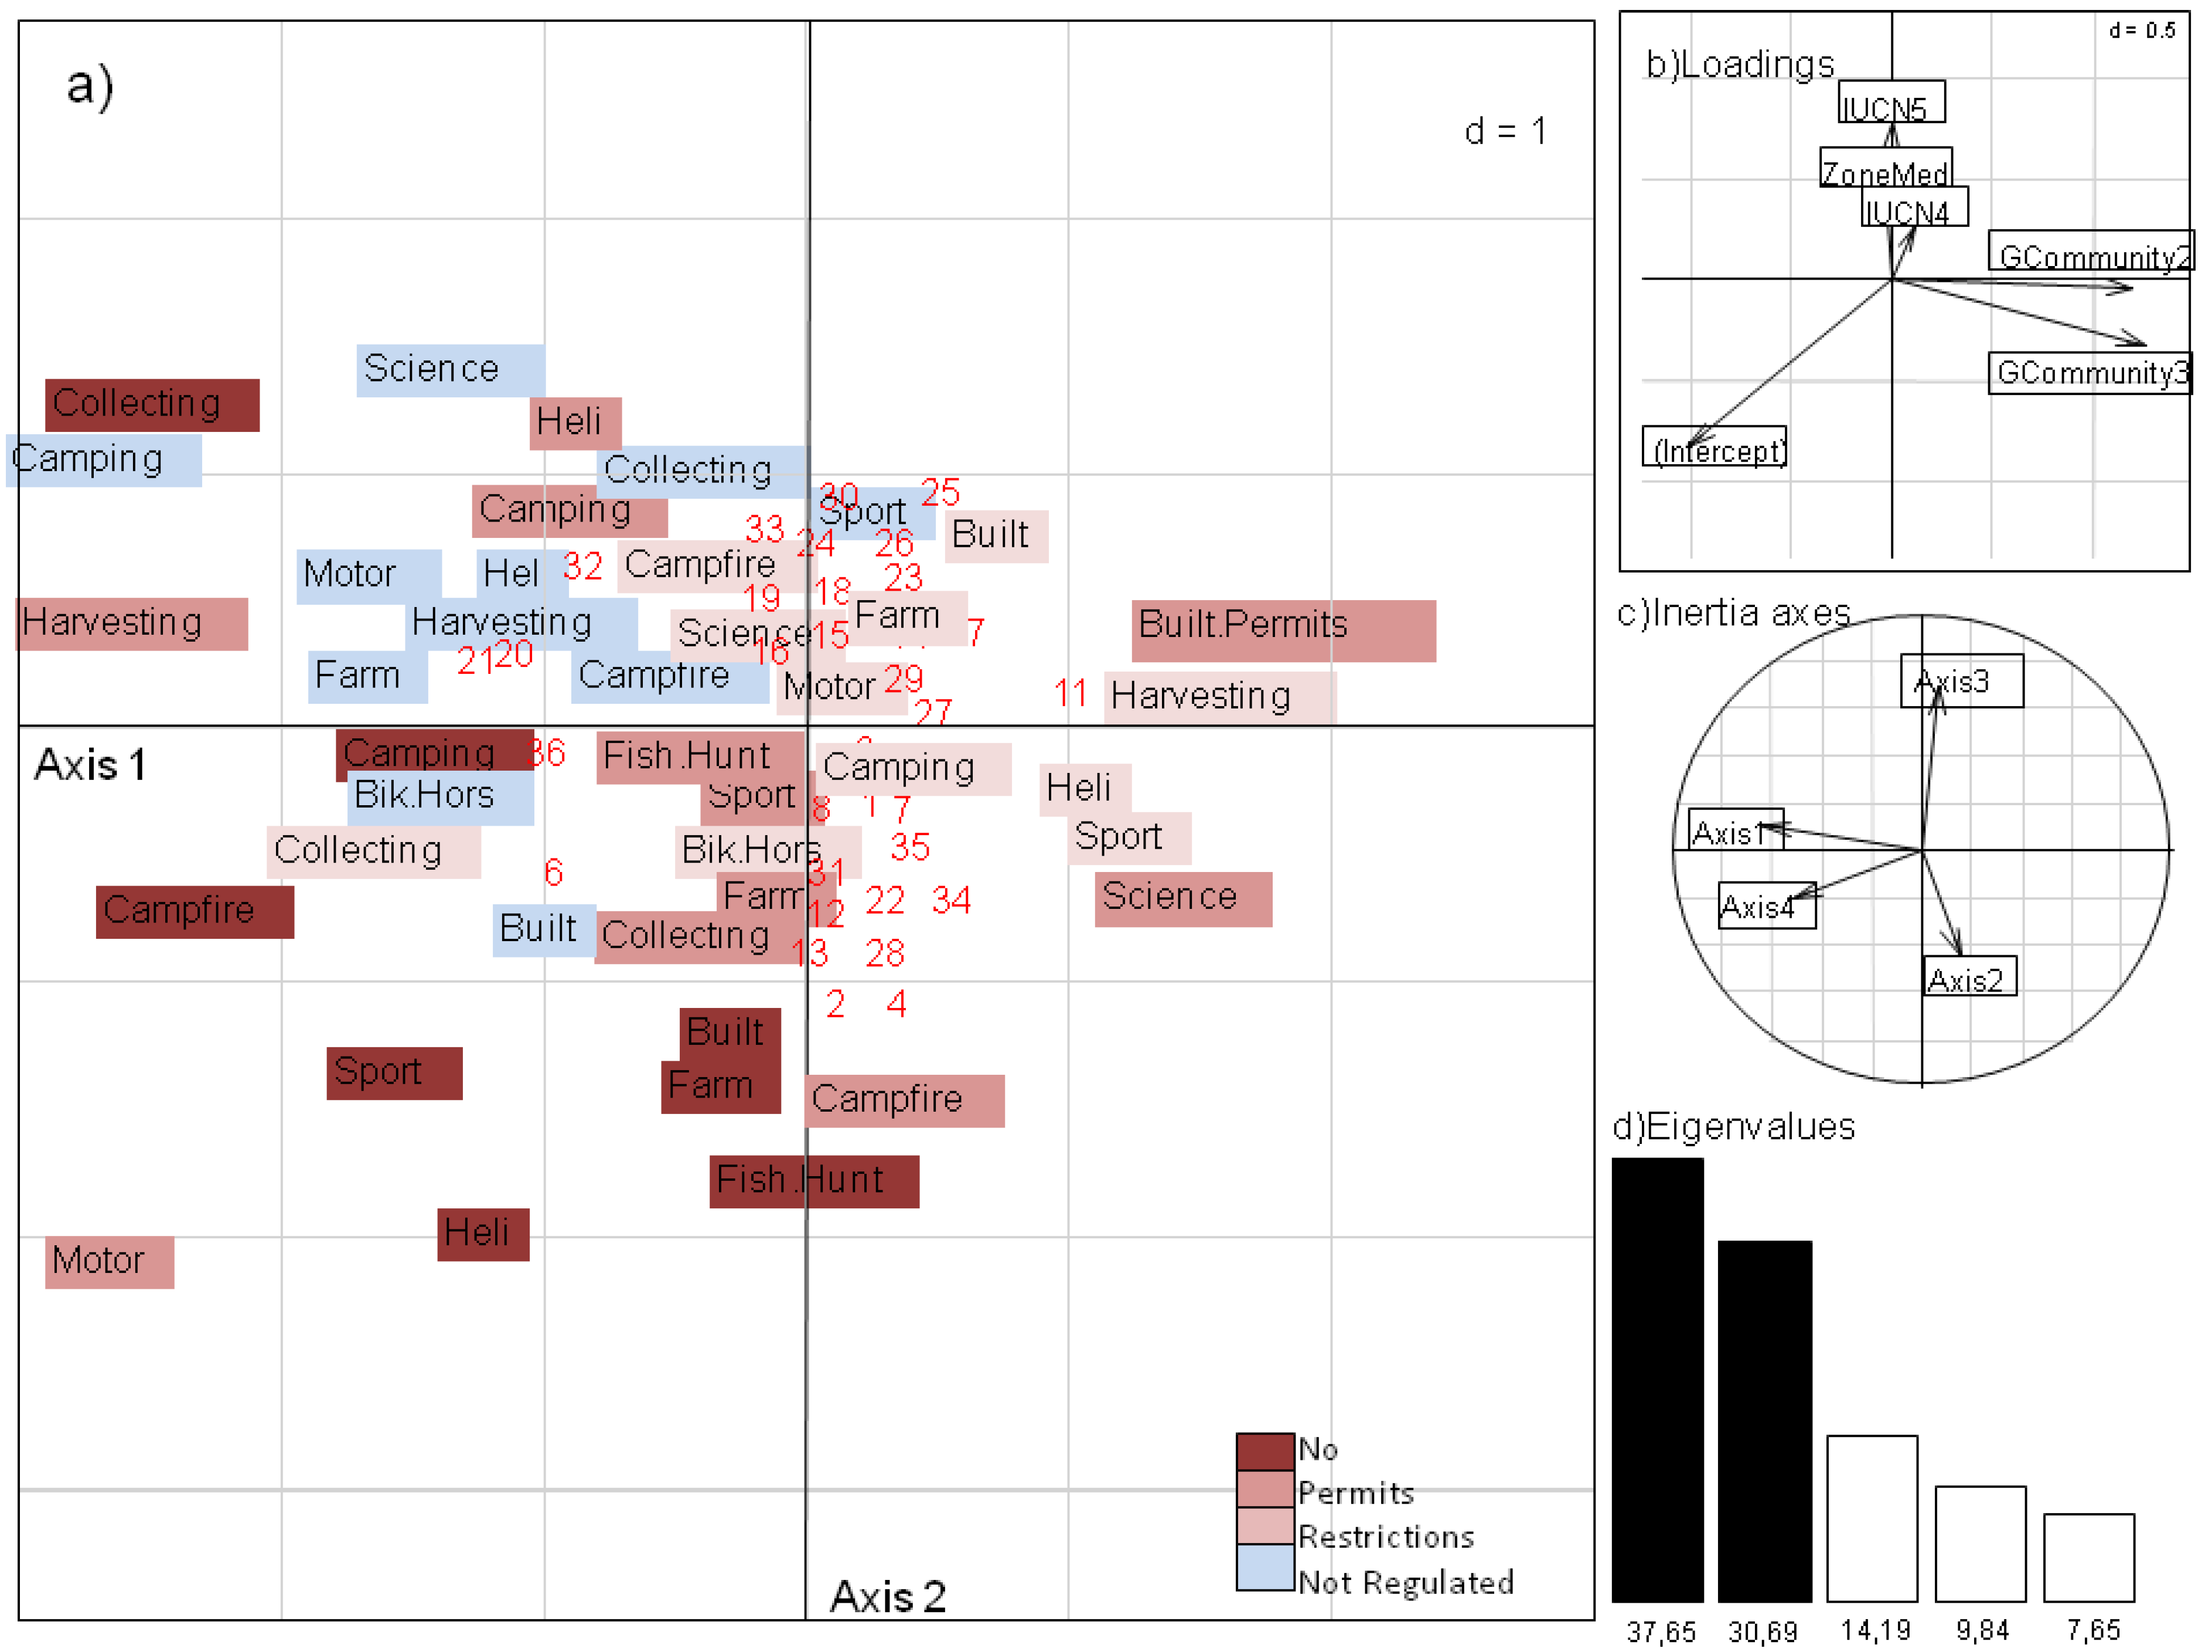
The additive effect of the IUCN, autonomous community and vegetation zone variables (
Figure 6) explains 21.28% of the variance (
p = 0.002; see
Table 2). The autonomous community (first axis, 37.65%) and the IUCN (second axis, 30.67%) account for most of the variance. The IUCN category II and the autonomous communities that first established their own laws tend to have a greater occurrence of high regulation levels (“Permits” and “No”) (
Table 3), but the diagram shows that this apparent tendency is due mainly to a few parks that are very restrictive. The first axis distinguishes parks that use “restrictions” as their major tool versus the parks that do not specify any regulations of typical recreational activities, such as making campfires, riding bikes and horses or driving motorized vehicles within the park boundaries (
Figure 6a and d). The second axis better reflects the general tendencies of IUCN category II parks to have stricter regulations, with higher frequencies of prohibited activities than category IV and V parks. The comparison with the unconstrained analysis shows approximately the same general pattern. However, most parks are aggregated around the origin, and there are no indications of a strong relationship between the regulations and the predictors considered.
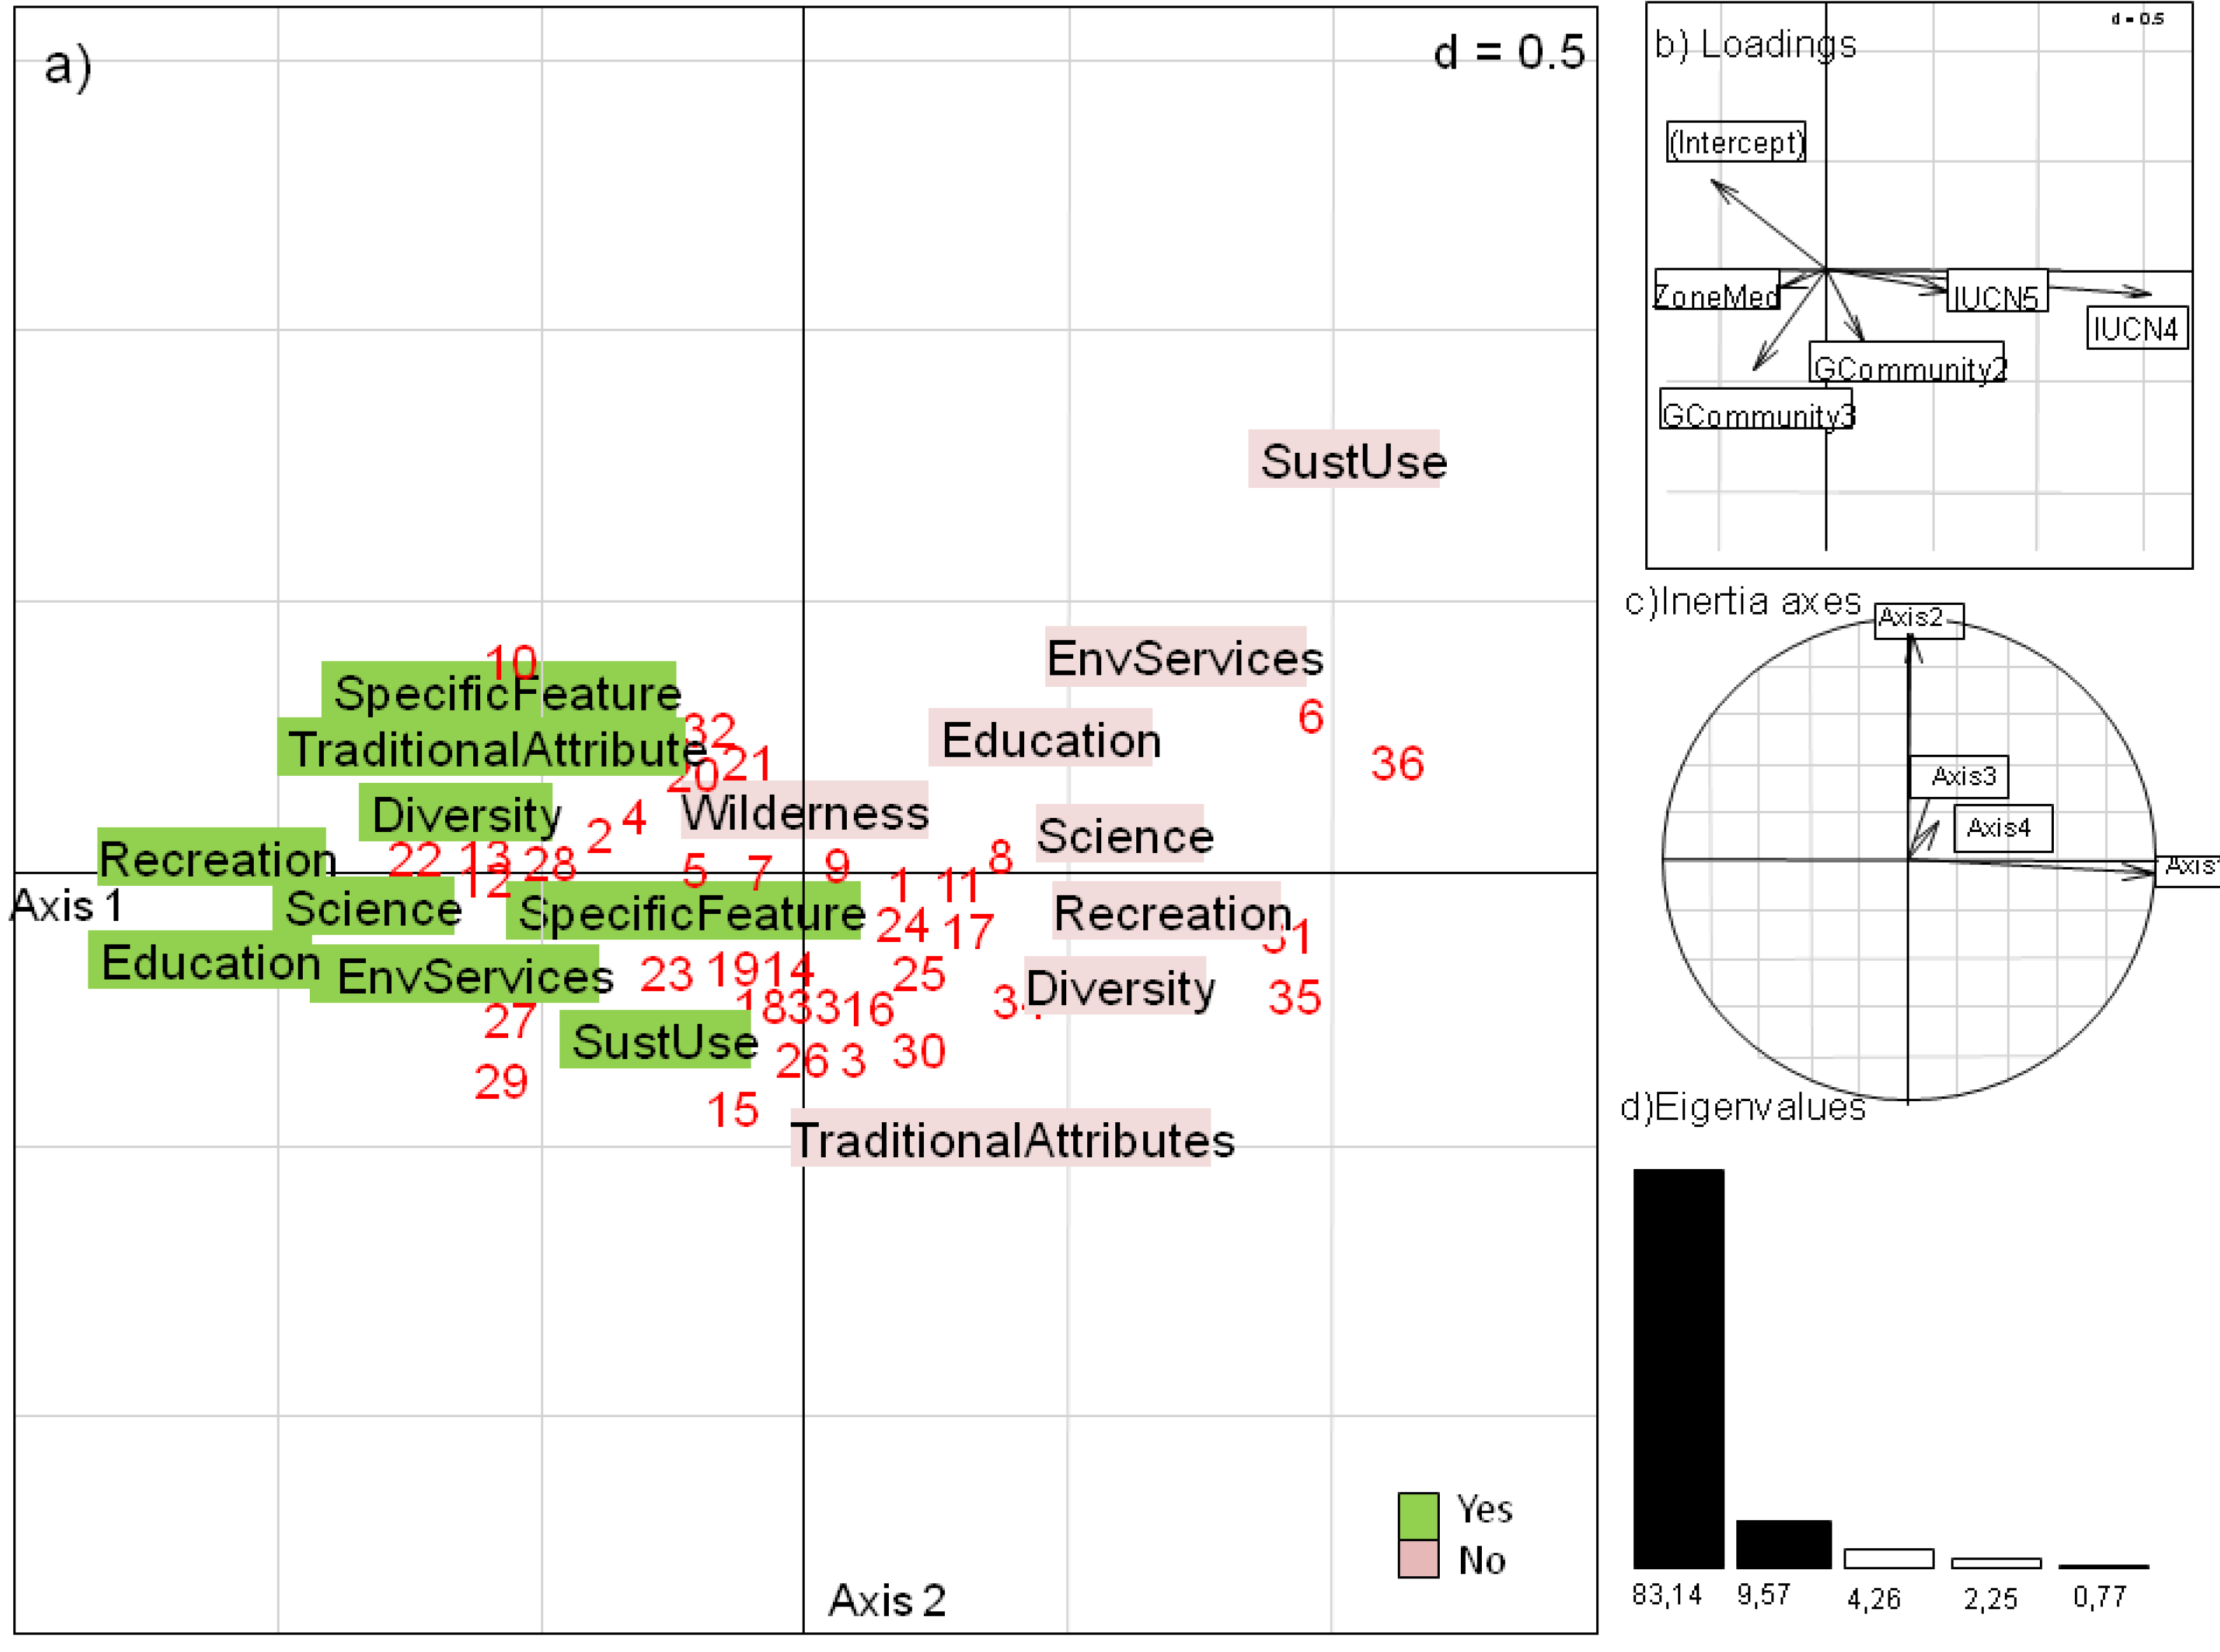
Figure 6.
CAiv ordination for management regulations.
(a) Management regulations and park covariance is shown along the two first dimensions. The numbers represent the PAs included in the analysis (see Appendix
Appendix A3). The labels show the scores of restriction levels (“No”, dark red; “Permits”, light red; “Restrictions”, pink; “Not regulated”, blue). Parks with the same scores along the axes are likely to have the same restriction levels;
(b) The linear combination of IUCN categories, autonomous communities and vegetation zones;
(c) Projection of the axes of the correspondence analysis into the CAiv. The first axis explains 37.65% of the variation, and the second axis explains 30.67% of the variation;
(d) Histogram of the eigenvalues.
3.3. Discussion
In this paper, we asked the question “What do the IUCN categories really protect?” Given the strong emphasis on PA coverage as a key measure of biodiversity conservation, this question needs to be answered. Our systematic study of policies in alpine PAs in Spain showed that many of the parks have vague aims and do not clearly state how biodiversity should be prioritized relative to the other aims of the parks. Although the aims of the Spanish PAs appear to be aligned with their IUCN categorizations, their management practices are at best weakly associated with these categories. It is unclear whether the strictest categories (I-IV) reflect greater restriction levels in practice, which calls the reliability of category I–IV PA coverage as a measure of biodiversity protection in Spain (as proposed by [
51]) into question. These categories do not provide effective guidance for managers about how to prioritize biodiversity among other goals. The lack of management plans in 50% of the PAs [
52] also strengthens the argument that biodiversity conservation in Spanish PAs is only weakly regulated. Despite the lack of conservation measures available for analysis to comprehensively answer our question, we share the concerns of scholars who claim that the IUCN designations do not necessarily reflect the stated intention of halting biodiversity loss. There is a need to develop policies regarding measures of biodiversity protection that reflect the international standards established by the IUCN classification system.
Clear management objectives play a crucial role in the adaptive management of ecosystems [
53]. Clear, measurable and agreed-upon objectives permit performance evaluation and the identification of uncertainties in management practices and increase the effectiveness of PA management. As in many other countries (e.g., [
2,
21]), the PAs in Spain have vague aims, and the tradeoffs made between contradictory aims are not clearly stated [
54]. Usually, biodiversity protection is mentioned together with other social, economic and political aims, without clear guidance for on-site management [
8,
14]. Recently developed evaluation frameworks such as SIAPA (System of Integrated Assessment for Protected Areas) permit the assessment of the effectiveness of a protected area even in the absence of available management aims and plans [
54]. For conservation purposes, however, on-site management requires both guidance to prioritize biodiversity among other competing aims and regulatory policies that allow this prioritization.
The IUCN categories provide a standard framework that permits comparisons among PAs [
14]. A study conducted by Dillon [
19] suggested that the Spanish 1989 Act was mostly consistent with the 1978 IUCN category system, but the results of our study show mismatches with the 1994 IUCN category system. Although there are several guidelines, there is no regulated procedure for category assignment [
55]. The lack of a regulated procedure for assigning IUCN categories makes evaluation more difficult due to the subjectivity of the authority that performs the assignment. A study conducted by Mierauskas [
56] in Lithuania analyzed the policy performance of categories Ia and Ib at the national level and showed that the PA system and management goals diverge substantially from the IUCN categories. He concluded that the aims and regulations defined in the law did not correspond to the IUCN-defined categories. Locke and Dearden [
51] argued that IUCN categories V and VI are often designated for human use rather than for biodiversity conservation. We also found that Spain is far from assigning international categories to Spanish PAs (a compromise adopted by the 2007 Act). According to EUROPARC-España [
52], only 30% of Spanish PAs have been assigned to an IUCN category, and category V is the most common designation.
Our study shows that for management regulations, the autonomous community explains as much of the variance as the IUCN category. In particular, autonomous communities that passed their laws at later dates regulate human activities in the park to larger extents. Such patterns are also evident in other countries because management is usually adapted to a larger system of PAs that are already in place [
13] rather than to the IUCN categories. The devolution of authority has become a core issue in recent years. The outcome of community-based management is mixed and often depends on a range of conditions other than the governing body [
57,
58,
59,
60,
61]. Our data demonstrate only a weak correlation between higher restriction levels and the strictest categories. Only 7.89% of the variance was explained by IUCN categories, which implies that there are no strong differences in management practices to reflect the IUCN categories. Our study results do not provide an analysis of the conservation performance of the parks, but the lack of a general pattern in management regulations (except for the weak effect of the date of establishment by autonomous communities) indicates that management practices are governed individually by the autonomous communities rather than being standardized according to international policies.
Our results should be interpreted with caution as they are based on a relatively small sample size of parks and a high number of regulations. Although no strong patterns were detected, there might be singular variables that could reflect differences between the parks. The activities with the greatest potential effects on biodiversity, such as farms, building, fishing, hunting, camping and campfires, are more frequently prohibited or limited to use by permit holders in the strictest categories of PAs (
Figure 5).
Management aims and regulations influence management actions and thus outputs and outcomes. The use of content analysis as a standardized method for the evaluation of aims and regulations allows comparisons between different countries and could provide a rough indicator of the extent of prioritization of biodiversity goals in PAs. The lack of appropriate management plans calls for the use of approaches other than policy performance evaluation for the analysis of PA effectiveness. Some studies have focused on the level of human disturbances in PAs, such as the level of naturalness of the area [
62,
63,
64,
65] or the ecological integrity of the system [
66,
67]. However, these analyses must be applied carefully because such evaluations have sometimes been criticized for confusing terms such as “naturalness”, “rarity” and “representativeness” and the use of overly broad concepts (e.g., genetic diversity, species diversity and ecosystem diversity) [
68,
69]. Furthermore, it is difficult to compare data obtained from monitoring populations or biodiversity between sites [
70]. In practice, the most common approaches to evaluation have been qualitative, involving the use of scorecards, expert judgments and experience-based knowledge [
70,
71,
72,
73]. These evaluation methods do not necessarily directly link conservation interventions and conservation effects, except through the experts’ own evaluations [
70]. According to scholars of evidence-based conservation, such experience-based knowledge is not sufficient, and more research is needed to assess conservation outcomes and the associated causes [
72,
74,
75]. Analyses of gaps in conservation policy could, in such cases, guide the selection of PAs that require in-depth analyses of conservation outcomes.
Management plans are crucial for the use of PA coverage as an indicator of the prioritization of biodiversity conservation because policy performance assessment is necessary for a complete evaluation of management effectiveness [
76]. In the current study, we selected only parks with management plans, thereby reducing the number of PAs available for our analysis. Although this approach could introduce some biases, the lack of management plans for many PAs strengthens our argument that there is a general lack of guidance for the prioritization of biodiversity versus other goals. Such analyses of management plans are not particularly costly and could identify potential weaknesses in the PA systems as well as the need for further system monitoring and evaluation.


