Article

Transport Pathways for Light Duty Vehicles: Towards a 2° Scenario

1
Institute of Transportation Studies, University of California Davis, 1605 Tilia Street, Suite 100, Davis, CA 95616, USA
2
Wuppertal Institute for Climate, Environment and Energy, Neue Promenade 6 10178 Berlin, Germany
3
International Energy Agency (IEA) 9, Rue de la Fédération F-75739, Paris Cedex 15, France
*
Author to whom correspondence should be addressed.
Sustainability 2013, 5(5), 1863-1874; https://doi.org/10.3390/su5051863
Submission received: 1 February 2013 / Revised: 19 March 2013 / Accepted: 3 April 2013 / Published: 29 April 2013
(This article belongs to the Special Issue Sustainable Cities)

Abstract

:
The transport sector is the second largest and one of the fastest growing energy end-use sectors, representing 24% of global energy-related greenhouse gas emissions. The International Energy Agency has developed scenarios for the transport sector within the overall concept of mitigation pathways that would be required to limit global warming to 2 °C. This paper builds on these scenarios and illustrates various passenger travel-related strategies for achieving a 2° transport scenario, in particular looking at how much technology improvement is needed in the light of different changes in travel and modal shares in OECD and non-OECD countries. It finds that an integrated approach using all feasible policy options is likely to deliver the required emission reductions at least cost, and that stronger travel-related measures result in significantly lower technological requirements.

1. Introduction

Transport currently accounts for about 14% of overall global greenhouse gas emissions and 24% of the global CO2 emissions from fossil fuel combustion [1]. To move onto a track that could limit the global temperature increase to 2 °C compared to pre-industrial levels, transport must decarbonize substantially over the coming decades [2,3]. The International Energy Agency (IEA) has developed a set of scenarios for its Energy Technology Perspectives (ETP) 2012 with the aim of providing policy advice on sustainable energy pathways toward 2050. The ETP scenarios deviate from a 6 °C scenario, which represents the baseline, and explores pathways toward a 2 °C stabilization target. The IEA suggests that CO2 emissions are likely to double by 2050 if current trends persist [1]. The ETP shows that the benefits of shifting towards a low-carbon economy outweigh the costs, stating that a “sustainable energy system will require USD 140 trillion in investments to 2050 but would generate undiscounted net savings of more than USD 60 trillion” from total fuel and other savings of about USD 200 trillion [1]. For transport, the incremental investments for advanced powertrains over the next four decades amount to 65 trillion (out of over USD 500 trillion in overall expenditures for the whole transport sector), resulting in net savings of over USD 50 trillion in reduced vehicle purchases, needed infrastructure and fuel costs. The additional co-benefits generated by more sustainable transport, such as improved safety and air quality and reduced travel time are not included in this calculation, which would make the cost-effectiveness of a shift towards sustainable transport even more compelling. This paper aims to test some of the ETP 2012 assumptions and will explore additional scenarios. In particular, it identifies the impacts of varying the contribution of different mitigation options for transport and takes some initial steps toward quantifying the cost impacts of different approaches.

2. Energy Technology Perspectives 2012: Scenarios and Assumptions

This section will explore some of the aspects behind the assumptions for the ETP 2012 scenarios and disaggregate the projected developments in OECD and non-OECD countries.

2.1. Avoid, Shift and Improve in the ETP 2012

In IEA ETP 2012, the 2-degree scenario (2DS) for transport is built upon a range of measures and changes in transport between 2009 and 2050 that reaches a CO2 target consistent with a 2 °C stabilization pathway. A second scenario has also been developed for the ETP 2012, a 4° scenario (4DS), which assumes only a minor deviation from the baseline.
The ETP scenarios adopt the Avoid/Shift/Improve or A/S/I approach to decompose the assumed areas of emission reduction measures (Figure 1): Avoid (reduce travel Activity or reduce growth in activity) [3]; Shift (change travel Structure through shifts to different modes of travel), and Improve (lower vehicle energy Intensity and reduce Fuel carbon intensity). As the IEA ETP 2012 adopted this A/S/I classification, we will continue with this approach here.
Figure 1. Avoid/Shift/Improve (ASI) classification.
Sustainability 05 01863 g001
The underlying assumptions behind the Avoid/Shift/Improve (A/S/I) approach in the ETP 2012 2DS can be summarized as follows:
Improve (intensity/fuel): Most types of vehicles and modes have the potential for efficiency improvements in the range of 30–50% between 2010 and 2050; light-duty vehicles can achieve 50% through incremental improvements and adoption of electric hybridization (without considering plug-in vehicles). Advanced technologies such as plug-in electric and hydrogen vehicles could achieve more than 50% market share of new light duty vehicles and medium duty trucks by 2050; advanced, low-carbon biofuels may provide 30% of all transport fuel by 2050.
Avoid/Shift: by 2050, passenger-kilometres of travel in cars grow by 25% less in the 2° scenario than in 4° scenario (4DS). Around half of this reduction is shifted to more efficient modes (public transport, walking and cycling) and half is avoided by improved land-use and urban form that reduce trip-lengths.
As one of the key figures for transport in the ETP 2012 (Figure 2) indicates, compared to a baseline (6 °C) and a 4 °C scenario where well-to-wheel CO2-eq emissions rise from about 8 Gt in 2009 to over 14 Gt in 2050, in the 2° scenario emissions peak at about 8.5 Gt in 2020, and then drop back to about 6 Gt by 2050. Reductions are achieved through a combination of changes in travel patterns (Avoid/Shift), and more efficient vehicles and low carbon fuels (Improve). However, as stated in ETP, “Avoid/Shift case contribution to lowering GHG emissions is modest when low-carbon technologies are widely implemented” [1].
Figure 2. Energy Technology Perspectives (ETP) results for global well-to-wheel greenhouse gas emissions mitigation potential from the transport sector for a 4° and a 2° scenario.
Sustainability 05 01863 g002
One problem with depicting CO2 reductions in a wedge diagram is that improvements of one type (such as efficiency) leave less CO2 to reduce via other means (such as modal shift), and allocation of CO2 reductions in a combined scenario can be misleading. The avoid/shift reductions in Figure 2 appear small but this is partly due to the strong decarbonisation in all vehicle types, which (at least after 2030) leave relatively small possible reductions from modal shift. If strong decarbonisation of the transport sector occurs as in the 2DS, there is little incentive to undertake modal shift policies for purposes of CO2 reduction, as all modes move to a similar well-to-wheel CO2 emissions intensity (WTW gCO2/pkm).
While from a pure climate change mitigation perspective vehicle efficiency and low-carbon fuels may provide the biggest potential, this does not fully reflect a broader sustainable transport perspective. A multimodal, low-carbon transport sector, which also aims to manage growth in travel demand and modal split may yield important benefits in air quality, traffic congestion, safety and overall societal mobility—and thus a higher level of socio-economic co-benefits and may also be more cost effective [4,5]. This paper focuses on CO2 but this broader perspective must be kept in mind when assessing effectiveness of mitigation options.
A number of transport sector mitigation measures rely on well-established technologies and practices, e.g., shift to public and non-motorized transport and efficiency improvements of internal combustion engines. However, efficiency gains beyond a certain level require major technology shifts towards electric powertrains and/or hydrogen, which are associated with substantial uncertainties. Associated with even larger uncertainties are the assumptions on life-cycle carbon emission reductions from biofuels.
The primary goal of this paper is to show the relationship between the Improve elements with the Avoid and Shift strategies in the ETP 2DS scenario. Mainly for purposes of simplicity, the focus in the following analysis is kept on light-duty vehicles (LDVs). The private vehicle is by far the most energy intensive personal land transport mode; the importance of vehicle fuel economy for transport’s overall productivity is heavily interrelated with overall travel patterns and modal choices (e.g., access to high quality and reliable public transport services). Hence the efficiency and fuels of LDV travel and the overall travel demand for light-duty vehicles provide useful indicators for the biggest source of transport CO2 emissions and land transport energy efficiency more generally.

2.2. Regional Differences in the Scenarios for OECD and Non-OECD Countries

The scenarios developed for this paper disaggregate the ETP 2012 scenarios further to highlight the relationship between different CO2 mitigation actions. Starting with the IEA ETP 2012 2-degree (2DS) scenario, we break out key A/S/I details and then create two alternative cases, principally varying the contribution from travel demand and modal share (Avoid/Shift) on the one hand, and fuel economy and the carbon intensity of energy carriers (both Improve options) on the other hand. In each case we reach the same overall CO2 emission reduction target for 2050, using the same underlying conditions (e.g., income, population growth). Thus these cases also have the same carbon emissions per capita.
Baseline travel growth and the resulting CO2 reduction potentials and trajectories for light duty vehicles differ substantially between OECD and non-OECD countries. Over the coming decades most growth in travel demand will come from non-OECD countries, although vehicle travel per capita in these countries will remain at a substantially below the OECD average even in 2050. This rapid growth of travel demand in non-OECD is already evident when looking at the developments throughout the past decade (Figure 3). Although the overall level of passenger travel (particularly car travel) is far higher in OECD than in non-OECD countries, travel is growing faster in non-OECD, particularly in Asia.
Figure 3. Modal distribution of total motorized passenger transport by region in 2000 and 2010.
Sustainability 05 01863 g003
IEA, 2012, Mobility Model (MoMo) database.
Figure 3 also shows that modal share varies greatly between world regions, with light duty vehicles dominating personal transport in OECD countries, while public transport is still the most important travel mode in Asia, Latin America and Africa, even though its share is shrinking. Considering the rapid growth in travel demand, the key challenge for most developing countries is to sustain the share of low-carbon transport modes, while ensuring high levels of efficiency for the new vehicles entering the fleet. For OECD countries, vehicle fuel efficiency along with shifts towards public- and non-motorized transport are key [6,7].
Looking out to 2050, Figure 4 shows the passenger travel projection for light-duty vehicles in the ETP 2012 two-degree scenario (2DS) and also the ETP four-degree scenario (4DS). As shown, there is a large difference in vehicle travel between these scenarios, but an even bigger difference between OECD and non-OECD countries in either scenario. The United States is broken out (also included in the OECD average) to highlight the required changes the country with the highest level of car-travel. The US average is over 12,000 km per person per year in 2010, while the OECD average travel is only about 7,000 km per capita and travel in non-OECD is currently below 1,000 km per person per year.
Figure 4. Vehicle kilometres travelled (VKT) per capita in light-duty vehicles by region and scenario, 2010–2050 (IEA data).
Sustainability 05 01863 g004
The key point of Figure 4 is to show that in the 2DS case, car travel grows far less in both OECD and non-OECD countries, and in fact declines on a per-capita basis over most of the projection period. This reflects measures to cut travel growth and shift some of it away from cars toward public transport, walking and cycling. Even though the VKT per capita is set to substantially decrease in most OECD countries, global population is still set to increase to more than 9 billion by 2050 and travel demand growth in non-OECD countries is surging.
The VKT reductions in OECD countries and the reduced growth in non-OECD countries in Figure 4 appear to be substantial, yet this seems to have only a small influence on the overall CO2 emission reductions in 2050, as depicted in the ETP 2012 wedge diagram (Figure 2).

3. Disentangling the ETP 2012 Scenarios: The Roles of Avoid/Shift and Improve Measures in OECD and Non-OECD Countries

This section will build on the ETP 2012 scenario and will explore the results of the two sensitivity cases that have been developed to show the relevance of the required fuel switch and efficiency improvements under different travel growth and modal share projections in OECD and non-OECD countries. This will help highlighting the complementarity of Avoid/Shift and Improve measures for climate change mitigation strategies over the coming decades.

3.1. Three Different Pathways towards a 2° Goal: Two Sensitivity Cases Building on the ETP 2012 2° Scenario

Based on the ETP 2012 2° scenario (Case 1, ETP 2012 2DS) two sensitivity cases have been developed (Case 2, less avoid/shift, more vehicle/fuel improve, and Case 3, more avoid/shift, less vehicle/fuel improve) to disentangle the required fuel switch and efficiency gains changes in travel and determining the necessary changes in vehicles/fuels to reach a given CO2 reduction target. For all three cases constant assumptions on population and economic growth have been used. This sensitivity analysis has been developed for OECD and non-OECD countries to highlight the different development pathways.
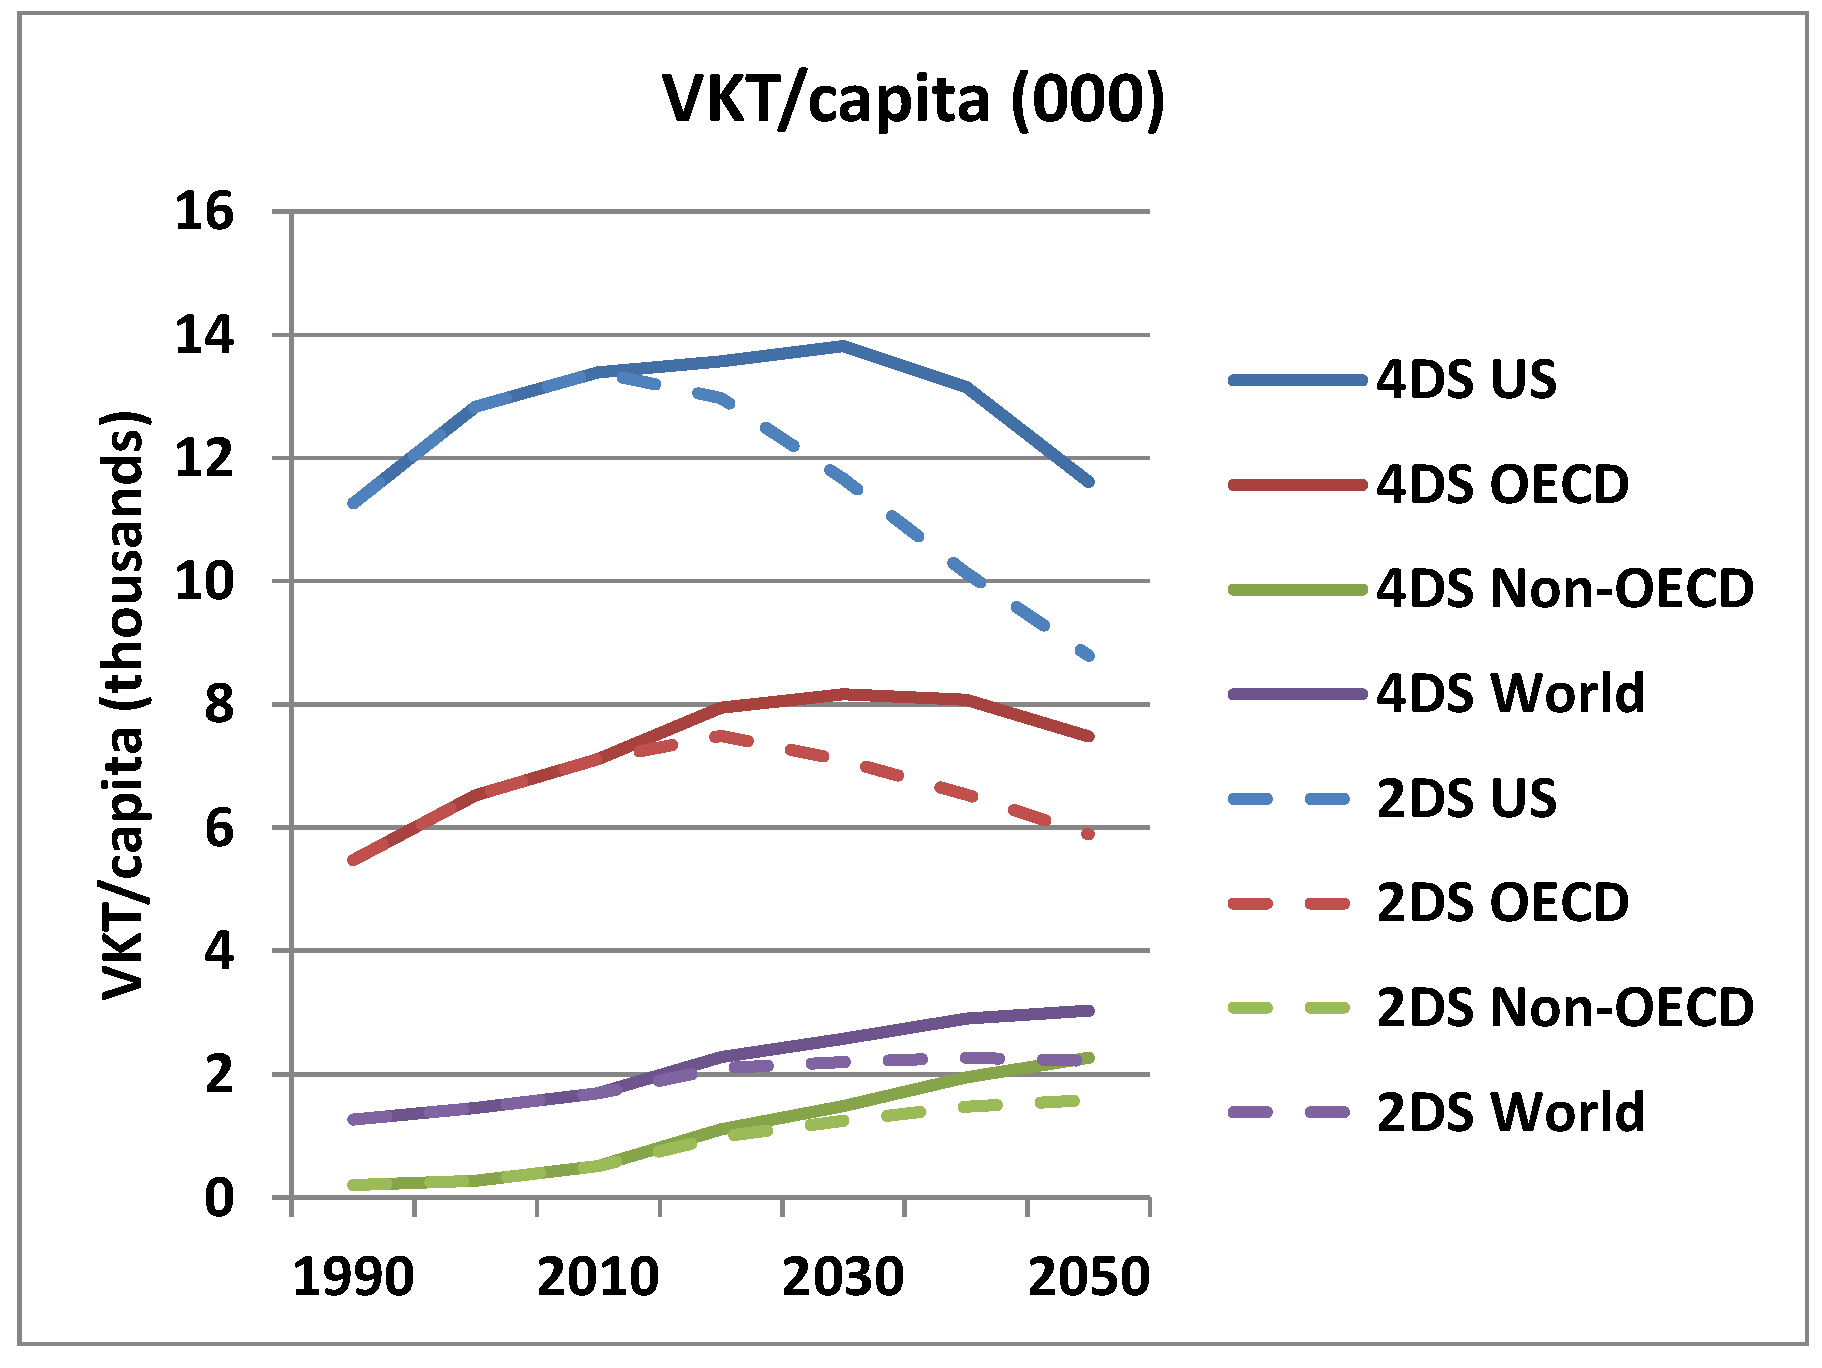
In the OECD countries the ETP 2012 2DS projection sees a 17% reduction in light-duty vehicle travel per capita between 2010 and 2050 (Figure 5). This assumes that even though the population grows, total travel in industrialized countries is decreasing by 4%, which would be a substantial deviation from the current path. This change in travel is accompanied by a 45% average improvement in vehicle efficiency (reduction in energy/km) to achieve a 47% reduction in energy use. To achieve the desired reduction of 73% (The emission reduction target of 73% has been adopted for the ETP 2012 to be in line with an emission reduction pathway for a 2° stabilization scenario as suggested by the IPCC [8].) in light vehicle well to wheel CO2 emissions, the ETP 2DS case further assumes a 50% reduction in the carbon intensity of the energy (via shifts to electricity, hydrogen, and biofuels).
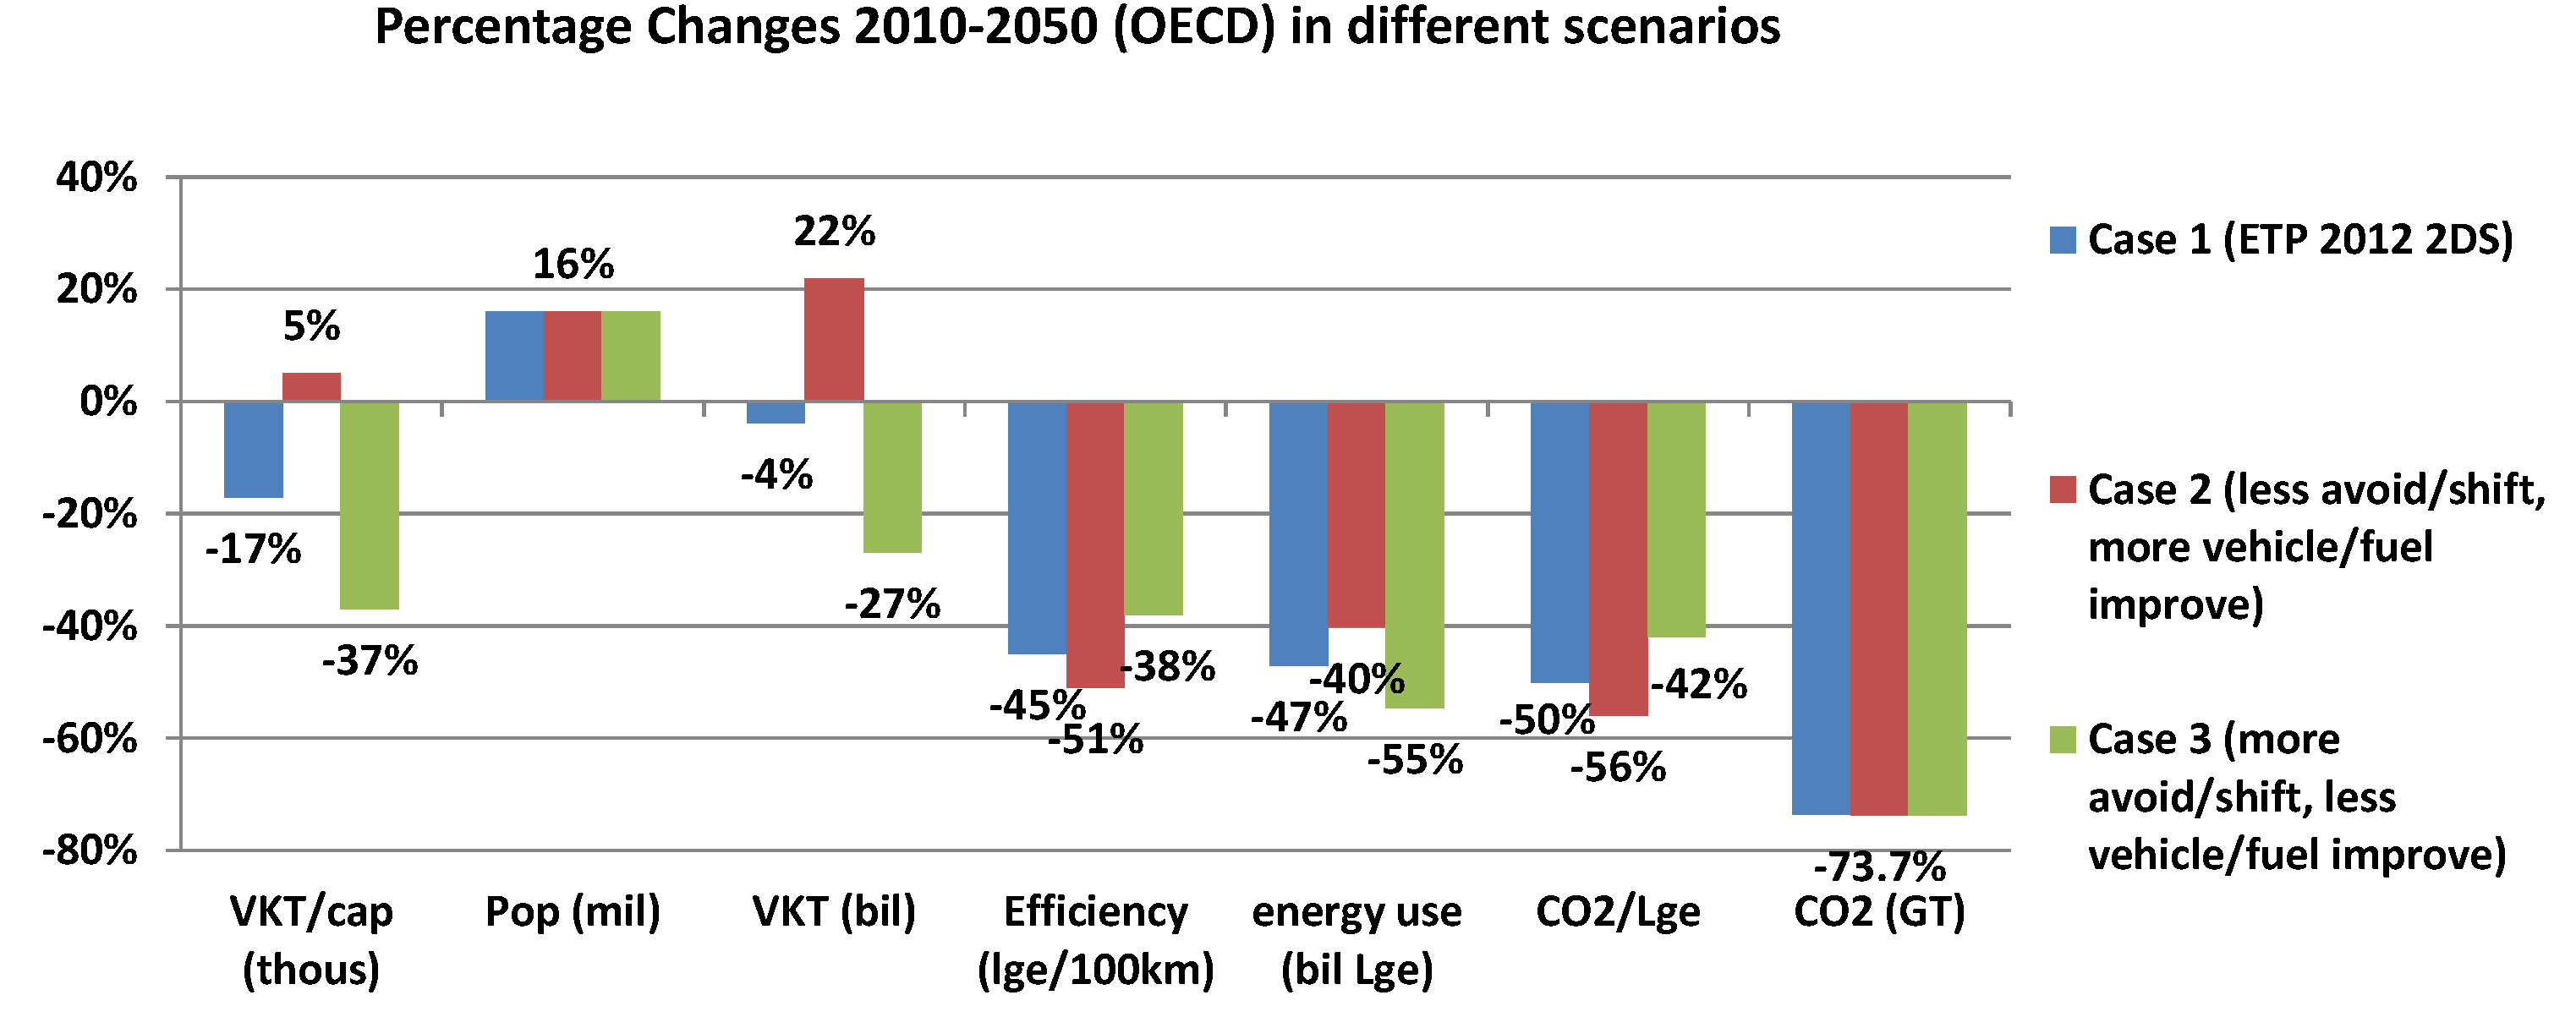
The sensitivity case 2 shows what would happen if the reality with regard to reduced travel and modal shift (avoid/shift) fall short of the assumptions made in the ETP 2DS case. The Case 2 uses the travel projections assumed for the ETP 4° scenario, which are a 5% growth per capita and 22% overall between 2010 and 2050. Under these conditions, additional efficiency gains and fuel carbon reductions are required to meet the CO2 emission reduction target of 73% for the light vehicle fleet in OECD countries. As shown in Figure 5, this could be achieved by improving on-road vehicle efficiency (lower energy/km) by 51% instead of 45% over the 40-year period, combined with reducing fuel carbon intensity (emissions per unit energy) by a similar additional proportion, by 56% instead of 50%.
Figure 5. Light vehicle fleet scenarios until 2050 in OECD countries.
Sustainability 05 01863 g005
The other sensitivity case shows what happens if car travel per capita could be reduced by even more than the 2DS case. Case 3 shows the effects of additional reductions leading to a 37% drop of car travel between 2010 and 2050. While this would require very strong policies and investments to reduce travel and shift towards public transport and non-motorized transport, efficiency would only need to improve by 38% instead of 45% and a 42% drop in fuel carbon intensity instead of 50% compared to the 2DS case.
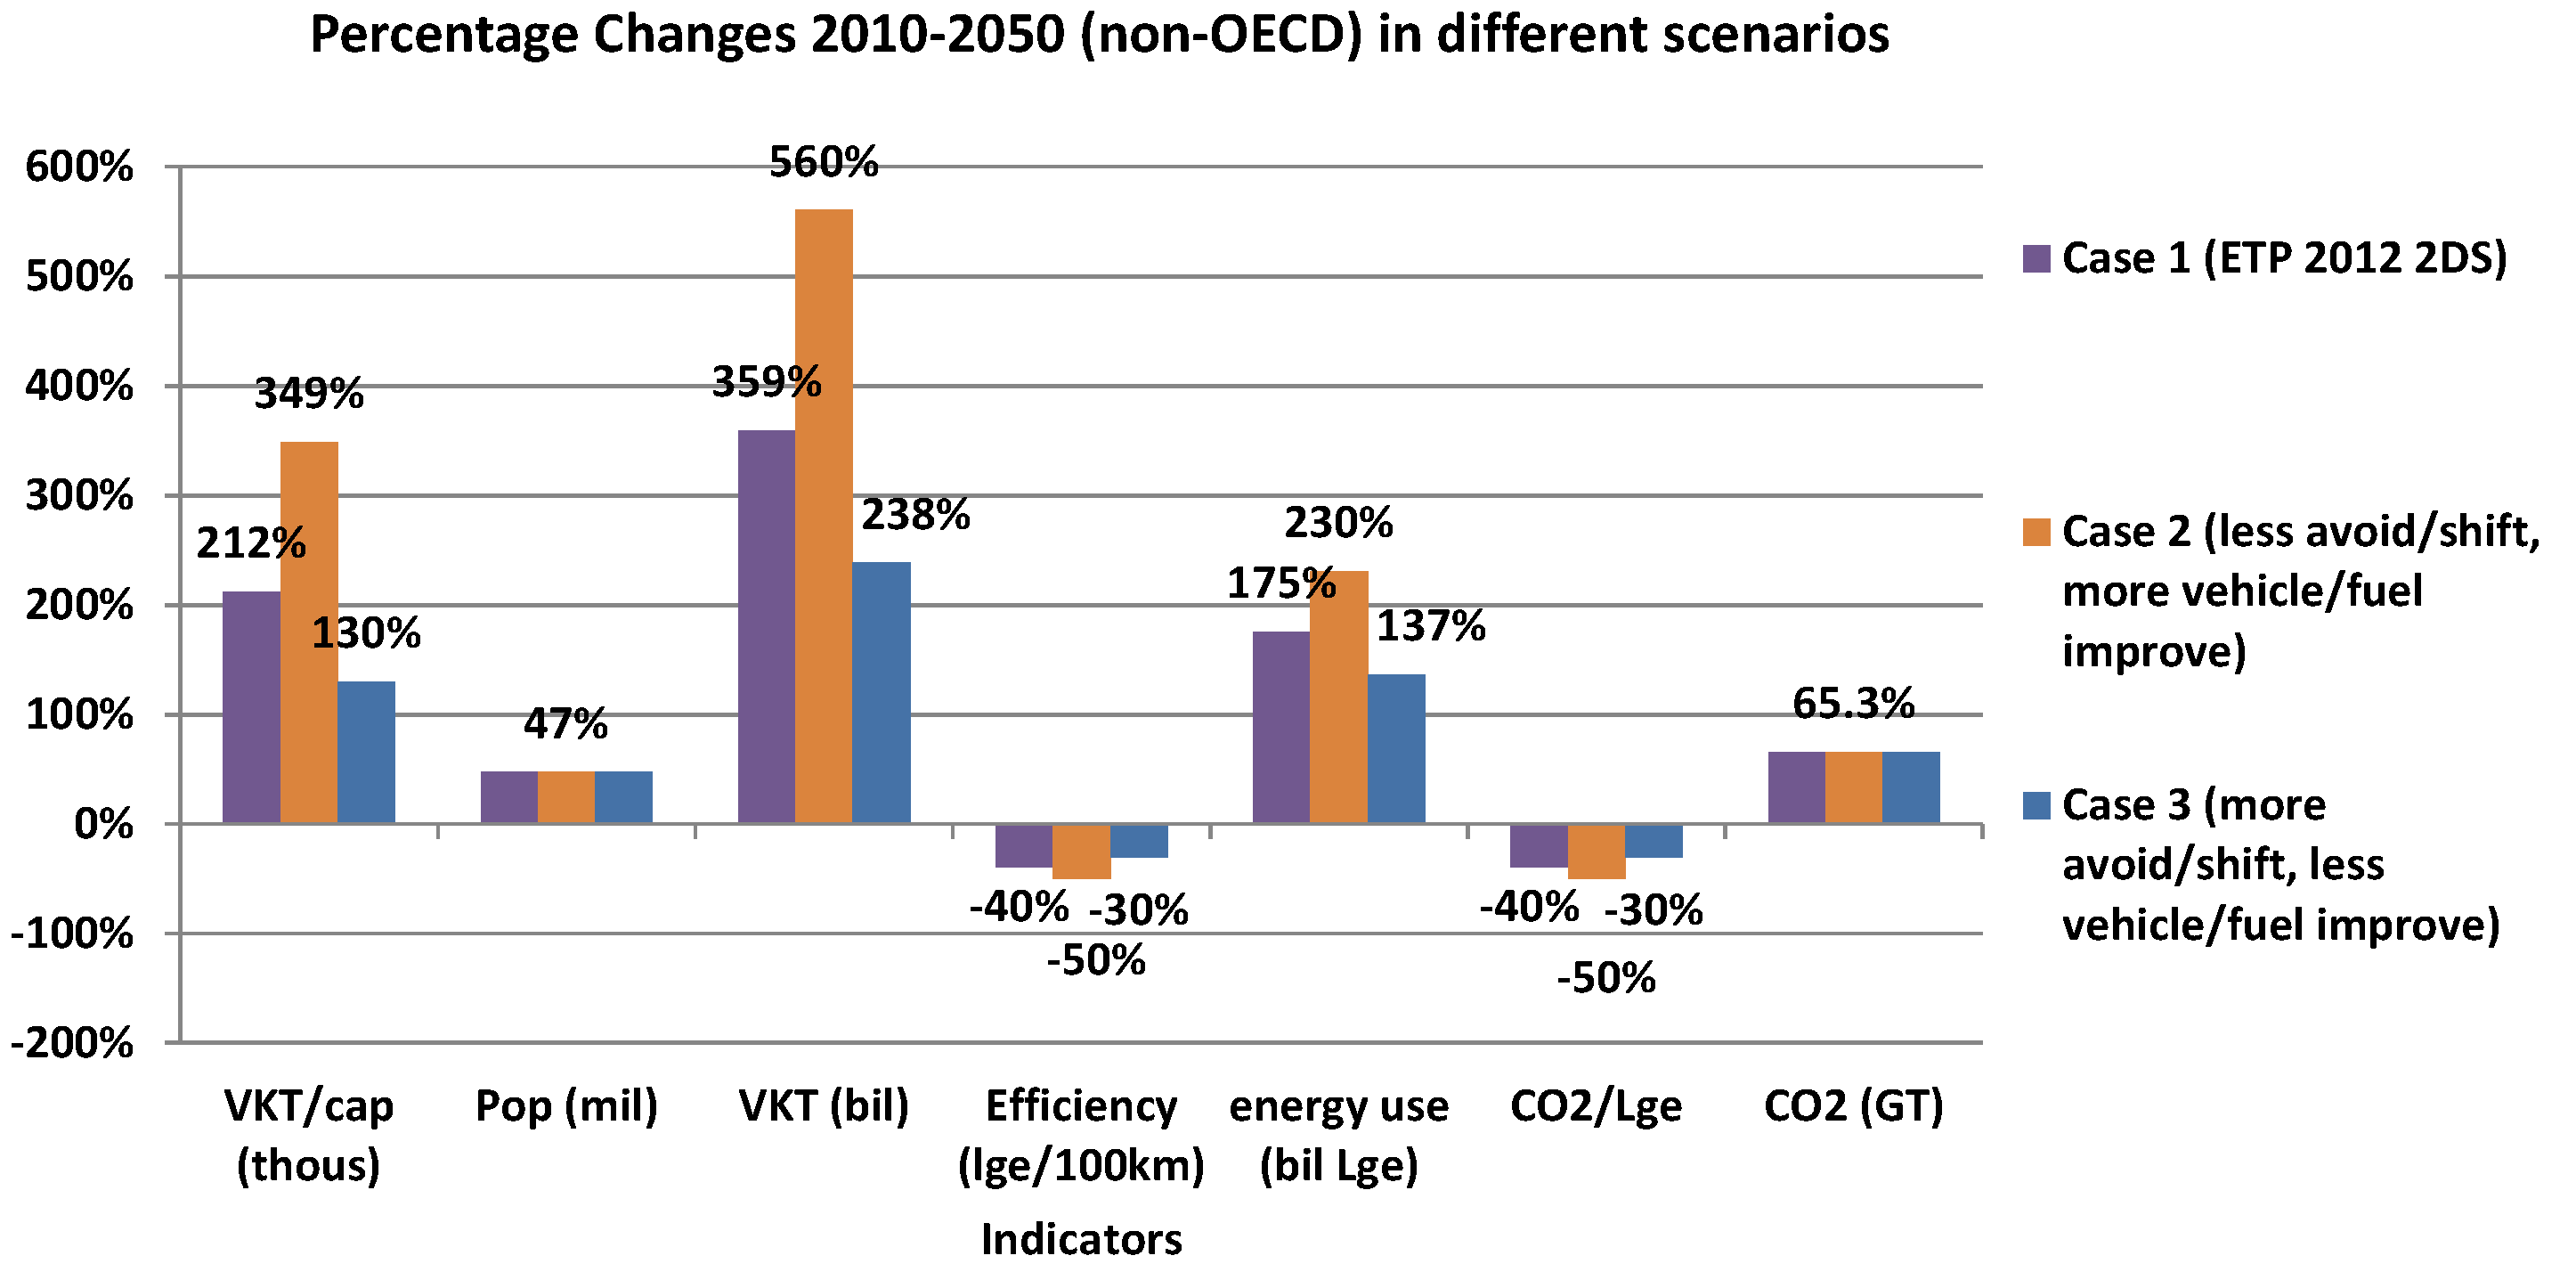
Figure 6 shows these same cases for non-OECD countries. The results are similar despite a very different underlying situation. In developing and emerging countries, light-vehicle travel per capita triples in 2DS case while fuel efficiency and carbon intensity both improve by 40%, leading to a net increase in CO2 of 65% by 2050. Considering that emissions in non-OECD countries would more than tripling without any major additional mitigation strategies, this would be a substantial reduction from the baseline. The two sensitivity cases aim to achieve the same target via different approaches. Case 2 allows for travel growth, which means that efficiency and fuel carbon will have to improve by 50% instead of 40%. The lower growth in car travel achieved through sustained high levels of public and non-motorized transport in Case 3 requires lower efficiency and fuel switch, at 30% instead of 40%.
Figure 6. Light vehicle fleet scenarios until 2050 in non-OECD countries.
Sustainability 05 01863 g006
For both OECD and non-OECD countries, not achieving the car travel paths used for the 2DS case, would mean that vehicle fuel efficiency and fuel carbon intensity will have to be improved to levels that may be challenging, both from a technology and cost-effectiveness perspective [9]. However, the modal shifts and travel reductions assumed in Case 3 may be equally challenging, which clearly indicates that an integrated approach will be required that combines avoid, shift and improve measures.

3.2. The Implications of Different Travel Demand and Modal Share Assumptions on Vehicle Technologies and Fuels

Considerable analysis is needed of policy implications, private and social costs, and the wide range of impacts and sustainability implications of different pathways. However, the high level assessment of the three cases compared in this paper already provides some interesting insights on the relationship of avoid, shift and improve measures.
Comparing cases 2 and 3 (the high travel and low car travel sensitivity cases), the requirement for additional fuel efficiency improvements and reductions in vehicle stock energy intensity as explored in the previous section reach levels where cost-effectiveness may become challenging. The significant additional amount of efficiency gains of 13% in OECD countries and even 20% in non-OECD countries represents a range of fuel economy improvements that may become steadily more difficult and costlier. A number of studies have developed cost curves for light duty vehicle fuel economy (e.g., NRC, 2010, ICCT, 2011), summarized by the IEA in its Fuel Economy Roadmap [9]. It finds that, if undertaken today, it would cost an extra €4,000 (USD5,000) per vehicle to move from a 45% to a 60% improvement, compared to around €2,000 to reach the initial 45% improvement. This reflects the upward concavity of the cost curve and increasing marginal cost of technologies to improve fuel economy. The technologies that are deployed start with relatively low cost changes such as 4-valve HDI fuel injection, and eventually move toward adoption of hybridization and expensive light-weight materials. Efficiency improvements can also be achieved through a shift to plug-in vehicles (battery-electric vehicles, plug-in hybrid electric vehicles), likely to be even more efficient than advanced hybrids when running on electricity and electric motors. But the costs of these vehicles will be even higher than advanced conventional vehicles and hybrids, at least in the near term.
It should be noted, however, that over time the costs of advanced efficiency technologies and plug-in technologies will likely decrease, given technology advances and economies of scale, and by 2030 could be well less than the costs for current changes [9,10]. None-the-less, the cost of marginal efficiency improvements between 40 and 60% may remain be over €3,000 (USD4,000) in the near-medium term [9,10,11]. This is likely to hold for both OECD and non-OECD, since the technologies are likely to be similar.
The CO2 intensity of fuels can be improved through a combination of uptake of plug-in vehicles, fuel cell vehicles and their new fuels, electricity and hydrogen respectively [1,6]. Advanced biofuels can also play an important role in reducing average fuel carbon intensity. However, all of these technologies and fuels are quite expensive today and associated with a number of uncertainties, which may help to explain why they are not yet fully commercial, though sales of electric vehicles have increased rapidly in the past two years [1]. Attempting to estimate how the cost of deploying these new vehicles and fuels will change over the next two decades, and in particular how costs may change in the range of sales that reduces average CO2 intensity from 40% to 60%, is quite speculative [9,10,11]. Hence, strategies that heavily rely on advanced technologies and fuels contain a higher level of risks and uncertainties.
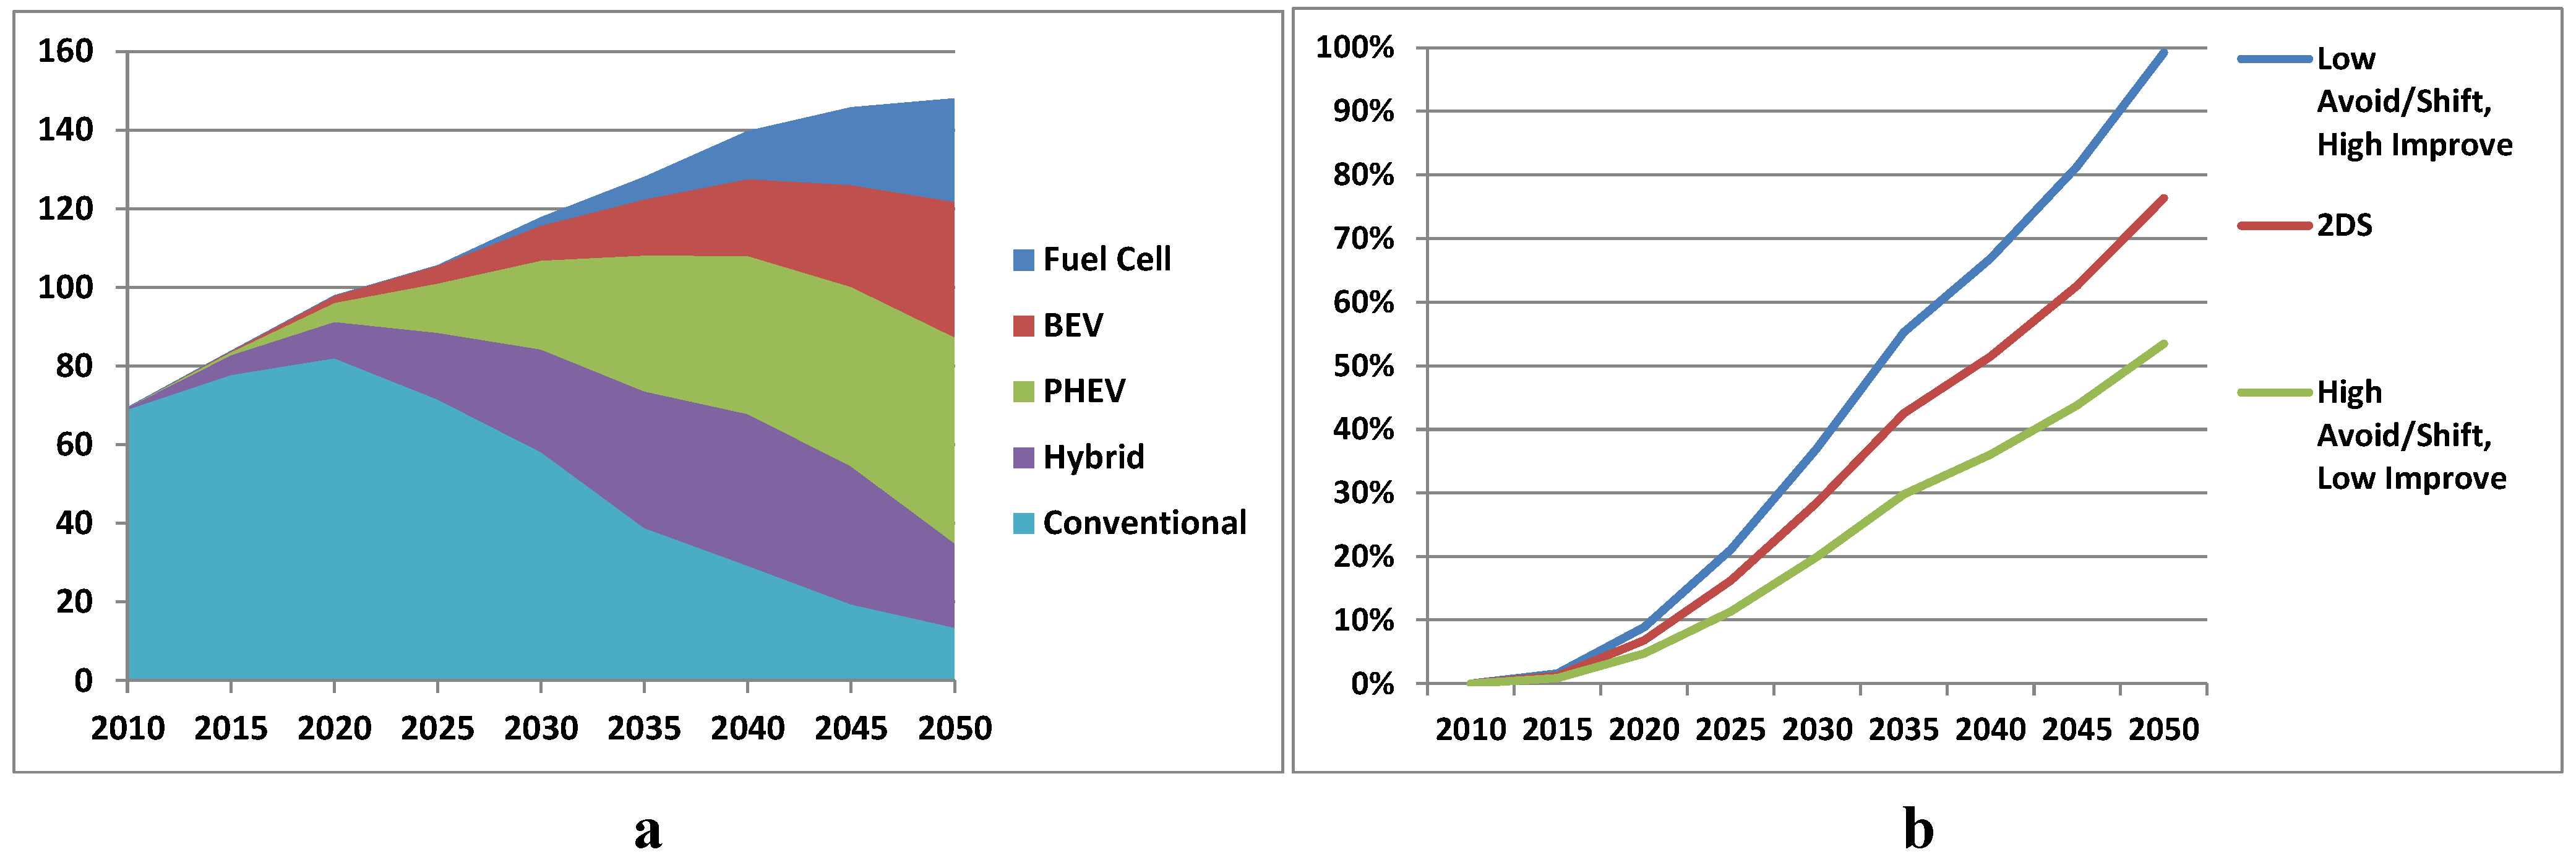
Figure 7a,b illustrate the changes in sales and market shares of advanced technology vehicles that occur in 2DS case compared to the two sensitivity cases developed (Low Avoid/Shift, and High Avoid/Shift) through 2050. It shows how the sales share of these technologies would need to change in the higher and lower car travel cases to meet the combined CO2 emission reduction target for both, OECD and non-OECD countries. In the ETP 2DS, new technology vehicles such as plug-in hybrid (PHEV), battery electric vehicle (BEV) and fuel cell vehicles (FCEV) will have to increase their market shares very rapidly after 2030 to achieve a high combined share by 2050 and provide both efficiency improvements and fuel carbon reductions (Figure 7a). Figure 7b shows these three plug-in vehicle types together in the three different cases; in the 2DS it can be seen that these reach over 75% market share in 2050, and even by 2035 they reach about 45% of global light-duty vehicles (LDV) sales. In the Low and High Avoid/Shift cases, the sales share ranges from 50% to 100% of new LDVs in 2050, and 30% to 60% in 2035. These are very significant differences, which suggests that the Low Avoid/Shift and High Improve case would require much faster market penetration rates, while the and High Avoid/Shift and Low Improve case would compensate for slower progress in technology uptake.
Figure 7. New technology light-duty vehicle (LDV) sales in 2-degree scenario (2DS) (a) and combined (battery electric vehicle (BEV) + plug-in hybrid vehicle (PHEV) + Fuel cell) sales share in three cases (b).
Sustainability 05 01863 g007
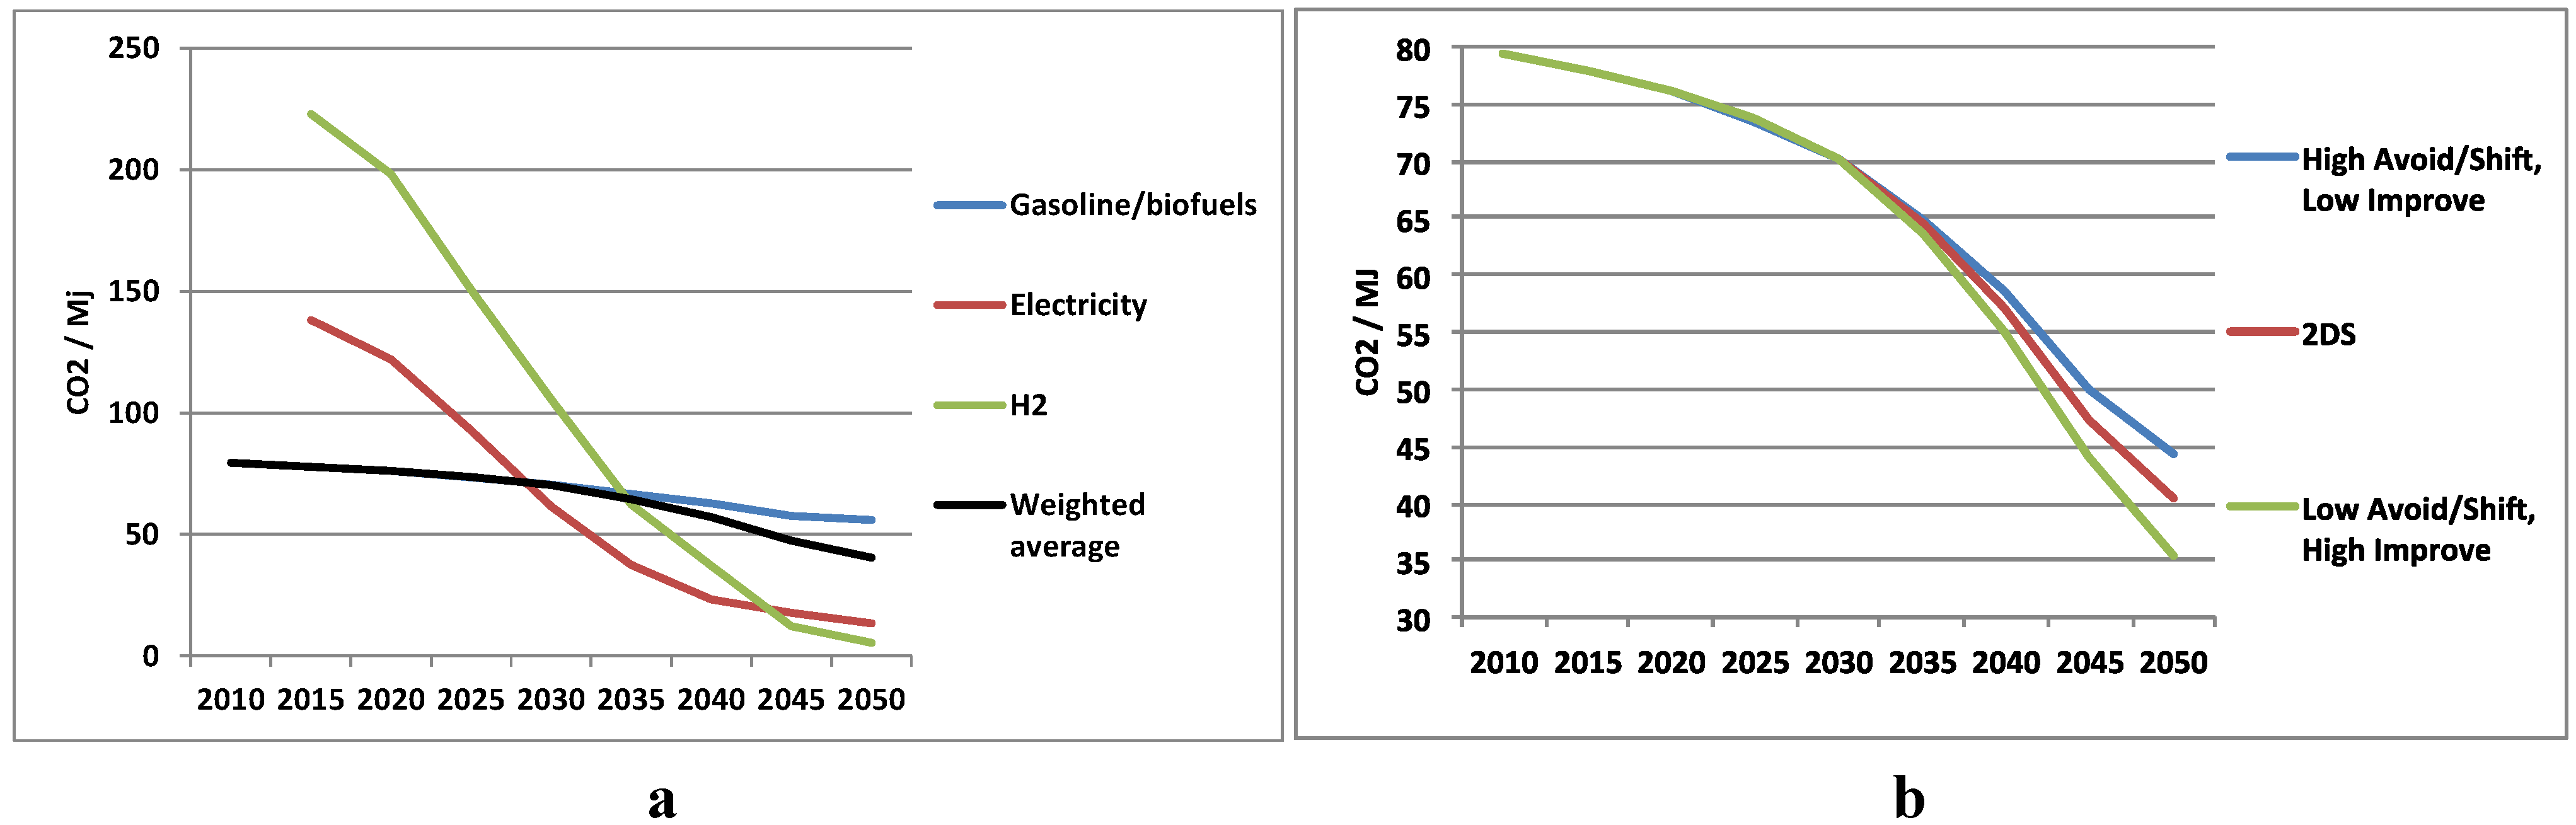
Figure 8a below shows the well-to-wheel (WTW) carbon intensity (CO2 per MJ) of the major fuels in the 2DS case, along with the weighted average fuel intensity based on the consumption of the different fuels. This corresponds to the vehicle technology sales shares explored in Figure 7. Although biofuels help bend the curve for liquid fuels somewhat, the increasing use of electricity and hydrogen in plug-in and fuel cell vehicles serve to strongly decrease the average LDV fuel carbon intensity after 2035, when these vehicles and fuels have reached substantial market shares (Figure 8a). This is also shown in Figure 8b as the middle line, which clearly shows a drop in CO2 g/MJ from 70 in 2030 to 40 in 2050, providing a direct reduction in CO2 intensity of nearly 50%.
Figure 8b also shows the two alternative cases, and the effect of the additional advanced technology vehicles in the High Improve case, and the fewer vehicles in the Low Improve case. The difference in average fuel intensity ranges from 45 to 35 CO2. An additional reduction in CO2 intensity comes from on-going required increases in biofuel share. In the 2DS case, this reaches about 30% of the liquid fuels share, and is increased to about 40% in the Low Avoid/Shift and High Improve case in order to bring the overall fuel carbon intensity down to the target level (not reflected in this figure).
Figure 8. LDV Fuel Carbon Intensity in 2DS (a) and weighted average intensity in all three cases (b).
Sustainability 05 01863 g008
While it is difficult to assess how the three cases compare with regard to their cost-effectiveness and technological and political feasibility over time, it becomes apparent that a combined approach as suggested in the 2DS case, potentially with an even stronger focus on Avoid/Shift measures may be required. A larger role for technology and fuels than suggested in the ETP 2012 2DS case may require a substantial boost in the transition toward low-carbon vehicles and fuels, which may become very challenging in terms of investment rates into new production systems and consumer acceptance of new types of vehicles and fuels. It will take additional analysis to better estimate the actual costs and benefits in these scenarios and attempt to quantify the level of policy stringency that may be needed to achieve them, but it seems clear that both sensitivity cases would require strong policy packages to foster modal shift, reduce travel demand and/or boost fuel efficiency and technology take-up, compared to a more balanced approach as explored in the IEA ETP 2012 2DS case.

4. Conclusions

The cases presented here test the validity of the light-duty vehicle fleet scenarios developed for the IEA Energy Technology Perspectives 2012. The sensitivity analysis indicates that a comprehensive approach to road passenger transport CO2 emission reductions requires a mix of all available options, including measures to reduce travel demand and foster modal shifts (Avoid/Shift) and improvement in vehicle technology and fuels (Improve). However, they also suggest that if very strong efficiency improvements and fuel switch measures could be achieved, it is possible to meet CO2 emission reduction targets without major changes in travel demand. Similarly, stronger shifts to low-carbon modes, such as public transport and non-motorized transport would require less effort with regard to low-carbon technology and fuel uptake.
This paper lays out some comparisons between different approaches and how changes in travel affect what is required in terms of efficiency and fuel changes. It has not attempted to quantitatively assess which of these approaches is more likely to succeed or which has the lowest societal cost. A more in depth analysis would be required to assess how fast sales of new technologies, such as plug-in and fuel cell vehicles can increase, and whether the penetration rates in the Low Avoid/Shift and High Improve case are feasible, at what cost, would help better evaluate the various options. However, the analysis already provides some indication that the costs and policy challenges to achieve this case could be substantial.
Similarly, more work is needed to understand whether the Avoid and Shift changes shown in the different cases are achievable, at what cost, and with what types of policies. It is likely that cutting LDV travel by about 30% in OECD, and cutting growth in LDV travel by nearly 2/3 in non-OECD countries as suggested in the High Avoid/Shift and Low Improve, will require major policy initiatives and massive investments in alternative modes of travel at the city and national level all over the world.
Though not the focus of this paper, it should be remembered as well that transport CO2 mitigation strategies primarily focusing on fuels and technologies are not likely to deliver on the full potential of co-benefits. Efficiency improvements and most fuel switch options (e.g., electric vehicles, provided the electricity is derived from a low-carbon, low polluting power source) will affect local air quality positively. These measures are unlikely, however, to reduce congestion or improve safety and may even impact on accessibility and affordability. Hence, an integrated, multimodal climate change mitigation strategy for the transport sector is likely be more cost effective and will also generate a higher level of co-benefits, while reducing uncertainties associated with some advanced vehicle technologies.

Acknowledgments

The authors would like to thank the International Energy Agency team who produced transportation analysis for the ETP 2012 including Markus Wrake, Cecilia Tam, Alex Koerner, Tali Trigg, Hiroyuki Kaneko and John Dulac (along with Lew Fulton and François Cuenot, authors on this paper).
The publication of this paper has partly been financed by the project METRASYS—Sustainable Mobility for Mega Cities funded by the German Federal Ministry of Education and Research as part of the program “Research for Sustainable Development of the Mega Cities of Tomorrow—Energy and Climate Efficient Structures in Urban Growth Centres”.

Conflict of Interest

The authors declare no conflict of interest.

References

  1. International Energy Agency, Energy Technology Perspectives 2012; IEA: Paris, France, 2012.
  2. Schipper, L.; Marie-Lilliu, C.; Gorham, R. Flexing the Link between Transport and Green House Gas Emissions; International Energy Agency: Paris, France, 2000.
  3. International Energy Agency, Mobility Model (“Momo”) Database, Input Data for the Energy Technology Perspectives 2012 Report; IEA: Paris, France, 2012.
  4. Johansson, T.B.; Nakicenovic, N.; Patwardhan, A.; Gomez-Echeverri, L. Global Energy Assessment—Toward a Sustainable Future; UK and International Institute for Applied Systems Analysis: Cambridge, UK, 2012. [Google Scholar]
  5. Newman, P.; Kenworthy, J. Sustainability and Cities: Overcoming Automobile Dependence; Island Press: Washington, DC, USA, 1999. [Google Scholar]
  6. International Energy Agency. Transport, Energy and CO2: Moving Toward Sustainability; IEA: Paris, France, 2009.
  7. Santos, G.; Behrendt, H.; Teytelboym, A. Part II: Policy instruments for sustainable road transport. Res. Transp. Econ. 2010, 28, 46–91. [Google Scholar] [CrossRef]
  8. Intergovernmental Panel on Climate Change, Fourth Assessment Report; Intergovernmental Panel on Climate Change (IPCC): Geneva, Switzerland, 2007.
  9. International Energy Agency, Technology Roadmap: Fuel Economy of Road Vehicles; OECD/IEA: Paris, France, 2012.
  10. Bandivadekar, A. On the Road in 2035: Reducing Transportation’s Petroleum Consumption and GHG Emissions; Massachusetts Institute of Technology, Laboratory for Energy and the Environment, Report LFEE (2008-05 RP): Cambridge, MA, USA, 2008. [Google Scholar]
  11. International Council on Clean Transportation. An Assessment of Mass Reduction Opportunities for a 2017–2020 Model Year Vehicle Program, Prepared by Lotus Engineering. ICCT, 2010. Available online: http://www.theicct.org/documents/0000/1430/Mass_reduction_final_2010.pdf (accessed on 10 January 2012).

