<?xml version="1.0" encoding="UTF-8"?>
<!DOCTYPE article PUBLIC "-//NLM//DTD Journal Publishing DTD v2.3 20070202//EN" "journalpublishing.dtd">
<article xmlns:mml="http://www.w3.org/1998/Math/MathML" xmlns:xlink="http://www.w3.org/1999/xlink" xml:lang="en" article-type="research-article">
  <front>
    <journal-meta>
      <journal-id journal-id-type="publisher-id">sustainability</journal-id>
      <journal-title>Sustainability</journal-title>
      <abbrev-journal-title abbrev-type="publisher">Sustainability</abbrev-journal-title>
      <abbrev-journal-title abbrev-type="pubmed">Sustainability</abbrev-journal-title>
      <issn pub-type="epub">2071-1050</issn>
      <publisher>
        <publisher-name>MDPI</publisher-name>
      </publisher>
    </journal-meta>
    <article-meta>
      <article-id pub-id-type="doi">10.3390/su5031211</article-id>
      <article-id pub-id-type="publisher-id">sustainability-05-01211</article-id>
      <article-categories>
        <subj-group>
          <subject>Article</subject>
        </subj-group>
      </article-categories>
      <title-group>
        <article-title>Exploring the Attitudes-Action Gap in Household Resource Consumption: Does “Environmental Lifestyle” Segmentation Align with Consumer Behaviour?</article-title>
      </title-group>
      <contrib-group>
        <contrib contrib-type="author">
          <name>
            <surname>Newton</surname>
            <given-names>Peter</given-names>
          </name>
          <xref rid="c1-sustainability-05-01211" ref-type="corresp">*</xref>
        </contrib>
        <contrib contrib-type="author">
          <name>
            <surname>Meyer</surname>
            <given-names>Denny</given-names>
          </name>
        </contrib>
      </contrib-group>
      <aff id="af1-sustainability-05-01211">Institute for Social Research, Swinburne University of Technology, Melbourne, Victoria 3124, Australia; E-Mail: <email>dmeyer@swin.edu.au</email> </aff>
      <author-notes>
        <corresp id="c1-sustainability-05-01211"><label>*</label> Author  to whom correspondence should be addressed; E-Mail: <email>pnewton@swin.edu.au</email>; Tel.: +61-392144769; Fax: +61-398195349.</corresp>
      </author-notes>
      <pub-date pub-type="epub">
        <day>19</day>
        <month>03</month>
        <year>2013</year>
      </pub-date>
      <pub-date pub-type="collection"><month>03</month>
        <year>2013</year>
      </pub-date>
      <volume>5</volume>
      <issue>3</issue>
      <fpage>1211</fpage>
      <lpage>1233</lpage>
      <history>
        <date date-type="received">
          <day>19</day>
          <month>12</month>
          <year>2012</year>
        </date>
        <date date-type="rev-recd">
          <day>04</day>
          <month>02</month>
          <year>2013</year>
        </date>
        <date date-type="accepted">
          <day>12</day>
          <month>02</month>
          <year>2013</year>
        </date>
      </history>
      <permissions>
        <copyright-statement>© 2013 by the authors; licensee MDPI, Basel, Switzerland.</copyright-statement>
        <copyright-year>2013</copyright-year>
        <license xmlns:xlink="http://www.w3.org/1999/xlink" license-type="open-access" xlink:href="http://creativecommons.org/licenses/by/3.0/">
          <p>This article is an open access article distributed under the terms and conditions of the Creative Commons Attribution license (http://creativecommons.org/licenses/by/3.0/).</p>
        </license>
      </permissions>
      <abstract>
        <p>Consumption is a transcending challenge for the 21st century that is stimulating research on multiple pathways required to deliver a more environmentally sustainable future. This paper is nested in what is a much larger field of research on sustainable consumption and reports on part of a major Australian Research Council study into the determinants of household resource consumption, based on a survey of 1,250 residents in Melbourne, Australia. Three environmental lifestyle segments are established that represent the spectrum of attitudes, opinions and intentions across the surveyed population: “committed” greens, “material” greens and “enviro-sceptics” (representing respectively 33.5%, 40.3% and 26.3% of the population). Each segment was found to display distinctive socio-demographic attributes, as well as urban geographies. However, few differences were found in relation to each segment’s actual consumption of energy, water, housing space, urban travel and domestic appliances. The research findings indicate that in these areas of urban resource consumption—all principal contributors to the ecological footprint of households—there are sets of factors at work that override attitudes, opinions and intentions as indicators of consumer behaviour. Some of these factors are information, organization and finance related and are the focus of much public policy. However, the persistence of well ingrained habits and practices among individuals and households and the lack of norms and values in western societies that explicitly promote environmental conservation among its population, are fundamentally involved in the attitude-action gap and constitute important avenues for future research and action.</p>
      </abstract>
      <kwd-group>
        <kwd>household consumption</kwd>
        <kwd>lifestyles</kwd>
        <kwd>segmentation</kwd>
        <kwd>socio-demographics</kwd>
        <kwd>intention-action gap</kwd>
        <kwd>barriers</kwd>
      </kwd-group>
    </article-meta>
  </front>
  <body>
    <sec sec-type="intro">
      <title>1. Introduction</title>
      <p>Trajectories of consumption across a wide spectrum of urban services and resources in high income societies continue to trend upwards [<xref ref-type="bibr" rid="B1-sustainability-05-01211">1</xref>,<xref ref-type="bibr" rid="B2-sustainability-05-01211">2</xref>]. At the same time, attempts to create “wedges” linked to the introduction of social and economic policies, new processes and products, <italic>etc</italic>. [<xref ref-type="bibr" rid="B3-sustainability-05-01211">3</xref>,<xref ref-type="bibr" rid="B4-sustainability-05-01211">4</xref>], capable of underpinning a significant reduction in consumption, underpin much contemporary research. Many prospective sustainability “wedges” are found in the literature and include:
      <list list-type="bullet">
        <list-item>
          <p><italic>Dematerialisation:</italic> a reduction in the resource inputs required to produce consumer products, such as building materials, domestic appliances and automobiles via recycling, re-use and closed loop manufacturing;</p>
        </list-item>
        <list-item>
          <p><italic>Substitution</italic> of renewable for non-renewable resources, e.g., use of solar energy rather than fossil fuels, of public transport or active transport rather than private car, of low energy lighting for higher energy products;</p>
        </list-item>
        <list-item>
          <p><italic>Efficiency</italic> in use of materials, spaces, time, <italic>etc</italic>., capable of being achieved via the (re-)design of a product or system, so as to be reflected in its operating performance, e.g., energy-efficient housing design; and</p>
        </list-item>
        <list-item>
          <p><italic>Conservation</italic> of resources capable of being seen simply as a lowered absolute consumption of a resource (such as energy, water, petroleum, land, housing space and kilometres travelled) achieved by any of the pathways listed above, as well as by a change in habits and behaviours by those involved as consumers.</p>
        </list-item>
      </list></p>
      <p>
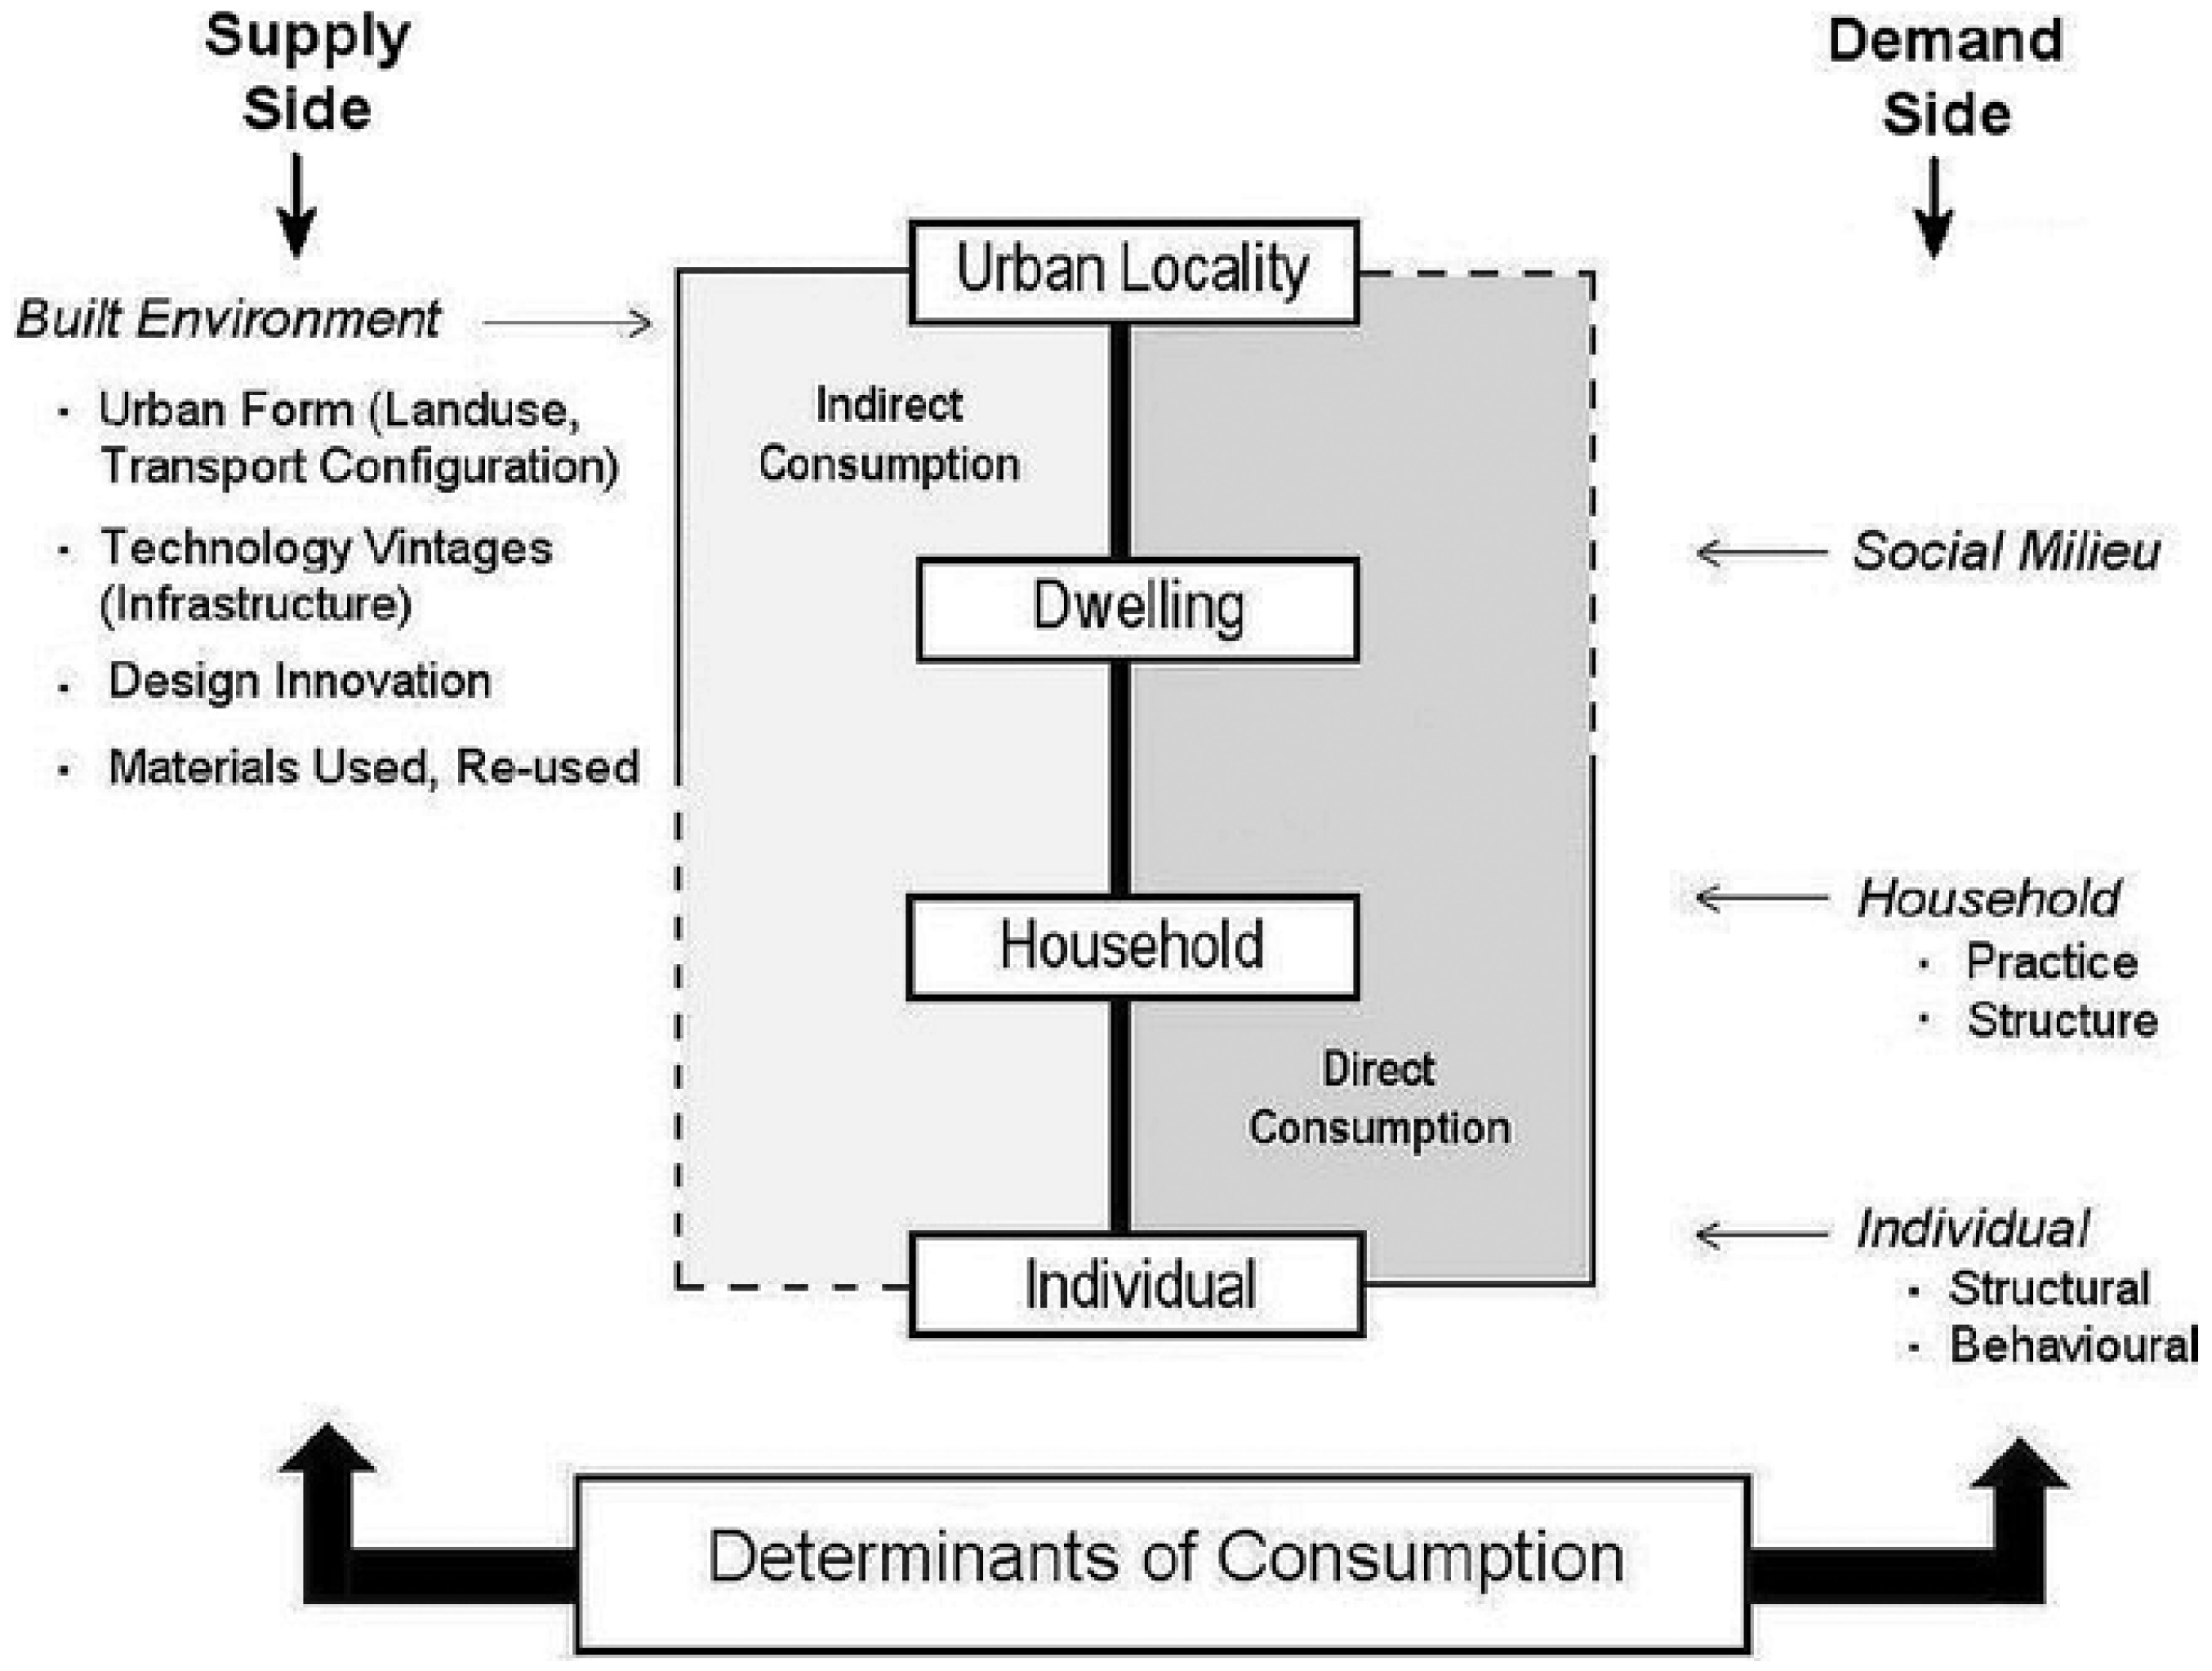
They cover the spectrum of research from sustainable production to sustainable consumption—from the supply side to the demand side. A conceptual framework capable of being used to “map” consumption research is presented in <xref ref-type="fig" rid="sustainability-05-01211-f001">Figure 1</xref>. It suggests that demand-side studies—the focus of this paper—will centre on better understanding the role of social and demographic, as well as behavioural attributes associated with individuals and households and the contextual settings related to their dwelling, urban location or social milieu. Demand-side research also needs to probe why studies of urban resource use [<xref ref-type="bibr" rid="B5-sustainability-05-01211">5</xref>,<xref ref-type="bibr" rid="B6-sustainability-05-01211">6</xref>,<xref ref-type="bibr" rid="B7-sustainability-05-01211">7</xref>,<xref ref-type="bibr" rid="B8-sustainability-05-01211">8</xref>] are finding a gap between attitudes and actions; individuals are not behaving in a manner that is congruent with their stated attitudes and intentions. Here, a major question mark continues to surround the issue of whether individuals or households in high income societies are prepared to make <italic>voluntary</italic> changes to their consumption practices in order that the 21st century has some prospect for a more sustainable and equitable world. This necessitates a drilling down into the structural and behavioural attributes of individuals to explore those factors, both intrinsic and extrinsic, linked to consumption [<xref ref-type="bibr" rid="B9-sustainability-05-01211">9</xref>]. It can be argued that behaviour change on the part of individuals and the households with which they are associated holds the <italic>prospect</italic> for a much faster rate of sustainability transformation than supply-side technological innovation of key infrastructures and services (e.g., energy, water, waste or in the redesign of built environments). Radical change is possible in both these arenas, but the timescale required is considerable, hence the increasing interest being shown by governments in behaviour change policies and programs [<xref ref-type="bibr" rid="B10-sustainability-05-01211">10</xref>,<xref ref-type="bibr" rid="B11-sustainability-05-01211">11</xref>].</p>
      <fig id="sustainability-05-01211-f001" position="float">
        <label>Figure 1</label>
        <caption>
          <p>A conceptual framework for consumption research.</p>
        </caption>
        <graphic xmlns:xlink="http://www.w3.org/1999/xlink" xlink:href="sustainability-05-01211-g001.tif"/>
      </fig>
      <p>There is both an applied and a theoretical dimension to the study of household resource consumption and behaviour change. It has been argued that no voluntary changes in consumption practices can be achieved if policy makers, business and consumers alike lack an understanding of how and why individuals and households consume and what factors tend to be associated with behaviour change [<xref ref-type="bibr" rid="B12-sustainability-05-01211">12</xref>]. In recent years, a significant number of behaviour change programs have begun to emerge, each with varying degrees of underpinning evidence base as support. What have been termed <italic>transmissive</italic> projects—for example, broadcast messages via television, newspapers and the like relating to some aspect of consumption reduction, such as energy or water conservation and healthy eating—are mostly premised on a linear model of behaviour change: <bold>information</bold>→awareness→concern→action [<xref ref-type="bibr" rid="B5-sustainability-05-01211">5</xref>,<xref ref-type="bibr" rid="B13-sustainability-05-01211">13</xref>,<xref ref-type="bibr" rid="B14-sustainability-05-01211">14</xref>]. Examples of transmissive projects include Earth Hour [<xref ref-type="bibr" rid="B15-sustainability-05-01211">15</xref>] and Black Balloons [<xref ref-type="bibr" rid="B16-sustainability-05-01211">16</xref>]. There is no segmentation or targeting involved. The economic rationalist information-based model of human behaviour has proven influential here in attracting government investment The first phase has been termed “cognitive” (awareness of information about a particular issue, e.g., climate change, drought); the second has been termed “affective” and is typically associated with some expression of concern about the issue; and the third is “action”, where individuals have been motivated to make some change in their behaviour that is tangible and measurable. The narrative of the behaviour change process in this conceptual context is therefore portrayed as follows: an environmental citizen is someone who has internalised information about environmental problems, creating a sense of concern, personal responsibility and duty that is then expressed through consumption and community actions [<xref ref-type="bibr" rid="B17-sustainability-05-01211">17</xref>]. Research suggests, however, that the three facets of behaviour change are not necessarily sequential [<xref ref-type="bibr" rid="B5-sustainability-05-01211">5</xref>]. <italic>Transformative</italic> initiatives focus on face-to-face engagement with specific communities in an attempt to achieve the necessary traction for behaviour change. Examples of transformative programs include: Sustainable Consumption Roundtable’s “triangle of change” (government, business and population) that involves engaging, exemplifying, enabling and encouraging [<xref ref-type="bibr" rid="B18-sustainability-05-01211">18</xref>]; the “kitchen table” processes [<xref ref-type="bibr" rid="B19-sustainability-05-01211">19</xref>]; the social marketing approach [<xref ref-type="bibr" rid="B20-sustainability-05-01211">20</xref>]; the “seven doors” model [<xref ref-type="bibr" rid="B21-sustainability-05-01211">21</xref>]; Green Street [<xref ref-type="bibr" rid="B22-sustainability-05-01211">22</xref>] and other socially (rather than cognitively)-based behaviour change programs [<xref ref-type="bibr" rid="B23-sustainability-05-01211">23</xref>,<xref ref-type="bibr" rid="B24-sustainability-05-01211">24</xref>]. </p>
      <p><italic>Lifestyle segmentation</italic> (LSS) has emerged from the marketing and communications fields of research as a means by which the behaviour change programs of governments might be better targeted, whether transmissive or transformative in nature. LSS represents a marriage of two concepts into a single system [<xref ref-type="bibr" rid="B25-sustainability-05-01211">25</xref>]. Lifestyle refers to a distinctive pattern of a person’s social life that straddles notions of individual identity, on the one hand, and community/sociality, on the other, “embodying notions of choice and self-actualisation alongside opportunities for collectivity and attachment” [<xref ref-type="bibr" rid="B26-sustainability-05-01211">26</xref>]. It is a broad based concept that incorporates everyday facets of individual lives, including their attitudes, opinions, values, feelings, intentions, habits and social contexts. Segmentation refers to a division of the population or market into relatively homogeneous clusters capable of being readily differentiated or labelled—via either quantitative or qualitative routes. The premise underpinning LSS is that it identifies groups of people who might be more likely to <italic>behave</italic> in similar ways <italic>as consumers</italic>—of particular products, services, information and messages. The attractiveness of LSS and its link with sustainability is the contention that consumer behaviour is likely to vary across different lifestyle groups comprising individuals with specific combinations of environmental attitudes and practices [<xref ref-type="bibr" rid="B27-sustainability-05-01211">27</xref>]. The research tasks then become those of establishing a valid and differentiated set of lifestyle groups among a population derived from either quantitative (lifestyle segmentation) or qualitative (e.g., consumer culture or social practice) research methods (or some hybrid) and then examining the extent to which lifestyle “type” can explain differences in some aspect of consumer behaviour. There is an extensive body of publication associated with the former, but there is a dearth of studies that proceed to examine the latter. </p>
      <p>As intimated above, two contrasting approaches to LSS have emerged in research literature: the longer established and more widely implemented “traditional” approach, which is characterized by quantitative analysis and data reduction (and which is adopted for this paper—see section on Methods); and the cultural theory or social practices approach, which is qualitative in nature, drawing on a different set of disciplines for its execution. Quantitative LSS obtains responses to self-rating questionnaire items encompassing attitudes to a wide spectrum of statements that are deemed to cover the breadth of domains of interest to contemporary living. They are then subjected to some form of cluster analysis to identify groups that have similar response patterns, after which descriptive labels are assigned capable of evoking the distinctiveness of each group. The strength of this approach is its ability to synthesise a large volume of complex information into meaningful insights that are valued by clients in both private and public sectors. LSS studies of this type have been part of market and consumer research since the 1960s and 1970s for products, such as cars, alcohol, tourism, clothing and furniture, and there are many proprietary lifestyle typologies that have been developed. These include GfK Roper’s broad, multi-product lifestyle segments that comprise: <italic>dreamers, homebodies, settled, adventurers, rational-realists, open-minded organics</italic> and <italic>demanding</italic> [<xref ref-type="bibr" rid="B28-sustainability-05-01211">28</xref>]. Other segmentations [<xref ref-type="bibr" rid="B27-sustainability-05-01211">27</xref>,<xref ref-type="bibr" rid="B29-sustainability-05-01211">29</xref>] have been developed for specific applications, such as:
      <list list-type="bullet">
        <list-item>
          <p>energy saving behaviour: <italic>economically modest, open-minded value pluralists, hedonists, conservative environment conscious, alternative environment-conscious, disinterested materialists</italic> and <italic>potentially sustainable</italic>;</p>
        </list-item>
        <list-item>
          <p>general household consumption: <italic>organised eco-families, childless career-oriented, young disinterested, everyday creative, disinterested in consumption, rural traditional, disadvantaged stressed, inconspicuous families, active seniors</italic> and <italic>status-oriented privileged</italic>;</p>
        </list-item>
        <list-item>
          <p>leisure mobility: <italic>fun-oriented, modern exclusive, stressed family-oriented, disadvantaged and traditional domestic; for urban travel: malcontented motorists, complacent car addicts, diehard drivers, aspiring environmentalists, car-less crusaders</italic> and <italic>reluctant riders</italic>.</p>
        </list-item>
      </list></p>
      <p>The weaknesses of this class of LSS studies have generally been the lack of validation or replication and lack of proof as to their capacity to discriminate or predict actual behaviour. </p>
      <p>The second, qualitative approach to LSS research to emerge more recently has been termed the social practice or cultural theory approach [<xref ref-type="bibr" rid="B30-sustainability-05-01211">30</xref>,<xref ref-type="bibr" rid="B31-sustainability-05-01211">31</xref>,<xref ref-type="bibr" rid="B32-sustainability-05-01211">32</xref>]. It focuses on the common contexts of everyday life, such as homes and workplaces, and the associated research seeks to understand how observed consumption behaviours reflect daily routines and practices, <italic>i.e.</italic>, habits. It views the traditional LSS as failing to understand the “complex socio-cultural processes and situations that underlie human behaviour” [<xref ref-type="bibr" rid="B33-sustainability-05-01211">33</xref>]. By undertaking in-depth interviews often combined with observational and participative (ethnographic) research, it provides the basis for fleshing out lifestyle segments as part of a process for better understanding and characterizing contemporary society and the value this holds for developing more successful strategies for behaviour change. Its prime weaknesses have been identified as restriction to a small number of consumption settings and activities, such as water and energy use in the home [<xref ref-type="bibr" rid="B34-sustainability-05-01211">34</xref>], and a focus on overly complex, in-depth, but small-sample, qualitative studies, uncovering experiences that are often seen as unique to individuals and their spatial and temporal settings and are difficult to generalise or ascribe to a larger population [<xref ref-type="bibr" rid="B35-sustainability-05-01211">35</xref>].</p>
      <p>More recently, LSS research has been directed towards the identification of an evidence base for behaviour change policies and programs associated with the environment and climate change [<xref ref-type="bibr" rid="B36-sustainability-05-01211">36</xref>,<xref ref-type="bibr" rid="B37-sustainability-05-01211">37</xref>,<xref ref-type="bibr" rid="B38-sustainability-05-01211">38</xref>]. In a UK study [<xref ref-type="bibr" rid="B39-sustainability-05-01211">39</xref>], seven lifestyle clusters were identified: positive greens, waste watchers, concerned consumers, sideline supporters, cautious participants, stalled starters and honestly disengaged. In a rare replication of such studies (albeit with less than half the indicator variables) in New Zealand [<xref ref-type="bibr" rid="B40-sustainability-05-01211">40</xref>], significant variation was found in the proportions of the population aligned with each of the seven lifestyle segments. In a similar Australian study [<xref ref-type="bibr" rid="B41-sustainability-05-01211">41</xref>], three segments were derived from self-reported environmental behaviours: committeds, privates and reluctants, “naturally forming groups of people who exhibit similar behavioural patterns regarding the environment”. A United States study [<xref ref-type="bibr" rid="B42-sustainability-05-01211">42</xref>], identifies “six Americas”, where each population segment holds different attitudes to the issue of climate change: the alarmed (18%), the concerned (33%), the cautious (19%), the disengaged (12%), the doubtful (11%) and the dismissive (7%). In later surveys [<xref ref-type="bibr" rid="B43-sustainability-05-01211">43</xref>], the alarmed and concerned proportions had declined somewhat and shifted to “cautious”. What all studies reveal is the existence of common environmental lifestyle “types” ranging from the green/engaged to the sceptic/disengaged. None of these studies, however, assessed alignment of segments with target actions or behaviours.</p>
      <p>Many lifestyle typologies, such as those listed above, are made up of objective, as well as subjective, attributes. This would appear to be valid for descriptive analyses of a population or sample. To the extent that socio-demographic factors have been found to be particularly significant determinants in their own right of consumer behaviour [<xref ref-type="bibr" rid="B44-sustainability-05-01211">44</xref>], combining socio-demographic with attitude, opinion and intention attributes in a segmentation for use in explanatory or predictive modelling of consumption risks redundancy. As Gust [<xref ref-type="bibr" rid="B27-sustainability-05-01211">27</xref>] argues:
	  <disp-quote>
      <p>Socio-demographic variables, such as age, income, family size and lifecycle stage were found to limit any attitude or lifestyle variables. For example, although young mothers are quite environmentally conscious consumers, this consciousness may not go as far as replacing their car with public transport, since the car might be very important in the daily family organisation. Here, the fact that there is a small child in the household will have a greater effect of the likeliness of sustainable consumer behaviour than the environmental orientations of the mother.</p>
	  </disp-quote></p>
      <p>Other weaknesses of the lifestyle approach identified by this author [<xref ref-type="bibr" rid="B27-sustainability-05-01211">27</xref>] are that most typologies are conceived for specific applications and, as such, lack the prospect for comparative assessment or replication and that attitudes and behaviours are highly dynamic and can change at any point in time, especially as needs and contexts change (e.g., environmental <italic>versus</italic> economic priorities, before compared to during the global financial crisis of 2008 and 2009).</p>
      <p>The consensus is, however, that lifestyle orientation and segmentation can provide additional insight into consumer behaviour that may not be attributable to socio-demographic factors alone. The LSS approach has also been embraced as a tool with a capacity to tailor and better communicate sustainable behaviour diffusion strategies, as well as to market sustainable products and services to specific groups more likely to be receptive to the differentiated message [<xref ref-type="bibr" rid="B36-sustainability-05-01211">36</xref>].</p>
      <p>Against this background, the aim of this paper is four-fold:
      <list list-type="simple">
        <list-item>
          <label>(1)</label> <p>To establish an environmental lifestyle segmentation based on the cluster analysis of data from a representative sample of Melbourne household’s responses to a range of questions that probed environmental attitudes, opinions and intentions;</p>
        </list-item>
        <list-item>
          <label>(2)</label> <p>To explore the extent to which this segmentation also reflects major socio-demographic and geographic differences among the population (segmentations in their own right);</p>
        </list-item>
        <list-item>
          <label>(3)</label> <p>To establish to what degree the different environmental lifestyle groups displayed contrasting patterns of <italic>actual (consumption) behaviour</italic>. The methodology has been designed explicitly to test the strength of this nexus, which tends to be absent in most segmentation studies;</p>
        </list-item>
        <list-item>
          <label>(4)</label> <p>Based on the level of congruence established between the environmental lifestyles and actual behaviour, reflect on the relevance of segmentation approaches for behaviour change programs.</p>
        </list-item>
      </list></p>
    </sec>
    <sec sec-type="methods">
      <title>2. Methodology</title>
      <p>Given that the research objective of this paper was to explore the nature of any link between “environmental lifestyle” and consumption, it was deemed necessary to establish a lifestyle typology that derived from an interplay of the <italic>behavioural</italic> attitudes, opinions, concerns and intentions of a population—not their <italic>structural</italic> (socio-demographic) attributes, nor their actual patterns of consumption (see <xref ref-type="fig" rid="sustainability-05-01211-f001">Figure 1</xref>). In this, it aligns with the traditional LSS approach, sometimes characterized as AIO (activities, interests, opinions), since it was part of a much larger study of the determinants of urban consumption (see Acknowledgements; [<xref ref-type="bibr" rid="B44-sustainability-05-01211">44</xref>]). The objective of the overarching study was to <italic>quantify</italic> the respective contributions of individual (behavioural, structural) <italic>versus</italic> contextual (dwelling, urban location) to an explanation of energy and water use, housing and domestic appliance consumption and carbon emitted on city travel. In this way, the survey provided data enabling an examination of the extent to which there is or is not a
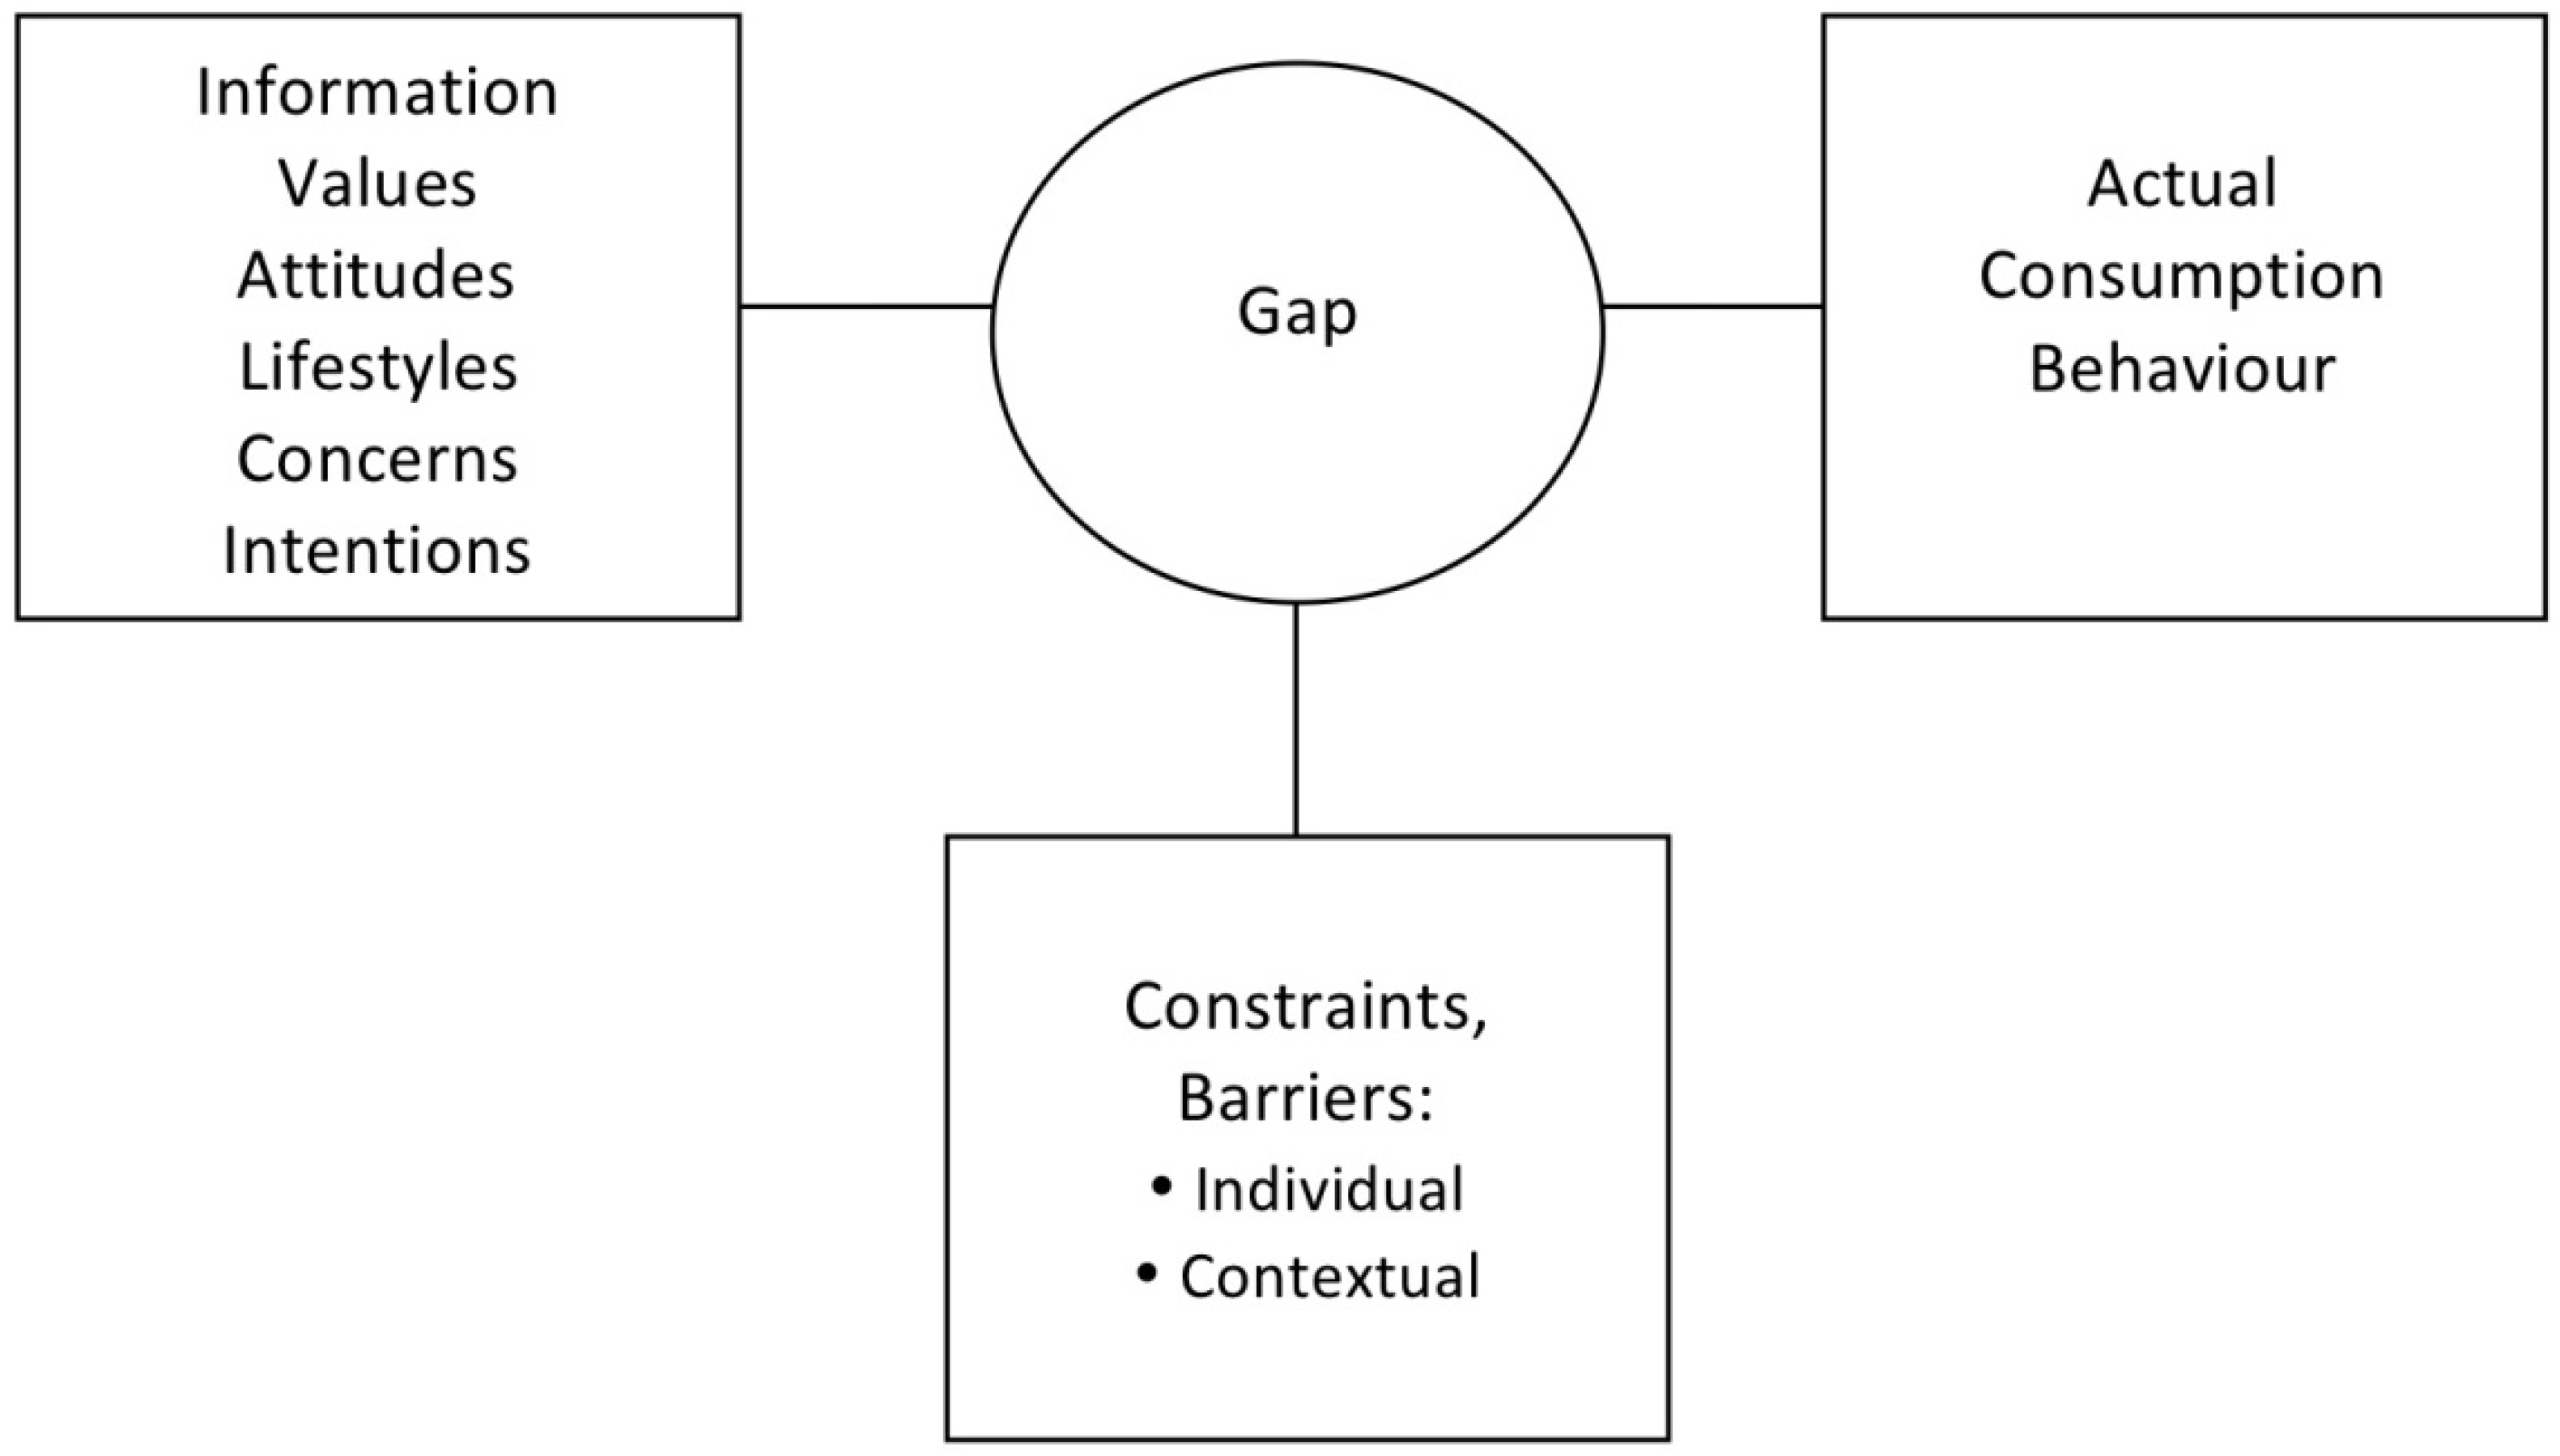
 <italic>gap</italic> between the subjective indicators of sustainable living (the lifestyle groupings) and actual consumption behaviour (see <xref ref-type="fig" rid="sustainability-05-01211-f002">Figure 2</xref>). This is a “model” for studies that seek to explore the disparity between awareness, concern and attitudes among the population for some significant issue, such as climate change and consumption and the level of action displayed by that population [<xref ref-type="bibr" rid="B45-sustainability-05-01211">45</xref>]. Literature suggests an explanation for the identified gap can be attributed to a set of <italic>barriers, constraints or situations</italic> that include the psychological, social and institutional, as well as the informational.</p>
      <fig id="sustainability-05-01211-f002" position="float">
        <label>Figure 2</label>
        <caption>
          <p>The gap between subjective indicators of intent and actual consumption behaviours.</p>
        </caption>
        <graphic xmlns:xlink="http://www.w3.org/1999/xlink" xlink:href="sustainability-05-01211-g002.tif"/>
      </fig>
      <sec>
        <title>2.1. Survey</title>
        <p>A postal survey undertaken in June 2009 in seven residential precincts across Melbourne, Australia, resulted in data for adult individuals representing 1,250 households at a response rate of 16%. The questionnaire was designed to collect information on the structural and attitudinal attributes of individuals, their household, dwelling and location characteristics, as well as actual household consumption data for electricity, gas and water (based on the most recent utility bills), housing space, urban travel and domestic appliances. The full questionnaire is found in [<xref ref-type="bibr" rid="B46-sustainability-05-01211">46</xref>]. The level of representativeness of the sample to the metropolitan population was considered to be high and successful in avoiding non-response bias. The respective percentage of sample <italic>versus</italic> metropolitan area populations was as follows:
        <list list-type="bullet">
          <list-item>
            <p>Living in detached or medium density housing: 80.9; 83.3</p>
          </list-item>
          <list-item>
            <p>Living in high rise apartment: 19.1; 16.7</p>
          </list-item>
          <list-item>
            <p>Gender (female/male): 60/40; 51/49</p>
          </list-item>
          <list-item>
            <p>Born in Australia: 65.6; 64.2</p>
          </list-item>
          <list-item>
            <p>Owner/purchaser of dwelling: 66.5; 67.7</p>
          </list-item>
          <list-item>
            <p>Family household: 68.8; 68.1</p>
          </list-item>
          <list-item>
            <p>Person living alone: 25.5; 22.6</p>
          </list-item>
          <list-item>
            <p>Aged less than 25: 4.2; 23.0</p>
          </list-item>
          <list-item>
            <p>Aged 25-64; 81.5; 64.2</p>
          </list-item>
          <list-item>
            <p>Aged 65 and over: 14.3; 12.8</p>
          </list-item>
        </list></p>
        <p>The age of respondents reflects the fact that an adult member of the household was required to complete the survey. Electricity and gas bills were combined in this analysis, because both these sources of energy are used for operating the spectrum of built-in and plug-in domestic appliances in a dwelling. The seven precincts provide representatives of the new outer greenfield suburbs, long-established middle suburbs and redeveloped and gentrified inner city neighbourhoods, with contrasting levels of residential density and public transport access. </p>
      </sec>
      <sec>
        <title>2.2. Statistical Analysis</title>
        <p>After providing a descriptive analysis for environmental attitudes and behaviours, a two-step clustering in SPSS was used to produce lifestyle clusters based on all these measures. This approach [<xref ref-type="bibr" rid="B47-sustainability-05-01211">47</xref>,<xref ref-type="bibr" rid="B48-sustainability-05-01211">48</xref>] allows an automatic choice for the number of clusters based on changes in the Bayes Information Criterion. The resulting three clusters were then appropriately named and compared in terms of their demographics and per capita consumption.</p>
      </sec>
    </sec>
    <sec>
      <title>3. Subjective Indicators of Environmental Concern and Environmental Intentions and the Identification of Environmental Lifestyle Clusters</title>
      <sec>
        <title>3.1. Concern for the Environment</title>
        <p>“Concern for the environment” has long been used as a leading indicator of the level of environmental engagement by an individual or community [<xref ref-type="bibr" rid="B49-sustainability-05-01211">49</xref>]. Questions that have examined and reported on levels of environmental concern by households have been used in Australian Bureau of Statistics (ABS) surveys since 1992. As reported by Newton [<xref ref-type="bibr" rid="B50-sustainability-05-01211">50</xref>], the level of environmental concern at a national level (there has been little variability by state) declined from 75% in 1992 to a low of 57% in 2004. In the latest ABS survey [<xref ref-type="bibr" rid="B51-sustainability-05-01211">51</xref>], it had risen to 81.3%, a similar level to that of the Sustainability Victoria survey (see <xref ref-type="table" rid="sustainability-05-01211-t001">Table 1</xref>). <italic>The Living in Melbourne</italic> survey was undertaken some 18 months after the ABS and Sustainability Victoria surveys (mid-2009), following the Black Saturday bushfires and during continuing issues of drought. The “concerned” percentage was accordingly very high (92.3%), suggesting a significant level of environmental sensitivity among the surveyed population. It should be noted that the exact wording of the “concern” question in the ABS surveys prior to 2007 was as follows: “<italic>Is … [respondent] concerned about any environmental problems?”</italic> [<xref ref-type="bibr" rid="B52-sustainability-05-01211">52</xref>]. For the 2007 survey, the question was modified as follows: “<italic>Are you concerned about any environmental problems in Australia?”</italic> The <italic>Living in Melbourne</italic> survey adopted the original framing of the question, “<italic>Is [respondent] concerned about any environmental problems?</italic>”. </p>
        <table-wrap id="sustainability-05-01211-t001" position="float">
          <object-id pub-id-type="pii">sustainability-05-01211-t001_Table 1</object-id>
          <label>Table 1</label>
          <caption>
            <p>Levels of environmental concern. Question: are you concerned about any environmental problem?</p>
          </caption>
          <table>
            <thead>
              <tr>
                <th rowspan="2" align="left" valign="middle"> </th>
                <th align="center" valign="middle">Living in Melbourne survey (2009)</th>
                <th align="center" valign="middle">Sustainability Victoria (2008)</th>
                <th align="center" valign="middle">Sustainability Victoria (2009)</th>
                <th align="center" valign="middle">ABS (2008) Victoria</th>
                <th align="center" valign="middle">ABS (2008) Australia</th>
              </tr>
              <tr>
			  <th align="center" valign="middle">(%)</th>
			  <th align="center" valign="middle">(%)</th>
                <th align="center" valign="middle">(%)</th>
                <th align="center" valign="middle"> (%)</th>
                <th align="center" valign="middle">(%)</th>
              </tr>
            </thead>
            <tbody>
              <tr>
                <td align="center" valign="middle" style="border-top:solid thin">No</td>
                <td align="center" valign="middle" style="border-top:solid thin">7.7</td>
                <td align="center" valign="middle" style="border-top:solid thin">16</td>
                <td align="center" valign="middle" style="border-top:solid thin">14</td>
                <td align="center" valign="middle" style="border-top:solid thin">15.8</td>
                <td align="center" valign="middle" style="border-top:solid thin">18.3</td>
              </tr>
              <tr>
                <td align="center" valign="middle">Yes</td>
                <td align="center" valign="middle">92.3</td>
                <td align="center" valign="middle">84</td>
                <td align="center" valign="middle">86</td>
                <td align="center" valign="middle">84.2</td>
                <td align="center" valign="middle">81.7</td>
              </tr>
              <tr>
                <td align="center" valign="middle">A great deal</td>
                <td align="center" valign="middle">30.7</td>
                <td align="center" valign="middle">38</td>
                <td align="center" valign="middle">42</td>
                <td align="left" valign="middle"> </td>
                <td align="left" valign="middle"> </td>
              </tr>
              <tr>
                <td align="center" valign="middle">A fair amount</td>
                <td align="center" valign="middle">48.3</td>
                <td align="center" valign="middle">31</td>
                <td align="center" valign="middle">30</td>
                <td align="left" valign="middle"> </td>
                <td align="left" valign="middle"> </td>
              </tr>
              <tr>
                <td align="center" valign="middle">A little</td>
                <td align="center" valign="middle">13.3</td>
                <td align="center" valign="middle">15</td>
                <td align="center" valign="middle">14</td>
                <td align="left" valign="middle"> </td>
                <td align="left" valign="middle"> </td>
              </tr>
            </tbody>
          </table>
        <table-wrap-foot><fn><p>Sources:[<xref ref-type="bibr" rid="B46-sustainability-05-01211">46</xref>,<xref ref-type="bibr" rid="B51-sustainability-05-01211">51</xref>,<xref ref-type="bibr" rid="B54-sustainability-05-01211">54</xref>,<xref ref-type="bibr" rid="B55-sustainability-05-01211">55</xref>].</p></fn></table-wrap-foot>
        </table-wrap>
        <p>While some authors [<xref ref-type="bibr" rid="B53-sustainability-05-01211">53</xref>] have indicated that variants of “environmental concern” measures (questions) will evoke different patterns of response, it is unlikely that the sudden surge in concern picked up in the most recent set of surveys is an artefact of the wording of the survey question. At the time of these surveys, the nation’s drought of some 15 years had not yet broken and there was a raft of issues surrounding the vulnerability of settlements to bushfires and water restrictions. Even the global financial crisis did not seem to alter attitudes of environmental concern [<xref ref-type="bibr" rid="B54-sustainability-05-01211">54</xref>,<xref ref-type="bibr" rid="B55-sustainability-05-01211">55</xref>], although that may have been due to the fact that Australia was one of only a handful of advanced Western economies to avoid slipping into recession. Or it may be reflecting the fact that there is increasing recognition among the population that we are living in a finite world with resource constraints and climate constraints that are becoming increasingly binding [<xref ref-type="bibr" rid="B56-sustainability-05-01211">56</xref>].</p>
      </sec>
      <sec>
        <title>3.2. Intentions and Predispositions</title>
        <p>The proposition from some behaviour change theorists is that high levels of “concern for environment”—as we have identified here—will be translated into a predisposition towards more sustainable forms of consumption. Evidence from <xref ref-type="table" rid="sustainability-05-01211-t002">Table 2</xref> suggests that representatives of households are strongly disposed towards saving water and energy (both rated “important” or “very important” by more than 90%). And even here, a significant proportion (74.5%; see <xref ref-type="table" rid="sustainability-05-01211-t003">Table 3</xref>) say they can envisage ways to further reduce their energy and water consumption. However, making adjustments to urban travel behaviour is projected to be more challenging.</p>
        <table-wrap id="sustainability-05-01211-t002" position="float">
          <object-id pub-id-type="pii">sustainability-05-01211-t002_Table 2</object-id>
          <label>Table 2</label>
          <caption>
            <p>How important is each of the following to you and your family?</p>
          </caption>
          <table>
            <thead>
              <tr>
                <th align="left" valign="middle"> </th>
                <th align="center" valign="middle">Not important at all</th>
                <th align="center" valign="middle"> </th>
                <th align="center" valign="middle"> Neutral</th>
                <th align="center" valign="middle"> </th>
                <th align="center" valign="middle">Very important</th>
              </tr>
            </thead>
            <tbody>
              <tr>
                <td align="center" valign="middle" style="border-top:solid thin">Recycling household waste</td>
                <td align="center" valign="middle" style="border-top:solid thin">2.4%</td>
                <td align="center" valign="middle" style="border-top:solid thin">1.2%</td>
                <td align="center" valign="middle" style="border-top:solid thin">10.9%</td>
                <td align="center" valign="middle" style="border-top:solid thin">28.1%</td>
                <td align="center" valign="middle" style="border-top:solid thin">57.4%</td>
              </tr>
              <tr>
                <td align="center" valign="middle">Saving water</td>
                <td align="center" valign="middle">0.6%</td>
                <td align="center" valign="middle">0.6%</td>
                <td align="center" valign="middle">5.6%</td>
                <td align="center" valign="middle">28.0%</td>
                <td align="center" valign="middle">65.2%</td>
              </tr>
              <tr>
                <td align="center" valign="middle">Saving energy</td>
                <td align="center" valign="middle">0.5%</td>
                <td align="center" valign="middle">0.6%</td>
                <td align="center" valign="middle">8.8%</td>
                <td align="center" valign="middle">32.1%</td>
                <td align="center" valign="middle">58.1%</td>
              </tr>
              <tr>
                <td align="center" valign="middle">Driving more slowly than the speed limit</td>
                <td align="center" valign="middle">12.7%</td>
                <td align="center" valign="middle">9.3%</td>
                <td align="center" valign="middle">35.6%</td>
                <td align="center" valign="middle">20.3%</td>
                <td align="center" valign="middle">22.1%</td>
              </tr>
              <tr>
                <td align="center" valign="middle">Using public transport</td>
                <td align="center" valign="middle">12.0%</td>
                <td align="center" valign="middle">5.9%</td>
                <td align="center" valign="middle">29.9%</td>
                <td align="center" valign="middle">25.1%</td>
                <td align="center" valign="middle">27.0%</td>
              </tr>
              <tr>
                <td align="center" valign="middle">Walking or cycling</td>
                <td align="center" valign="middle">3.2%</td>
                <td align="center" valign="middle">4.7%</td>
                <td align="center" valign="middle">21.4%</td>
                <td align="center" valign="middle">28.9%</td>
                <td align="center" valign="middle">41.8%</td>
              </tr>
              <tr>
                <td align="center" valign="middle">Having a large home with space</td>
                <td align="center" valign="middle">23.0%</td>
                <td align="center" valign="middle">11.5%</td>
                <td align="center" valign="middle">26.9%</td>
                <td align="center" valign="middle">21.5%</td>
                <td align="center" valign="middle">17.1%</td>
              </tr>
            </tbody>
          </table>
        <table-wrap-foot><fn><p>Note: n ranged from 1,231 to 1,249.</p></fn></table-wrap-foot>
        </table-wrap>
        <table-wrap id="sustainability-05-01211-t003" position="float">
          <object-id pub-id-type="pii">sustainability-05-01211-t003_Table 3</object-id>
          <label>Table 3</label>
          <caption>
            <p>Could you please indicate your level of agreement with the following statements?</p>
          </caption>
          <table>
            <thead>
              <tr>
                <th align="left" valign="middle"> </th>
                <th align="center" valign="middle">Strongly agree/ agree</th>
                <th align="center" valign="middle">Neither agree nor disagree</th>
                <th align="center" valign="middle">Strongly disagree/ disagree</th>
              </tr>
            </thead>
            <tbody>
              <tr>
                <td align="left" valign="middle" style="border-top:solid thin">I have done as much as I can to reduce my household’s energy and water consumption</td>
                <td align="center" valign="middle" style="border-top:solid thin">57.4%</td>
                <td align="center" valign="middle" style="border-top:solid thin">18.6%</td>
                <td align="center" valign="middle" style="border-top:solid thin">24.1%</td>
              </tr>
              <tr>
                <td align="left" valign="middle">I know some specific things I could do to reduce my household’s energy and water consumption</td>
                <td align="center" valign="middle">74.5%</td>
                <td align="center" valign="middle">15.9%</td>
                <td align="center" valign="middle">9.6%</td>
              </tr>
              <tr>
                <td align="left" valign="middle">Reducing my household’s energy and water consumption would help protect the environment</td>
                <td align="center" valign="middle">84.4%</td>
                <td align="center" valign="middle">11.5%</td>
                <td align="center" valign="middle">4.2%</td>
              </tr>
              <tr>
                <td align="left" valign="middle">The main reason for reducing my household’s energy and water consumption is to save money</td>
                <td align="center" valign="middle">34.7%</td>
                <td align="center" valign="middle">29.3%</td>
                <td align="center" valign="middle">35.9%</td>
              </tr>
              <tr>
                <td align="left" valign="middle">Reducing my household’s energy and water consumption is not worth the trouble</td>
                <td align="center" valign="middle">6.1%</td>
                <td align="center" valign="middle">9.0%</td>
                <td align="center" valign="middle">84.9%</td>
              </tr>
            </tbody>
          </table>
        <table-wrap-foot><fn><p>Note: n ranged from 1,221 to 1,238.</p></fn></table-wrap-foot>
        </table-wrap>
        <p>Probing the travel domain more deeply with the question: “Over the next 12 months, how likely are you to make the following changes in your personal travel to reduce your petrol consumption and carbon emissions?”, the responses in <xref ref-type="table" rid="sustainability-05-01211-t004">Table 4</xref> suggest that some transition has already begun in areas, such as switching to a smaller car and increased use of public transport, but there are still significant proportions (49.7 and 46.0%, respectively) where there was no likelihood of change, nor was car pooling seen as an option. Walking more was the most significant “maybe/likely” response (52.7%).</p>
        <table-wrap id="sustainability-05-01211-t004" position="float">
          <object-id pub-id-type="pii">sustainability-05-01211-t004_Table 4</object-id>
          <label>Table 4</label>
          <caption>
            <p>Over the next 12 months, how likely are you to make the following changes in your personal travel to reduce your petrol consumption and carbon emissions?</p>
          </caption>
          <table>
            <thead>
              <tr>
                <th align="left" valign="middle"> </th>
                <th align="center" valign="middle">Not likely</th>
                <th align="center" valign="middle">Maybe</th>
                <th align="center" valign="middle">Likely</th>
                <th align="center" valign="middle">Already have</th>
              </tr>
            </thead>
            <tbody>
              <tr>
                <td align="center" valign="middle" style="border-top:solid thin">Switch to a smaller (3 or 4 cylinder) vehicle</td>
                <td align="center" valign="middle" style="border-top:solid thin">49.7%</td>
                <td align="center" valign="middle" style="border-top:solid thin">9.5%</td>
                <td align="center" valign="middle" style="border-top:solid thin">6.1%</td>
                <td align="center" valign="middle" style="border-top:solid thin">34.7%</td>
              </tr>
              <tr>
                <td align="center" valign="middle">Use car less often</td>
                <td align="center" valign="middle">35.4%</td>
                <td align="center" valign="middle">22.9%</td>
                <td align="center" valign="middle">19.3%</td>
                <td align="center" valign="middle">22.3%</td>
              </tr>
              <tr>
                <td align="center" valign="middle">Begin to use public transport</td>
                <td align="center" valign="middle">42.0%</td>
                <td align="center" valign="middle">13.9%</td>
                <td align="center" valign="middle">8.5%</td>
                <td align="center" valign="middle">35.6%</td>
              </tr>
              <tr>
                <td align="center" valign="middle">Use public transport more often than at present</td>
                <td align="center" valign="middle">46.0%</td>
                <td align="center" valign="middle">23.0%</td>
                <td align="center" valign="middle">17.7%</td>
                <td align="center" valign="middle">13.2%</td>
              </tr>
              <tr>
                <td align="center" valign="middle">Move house so I need to travel less</td>
                <td align="center" valign="middle">77.8%</td>
                <td align="center" valign="middle">5.6%</td>
                <td align="center" valign="middle">6.0%</td>
                <td align="center" valign="middle">10.6%</td>
              </tr>
              <tr>
                <td align="center" valign="middle">Car pool to work</td>
                <td align="center" valign="middle">86.8%</td>
                <td align="center" valign="middle">8.5%</td>
                <td align="center" valign="middle">2.1%</td>
                <td align="center" valign="middle">2.6%</td>
              </tr>
              <tr>
                <td align="center" valign="middle">Walk more</td>
                <td align="center" valign="middle">21.7%</td>
                <td align="center" valign="middle">25.7%</td>
                <td align="center" valign="middle">27.0%</td>
                <td align="center" valign="middle">25.6%</td>
              </tr>
              <tr>
                <td align="center" valign="middle">Drive more slowly than the speed limit</td>
                <td align="center" valign="middle">37.4%</td>
                <td align="center" valign="middle">25.3%</td>
                <td align="center" valign="middle">18.0%</td>
                <td align="center" valign="middle">19.3%</td>
              </tr>
              <tr>
                <td align="center" valign="middle">Use communication technology to avoid travel</td>
                <td align="center" valign="middle">27.8%</td>
                <td align="center" valign="middle">15.4%</td>
                <td align="center" valign="middle">14.1%</td>
                <td align="center" valign="middle">42.8%</td>
              </tr>
              <tr>
                <td align="center" valign="middle">Fly less often</td>
                <td align="center" valign="middle">49.3%</td>
                <td align="center" valign="middle">16.2%</td>
                <td align="center" valign="middle">13.0%</td>
                <td align="center" valign="middle">21.4%</td>
              </tr>
            </tbody>
          </table>
        <table-wrap-foot><fn><p>Note: n ranged from 1,100 to 1,181.</p></fn></table-wrap-foot>
        </table-wrap>
        <p>The areas most likely to be embraced by households as a basis for delivering a clean environment (see <xref ref-type="table" rid="sustainability-05-01211-t005">Table 5</xref>) are recycling more, using substitutes for plastic bags when shopping, buying more local products and buying “green”-labelled products—what could be classed as the “low-hanging fruit”, where there is little or no inconvenience or cost associated with any shift in practice. There is less traction associated with modifying car usage and least of all with changes linked to a hip pocket impact, such as paying more tax or paying higher charges for electricity and water (61% “no” to both).</p>
        <table-wrap id="sustainability-05-01211-t005" position="float">
          <object-id pub-id-type="pii">sustainability-05-01211-t005_Table 5</object-id>
          <label>Table 5</label>
          <caption>
            <p>What would you be prepared to change in order for there to be a clean environment?</p>
          </caption>
          <table>
            <thead>
              <tr>
                <th align="left" valign="middle"> </th>
                <th align="center" valign="middle">Yes</th>
                <th align="center" valign="middle">No</th>
                <th align="center" valign="middle">Maybe</th>
              </tr>
            </thead>
            <tbody>
              <tr>
                <td align="center" valign="middle" style="border-top:solid thin">Pay more tax</td>
                <td align="center" valign="middle" style="border-top:solid thin">19.7%</td>
                <td align="center" valign="middle" style="border-top:solid thin">61.0%</td>
                <td align="center" valign="middle" style="border-top:solid thin">19.4%</td>
              </tr>
              <tr>
                <td align="center" valign="middle">Travel less by motor vehicle</td>
                <td align="center" valign="middle">48.9%</td>
                <td align="center" valign="middle">24.4%</td>
                <td align="center" valign="middle">26.7%</td>
              </tr>
              <tr>
                <td align="center" valign="middle">Choose to buy “green” labelled products</td>
                <td align="center" valign="middle">70.0%</td>
                <td align="center" valign="middle">8.1%</td>
                <td align="center" valign="middle">21.8%</td>
              </tr>
              <tr>
                <td align="center" valign="middle">Donate an hour or two each month to do voluntary work for the environment</td>
                <td align="center" valign="middle">36.8%</td>
                <td align="center" valign="middle">29.8%</td>
                <td align="center" valign="middle">33.4%</td>
              </tr>
              <tr>
                <td align="center" valign="middle">Choose to buy products produced locally</td>
                <td align="center" valign="middle">82.9%</td>
                <td align="center" valign="middle">4.0%</td>
                <td align="center" valign="middle">13.1%</td>
              </tr>
              <tr>
                <td align="center" valign="middle">Recycle more</td>
                <td align="center" valign="middle">90.9%</td>
                <td align="center" valign="middle">2.8%</td>
                <td align="center" valign="middle">6.2%</td>
              </tr>
              <tr>
                <td align="center" valign="middle">Pay higher charges for electricity and water</td>
                <td align="center" valign="middle">22.4%</td>
                <td align="center" valign="middle">60.8%</td>
                <td align="center" valign="middle">16.8%</td>
              </tr>
              <tr>
                <td align="center" valign="middle">Give up using plastic bags</td>
                <td align="center" valign="middle">72.2%</td>
                <td align="center" valign="middle">10.7%</td>
                <td align="center" valign="middle">17.1%</td>
              </tr>
            </tbody>
          </table>
        <table-wrap-foot><fn><p>Note: n ranged from 1,219 to 1,237.</p></fn></table-wrap-foot>
        </table-wrap>
        <p><italic>I will if you will</italic> was the title of a widely referenced report by the Sustainable Consumption Roundtable [<xref ref-type="bibr" rid="B11-sustainability-05-01211">11</xref>] in the UK. This revolved around responses to three key positions that people could hold as to their predisposition to change:
        <list list-type="bullet">
          <list-item>
            <p>“I am making changes to my behaviour now, irrespective of what other people do”—could be classed as proactive leaders;</p>
          </list-item>
          <list-item>
            <p>“I will make changes when the community around me begins to change”—could be classed as followers;</p>
          </list-item>
          <list-item>
            <p>“I will make changes when government introduces some regulation that requires everyone to meet a particular target”—could be classed as laggards.</p>
          </list-item>
        </list></p>
        <p>Based on the profiles of response to these statements (see <xref ref-type="table" rid="sustainability-05-01211-t006">Table 6</xref>), 83% of the population could be placed in the leader group, 5% followers and 12% laggards, which is likely to be overstating or misrepresenting the label of “leader” in this instance. Perhaps this group just represents the “independently minded”.</p>
        <table-wrap id="sustainability-05-01211-t006" position="float">
          <object-id pub-id-type="pii">sustainability-05-01211-t006_Table 6</object-id>
          <label>Table 6</label>
          <caption>
            <p>I will if you will. “Question: which of the following positions best reflects your view about changing behaviour?”</p>
          </caption>
          <table>
            <thead>
              <tr>
                <th align="center" valign="middle">Option</th>
                <th align="center" valign="middle">N</th>
                <th align="center" valign="middle">%</th>
              </tr>
            </thead>
            <tbody>
              <tr>
                <td align="left" valign="middle" style="border-top:solid thin">I am making changes to my behaviour now, irrespective of what other people do</td>
                <td align="center" valign="middle" style="border-top:solid thin">999</td>
                <td align="center" valign="middle" style="border-top:solid thin">82.6</td>
              </tr>
              <tr>
                <td align="left" valign="middle">I will make changes when the community around me begins to change</td>
                <td align="center" valign="middle">67</td>
                <td align="center" valign="middle">5.5</td>
              </tr>
              <tr>
                <td align="left" valign="middle">I will make changes when government introduces some regulation that requires everyone to meet a particular target</td>
                <td align="center" valign="middle">144</td>
                <td align="center" valign="middle">11.9</td>
              </tr>
            </tbody>
          </table>
        </table-wrap>
        <p>In response to statements, such as “I have done as much as I can to reduce my household’s energy and water consumption”, 57% of the sample believe that they have “maxed out” (see <xref ref-type="table" rid="sustainability-05-01211-t003">Table 3</xref>)—evidence, perhaps, of some “demand hardening” beginning to emerge among the population (see [<xref ref-type="bibr" rid="B57-sustainability-05-01211">57</xref>] for further discussion of this concept). This was contradicted to a degree in responses by three-quarters acknowledging that they “know some specific things I could do”.</p>
        <p>A self-assessment of the degree to which the respondent had been active over the past 12 months in responding to environmental issues indicated that 90% saw their behaviour as “very active” or “reasonably active” (see <xref ref-type="table" rid="sustainability-05-01211-t007">Table 7</xref>). A cross-tabulation of “concern for environment” with a self-assessment of the level of activity in responding to environmental issues revealed clear evidence of some link (see <xref ref-type="table" rid="sustainability-05-01211-t008">Table 8</xref>).</p>
        <table-wrap id="sustainability-05-01211-t007" position="float">
          <object-id pub-id-type="pii">sustainability-05-01211-t007_Table 7</object-id>
          <label>Table 7</label>
          <caption>
            <p>Over the past 12 months, would you say you have been…?</p>
          </caption>
          <table>
            <thead>
              <tr>
                <th align="center" valign="middle">Very active in responding to environmental issues</th>
                <th align="center" valign="middle">Reasonably active in responding to environmental issues</th>
                <th align="center" valign="middle">Not at all active in responding to environmental issues</th>
              </tr>
            </thead>
            <tbody>
              <tr>
                <td align="center" valign="middle" style="border-top:solid thin">13.1%</td>
                <td align="center" valign="middle" style="border-top:solid thin">76.3%</td>
                <td align="center" valign="middle" style="border-top:solid thin">10.6%</td>
              </tr>
            </tbody>
          </table>
        <table-wrap-foot><fn><p>Note: n = 1232.</p></fn></table-wrap-foot>
        </table-wrap>
        <table-wrap id="sustainability-05-01211-t008" position="float">
          <object-id pub-id-type="pii">sustainability-05-01211-t008_Table 8</object-id>
          <label>Table 8</label>
          <caption>
            <p>Expressions of concern <italic>versus</italic> indications of action.</p>
          </caption>
          <table rules="all" style="border:solid thin">
            <thead>
              <tr>
                <th rowspan="2" colspan="2" align="left" valign="middle"> </th>
                <th colspan="6" align="center" valign="top">Over the past 12 months, would you say you have been…?</th>
              </tr>
              <tr>
                <th colspan="2">Very/reasonably active in responding to environmental issues</th>
                <th colspan="2">Not at all active in responding to environmental issues</th>
                <th colspan="2"> Total</th>
              </tr>
            </thead>
            <tbody>
              <tr>
                <td rowspan="3" align="center" valign="top">Are you concerned about any environmental problems?</td>
                <td align="center" valign="top">Yes</td>
                <td align="center" valign="top">1047</td>
                <td align="center" valign="top">92.4%</td>
                <td align="center" valign="top">86</td>
                <td align="center" valign="top">7.6%</td>
                <td align="center" valign="top">1133</td>
                <td align="center" valign="top">100.0%</td>
              </tr>
              <tr>
                <td align="center" valign="top">No</td>
                <td align="center" valign="top">46</td>
                <td align="center" valign="top">50.5%</td>
                <td align="center" valign="top">45</td>
                <td align="center" valign="top">49.5%</td>
                <td align="center" valign="top">91</td>
                <td align="center" valign="top">100.0%</td>
              </tr>
              <tr>
                <td align="center" valign="top">Total</td>
                <td align="center" valign="top">1093</td>
                <td align="center" valign="top">89.3%</td>
                <td align="center" valign="top">131</td>
                <td align="center" valign="top">10.7%</td>
                <td align="center" valign="top">1224</td>
                <td align="center" valign="top">100.0%</td>
              </tr>
            </tbody>
          </table>
        </table-wrap>
       </sec>
      <sec>
        <title>3.3. Barriers to Action</title>
        <p>Across the battery of potential barriers that have emerged from previous studies, 14 were collectively put to the test in the <italic>Living in Melbourne</italic> survey. Five clusters of barriers were evident (see <xref ref-type="table" rid="sustainability-05-01211-t009">Table 9</xref>) in explaining the gap between intentions and actions. For approximately one-quarter of households, there was no sense of ownership of the problem, driven either by their tenure status (and the issue of split incentives; that is, the landlord could benefit from any investment by the tenant) or by feeling that it is not their responsibility, that any initiative on their part would not make a difference to the wider environment and that there is no regulation requiring action on their part.</p>
        <table-wrap id="sustainability-05-01211-t009" position="float">
          <object-id pub-id-type="pii">sustainability-05-01211-t009_Table 9</object-id>
          <label>Table 9</label>
          <caption>
            <p>Barriers to actions: reasons advanced for not undertaking domestic energy and water conservation measures.</p>
          </caption>
          <table rules="all" style="border:solid thin">
            <tbody>
              <tr>
                <td align="center" valign="top"> <bold>Barrier</bold></td>
                <td align="center" valign="top">Percentage indicating that the reason either applied strongly or applied somewhat</td>
              </tr>
              <tr>
                <td colspan="2" align="center" valign="top"><bold>Ownership of problem</bold>
                </td>
              </tr>
              <tr>
                <td align="center" valign="top">Not my responsibility</td>
                <td align="center" valign="top">22.5</td>
              </tr>
              <tr>
                <td align="center" valign="top">I rent—it’s up to my landlord</td>
                <td align="center" valign="top">28.5</td>
              </tr>
              <tr>
                <td align="center" valign="top">It won’t help Melbourne’s environment</td>
                <td align="center" valign="top">19.7</td>
              </tr>
              <tr>
                <td align="center" valign="top">No regulation requiring me</td>
                <td align="center" valign="top">27.9</td>
              </tr>
              <tr>
                <td colspan="2" align="center" valign="top"><bold>Information shortage/access</bold>
                </td>
              </tr>
              <tr>
                <td align="center" valign="top">Lack of information</td>
                <td align="center" valign="top">55.4</td>
              </tr>
              <tr>
                <td align="center" valign="top">Can’t work out what’s best</td>
                <td align="center" valign="top">47.9</td>
              </tr>
              <tr>
                <td colspan="2" align="center" valign="top"><bold>Organisational challenges</bold>
                </td>
              </tr>
              <tr>
                <td align="center" valign="top">Too difficult to organise</td>
                <td align="center" valign="top">54.6</td>
              </tr>
              <tr>
                <td align="center" valign="top">Can’t work out what’s best</td>
                <td align="center" valign="top">47.9</td>
              </tr>
              <tr>
                <td align="center" valign="top">Difficult to get right tradespeople</td>
                <td align="center" valign="top">39.3</td>
              </tr>
              <tr>
                <td colspan="2" align="center" valign="top"><bold>Time constraints (level of priority)</bold>
                </td>
              </tr>
              <tr>
                <td align="center" valign="top">Planning to, but haven’t got to it yet</td>
                <td align="center" valign="top">54.4</td>
              </tr>
              <tr>
                <td align="center" valign="top">Lack of time</td>
                <td align="center" valign="top">51.1</td>
              </tr>
              <tr>
                <td colspan="2" align="center" valign="top"><bold>Financial</bold>
                </td>
              </tr>
              <tr>
                <td align="center" valign="top">Lack of money</td>
                <td align="center" valign="top">68.2</td>
              </tr>
              <tr>
                <td align="center" valign="top">Expense not worth benefits</td>
                <td align="center" valign="top">52.3</td>
              </tr>
              <tr>
                <td align="center" valign="top">I rent—it’s up to my landlord</td>
                <td align="center" valign="top">28.5</td>
              </tr>
            </tbody>
          </table>
        </table-wrap>
        <p>For those motivated to change, four barriers crop up that tend to be endorsed by at least half of the surveyed population as being significant: problems of lack of relevant information or how/where to find it; organisational challenges (<italic>i.e.</italic>, how to get it done: identifying best option from alternatives and successfully contracting to get the work done); time constraints, reflecting perhaps that environmental issues are not priority #1 in Australian households; and financial constraints—determining whether the benefits reward the financial outlay and, if so, whether funds are available at the time.</p>
      </sec>
      <sec>
        <title>3.4. Lifestyle Typologies</title>
        <p>A cluster analysis was performed using responses to five attitudinal and behavioural questions and 39 individual variables emanating from those questions. In particular, the following questions were asked:
        <list list-type="bullet">
          <list-item>
            <p>Perceived barriers to undertaking energy- and water-saving measures—respondents were asked how strongly each of the barriers applied to them, with responses obtained on a scale, with 1 = strongly applies, 2 = applies a little and 3 = does not apply (see <xref ref-type="table" rid="sustainability-05-01211-t009">Table 9</xref> for the list of barriers);</p>
          </list-item>
          <list-item>
            <p>Attitudes regarding the environment—respondents were asked to rate their agreement with each of 10 attitudes, with 1 = strongly agree and 5 = strongly disagree (see <xref ref-type="table" rid="sustainability-05-01211-t010">Table 10</xref> for list of attitudes).</p>
          </list-item>
          <list-item>
            <p>Attitudes to consumption reduction—respondents were asked to rate their agreement with each of five statements, with 1 = strongly agree and 5 = strongly disagree (See <xref ref-type="table" rid="sustainability-05-01211-t003">Table 3</xref>);</p>
          </list-item>
          <list-item>
            <p>Changes that people are prepared to make in order for there to be a clean environment—respondents were asked to rate their preparedness in eight respects, with 1 = yes, 2 = no and 3 = maybe (see <xref ref-type="table" rid="sustainability-05-01211-t005">Table 5</xref>);</p>
          </list-item>
          <list-item>
            <p>Positions that best reflect views about changing behaviour—(See <xref ref-type="table" rid="sustainability-05-01211-t006">Table 6</xref>)
          <list list-type="simple">
		  <list-item>
            <p>1 = “I will make changes when the community around me begins to change”,</p>
          </list-item>
          <list-item>
            <p>2 = “I will make changes when government introduces some regulation that requires everyone to meet a particular target”, and</p>
          </list-item>
          <list-item>
            <p>3 = “I am making changes to my behaviour now, irrespective of what other people do”.</p>
          </list-item>
        </list></p>
        </list-item>
		</list></p>
        <p>Only 441 observations were considered in the two-step cluster analysis of environmental attitudes and behaviours, because of the large number of missing values. Three clusters emerged, with the 13 most important clustering variables identified using the SPSS Variable Importance Criterion, based on <italic>p</italic>-values (see <xref ref-type="table" rid="sustainability-05-01211-t011">Table 11</xref>). Only these 13 weakly correlated variables were used to classify all respondents on the basis of their responses. Fewer classifiers resulted in unacceptably high misclassification rates, and more classifiers resulted in an increased number of missing values without a worthwhile reduction in the misclassification rate. A multinomial logistic regression was used to obtain the cluster classification, and the clusters were named in accordance with the response frequencies for the 13 most important classifiers (see <xref ref-type="table" rid="sustainability-05-01211-t012">Table 12</xref>). This model correctly classified 92.3% of the 441 complete observations, while failing to classify only 10% of the data for the original 1,250 observations as the result of missing values.</p>
        <table-wrap id="sustainability-05-01211-t010" position="float">
          <object-id pub-id-type="pii">sustainability-05-01211-t010_Table 10</object-id>
          <label>Table 10</label>
          <caption>
            <p>Attitudes regarding the environment.</p>
          </caption>
          <table rules="all" style="border:solid thin">
            <thead>
              <tr>
                <th align="left" valign="middle">Attitudes</th>
                <th align="center" valign="bottom">Percentage Agree</th>
              </tr>
            </thead>
            <tbody>
              <tr>
                <td align="left" valign="top">We are approaching the limit of the number of people the earth can support</td>
                <td align="center" valign="top">53.7</td>
              </tr>
              <tr>
                <td align="left" valign="top">The earth has plenty of natural resources, if we just earn how to develop them</td>
                <td align="center" valign="top">54.7</td>
              </tr>
              <tr>
                <td align="left" valign="top">When humans interfere with nature, it often produces disastrous consequences</td>
                <td align="center" valign="top">74.9</td>
              </tr>
              <tr>
                <td align="left" valign="top">The balance of nature is very delicate and easily upset</td>
                <td align="center" valign="top">77.7</td>
              </tr>
              <tr>
                <td align="left" valign="top">The “environmental crisis” is greatly exaggerated</td>
                <td align="center" valign="top">21.5</td>
              </tr>
              <tr>
                <td align="left" valign="top">If things continue on their present course, we will soon experience a major environmental catastrophe</td>
                <td align="center" valign="top">58.8</td>
              </tr>
              <tr>
                <td align="left" valign="top">Change is rarely for the good, and I prefer things as they are</td>
                <td align="center" valign="top">10.2</td>
              </tr>
              <tr>
                <td align="left" valign="top">The highest priority should be given to protecting the environment, even if it hurts the economy</td>
                <td align="center" valign="top">52.3</td>
              </tr>
              <tr>
                <td align="left" valign="top">There is nothing we can do about climate change—it is already too late</td>
                <td align="center" valign="top">8.3</td>
              </tr>
              <tr>
                <td align="left" valign="top">When shopping, I rarely think about how much use I’m going to get out of the things I buy</td>
                <td align="center" valign="top">15.8</td>
              </tr>
            </tbody>
          </table>
        <table-wrap-foot><fn><p>Source: the first six statements were drawn from the NEP (New Ecological Paradigm) scale [<xref ref-type="bibr" rid="B58-sustainability-05-01211">58</xref>].</p></fn></table-wrap-foot>
        </table-wrap>
        <table-wrap id="sustainability-05-01211-t011" position="float">
          <object-id pub-id-type="pii">sustainability-05-01211-t011_Table 11</object-id>
          <label>Table 11</label>
          <caption>
            <p>Analysis for top 13 discriminators based on 1,122 cluster predictions.</p>
          </caption>
          <table rules="rows" style="border:solid thin">
            <thead>
              <tr>
                <th align="left" valign="middle"> </th>
                <th colspan="4" align="center" valign="top">Percentages agree</th>
                <th colspan="4" align="center" valign="top">Percentages disagree</th>
              </tr>
              <tr>
                <th align="left" valign="top">Lifestyle cluster</th>
                <th align="center" valign="top">1</th>
                <th align="center" valign="top">2</th>
                <th align="center" valign="top">3</th>
                <th align="center" valign="top">All</th>
                <th align="center" valign="top">1</th>
                <th align="center" valign="top">2</th>
                <th align="center" valign="top">3</th>
                <th align="center" valign="top">All</th>
              </tr>
            </thead>
            <tbody>
              <tr>
                <td align="left" valign="top">Prepared to pay more tax?</td>
                <td align="center" valign="top">50</td>
                <td align="center" valign="top">1</td>
                <td align="center" valign="top">13</td>
                <td align="center" valign="top">20</td>
                <td align="center" valign="top">13</td>
                <td align="center" valign="top">96</td>
                <td align="center" valign="top">66</td>
                <td align="center" valign="top">60</td>
              </tr>
              <tr>
                <td align="left" valign="top">Prepared to pay higher charges for utilities?</td>
                <td align="center" valign="top">56</td>
                <td align="center" valign="top">4</td>
                <td align="center" valign="top">11</td>
                <td align="center" valign="top">23</td>
                <td align="center" valign="top">18</td>
                <td align="center" valign="top">90</td>
                <td align="center" valign="top">70</td>
                <td align="center" valign="top">60</td>
              </tr>
              <tr>
                <td align="left" valign="top">The environmental crisis is exaggerated</td>
                <td align="center" valign="top">2</td>
                <td align="center" valign="top">20</td>
                <td align="center" valign="top">44</td>
                <td align="center" valign="top">20</td>
                <td align="center" valign="top">89</td>
                <td align="center" valign="top">51</td>
                <td align="center" valign="top">29</td>
                <td align="center" valign="top">58</td>
              </tr>
              <tr>
                <td align="left" valign="top">Choose to buy green-labelled products</td>
                <td align="center" valign="top">86</td>
                <td align="center" valign="top">84</td>
                <td align="center" valign="top">32</td>
                <td align="center" valign="top">71</td>
                <td align="center" valign="top">0</td>
                <td align="center" valign="top">2</td>
                <td align="center" valign="top">25</td>
                <td align="center" valign="top">8</td>
              </tr>
              <tr>
                <td align="left" valign="top">Environment has highest priority even, if it hurts the economy</td>
                <td align="center" valign="top">80</td>
                <td align="center" valign="top">43</td>
                <td align="center" valign="top">32</td>
                <td align="center" valign="top">52</td>
                <td align="center" valign="top">6</td>
                <td align="center" valign="top">20</td>
                <td align="center" valign="top">35</td>
                <td align="center" valign="top">19</td>
              </tr>
              <tr>
                <td align="left" valign="top">The expense is not worth the benefits</td>
                <td align="center" valign="top">24</td>
                <td align="center" valign="top">56</td>
                <td align="center" valign="top">80</td>
                <td align="center" valign="top">52</td>
                <td align="center" valign="top">76</td>
                <td align="center" valign="top">45</td>
                <td align="center" valign="top">20</td>
                <td align="center" valign="top">49</td>
              </tr>
              <tr>
                <td align="left" valign="top">Give up using plastic bags</td>
                <td align="center" valign="top">89</td>
                <td align="center" valign="top">83</td>
                <td align="center" valign="top">35</td>
                <td align="center" valign="top">73</td>
                <td align="center" valign="top">3</td>
                <td align="center" valign="top">6</td>
                <td align="center" valign="top">26</td>
                <td align="center" valign="top">10</td>
              </tr>
              <tr>
                <td align="left" valign="top">I have more important things to do</td>
                <td align="center" valign="top">14</td>
                <td align="center" valign="top">22</td>
                <td align="center" valign="top">55</td>
                <td align="center" valign="top">28</td>
                <td align="center" valign="top">86</td>
                <td align="center" valign="top">78</td>
                <td align="center" valign="top">45</td>
                <td align="center" valign="top">72</td>
              </tr>
              <tr>
                <td align="left" valign="top">Donate an hour or two each month to do voluntary work for the environment</td>
                <td align="center" valign="top">61</td>
                <td align="center" valign="top">30</td>
                <td align="center" valign="top">16</td>
                <td align="center" valign="top">37</td>
                <td align="center" valign="top">10</td>
                <td align="center" valign="top">27</td>
                <td align="center" valign="top">57</td>
                <td align="center" valign="top">29</td>
              </tr>
              <tr>
                <td align="left" valign="top">There is no regulation requiring me to</td>
                <td align="center" valign="top">15</td>
                <td align="center" valign="top">20</td>
                <td align="center" valign="top">54</td>
                <td align="center" valign="top">27</td>
                <td align="center" valign="top">85</td>
                <td align="center" valign="top">80</td>
                <td align="center" valign="top">46</td>
                <td align="center" valign="top">73</td>
              </tr>
              <tr>
                <td align="left" valign="top">The balance of nature is very delicate and easily upset</td>
                <td align="center" valign="top">86</td>
                <td align="center" valign="top">80</td>
                <td align="center" valign="top">61</td>
                <td align="center" valign="top">77</td>
                <td align="center" valign="top">4</td>
                <td align="center" valign="top">4</td>
                <td align="center" valign="top">19</td>
                <td align="center" valign="top">8</td>
              </tr>
              <tr>
                <td align="left" valign="top">Reducing my household’s energy and water consumption is not worth the trouble</td>
                <td align="center" valign="top">2</td>
                <td align="center" valign="top">4</td>
                <td align="center" valign="top">13</td>
                <td align="center" valign="top">6</td>
                <td align="center" valign="top">97</td>
                <td align="center" valign="top">90</td>
                <td align="center" valign="top">66</td>
                <td align="center" valign="top">86</td>
              </tr>
              <tr>
                <td align="left" valign="top">It’s not my responsibility</td>
                <td align="center" valign="top">8</td>
                <td align="center" valign="top">18</td>
                <td align="center" valign="top">45</td>
                <td align="center" valign="top">22</td>
                <td align="center" valign="top">92</td>
                <td align="center" valign="top">82</td>
                <td align="center" valign="top">55</td>
                <td align="center" valign="top">78</td>
              </tr>
            </tbody>
          </table>
        </table-wrap>
        <table-wrap id="sustainability-05-01211-t012" position="float">
          <object-id pub-id-type="pii">sustainability-05-01211-t012_Table 12</object-id>
          <label>Table 12</label>
          <caption>
            <p>Cluster descriptions.</p>
          </caption>
          <table>
            <thead>
              <tr>
                <th align="center" valign="middle">Lifestyle cluster</th>
                <th align="center" valign="middle">1</th>
                <th align="center" valign="middle">2</th>
                <th align="center" valign="middle">3</th>
                <th align="center" valign="middle">All</th>
              </tr>
            </thead>
            <tbody>
              <tr>
                <td align="center" valign="middle" style="border-top:solid thin">Number of complete observations</td>
                <td align="center" valign="middle" style="border-top:solid thin">149</td>
                <td align="center" valign="middle" style="border-top:solid thin">177</td>
                <td align="center" valign="middle" style="border-top:solid thin">115</td>
                <td align="center" valign="middle" style="border-top:solid thin">441</td>
              </tr>
              <tr>
                <td align="center" valign="middle">Percentage correct classifications with 13 classifiers</td>
                <td align="center" valign="middle">93.3%</td>
                <td align="center" valign="middle">92.7%</td>
                <td align="center" valign="middle">90.4%</td>
                <td align="center" valign="middle">92.3%</td>
              </tr>
              <tr>
                <td align="center" valign="middle">Number of original observations classified</td>
                <td align="center" valign="middle">376</td>
                <td align="center" valign="middle">452</td>
                <td align="center" valign="middle">294</td>
                <td align="center" valign="middle">1122</td>
              </tr>
              <tr>
                <td align="center" valign="middle">Percentage of original classified observations</td>
                <td align="center" valign="middle">33.5%</td>
                <td align="center" valign="middle">40.3%</td>
                <td align="center" valign="middle">26.3%</td>
                <td align="center" valign="middle">100%</td>
              </tr>
              <tr>
                <td align="center" valign="middle">Cluster name</td>
                <td align="center" valign="middle">“Committed” greens</td>
                <td align="center" valign="middle">“Material” greens</td>
                <td align="center" valign="middle">“Enviro-sceptics”</td>
                <td align="center" valign="middle"> </td>
              </tr>
            </tbody>
          </table>
        </table-wrap>
        <p><xref ref-type="table" rid="sustainability-05-01211-t012">Table 12</xref> shows that the majority (40.3%) of people who responded to this survey were assigned to a “material” greens cluster, with 33.5% assigned to a “committed” greens cluster and 26.3% assigned to an “enviro-sceptics” cluster.</p>
      </sec>
      <sec>
        <title>Cluster 1: “Committed” Greens</title>
        <p>This is the only group prepared to pay more tax if it would benefit the environment (50%), as well as higher utility charges (56%), that is, indicating a willingness to personally outlay hard cash if environmental benefits will accrue. There is a high percentage agreeing that the environment should be the highest priority, even if it hurts the economy (80%). This group also strongly disagrees (76%) that the expense is not worth the benefits, affirming the need for the environment to take higher priority over the economy.</p>
        <p>This group is highly consistent with its “green choice” stated behaviours related to the purchase of green-labelled products, declining use of plastic bags and volunteering time for green projects. In terms of environmental beliefs, it strongly disagrees with statements such as “The environmental crisis is exaggerated”, “I have more important things to do”, “There is no regulation requiring me to”, “Reducing my household’s energy and water consumption is not worth the trouble” and “It’s not my responsibility”.</p>
        <p>On the basis of the response profile of this group of respondents, the cluster is labelled as “committed” green: strongly pro-environment in beliefs, in behavioural preferences and indicating a preparedness to sacrifice economically for an environmental benefit.</p>
      </sec>
      <sec>
        <title>Cluster 2: “Material” Greens</title>
        <p>Among this group, there is a moderate level of support for the view that the environment should have a high priority <italic>vis-à-vis</italic> the economy and a sense that the balance of nature is delicate and easily upset, but 56% agree that the expense is probably not worth the benefits and—as a bottom line position —<italic>they</italic> are not willing to pay! This group is vehemently opposed to paying more taxes or higher utility charges (96% and 90%, respectively) from their household budget.</p>
        <p>The group will be pro-purchase of green-labelled products and will avoid use of plastic bags, but is unlikely to donate the hours to voluntary environmental work that characterises the “committed” green cluster of households—although more generous than the “enviro-sceptics”. In terms of environmental beliefs, it tends to fall between the two. The group tends to be one that views the environment as important, but not worth paying for, especially by themselves as individuals, either in terms of dollars or time—basically, only when it does not “cost” them. This cluster has been termed the “material” greens.</p>
      </sec>
      <sec>
        <title>Cluster 3: “Enviro-Sceptics”</title>
        <p>This group indicates a low level of preparedness to make higher personal payments for the environment, and there is a high level of agreement that the expense would not be worth the benefits. It also has the lowest level of agreement with propositions that the environment should be the highest priority. This translates into attitudes and practices against what could be termed “green choices”, having the lowest proportions choosing to buy green-labelled products, giving up plastic bags and donating time for voluntary environmental projects.</p>
        <p>In terms of environmental beliefs, a relatively high percentage believe (agree) that the environmental crisis is exaggerated (44%), that they have more important things to focus on (55%), that there is no regulation requiring them to (54%) and that it’s not their responsibility (45%). This cluster has been labelled “enviro-sceptics”.</p>
      </sec>
    </sec>
    <sec>
      <title>4. Lifestyle and Consumption</title>
      <p>How does <italic>actual consumption</italic> vary for these three clusters? A multivariate general linear model analysis performed using the five per capita consumption measures defined previously suggested some small significant differences between the clusters (<italic>F</italic>(10,1430) = 2.99, <italic>p</italic> = 0.001, partial eta-squared = 0.021), but only in the case of the carbon intensity of travel and per capita appliance consumption (see <xref ref-type="table" rid="sustainability-05-01211-t013">Table 13</xref>). Appliance consumption was highest for the “enviro-sceptics” and lowest for the “material” greens, while carbon intensity of travel was highest for the “material” greens and lowest for the “committed” greens. However, a univariate general linear model analysis for the total of these consumption measures (after standardisation) showed no significant difference between the clusters (see <xref ref-type="table" rid="sustainability-05-01211-t013">Table 13</xref>). <italic>Lifestyles</italic> characterised by pro-environmental values, attitudes and intentions did not reflect actual low <italic>consumption behaviour</italic>.</p>
      <table-wrap id="sustainability-05-01211-t013" position="float">
        <object-id pub-id-type="pii">sustainability-05-01211-t013_Table 13</object-id>
        <label>Table 13</label>
        <caption>
          <p>Lifestyle cluster comparisons in regard to per capita consumption.</p>
        </caption>
        <table>
          <thead>
            <tr>
              <th align="center" valign="middle"> </th>
              <th colspan="3" align="center" valign="middle">ANOVA test of significance</th>
              <th colspan="3" align="center" valign="middle">Lifestyle cluster means</th>
            </tr>
          </thead>
          <tbody>
            <tr>
              <td align="center" valign="middle" style="border-top:solid thin">Per capita consumption measure</td>
              <td align="center" valign="middle" style="border-top:solid thin">F-value</td>
              <td align="center" valign="middle" style="border-top:solid thin"><italic>p</italic>-value</td>
              <td align="center" valign="middle" style="border-top:solid thin">Effect size (eta-squared)</td>
              <td align="center" valign="middle" style="border-top:solid thin">“Committed” greens</td>
              <td align="center" valign="middle" style="border-top:solid thin">“Material” greens</td>
              <td align="center" valign="middle" style="border-top:solid thin">“Enviro-sceptics”</td>
            </tr>
            <tr>
              <td align="center" valign="middle" style="border-top:solid thin">Water ($)</td>
              <td align="center" valign="middle" style="border-top:solid thin">F(2,843) = 0.87</td>
              <td align="center" valign="middle" style="border-top:solid thin">0.419 </td>
              <td align="center" valign="middle" style="border-top:solid thin">0.002</td>
              <td align="center" valign="middle" style="border-top:solid thin">58.7</td>
              <td align="center" valign="middle" style="border-top:solid thin">55.0</td>
              <td align="center" valign="middle" style="border-top:solid thin">55.1</td>
            </tr>
            <tr>
              <td align="center" valign="middle">Energy ($)</td>
              <td align="center" valign="middle">F(2,814) = 2.36</td>
              <td align="center" valign="middle">0.095 </td>
              <td align="center" valign="middle">0.006</td>
              <td align="center" valign="middle">123.4</td>
              <td align="center" valign="middle">123.9</td>
              <td align="center" valign="middle">137.5</td>
            </tr>
            <tr>
              <td align="center" valign="middle">Appliances (number)</td>
              <td align="center" valign="middle">F(2,1119) = 13.60</td>
              <td align="center" valign="middle">&lt;0.001</td>
              <td align="center" valign="middle">0.024</td>
              <td align="center" valign="middle">4.82</td>
              <td align="center" valign="middle">4.78</td>
              <td align="center" valign="middle">4.95</td>
            </tr>
            <tr>
              <td align="center" valign="middle">Carbon intensity of travel score</td>
              <td align="center" valign="middle">F(2,1099) = 6.27</td>
              <td align="center" valign="middle">0.002</td>
              <td align="center" valign="middle">0.011</td>
              <td align="center" valign="middle">17.0</td>
              <td align="center" valign="middle">19.4</td>
              <td align="center" valign="middle">17.8</td>
            </tr>
            <tr>
              <td align="center" valign="middle">Housing space (m<sup>2</sup>)</td>
              <td align="center" valign="middle">F(2,1103) = 0.74</td>
              <td align="center" valign="middle">0.479</td>
              <td align="center" valign="middle">0.001</td>
              <td align="center" valign="middle">97.2</td>
              <td align="center" valign="middle">91.6</td>
              <td align="center" valign="middle">101.3</td>
            </tr>
            <tr>
              <td align="center" valign="middle">Total consumption score</td>
              <td align="center" valign="middle">F(2,719) = 0.23</td>
              <td align="center" valign="middle">0.799</td>
              <td align="center" valign="middle">0.001</td>
              <td align="center" valign="middle">0.244</td>
              <td align="center" valign="middle">0.129</td>
              <td align="center" valign="middle">0.312</td>
            </tr>
          </tbody>
        </table>
      </table-wrap>
      <p>Next, the clusters were compared in terms of urban <italic>location</italic>. <xref ref-type="table" rid="sustainability-05-01211-t014">Table 14</xref> suggests that there is some geographical segregation (Chi-Sq = 35.7, df = 4, <italic>p</italic> &lt; 0.001). Half of the “committed” greens live in the Inner City suburbs (where, in recent years, the Greens Party has become politically dominant), while the “material” greens tend to live in greenfields and outer suburban areas—the group that political commentators have termed as “aspirational” in terms of their ambition to “get ahead” in life. The “enviro-sceptics” cluster is dispersed across the city.</p>
      <table-wrap id="sustainability-05-01211-t014" position="float">
        <object-id pub-id-type="pii">sustainability-05-01211-t014_Table 14</object-id>
        <label>Table 14</label>
        <caption>
          <p>Demographic profiles for each lifestyle cluster.</p>
        </caption>
        <table rules="all" style="border:solid thin">
          <thead>
            <tr>
              <th rowspan="2" align="left" valign="top"> Lifestyle cluster</th>
              <th colspan="4" align="center" valign="top">Percentage of cluster members </th>
              <th rowspan="2" align="center" valign="top">Degrees freedom</th>
              <th rowspan="2" align="center" valign="top">Chi-Square</th>
            </tr>
            <tr>
              <th align="center" valign="top">Committedgreens</th>
              <th align="center" valign="top">Material greens</th>
              <th align="center" valign="top">Enviro-sceptics</th>
              <th align="center" valign="top"> All</th>
            </tr>
          </thead>
          <tbody>
            <tr>
              <td align="left" valign="top">University graduates</td>
              <td align="center" valign="top">62</td>
              <td align="center" valign="top">35</td>
              <td align="center" valign="top">43</td>
              <td align="center" valign="top">46</td>
              <td rowspan="2" align="center" valign="top">2</td>
              <td rowspan="2" align="center" valign="top">57.5***</td>
            </tr>
            <tr>
              <td align="left" valign="top">Not university graduates</td>
              <td align="center" valign="top">38</td>
              <td align="center" valign="top">65</td>
              <td align="center" valign="top">57</td>
              <td align="center" valign="top">54</td>
            </tr>
            <tr>
              <td align="left" valign="top">Females</td>
              <td align="center" valign="top">64</td>
              <td align="center" valign="top">66</td>
              <td align="center" valign="top">44</td>
              <td align="center" valign="top">60</td>
              <td rowspan="2" align="center" valign="top">2</td>
              <td rowspan="2" align="center" valign="top">39.3***</td>
            </tr>
            <tr>
              <td align="left" valign="top">Males</td>
              <td align="center" valign="top">36</td>
              <td align="center" valign="top">34</td>
              <td align="center" valign="top">56</td>
              <td align="center" valign="top">40</td>
            </tr>
            <tr>
              <td align="left" valign="top">Under 45</td>
              <td align="center" valign="top">51</td>
              <td align="center" valign="top">54</td>
              <td align="center" valign="top">41</td>
              <td align="center" valign="top">49</td>
              <td rowspan="2" align="center" valign="top">8</td>
              <td rowspan="2" align="center" valign="top">25.7**</td>
            </tr>
            <tr>
              <td align="left" valign="top">45 and over</td>
              <td align="center" valign="top">49</td>
              <td align="center" valign="top">46</td>
              <td align="center" valign="top">59</td>
              <td align="center" valign="top">51</td>
            </tr>
            <tr>
              <td align="left" valign="top">Live alone</td>
              <td align="center" valign="top">27</td>
              <td align="center" valign="top">22</td>
              <td align="center" valign="top">24</td>
              <td align="center" valign="top">24</td>
              <td rowspan="3" align="center" valign="top">18</td>
              <td rowspan="3" align="center" valign="top">35.1**</td>
            </tr>
            <tr>
              <td align="left" valign="top">Couple with no children</td>
              <td align="center" valign="top">36</td>
              <td align="center" valign="top">29</td>
              <td align="center" valign="top">38</td>
              <td align="center" valign="top">34</td>
            </tr>
            <tr>
              <td align="left" valign="top">Family with children</td>
              <td align="center" valign="top">30</td>
              <td align="center" valign="top">42</td>
              <td align="center" valign="top">32</td>
              <td align="center" valign="top">35</td>
            </tr>
            <tr>
              <td align="left" valign="top"> <bold>Lifestyle cluster</bold></td>
              <td colspan="4" align="center" valign="top"><bold>Percentage of cluster members </bold>
              </td>
              <td align="center" valign="top"><bold>Degrees freedom</bold>
              </td>
              <td align="center" valign="top"><bold>Chi-Square</bold>
              </td>
            </tr>
            <tr>
              <td align="left" valign="top">Household income under $60,000 p.a.</td>
              <td align="center" valign="top">28</td>
              <td align="center" valign="top">39</td>
              <td align="center" valign="top">36</td>
              <td align="center" valign="top">34</td>
              <td rowspan="3" align="center" valign="top">10</td>
              <td rowspan="3" align="center" valign="top">19.0*</td>
            </tr>
            <tr>
              <td align="left" valign="top">Household income $60,000–$120,000 p.a.</td>
              <td align="center" valign="top">44</td>
              <td align="center" valign="top">40</td>
              <td align="center" valign="top">39</td>
              <td align="center" valign="top">41</td>
            </tr>
            <tr>
              <td align="left" valign="top">Household income over $120,000 p.a.</td>
              <td align="center" valign="top">29</td>
              <td align="center" valign="top">22</td>
              <td align="center" valign="top">25</td>
              <td align="center" valign="top">25</td>
            </tr>
            <tr>
              <td align="left" valign="top">Inner City Suburbs</td>
              <td align="center" valign="top">50</td>
              <td align="center" valign="top">34</td>
              <td align="center" valign="top">43</td>
              <td align="center" valign="top">42</td>
              <td rowspan="3" align="center" valign="top">4</td>
              <td rowspan="3" align="center" valign="top">35.7***</td>
            </tr>
            <tr>
              <td align="left" valign="top">Middle City Suburbs</td>
              <td align="center" valign="top">26</td>
              <td align="center" valign="top">24</td>
              <td align="center" valign="top">25</td>
              <td align="center" valign="top">25</td>
            </tr>
            <tr>
              <td align="left" valign="top">Outer City Suburbs</td>
              <td align="center" valign="top">23</td>
              <td align="center" valign="top">42</td>
              <td align="center" valign="top">32</td>
              <td align="center" valign="top">33</td>
            </tr>
          </tbody>
        </table>
      <table-wrap-foot><fn><p>***<italic>p</italic> &lt; 0.001, **<italic>p</italic> &lt; 0.01, *<italic>p</italic> &lt; 0.05.</p></fn></table-wrap-foot>
      </table-wrap>
      <p>Are there significant <italic>socio-demographic</italic> differences for these three clusters of people? Indeed, there are. <xref ref-type="table" rid="sustainability-05-01211-t014">Table 14</xref> suggests significant differences for age, gender, level of education, household income, family structure and suburb location. However, there was no significant difference for country of birth (Australia <italic>versus</italic> overseas).</p>
      <p>The “committed” greens cluster contained more university graduates and households with higher incomes. They know what behaviours are likely to be required in a climate- and resource-constrained future and have a financial capacity to embark on that transition. The “material” greens households, by comparison, had the lowest proportion of university graduates, were the youngest category of households and also tended to be on lower household incomes. The “enviro-sceptics” cluster contained more men and those aged 45 and over than either of the other clusters. Although the “enviro-sceptics” and “material” greens clusters tend to have similar incomes, the latter cluster is more likely to consist of households with children, which could have had some influence on their pro-environment attitude. </p>
      <p>Overall, it seems that the “committed” greens cluster can afford to have “green” attitudes and “green” behaviours. Low consumption in the case of carbon intensity of personal travel suggests that this cluster is making an effort to reduce consumption in some areas—by virtue of where they live in the city—but in other areas appears to be doing no better than the other clusters. The “material” greens cluster also has sympathy with the environment, but these households feel that their limited budget does not allow them to pay higher rates or taxes in order to help the environment. As indicated in <xref ref-type="table" rid="sustainability-05-01211-t013">Table 13</xref>, they have the lowest per capita consumption of appliances (reflecting the “averaging out” effect of families with children identified earlier), but in other areas, their consumption is no lower than the other clusters; in fact, their carbon intensity of travel is particularly high—reflecting the car dependency of households in the outer suburbs. Finally, the older, male-dominated “enviro-sceptics” cluster tends not to care about the environment as much as the other clusters, but, surprisingly, the total consumption score does not appear to be significantly higher for these households, although their mean total consumption score is highest overall.</p>
    </sec>
    <sec sec-type="conclusions">
      <title>5. Conclusions</title>
      <p>Changing behaviour, which involves winding back currently unsustainable levels of resource consumption, has the prospect of making an impact much more rapidly than most, if not all, supply-side responses, although both clearly need to be operating in tandem if the 21st century is to deliver a sustainable platform of urban living. It is the relative speed with which individuals and households can potentially decide to stop or significantly alter a range of domestic practices—related to their choice of housing, mode and frequency of travel, energy and water use habits, appliance purchases (number and environmental performance)—that makes “social marketing” so attractive to governments. An ability to get households to change aspects of their behaviour voluntarily via engagement processes that seek to provide the social, environmental and economic narrative for change and the processes (“steps”) by which this can be achieved would obviate governments having to pursue less politically attractive and costly paths (such as taxation, regulation and incentives) to secure more sustainable patterns of consumption.</p>
      <p>This paper has found that voluntary change will be no easy task. Actions speak louder than words. </p>
      <p>The research has demonstrated that there is a gap between intentions and actions. Segmentation of the <italic>Living in Melbourne</italic> sample of households into lifestyle groups based on their responses to a battery of questions probing environmental sustainability-related values, attitudes and intentions produced three archetypal clusters: “committed” greens, “material” greens and “enviro-sceptics”. Each cluster was also found to be distinctive on a range of socio-demographic variables that further validated the typology. Commonalities with similar typologies elicited for the UK, USA and NSW (Australia) are strong. On the basis of the <italic>Living in Melbourne</italic> survey, only one-third of households (the “committed” greens) would currently appear to be prepared to voluntarily change their consumption behaviour and bear the direct economic consequences. However, when it came to examining the extent to which actual consumption behaviour varied across the three clusters, there was little or no differentiation evident.</p>
      <p>The reasons why there is currently a gap between intentions, on the one hand, and action, on the other, are to be found in the range of current barriers to sustainable consumption that need to be overcome. These include: problems of lack of relevant information or how/where to find it; organisational challenges, <italic>i.e.</italic>, how to get it done; time constraints; and financial constraints—determining whether the benefits reward the financial outlay. At a pragmatic level, there remains a lack of information on what can be done and how best to get it done. For individuals and households, comfort, convenience and cost factors seem to underpin many of the habits and practices that currently promote consumption of urban resources in Australia. The issue of sustainable consumption would appear to be more deeply rooted within 21st century society, however. High income societies are now over-reliant on consumption as an engine for growth—and developing economies are being encouraged to follow suit. Social norms relating to sustainable consumption are yet to materialise in high income societies, such as Australia, that would constitute an important influence on the voluntary behaviour of individuals and households. A culture of unsustainable consumption is reflected in a dominant set of behaviours at present. And it appears to be embracing all segments of the population, including those who espouse green attitudes, opinions and intentions. It is here that social practices research can add value to our understanding by probing more deeply into these lifestyle segments to explore whether consumption related habits and activities are also held in common. Whether imminent system failure will be required to trigger a “tipping point” in societal values associated with environment and consumption remains an open question (witness the increasing number of well-credentialed reports emerging of a future “4° world”). This is a major reason why supply-side urban sustainability initiatives need to proceed apace, why governments need to remain actively involved in regulation, pricing and incentive programs and why research that spans the cognitive-social spectrum of consumption must continue to search for triggers for effective behaviour change. Understanding urban consumption is clearly a more complex challenge than a market segmentation approach alone can address.</p>
    </sec>
    </body>
  <back>
    <ack>
      <title>Acknowledgements</title>
      <p>Funding for this research was from Australian Research Council Discovery Project DP 0878231, <italic>Consuming the Urban Environment: A Study of the Factors That Influence Resource Use in Australian Cities</italic>. The authors acknowledge the contributions of Terry Burke and Maryann Wulff to the development of the <italic>Living in Melbourne</italic> survey that provided the data for this paper.</p>
    </ack>
    <notes>
      <title>Conflict of Interest</title>
      <p>The authors declare no conflict of interest.</p>
    </notes>
    <ref-list>
      <title>References and Notes</title>
      <ref id="B1-sustainability-05-01211">
        <label>1.</label>
        <citation citation-type="book">
          <collab>OECD</collab>
          <source>Environmental outlook to 2030</source>
          <publisher-name>Organisation for Economic Co-operation and Development</publisher-name>
          <publisher-loc>Paris, France</publisher-loc>
          <year>2008</year>
        </citation>
      </ref>
      <ref id="B2-sustainability-05-01211">
        <label>2.</label>
        <citation citation-type="journal">
          <person-group person-group-type="author">
            <name>
              <surname>Newton</surname>
              <given-names>P.</given-names>
            </name>
          </person-group>
          <article-title>Liveable <italic>and</italic> sustainable? Sociotechnical challenges for 21st century cities</article-title>
          <source>J. Urban Technol.</source>
          <year>2011</year>
          <volume>19</volume>
          <fpage>81</fpage>
          <lpage>102</lpage>
          <pub-id pub-id-type="doi">10.1080/10630732.2012.626703</pub-id>
        </citation>
      </ref>
      <ref id="B3-sustainability-05-01211">
        <label>3.</label>
        <citation citation-type="confproc">
          <person-group person-group-type="author">
            <name>
              <surname>Robinson</surname>
              <given-names>J.</given-names>
            </name>
            <name>
              <surname>Tinker</surname>
              <given-names>J.</given-names>
            </name>
          </person-group>
          <article-title>Reconciling ecological, economic and social imperatives</article-title>
          <source>Proceedings of the Cornerstone of Development: Integrating Environmental, Social and Economic Policies</source>
          <person-group person-group-type="editor">
            <name>
              <surname>Schnurr</surname>
              <given-names>J.</given-names>
            </name>
            <name>
              <surname>Holtz</surname>
              <given-names>S.</given-names>
            </name>
          </person-group>
          <publisher-name>Lewis</publisher-name>
          <publisher-loc>Boca Raton, FL, USA</publisher-loc>
          <year>1998</year>
          <fpage>9</fpage>
          <lpage>43</lpage>
        </citation>
      </ref>
      <ref id="B4-sustainability-05-01211">
        <label>4.</label>
        <citation citation-type="journal">
          <person-group person-group-type="author">
            <name>
              <surname>Pacala</surname>
              <given-names>S.</given-names>
            </name>
            <name>
              <surname>Socolow</surname>
              <given-names>R.</given-names>
            </name>
          </person-group>
          <article-title>Stabilization wedges: solving the climate problem for the next 50 years with current technologies</article-title>
          <source>Science</source>
          <year>2004</year>
          <volume>305</volume>
          <fpage>968</fpage>
          <lpage>972</lpage>
          <pub-id pub-id-type="doi">10.1126/science.1100103</pub-id>
        </citation>
      </ref>
      <ref id="B5-sustainability-05-01211">
        <label>5.</label>
        <citation citation-type="journal">
          <person-group person-group-type="author">
            <name>
              <surname>Lorenzoni</surname>
              <given-names>I.</given-names>
            </name>
            <name>
              <surname>Nicholson-Cole</surname>
              <given-names>S.</given-names>
            </name>
            <name>
              <surname>Whitmarsh</surname>
              <given-names>L.</given-names>
            </name>
          </person-group>
          <article-title>Barriers perceived to engaging with climate change among the UK public and their policy implications</article-title>
          <source>Global Environ. Chang.</source>
          <year>2007</year>
          <volume>17</volume>
          <fpage>445</fpage>
          <lpage>459</lpage>
          <pub-id pub-id-type="doi">10.1016/j.gloenvcha.2007.01.004</pub-id>
        </citation>
      </ref>
      <ref id="B6-sustainability-05-01211">
        <label>6.</label>
        <citation citation-type="journal">
          <person-group person-group-type="author">
            <name>
              <surname>Gilg</surname>
              <given-names>A.</given-names>
            </name>
            <name>
              <surname>Barr</surname>
              <given-names>S.</given-names>
            </name>
          </person-group>
          <article-title>Behavioural attitudes towards water saving: evidence from a study of environmental actions</article-title>
          <source>Ecol. Econ.</source>
          <year>2006</year>
          <volume>57</volume>
          <fpage>400</fpage>
          <lpage>414</lpage>
          <pub-id pub-id-type="doi">10.1016/j.ecolecon.2005.04.010</pub-id>
        </citation>
      </ref>
      <ref id="B7-sustainability-05-01211">
        <label>7.</label>
        <citation citation-type="book">
          <person-group person-group-type="author">
            <name>
              <surname>Soderholm</surname>
              <given-names>P.</given-names>
            </name>
          </person-group>
          <source>Environmental Policy in Household Behaviour</source>
          <publisher-name>Earthscan</publisher-name>
          <publisher-loc>London, UK</publisher-loc>
          <year>2010</year>
        </citation>
      </ref>
      <ref id="B8-sustainability-05-01211">
        <label>8.</label>
        <citation citation-type="book">
          <person-group person-group-type="author">
            <name>
              <surname>Fielding</surname>
              <given-names>K.S.</given-names>
            </name>
            <name>
              <surname>Louis</surname>
              <given-names>W.R.</given-names>
            </name>
            <name>
              <surname>Warren</surname>
              <given-names>C.</given-names>
            </name>
            <name>
              <surname>Thompson</surname>
              <given-names>A.</given-names>
            </name>
          </person-group>
          <article-title>Understanding household attitudes and behaviours towards waste, water and energy conservation</article-title>
          <source>Urban Consumption</source>
          <person-group person-group-type="editor">
            <name>
              <surname>Newton</surname>
              <given-names>P.</given-names>
            </name>
          </person-group>
          <publisher-name>CSIRO Publishing</publisher-name>
          <publisher-loc>Melbourne, Australia</publisher-loc>
          <year>2011</year>
          <fpage>199</fpage>
          <lpage>214</lpage>
        </citation>
      </ref>
      <ref id="B9-sustainability-05-01211">
        <label>9.</label>
        <citation citation-type="journal">
          <person-group person-group-type="author">
            <name>
              <surname>Curran</surname>
              <given-names>S.R.</given-names>
            </name>
            <name>
              <surname>de Sherbinin</surname>
              <given-names>A.</given-names>
            </name>
          </person-group>
          <article-title>Completing the picture: the challenges of bringing “consumption” into the population equation environment</article-title>
          <source>Popul. Environ.</source>
          <year>2004</year>
          <volume>26</volume>
          <fpage>107</fpage>
          <lpage>131</lpage>
          <pub-id pub-id-type="doi">10.1007/s11111-004-0837-x</pub-id>
        </citation>
      </ref>
      <ref id="B10-sustainability-05-01211">
        <label>10.</label>
        <citation citation-type="book">
          <collab>UNEP</collab>
          <source>Visions for Change: Recommendations for Effective Policies on Sustainable Lifestyles</source>
          <publisher-name>United Nations Environment Programme</publisher-name>
          <publisher-loc>Paris, France</publisher-loc>
          <year>2011</year>
        </citation>
      </ref>
      <ref id="B11-sustainability-05-01211">
        <label>11.</label>
        <citation citation-type="book">
          <collab>UNEP</collab>
          <source>Taskforce on Sustainable Lifestyles</source>
          <publisher-name>United Nations Environment Programme</publisher-name>
          <publisher-loc>Paris, France</publisher-loc>
          <year>2011</year>
        </citation>
      </ref>
      <ref id="B12-sustainability-05-01211">
        <label>12.</label>
        <citation citation-type="journal">
          <person-group person-group-type="author">
            <name>
              <surname>Heiskanen</surname>
              <given-names>E.</given-names>
            </name>
            <name>
              <surname>Pantzar</surname>
              <given-names>M.</given-names>
            </name>
          </person-group>
          <article-title>Toward sustainable consumption: two new perspectives</article-title>
          <source>J. Consum. Policy</source>
          <year>1997</year>
          <volume>20</volume>
          <fpage>409</fpage>
          <lpage>442</lpage>
          <pub-id pub-id-type="doi">10.1023/A:1006862631698</pub-id>
        </citation>
      </ref>
      <ref id="B13-sustainability-05-01211">
        <label>13.</label>
        <citation citation-type="book">
          <person-group person-group-type="author">
            <name>
              <surname>Voronoff</surname>
              <given-names>D.</given-names>
            </name>
          </person-group>
          <source>Community Sustainability: A Review of What Works and How It Is Practiced in Victoria</source>
          <publisher-name>Environment Victoria</publisher-name>
          <publisher-loc>Melbourne, Australia</publisher-loc>
          <year>2005</year>
        </citation>
      </ref>
      <ref id="B14-sustainability-05-01211">
        <label>14.</label>
        <citation citation-type="book">
          <collab>Allen Consulting Group</collab>
          <source>Mandatory Disclosure of Communal Office Builders Energy Efficiency</source>
          <publisher-name>Report to Commonwealth Department of Environment, Water, Heritage and the Arts</publisher-name>
          <publisher-loc>Sydney, Australia</publisher-loc>
          <year>2008</year>
        </citation>
      </ref>
      <ref id="B15-sustainability-05-01211">
        <label>15.</label>
        <citation citation-type="web">
          <article-title>Earth Hour</article-title>
          <comment>Available online:<ext-link xmlns:xlink="http://www.w3.org/1999/xlink" xlink:href="http://www.earthhour.org/" ext-link-type="uri">http://www.earthhour.org/</ext-link></comment>
          <access-date>(accessed on 7 March 2013)</access-date>
          </citation>
      </ref>
      <ref id="B16-sustainability-05-01211">
        <label>16.</label>
        <citation citation-type="web">
          <article-title>Black Baloons</article-title>
          <comment>Available online:<ext-link xmlns:xlink="http://www.w3.org/1999/xlink" xlink:href="http://www.savepower.nsw.gov.au/about/about-save-power/whats-a-black-balloon-.aspx/" ext-link-type="uri">http://www.savepower.nsw.gov.au/about/about-save-power/whats-a-black-balloon-.aspx/</ext-link></comment>
          <access-date>(accessed on 7 March 2013)</access-date>
          </citation>
      </ref>
      <ref id="B17-sustainability-05-01211">
        <label>17.</label>
        <citation citation-type="journal">
          <person-group person-group-type="author">
            <name>
              <surname>Hobson</surname>
              <given-names>K.</given-names>
            </name>
          </person-group>
          <article-title>Competing discourses of sustainable consumption: does the “rationalisation of lifestyles” make sense?</article-title>
          <source>Environ. Politics</source>
          <year>2002</year>
          <volume>11</volume>
          <fpage>95</fpage>
          <lpage>120</lpage>
          <pub-id pub-id-type="doi">10.1080/714000601</pub-id>
        </citation>
      </ref>
      <ref id="B18-sustainability-05-01211">
        <label>18.</label>
        <citation citation-type="book">
          <collab>Sustainable Consumption Roundtable</collab>
          <source>I Will if You Will: Towards Sustainable Consumption</source>
          <publisher-name>Sustainable Development Commission</publisher-name>
          <publisher-loc>London, UK</publisher-loc>
          <year>2006</year>
        </citation>
      </ref>
      <ref id="B19-sustainability-05-01211">
        <label>19.</label>
        <citation citation-type="book">
          <person-group person-group-type="author">
            <name>
              <surname>Sarkissian</surname>
              <given-names>W.</given-names>
            </name>
            <name>
              <surname>Hofer</surname>
              <given-names>N.</given-names>
            </name>
            <name>
              <surname>Shore</surname>
              <given-names>Y.</given-names>
            </name>
            <name>
              <surname>Vajda</surname>
              <given-names>S.</given-names>
            </name>
            <name>
              <surname>Wilkinson</surname>
              <given-names>C.</given-names>
            </name>
          </person-group>
          <source>Kitchen Table Sustainability: Practical Recipes for Community Engagement with Sustainability</source>
          <publisher-name>Earthscan</publisher-name>
          <publisher-loc>London, UK</publisher-loc>
          <year>2008</year>
        </citation>
      </ref>
      <ref id="B20-sustainability-05-01211">
        <label>20.</label>
        <citation citation-type="journal">
          <person-group person-group-type="author">
            <name>
              <surname>McKenzie-Mohr</surname>
              <given-names>D.</given-names>
            </name>
          </person-group>
          <article-title>Promoting sustainable behaviour: an introduction to community-based social marketing</article-title>
          <source>J. Soc. Issues</source>
          <year>2000</year>
          <volume>55</volume>
          <fpage>543</fpage>
          <lpage>554</lpage>
        </citation>
      </ref>
      <ref id="B21-sustainability-05-01211">
        <label>21.</label>
        <citation citation-type="web">
          <person-group person-group-type="author">
            <name>
              <surname>Robinson</surname>
              <given-names>L.</given-names>
            </name>
          </person-group>
          <article-title>Introduction to the five doors model</article-title>
          <source>Enabling Change</source>
          <year>2007</year>
          <comment>Available online:<ext-link xmlns:xlink="http://www.w3.org/1999/xlink" xlink:href="http://www.enablingchange.com.au/" ext-link-type="uri">http://www.enablingchange.com.au/</ext-link></comment>
          <access-date>(accessed on 18 December 2012)</access-date>
          </citation>
      </ref>
      <ref id="B22-sustainability-05-01211">
        <label>22.</label>
        <citation citation-type="web">
          <article-title>Green Street</article-title>
          <comment>Available online:<ext-link xmlns:xlink="http://www.w3.org/1999/xlink" xlink:href="http://www.greenstreet.net.au/" ext-link-type="uri">http://www.greenstreet.net.au/</ext-link></comment>
          <access-date>(accessed on 18 December 2012)</access-date>
          </citation>
      </ref>
      <ref id="B23-sustainability-05-01211">
        <label>23.</label>
        <citation citation-type="book">
          <person-group person-group-type="author">
            <name>
              <surname>Earls</surname>
              <given-names>M.</given-names>
            </name>
          </person-group>
          <source>HERD: How to Change Mass Behaviour by Harnessing our True Nature</source>
          <publisher-name>John Wiley and Sons</publisher-name>
          <publisher-loc>Chichester, UK</publisher-loc>
          <year>2007</year>
        </citation>
      </ref>
      <ref id="B24-sustainability-05-01211">
        <label>24.</label>
        <citation citation-type="journal">
          <person-group person-group-type="author">
            <name>
              <surname>Seyfang</surname>
              <given-names>G.</given-names>
            </name>
            <name>
              <surname>Haxeltine</surname>
              <given-names>A.</given-names>
            </name>
          </person-group>
          <article-title>Growing grassroots innovations: exploring the role of community based initiatives in governing sustainable energy transitions</article-title>
          <source>Environ. Plann. C</source>
          <year>2012</year>
          <volume>30</volume>
          <fpage>381</fpage>
          <lpage>400</lpage>
        </citation>
      </ref>
      <ref id="B25-sustainability-05-01211">
        <label>25.</label>
        <citation citation-type="journal">
          <person-group person-group-type="author">
            <name>
              <surname>Plummer</surname>
              <given-names>J.</given-names>
            </name>
          </person-group>
          <article-title>The concept and application of lifestyle segmentation</article-title>
          <source>J. Marketing</source>
          <year>1974</year>
          <volume>38</volume>
          <fpage>33</fpage>
          <lpage>39</lpage>
          <pub-id pub-id-type="doi">10.2307/1250164</pub-id>
        </citation>
      </ref>
      <ref id="B26-sustainability-05-01211">
        <label>26.</label>
        <citation citation-type="book">
          <person-group person-group-type="author">
            <name>
              <surname>Evans</surname>
              <given-names>D.</given-names>
            </name>
            <name>
              <surname>Jackson</surname>
              <given-names>T.</given-names>
            </name>
          </person-group>
          <source>Towards a Sociology of Sustainable Lifestyles</source>
          <series>RESOLVE Working Paper 03–07</series>
          <publisher-name>Research Group on Lifestyles, Values and Environment, University of Surrey</publisher-name>
          <publisher-loc>Guildford, UK</publisher-loc>
          <year>2007</year>
          </citation>
      </ref>
      <ref id="B27-sustainability-05-01211">
        <label>27.</label>
        <citation citation-type="thesis">
          <person-group person-group-type="author">
            <name>
              <surname>Gust</surname>
              <given-names>I.</given-names>
            </name>
          </person-group>
          <article-title>Strategies to promote sustainable consumer behaviour: the use of the lifestyle approach</article-title>
          <source>MSc Thesis</source>
          <publisher-name>Lund University</publisher-name>
          <publisher-loc>Sweden</publisher-loc>
          <year>2004</year>
        </citation>
      </ref>
      <ref id="B28-sustainability-05-01211">
        <label>28.</label>
        <citation citation-type="journal">
          <person-group person-group-type="author">
            <name>
              <surname>Peichl</surname>
              <given-names>T.</given-names>
            </name>
          </person-group>
          <article-title>Between adventurers and realists</article-title>
          <source>Gfk insite</source>
          <year>2007</year>
          <volume>4</volume>
          <fpage>28</fpage>
          <lpage>31</lpage>
        </citation>
      </ref>
      <ref id="B29-sustainability-05-01211">
        <label>29.</label>
        <citation citation-type="journal">
          <person-group person-group-type="author">
            <name>
              <surname>Anable</surname>
              <given-names>J.</given-names>
            </name>
          </person-group>
          <article-title>Complacent car addicts” or “aspiring environmentalists”? Identifying travel behaviour segments using attitude theory</article-title>
          <source>Transport Policy</source>
          <year>2005</year>
          <volume>12</volume>
          <fpage>65</fpage>
          <lpage>78</lpage>
          <pub-id pub-id-type="doi">10.1016/j.tranpol.2004.11.004</pub-id>
        </citation>
      </ref>
      <ref id="B30-sustainability-05-01211">
        <label>30.</label>
        <citation citation-type="book">
          <person-group person-group-type="author">
            <name>
              <surname>Maller</surname>
              <given-names>C.J.</given-names>
            </name>
          </person-group>
          <article-title>Practices involving energy and water consumption in migrant households</article-title>
          <source>Urban consumption</source>
          <person-group person-group-type="editor">
            <name>
              <surname>Newton</surname>
              <given-names>P.</given-names>
            </name>
          </person-group>
          <publisher-name>CSIRO Publishing</publisher-name>
          <publisher-loc>Melbourne, Australia</publisher-loc>
          <year>2011</year>
          <fpage>237</fpage>
          <lpage>250</lpage>
        </citation>
      </ref>
      <ref id="B31-sustainability-05-01211">
        <label>31.</label>
        <citation citation-type="book">
          <person-group person-group-type="author">
            <name>
              <surname>Shove</surname>
              <given-names>E.</given-names>
            </name>
          </person-group>
          <source>Comfort, Cleanliness and Convenience: The Social Organization of Normality</source>
          <publisher-name>Berg</publisher-name>
          <publisher-loc>Oxford, UK</publisher-loc>
          <year>2003</year>
        </citation>
      </ref>
      <ref id="B32-sustainability-05-01211">
        <label>32.</label>
        <citation citation-type="journal">
          <person-group person-group-type="author">
            <name>
              <surname>Ahuviar</surname>
              <given-names>A.</given-names>
            </name>
            <name>
              <surname>Carroll</surname>
              <given-names>B.</given-names>
            </name>
            <name>
              <surname>Yang</surname>
              <given-names>Y.</given-names>
            </name>
          </person-group>
          <article-title>Consumer culture theory and lifestyle segmentation</article-title>
          <source>Innovative Markets</source>
          <year>2006</year>
          <volume>2</volume>
          <fpage>33</fpage>
          <lpage>43</lpage>
        </citation>
      </ref>
      <ref id="B33-sustainability-05-01211">
        <label>33.</label>
        <citation citation-type="journal">
          <person-group person-group-type="author">
            <name>
              <surname>Thompson</surname>
              <given-names>C.</given-names>
            </name>
            <name>
              <surname>Troaster</surname>
              <given-names>M.</given-names>
            </name>
          </person-group>
          <article-title>Consumer value systems in the age of postmodern fragmentation</article-title>
          <source>J. Consum. Res.</source>
          <year>2002</year>
          <volume>28</volume>
          <fpage>550</fpage>
          <lpage>571</lpage>
          <pub-id pub-id-type="doi">10.1086/338213</pub-id>
        </citation>
      </ref>
      <ref id="B34-sustainability-05-01211">
        <label>34.</label>
        <citation citation-type="book">
          <person-group person-group-type="author">
            <name>
              <surname>Barr</surname>
              <given-names>S.</given-names>
            </name>
            <name>
              <surname>Prillwitz</surname>
              <given-names>J.</given-names>
            </name>
          </person-group>
          <article-title>Sustainable travel: mobility, lifestyle and practice</article-title>
          <source>Urban Consumption</source>
          <person-group person-group-type="editor">
            <name>
              <surname>Newton</surname>
              <given-names>P.</given-names>
            </name>
          </person-group>
          <publisher-name>CSIRO Publishing</publisher-name>
          <publisher-loc>Melbourne, Australia</publisher-loc>
          <year>2011</year>
          <fpage>159</fpage>
          <lpage>171</lpage>
        </citation>
      </ref>
      <ref id="B35-sustainability-05-01211">
        <label>35.</label>
        <citation citation-type="journal">
          <person-group person-group-type="author">
            <name>
              <surname>Connolly</surname>
              <given-names>J.</given-names>
            </name>
            <name>
              <surname>Prothero</surname>
              <given-names>A.</given-names>
            </name>
          </person-group>
          <article-title>Sustainable consumption</article-title>
          <source>Consumption Markets Culture</source>
          <year>2003</year>
          <volume>6</volume>
          <fpage>275</fpage>
          <lpage>291</lpage>
          <pub-id pub-id-type="doi">10.1080/1025386032000168311</pub-id>
        </citation>
      </ref>
      <ref id="B36-sustainability-05-01211">
        <label>36.</label>
        <citation citation-type="web">
          <person-group person-group-type="author">
            <name>
              <surname>Collier</surname>
              <given-names>A.</given-names>
            </name>
            <name>
              <surname>Cotterill</surname>
              <given-names>A.</given-names>
            </name>
            <name>
              <surname>Everett</surname>
              <given-names>T.</given-names>
            </name>
            <name>
              <surname>Muckle</surname>
              <given-names>R.</given-names>
            </name>
            <name>
              <surname>Pike</surname>
              <given-names>T.</given-names>
            </name>
            <name>
              <surname>Vanstone</surname>
              <given-names>A.</given-names>
            </name>
          </person-group>
          <source>Understanding and Influencing Behaviours: A Review of Social Research, Economics and Policy Making in Defra</source>
          <publisher-name>Department for Environment, Food and Rural Affairs</publisher-name>
          <publisher-loc>London, UK</publisher-loc>
          <year>2010</year>
          <comment>Available online:<ext-link xmlns:xlink="http://www.w3.org/1999/xlink" xlink:href="http://www.defra.gov.uk/evidence/series/documents/understand-influencebehaviour-discuss.pdf" ext-link-type="uri">http://www.defra.gov.uk/evidence/series/documents/understand-influencebehaviour-discuss.pdf</ext-link></comment>
          <access-date>(accessed on 18 December 2012)</access-date>
          </citation>
      </ref>
      <ref id="B37-sustainability-05-01211">
        <label>37.</label>
        <citation citation-type="book">
          <collab>Behavioural Insights Team</collab>
          <source>Behavioural Insights Team annual update 2010–11</source>
          <publisher-name>Cabinet Office</publisher-name>
          <publisher-loc>London, UK</publisher-loc>
          <year>2011</year>
        </citation>
      </ref>
      <ref id="B38-sustainability-05-01211">
        <label>38.</label>
        <citation citation-type="book">
          <collab>Cabinet Office</collab>
          <source>Government Response to the Science and Technology Select Committee report on Behaviour Change</source>
          <publisher-name>Cabinet Office</publisher-name>
          <publisher-loc>London, UK</publisher-loc>
          <year>2011</year>
        </citation>
      </ref>
      <ref id="B39-sustainability-05-01211">
        <label>39.</label>
        <citation citation-type="web">
          <person-group person-group-type="author">
            <name>
              <surname>Russell</surname>
              <given-names>G.</given-names>
            </name>
          </person-group>
          <source>A Framework for Sustainable Lifestyles</source>
          <publisher-name>Department for Environment, Food and Rural Affairs</publisher-name>
          <publisher-loc>London, UK</publisher-loc>
          <year>2011</year>
          <comment>Available online:<ext-link xmlns:xlink="http://www.w3.org/1999/xlink" xlink:href="http://sd.defra.gov.uk/2011/10/framework-for-sustainable-lifestyles/" ext-link-type="uri">http://sd.defra.gov.uk/2011/10/framework-for-sustainable-lifestyles/</ext-link></comment>
          <access-date>(accessed on 18 December 2012)</access-date>
          </citation>
      </ref>
      <ref id="B40-sustainability-05-01211">
        <label>40.</label>
        <citation citation-type="book">
          <collab>Ministry for the Environment</collab>
          <article-title>Household Sustainability Survey 2008; Part 4 Population Segmentation, 2012, Wellington (<uri>www.mfe.govt.nz</uri>)</article-title>
          <source>Environmental stewardship for a prosperous New Zealand</source>
        </citation>
      </ref>
      <ref id="B41-sustainability-05-01211">
        <label>41.</label>
        <citation citation-type="book">
          <collab>Department of Environment, Climate Change and Water</collab>
          <source>Who cares about the environment in 2009?</source>
          <publisher-name>NSW Government</publisher-name>
          <publisher-loc>Sydney, Australia</publisher-loc>
          <year>2010</year>
        </citation>
      </ref>
      <ref id="B42-sustainability-05-01211">
        <label>42.</label>
        <citation citation-type="book">
          <person-group person-group-type="author">
            <name>
              <surname>Maibach</surname>
              <given-names>E.</given-names>
            </name>
            <name>
              <surname>Roser-Renouf</surname>
              <given-names>C.</given-names>
            </name>
            <name>
              <surname>Leiserowitz</surname>
              <given-names>A.</given-names>
            </name>
          </person-group>
          <source>Global warming’s Six Americas</source>
          <publisher-name>George Mason University</publisher-name>
          <publisher-loc>Fairfax, VA, USA</publisher-loc>
          <year>2009</year>
        </citation>
      </ref>
      <ref id="B43-sustainability-05-01211">
        <label>43.</label>
        <citation citation-type="book">
          <person-group person-group-type="author">
            <name>
              <surname>Maibach</surname>
              <given-names>E.</given-names>
            </name>
            <name>
              <surname>Roser-Renouf</surname>
              <given-names>C.</given-names>
            </name>
            <name>
              <surname>Leiserowitz</surname>
              <given-names>A.</given-names>
            </name>
          </person-group>
          <source>Global warming’s Six Americas</source>
          <publisher-name>George Mason University</publisher-name>
          <publisher-loc>Fairfax, VA, USA</publisher-loc>
          <year>2012</year>
        </citation>
      </ref>
      <ref id="B44-sustainability-05-01211">
        <label>44.</label>
        <citation citation-type="journal">
          <person-group person-group-type="author">
            <name>
              <surname>Newton</surname>
              <given-names>P.</given-names>
            </name>
            <name>
              <surname>Meyer</surname>
              <given-names>D.</given-names>
            </name>
          </person-group>
          <article-title>The determinants of urban resource consumption</article-title>
          <source>Environment Behaviour</source>
          <year>2010</year>
          <pub-id pub-id-type="doi">10.1177/0013916510390494 </pub-id>
        </citation>
      </ref>
      <ref id="B45-sustainability-05-01211">
        <label>45.</label>
        <citation citation-type="journal">
          <person-group person-group-type="author">
            <name>
              <surname>Kollmuss</surname>
              <given-names>A.</given-names>
            </name>
            <name>
              <surname>Agyeman</surname>
              <given-names>J.</given-names>
            </name>
          </person-group>
          <article-title>Mind the gap: why do people act environmentally and what are the barriers to pro-environmental behaviour?</article-title>
          <source>Environ. Education Res.</source>
          <year>2002</year>
          <volume>8</volume>
          <fpage>239</fpage>
          <lpage>260</lpage>
          <pub-id pub-id-type="doi">10.1080/13504620220145401</pub-id>
        </citation>
      </ref>
      <ref id="B46-sustainability-05-01211">
        <label>46.</label>
        <citation citation-type="book">
          <person-group person-group-type="author">
            <name>
              <surname>Newton</surname>
              <given-names>P.</given-names>
            </name>
            <name>
              <surname>Burke</surname>
              <given-names>T.</given-names>
            </name>
            <name>
              <surname>Meyer</surname>
              <given-names>D.</given-names>
            </name>
            <name>
              <surname>Wulff</surname>
              <given-names>M.</given-names>
            </name>
          </person-group>
          <source>Consuming the Urban Environment: Report on Results from Extension of 2009 ARC Discovery “Living in Melbourne” Survey to Residents of Selected Precincts in the City of Melbourne</source>
          <publisher-name>Institute for Social Research, Swinburne University of Technology</publisher-name>
          <publisher-loc>Melbourne, Australia</publisher-loc>
          <year>2009</year>
        </citation>
      </ref>
      <ref id="B47-sustainability-05-01211">
        <label>47.</label>
        <citation citation-type="confproc">
          <person-group person-group-type="author">
            <name>
              <surname>Zhang</surname>
              <given-names>T.</given-names>
            </name>
            <name>
              <surname>Ramakrishnan</surname>
              <given-names>R.</given-names>
            </name>
            <name>
              <surname>Livny</surname>
              <given-names>M.</given-names>
            </name>
          </person-group>
          <article-title>BIRCH: an efficient data clustering method for very large databases</article-title>
          <source>Proceedings of the ACM SIGMOD Conference on Management of Data</source>
          <person-group person-group-type="editor">
            <name>
              <surname>Jagadish</surname>
              <given-names>H.V.</given-names>
            </name>
            <name>
              <surname>Mumick</surname>
              <given-names>I.S.</given-names>
            </name>
          </person-group>
          <publisher-name>ACM</publisher-name>
          <publisher-loc>Montreal, Canada</publisher-loc>
          <year>1996</year>
          <fpage>103</fpage>
          <lpage>114</lpage>
        </citation>
      </ref>
      <ref id="B48-sustainability-05-01211">
        <label>48.</label>
        <citation citation-type="confproc">
          <person-group person-group-type="author">
            <name>
              <surname>Chiu</surname>
              <given-names>T.</given-names>
            </name>
            <name>
              <surname>Fang</surname>
              <given-names>D.</given-names>
            </name>
            <name>
              <surname>Chen</surname>
              <given-names>J.</given-names>
            </name>
            <name>
              <surname>Wang</surname>
              <given-names>Y.</given-names>
            </name>
            <name>
              <surname>Jeris</surname>
              <given-names>C.</given-names>
            </name>
          </person-group>
          <article-title>A robust and scalable clustering algorithm for mixed type attributes in large database environment</article-title>
          <source>Proceedings of the seventh ACM SIGKDD international conference on knowledge discovery and data mining</source>
          <person-group person-group-type="editor">
            <name>
              <surname>Provost</surname>
              <given-names>F.</given-names>
            </name>
            <name>
              <surname>Srikant</surname>
              <given-names>R.</given-names>
            </name>
          </person-group>
          <publisher-name>ACM</publisher-name>
          <publisher-loc>San Francisco, CA, USA</publisher-loc>
          <year>2001</year>
          <fpage>263</fpage>
          <lpage>268</lpage>
        </citation>
      </ref>
      <ref id="B49-sustainability-05-01211">
        <label>49.</label>
        <citation citation-type="book">
          <person-group person-group-type="author">
            <name>
              <surname>Dunlap</surname>
              <given-names>R.E.</given-names>
            </name>
            <name>
              <surname>Jones</surname>
              <given-names>R.E.</given-names>
            </name>
          </person-group>
          <article-title>Environmental concern: conceptual and measurement issues</article-title>
          <source>Handbook of Environmental Sociology</source>
          <person-group person-group-type="editor">
            <name>
              <surname>Dunlap</surname>
              <given-names>R.E.</given-names>
            </name>
            <name>
              <surname>Michelson</surname>
              <given-names>W.</given-names>
            </name>
          </person-group>
          <publisher-name>Greenwood</publisher-name>
          <publisher-loc>Westport, CT, USA</publisher-loc>
          <year>2002</year>
          <fpage>482</fpage>
          <lpage>524</lpage>
        </citation>
      </ref>
      <ref id="B50-sustainability-05-01211">
        <label>50.</label>
        <citation citation-type="journal">
          <person-group person-group-type="author">
            <name>
              <surname>Newton</surname>
              <given-names>P.</given-names>
            </name>
          </person-group>
          <article-title>Horizon 3 planning: meshing liveability with sustainability</article-title>
          <source>Environ. Plann. B</source>
          <year>2007</year>
          <volume>34</volume>
          <fpage>571</fpage>
          <lpage>575</lpage>
          <pub-id pub-id-type="doi">10.1068/b3404com</pub-id>
        </citation>
      </ref>
      <ref id="B51-sustainability-05-01211">
        <label>51.</label>
        <citation citation-type="book">
          <collab>ABS</collab>
          <source>Australia’s environment: issues and trends, 2007</source>
          <series>Cat. No. 4613.0</series>
          <publisher-name>Australian Bureau of Statistics</publisher-name>
          <publisher-loc>Canberra, Australia</publisher-loc>
          <year>2008</year>
          </citation>
      </ref>
      <ref id="B52-sustainability-05-01211">
        <label>52.</label>
        <citation citation-type="commun">
          <person-group person-group-type="author">
            <name>
              <surname>Morrison</surname>
              <given-names>B.</given-names>
            </name>
          </person-group>
          <article-title>Wording of “environmental concern” question, Australian Bureau of Statistics, Canberra, Personal e-Mail Communication</article-title>
          <day>5</day>
          <month>September</month>
          <year>2007</year>
        </citation>
      </ref>
      <ref id="B53-sustainability-05-01211">
        <label>53.</label>
        <citation citation-type="journal">
          <person-group person-group-type="author">
            <name>
              <surname>Van Liere</surname>
              <given-names>K.D.</given-names>
            </name>
            <name>
              <surname>Dunlap</surname>
              <given-names>R.E.</given-names>
            </name>
          </person-group>
          <article-title>Environmental concern: does it make a difference how it’s measured?</article-title>
          <source>Environ. Behav.</source>
          <year>1981</year>
          <volume>13</volume>
          <fpage>651</fpage>
          <lpage>676</lpage>
          <pub-id pub-id-type="doi">10.1177/0013916581136001</pub-id>
        </citation>
      </ref>
      <ref id="B54-sustainability-05-01211">
        <label>54.</label>
        <citation citation-type="book">
          <collab>Sustainability Victoria</collab>
          <source>Green light report: Victorians and the Environment in 2008</source>
          <publisher-name>Sustainability Victoria</publisher-name>
          <publisher-loc>Melbourne, Australia</publisher-loc>
          <year>2008</year>
        </citation>
      </ref>
      <ref id="B55-sustainability-05-01211">
        <label>55.</label>
        <citation citation-type="book">
          <collab>Sustainability Victoria</collab>
          <source>Green light report: Victorians and the Environment in 2009</source>
          <publisher-name>Sustainability Victoria</publisher-name>
          <publisher-loc>Melbourne, Australia</publisher-loc>
          <year>2009</year>
        </citation>
      </ref>
      <ref id="B56-sustainability-05-01211">
        <label>56.</label>
        <citation citation-type="other">
          <person-group person-group-type="author">
            <name>
              <surname>Krugman</surname>
              <given-names>P.</given-names>
            </name>
          </person-group>
          <article-title>The US coughs and the global economy presses on</article-title>
          <source>The Age</source>
          <day>28</day>
          <month>December</month>
          <year>2010</year>
        </citation>
      </ref>
      <ref id="B57-sustainability-05-01211">
        <label>57.</label>
        <citation citation-type="book">
          <person-group person-group-type="author">
            <name>
              <surname>Inman</surname>
              <given-names>M.</given-names>
            </name>
          </person-group>
          <article-title>The water-efficient city: technological and institutional drivers</article-title>
          <source>Urban Consumption</source>
          <person-group person-group-type="editor">
            <name>
              <surname>Newton</surname>
              <given-names>P.</given-names>
            </name>
          </person-group>
          <publisher-name>CSIRO Publishing</publisher-name>
          <publisher-loc>Melbourne, Australia</publisher-loc>
          <year>2008</year>
          <fpage>495</fpage>
          <lpage>505</lpage>
        </citation>
      </ref>
      <ref id="B58-sustainability-05-01211">
        <label>58.</label>
        <citation citation-type="journal">
          <person-group person-group-type="author">
            <name>
              <surname>Dunlap</surname>
              <given-names>R.</given-names>
            </name>
            <name>
              <surname>van Liere</surname>
              <given-names>K.</given-names>
            </name>
            <name>
              <surname>Mertig</surname>
              <given-names>A.</given-names>
            </name>
            <name>
              <surname>Jones</surname>
              <given-names>R.</given-names>
            </name>
          </person-group>
          <article-title>Measuring endorsement of the new ecological paradigm: a revised NEP scale</article-title>
          <source>J. Soc. Issues</source>
          <year>2000</year>
          <volume>56</volume>
          <fpage>425</fpage>
          <lpage>442</lpage>
        <pub-id pub-id-type="doi">10.1111/0022-4537.00176</pub-id></citation>
      </ref>
    </ref-list>
  </back>
</article>
