2.1. Stagnating Supplies
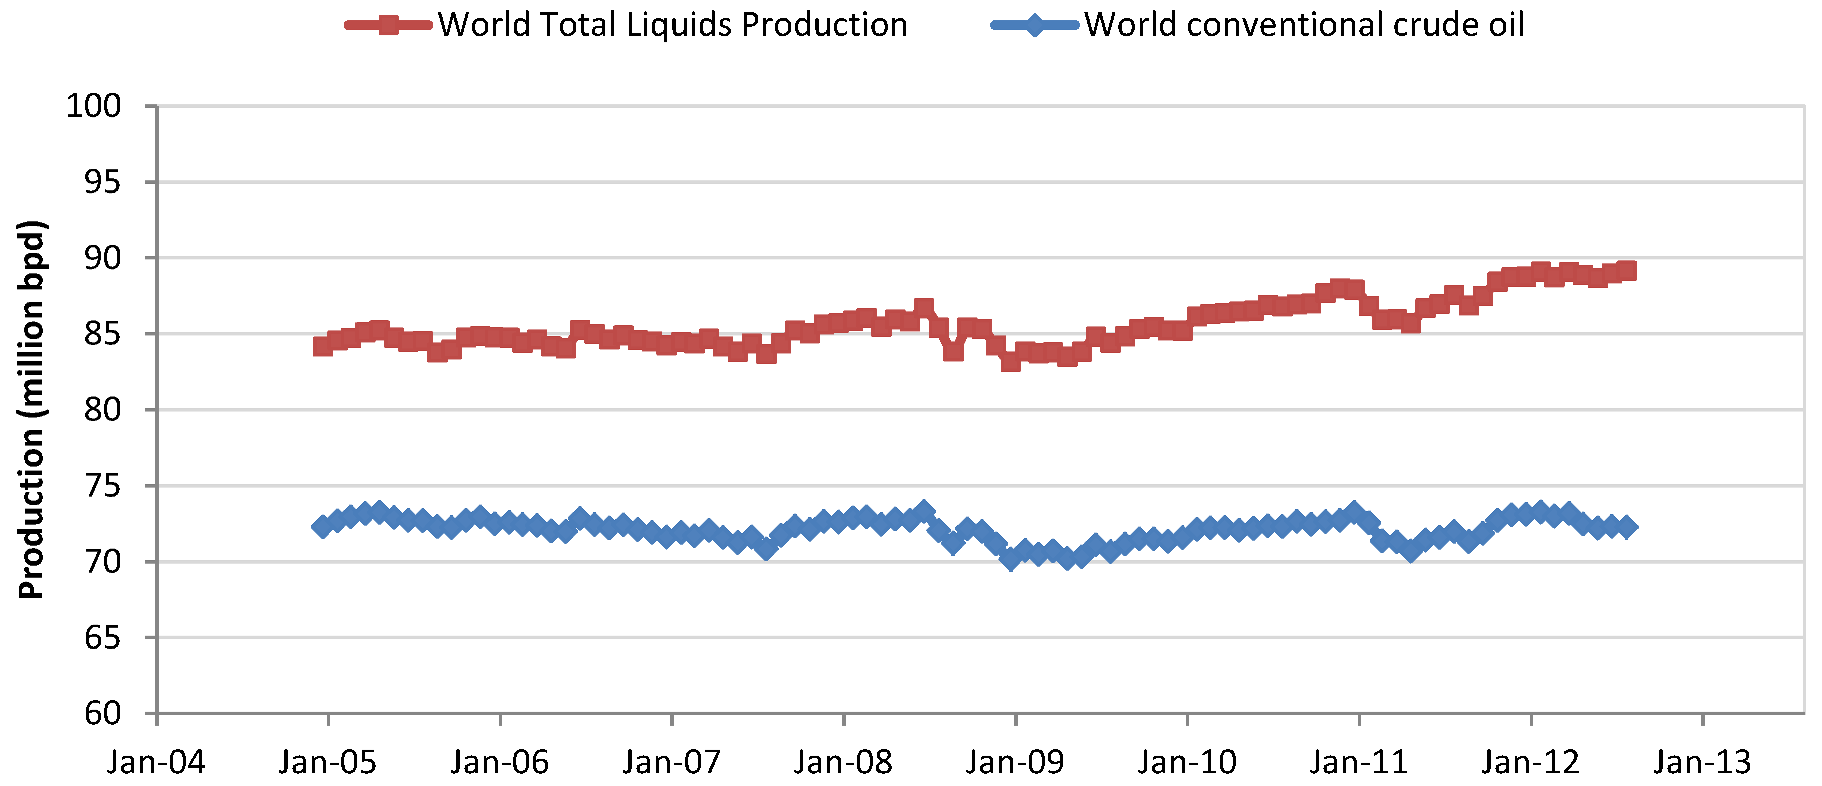
World production of crude oil has not increased for over seven years, through periods of both low and high economic growth.
Figure 2 shows data from the US Energy Information Administration for world production of both crude oil alone (blue) and for total liquids (red) [
6]. Looking first at the bottom curve, production of crude oil did not change at all (in a statistically significant sense) during the strong economic growth of 2005–2008. There was a decline in production, driven by consumption decreases, in 2008–2009, followed by a slow increase back to pre-economic-downturn levels. Turmoil in the Middle East and North Africa contributed to the subsequent decrease in production in early 2011. In the upper curve in
Figure 2, there is a slight increase in total world supply of liquid fuels. Therefore, given the non-increasing production of conventional oil, the increase in volume of total liquids must come from other sources; the data show increases, particularly in natural gas liquids, biofuels and, to a lesser extent, heavy oil, tar sands and shale oil.
Figure 2.
World supply of conventional crude oil (bottom curve) and total liquids, including biofuels, oil sands, shale oil, natural gas liquids and refinery processing gain (top curve). Data from US Energy Information Administration, International Energy Statistics [
6].
Figure 2.
World supply of conventional crude oil (bottom curve) and total liquids, including biofuels, oil sands, shale oil, natural gas liquids and refinery processing gain (top curve). Data from US Energy Information Administration, International Energy Statistics [
6].
As this trend toward liquid fuels other than conventional crude oil continues, two important points are worth noting. First, in
Figure 2, we show a volumetric measure of fuels, as opposed to gross energy content of those fuels. Both natural gas liquids and biofuels have volumetric energy densities that are only 60% that of conventional crude oil; demand is for the actual useful energy provided by fuels and, therefore, requires additional volume if energy density decreases. Plotting energy
vs. time shows a slightly smaller upward trend, but this discrepancy will increase with time in the future. The second point is that nonconventional liquid fuels, including biofuels, require higher energy inputs for extraction, processing, refining and transport than conventional oil. Although some of the energy input may be in the form of carriers other than the liquid fuels themselves, the move toward nonconventional fuels points to a need to account for net energy use for each sector, since it is the total energy system that is of fundamental interest. Furthermore, even in the case of conventional oil production, the energy return on energy invested (EROEI) in extraction has been decreasing over time, implying that a given amount of final liquid fuel energy (mainly for transportation, but in some areas, for electricity generation as well) itself requires energy consumption that would otherwise be available for other sectors of the total system [
17].
An argument
against concern about peak oil is precisely that we will find suitable, if not perfect, substitutes for conventional oil when the economic and technological conditions are ripe. One can turn this logic around, however, by saying that the very fact that oil sands, shale oil, corn-to-ethanol and coal-to-liquids are being taken seriously, although these are expensive, input-energy-intensive substitutes, is likely a signal that the world is both running up against limits to conventional crude oil production expansion and would like to supply the infrastructure already in place. The plot in
Figure 2 is scaled from 60 Mbpd to 100 Mbpd to show a relevant range of production. In 1980, world production of conventional oil was approximately at the lower end of this range, thus illustrating the amount of growth occurring after the oil shocks of the 1970s. The EIA projects [
18,
19] that world liquid fuel demand will be approximately 95 Mbpd within one decade, a growth rate approximately double that of the last several years.
2.2. Rising Prices
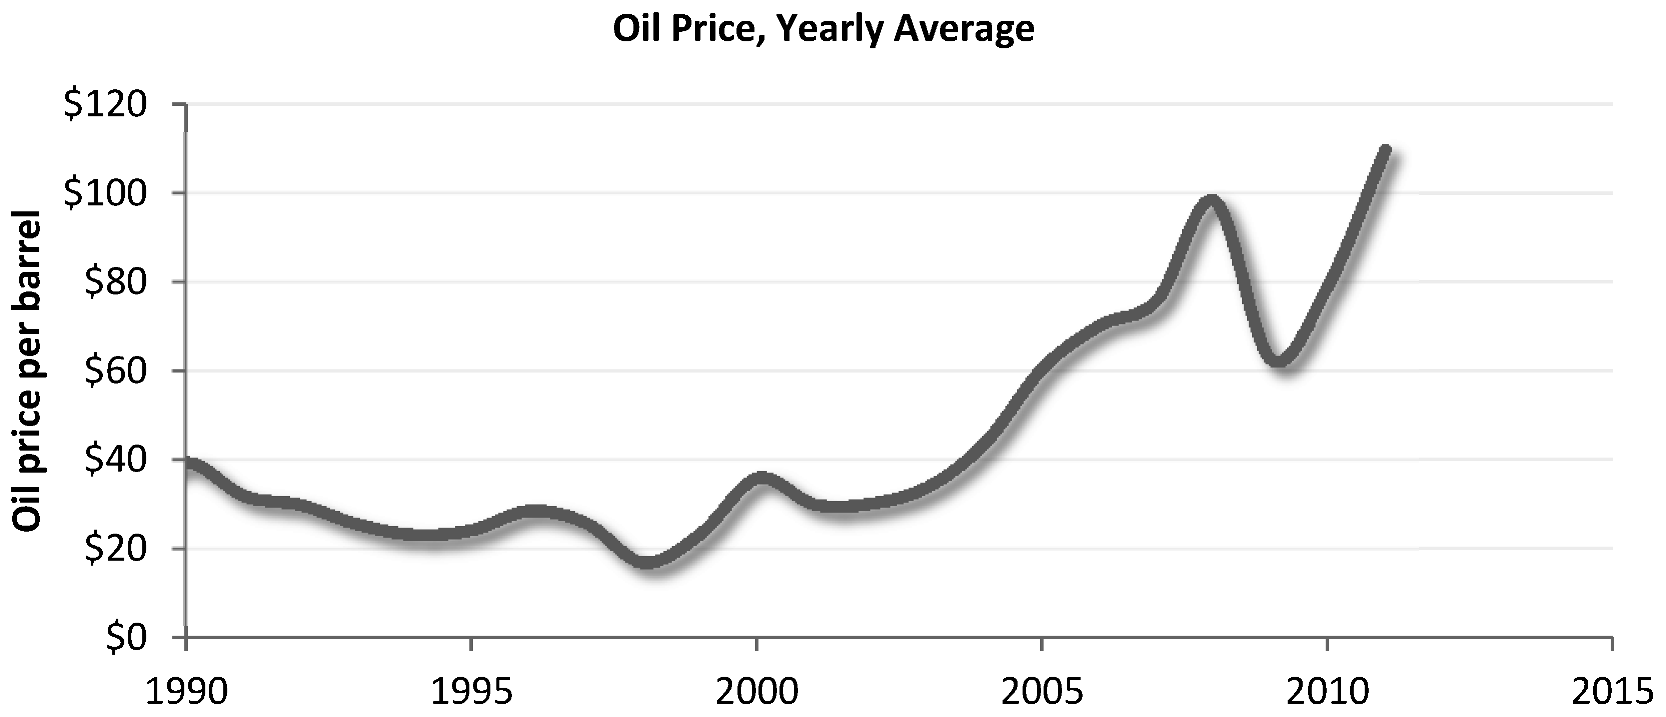
Crude oil prices have increased dramatically since the late 1990s, with interruptions only during periods of economic recession, as shown in
Figure 3. Although there are claims that this price increase was due to either speculative trading activity or to deliberate withholding of oil from the world market by quasi-monopolistic players, the same price-increase behavior would be expected if nearing a peak in production. Published literature investigating the causes of recent price increases tend to find only a small role for speculation and a much larger role being played by more fundamental supply and demand factors [
7,
20,
21,
22,
23,
24,
25,
26,
27].
Figure 3.
Yearly average Brent crude oil price from 1990–2011. Data from BP Statistical Review of World Energy, 2012. Data are in $US2011
Figure 3.
Yearly average Brent crude oil price from 1990–2011. Data from BP Statistical Review of World Energy, 2012. Data are in $US2011
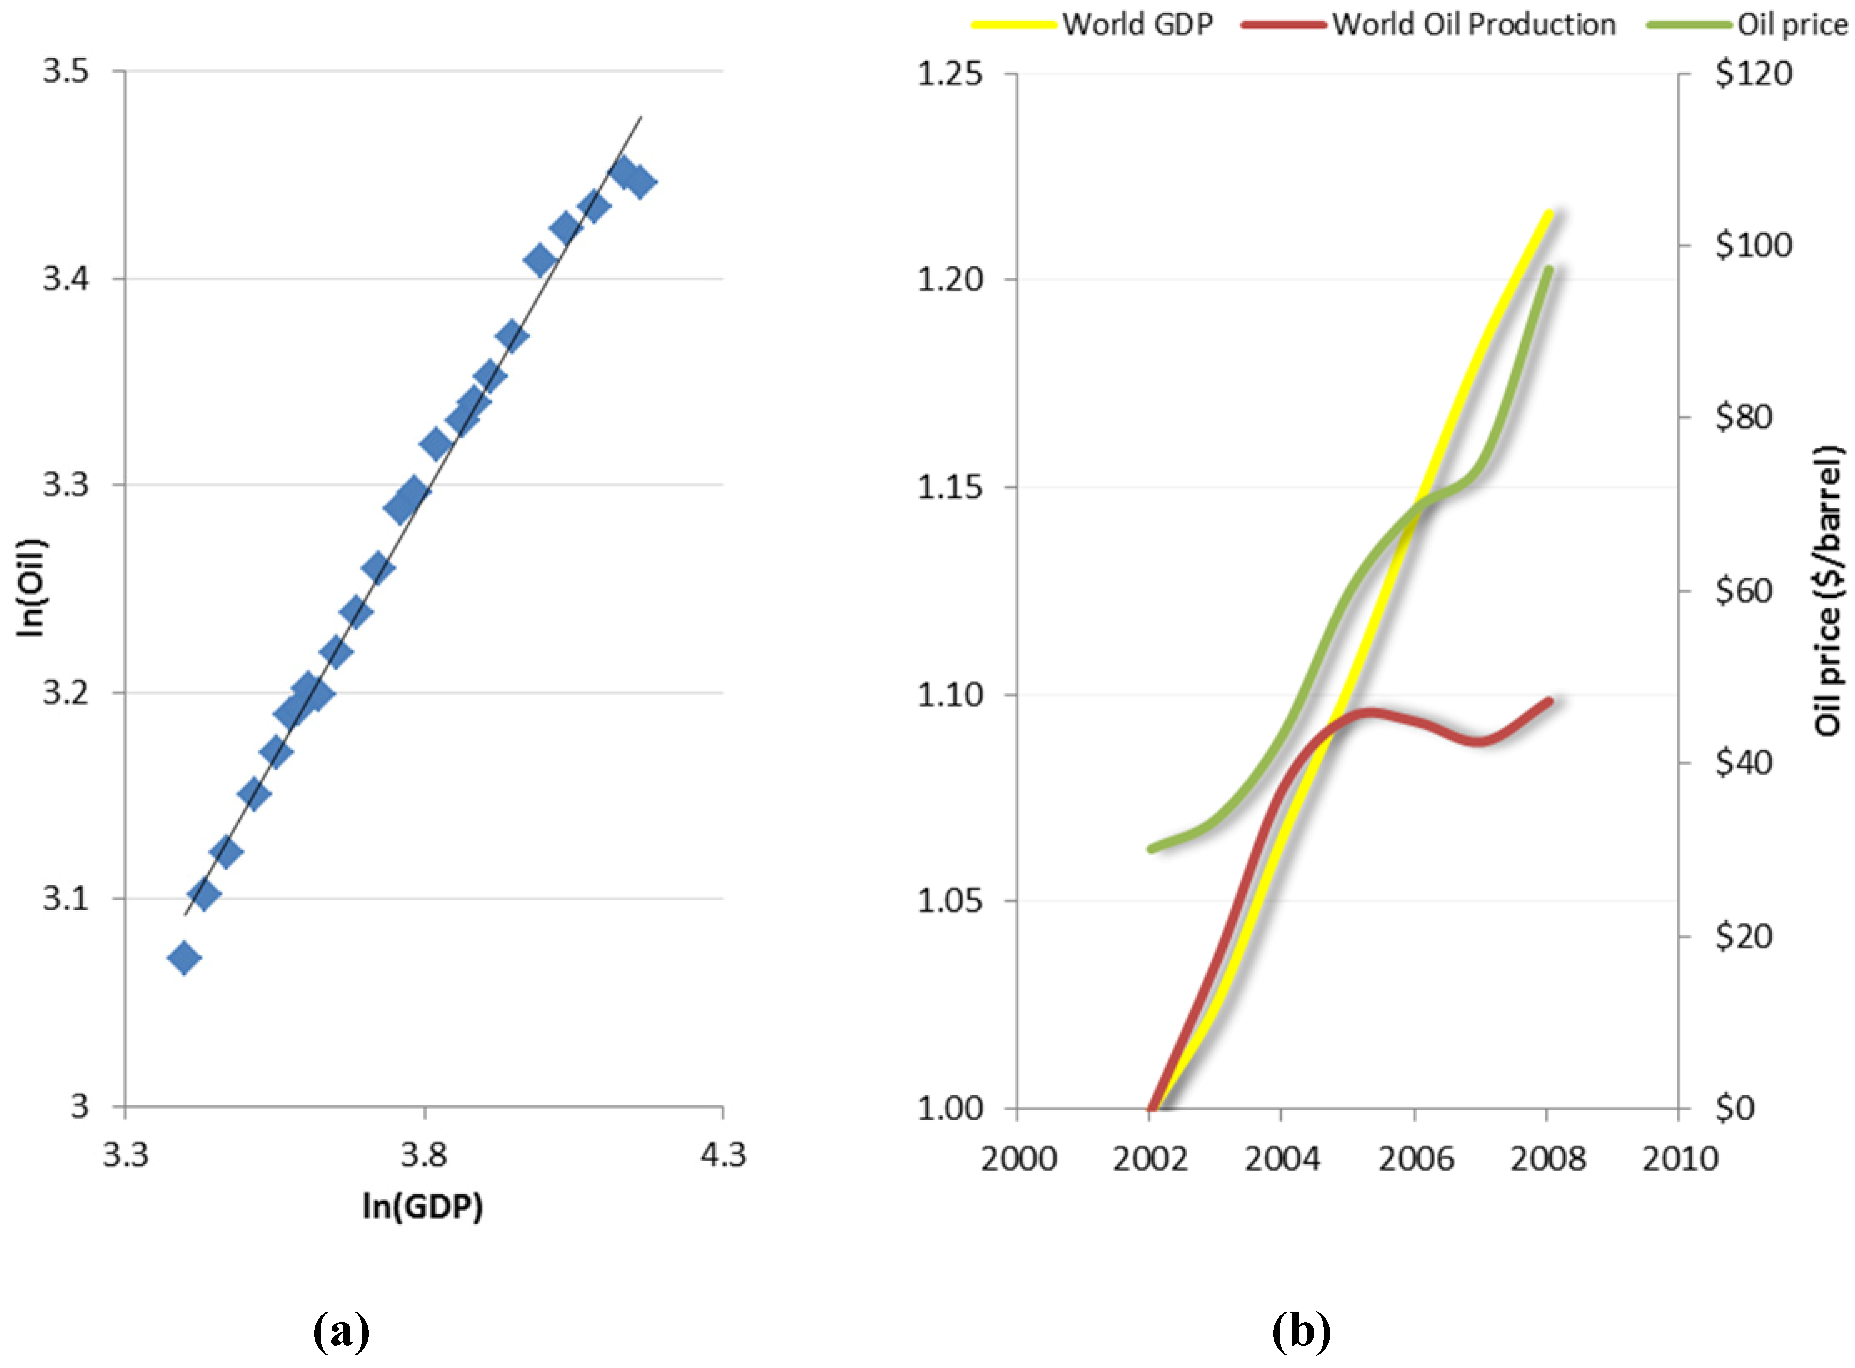
We can demonstrate this point more concretely by looking at the tight historical correlation between oil consumption and GDP, shown in
Figure 4 (a) with data from the past 25 years (more generally, the correlation is between energy and GDP, but oil has a similar pattern). In what is presented here, we used some simple arguments that are borne out by detailed econometric studies, many of which are reviewed by Hamilton [
27]. Data, such as those shown in
Figure 4 a, from the past quarter century illustrate the income elasticity of demand, defined as:
Econometric analyses determine the elasticity for oil worldwide to be about 0.5, although for developing countries responsible for much of current increase in demand, the income elasticity tends to be closer to unity [
27]. Here, the numerator is the fractional change in quantity of oil consumed and the denominator is the fractional income (GDP) change. In
Figure 4b, to emphasize the changing dynamic in the first decade of the 21st century, we plot scaled world GDP (yellow) along with scaled world oil consumption (red) from 2002 after the end of the recession that started in 2007. For roughly three years, the two track closely, as they have historically; after that point, world oil production leveled off. One can interpret this as “missing” the oil production that would “normally” have been available, given the observed economic growth. For a given demand, as driven by economic growth and the empirically observed income elasticity of demand, the lack of supply implies that there will be an increase in price, conditioned on the price elasticity of demand.
Figure 4.
(a) Correlation between world oil consumption and world GDP, both plotted as logarithms. (b) Scaled GDP and oil production (left-hand axis) and oil price (right-hand axis).
Figure 4.
(a) Correlation between world oil consumption and world GDP, both plotted as logarithms. (b) Scaled GDP and oil production (left-hand axis) and oil price (right-hand axis).
Using our value for the income elasticity and substituting GDP for income, one would expect to have seen an increase in production of 4–5% over the 2005–2008 time period. Since that supply did not materialize, one would expect prices to rise consonant with the own-price elasticity of demand, given by:
Here, the numerator is again the fractional change in supply, and the denominator is the fractional price change. Short-term (less than one year or time period of the econometric analysis) elasticities of demand for oil are around –0.1 [
28,
29,
30]; for the “missing” increase in supply, this would imply an increase in world oil price on the order of about 45% or $30/barrel, to around $90, which is consistent with observed yearly average prices. A somewhat higher income elasticity, along with a somewhat higher longer-term (one-year or greater) price elasticity, would lead to the same result. Thus, independent of the actual reason for the “missing” supply, there is no need to resort to blaming speculators for the rise in prices [
7]. One can also use these data to estimate the effect of supply shortages on the economy [
31].
2.3. Individual Country Peaks
Perhaps the most familiar indicator of a potential peak in world oil production is that many individual countries and regions (many contributing only small quantities) have entered and remained in a mode of declining conventional crude oil production, with the United States being the most prominent example. For the continental US, peak production occurred in 1970; the addition of Alaskan production helped slow the decline (and led to a temporary reversal). More recently, production of nonconventional oil from shale formations in North Dakota and Texas has again helped to slightly increase US production.
Most recently, the International Energy Agency’s 2012 World Energy Outlook [
18] received widespread media attention upon release, because of the projection that the United States would become once again the world’s largest producer of liquid fuels by 2020. Aside from the fact that the IEA and other agencies have generally been overly-optimistic about future production trends (see
Section 2.10.), three points were generally overlooked in analyses of this surprising development. First, in their projections, conventional oil production continues to decrease, as it has for many years. New production comes in the form of natural gas liquids and from shale oil. Second, in these same projections, the U.S. overtakes Saudi Arabia by only a few percent and only temporarily; after 2020, U.S. production again plateaus and then begins a decline, whereas Saudi production is supposed to continue growing beyond the projection time period. Finally, it should be noted that even with the new development of non-conventional oil and with the inclusion of natural gas liquids and of biofuels, the projected peak production in the 2020s would at most be at the level of U.S. production of crude oil alone in 1970. That is, only in the most optimistic estimate, and by “counting” every kind of liquid fuel, might the past peak production of the US be bested [
32].
In fact, most of the world’s oil producing countries are past peak production [
33], as seen from data supplied by BP and the EIA [
6,
34]. Of the forty top-producing countries, at least thirty are on a declining production path, and very few are on a trajectory that is clearly upward. In total, more than sixty countries have already passed a peak in production [
33].
2.4. Decreasing Discoveries
Discoveries of oil in new fields peaked in the mid-1960s. Production of oil necessarily follows discovery; for a finite resource, one would expect to see cumulative discovery (and with a time delay, cumulative production) follow a path that rises as discoveries commence and reaches a plateau as the rate of new discoveries decreases. The logistic function, defined for cumulative production by:
is often used as a simple mathematical description of this process, but there is little physical reason to believe that the logistic function should be the best choice [
16]. In fact, in the case of discoveries, the initial increase is often faster than a logistic, as large fields are usually found early [
16,
34,
35,
36].
Figure 5.
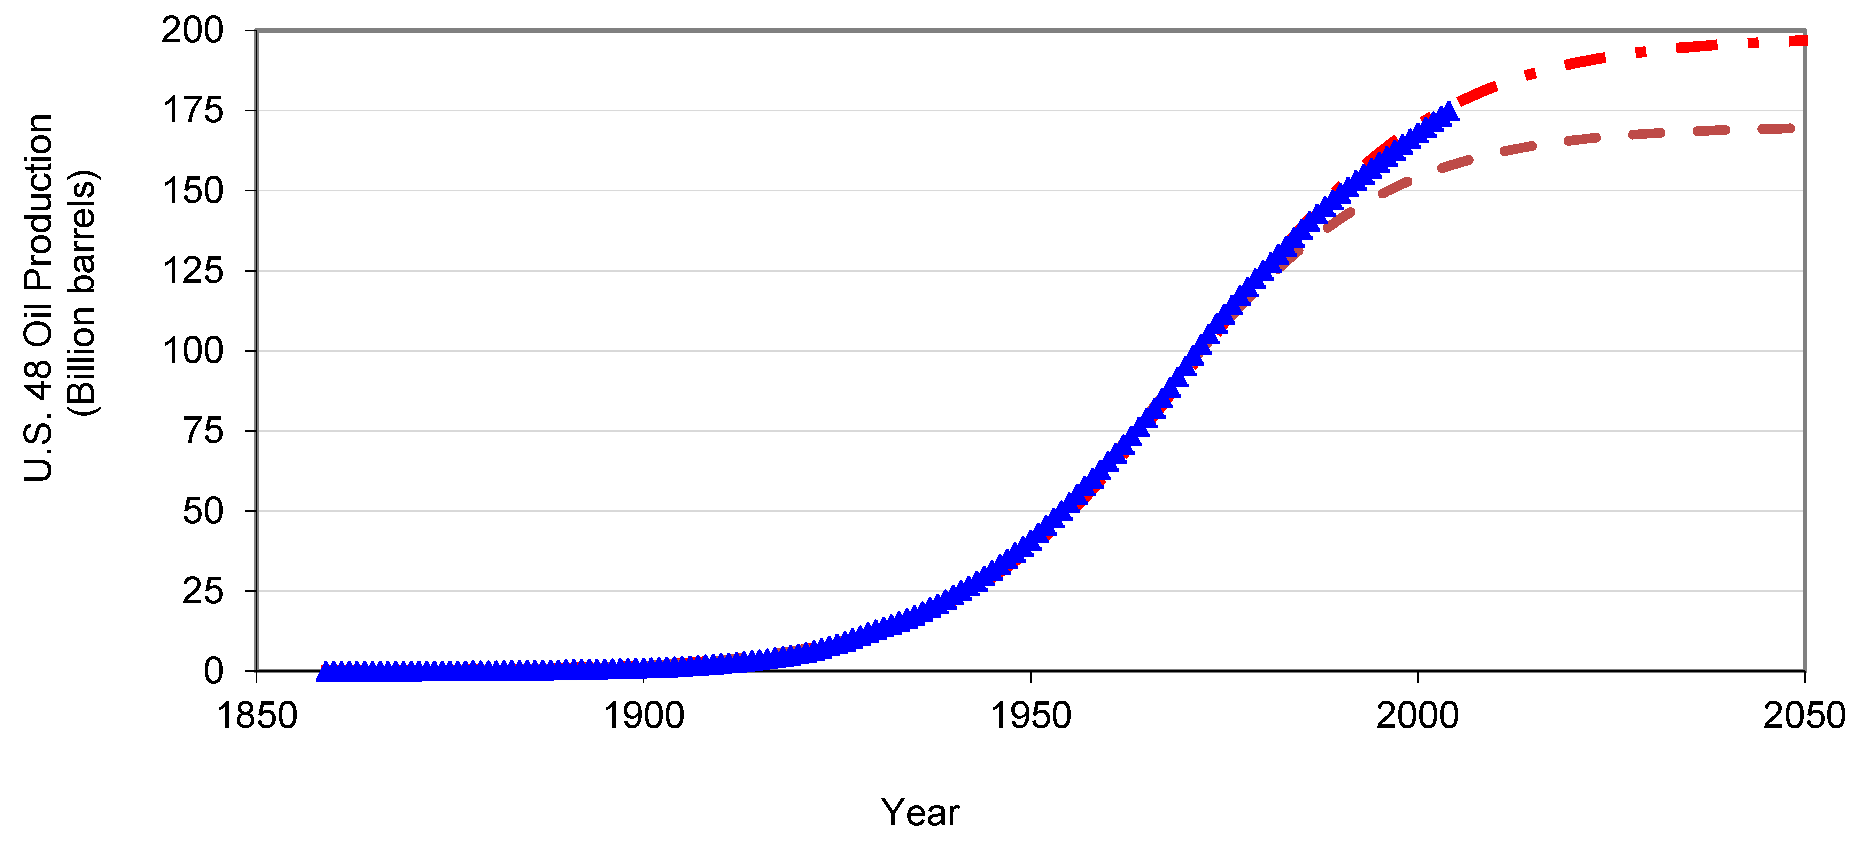
Cumulative production of oil from the continental US, together with a logistic curve fit to the data. The lower dashed curve is the fit that would have been found in 1980 using data to that point. The upper dot-dash curve is the current projection.
Figure 5.
Cumulative production of oil from the continental US, together with a logistic curve fit to the data. The lower dashed curve is the fit that would have been found in 1980 using data to that point. The upper dot-dash curve is the current projection.
In fact, the logistic description of U.S. oil production has been relatively good. As will be shown below, it is somewhat difficult to make a projection of the ultimate recoverable quantity using production data in advance of the peak in production; after the peak, it seems to be a good predictor, although, data for the U.S. follow this pattern deceptively well, compared to other regions [
37,
38,
39]. In
Figure 5, the production of oil in the continental U.S. is shown, together with a projection of the logistic curve corresponding to an ultimate recoverable quantity of 200 Gb.
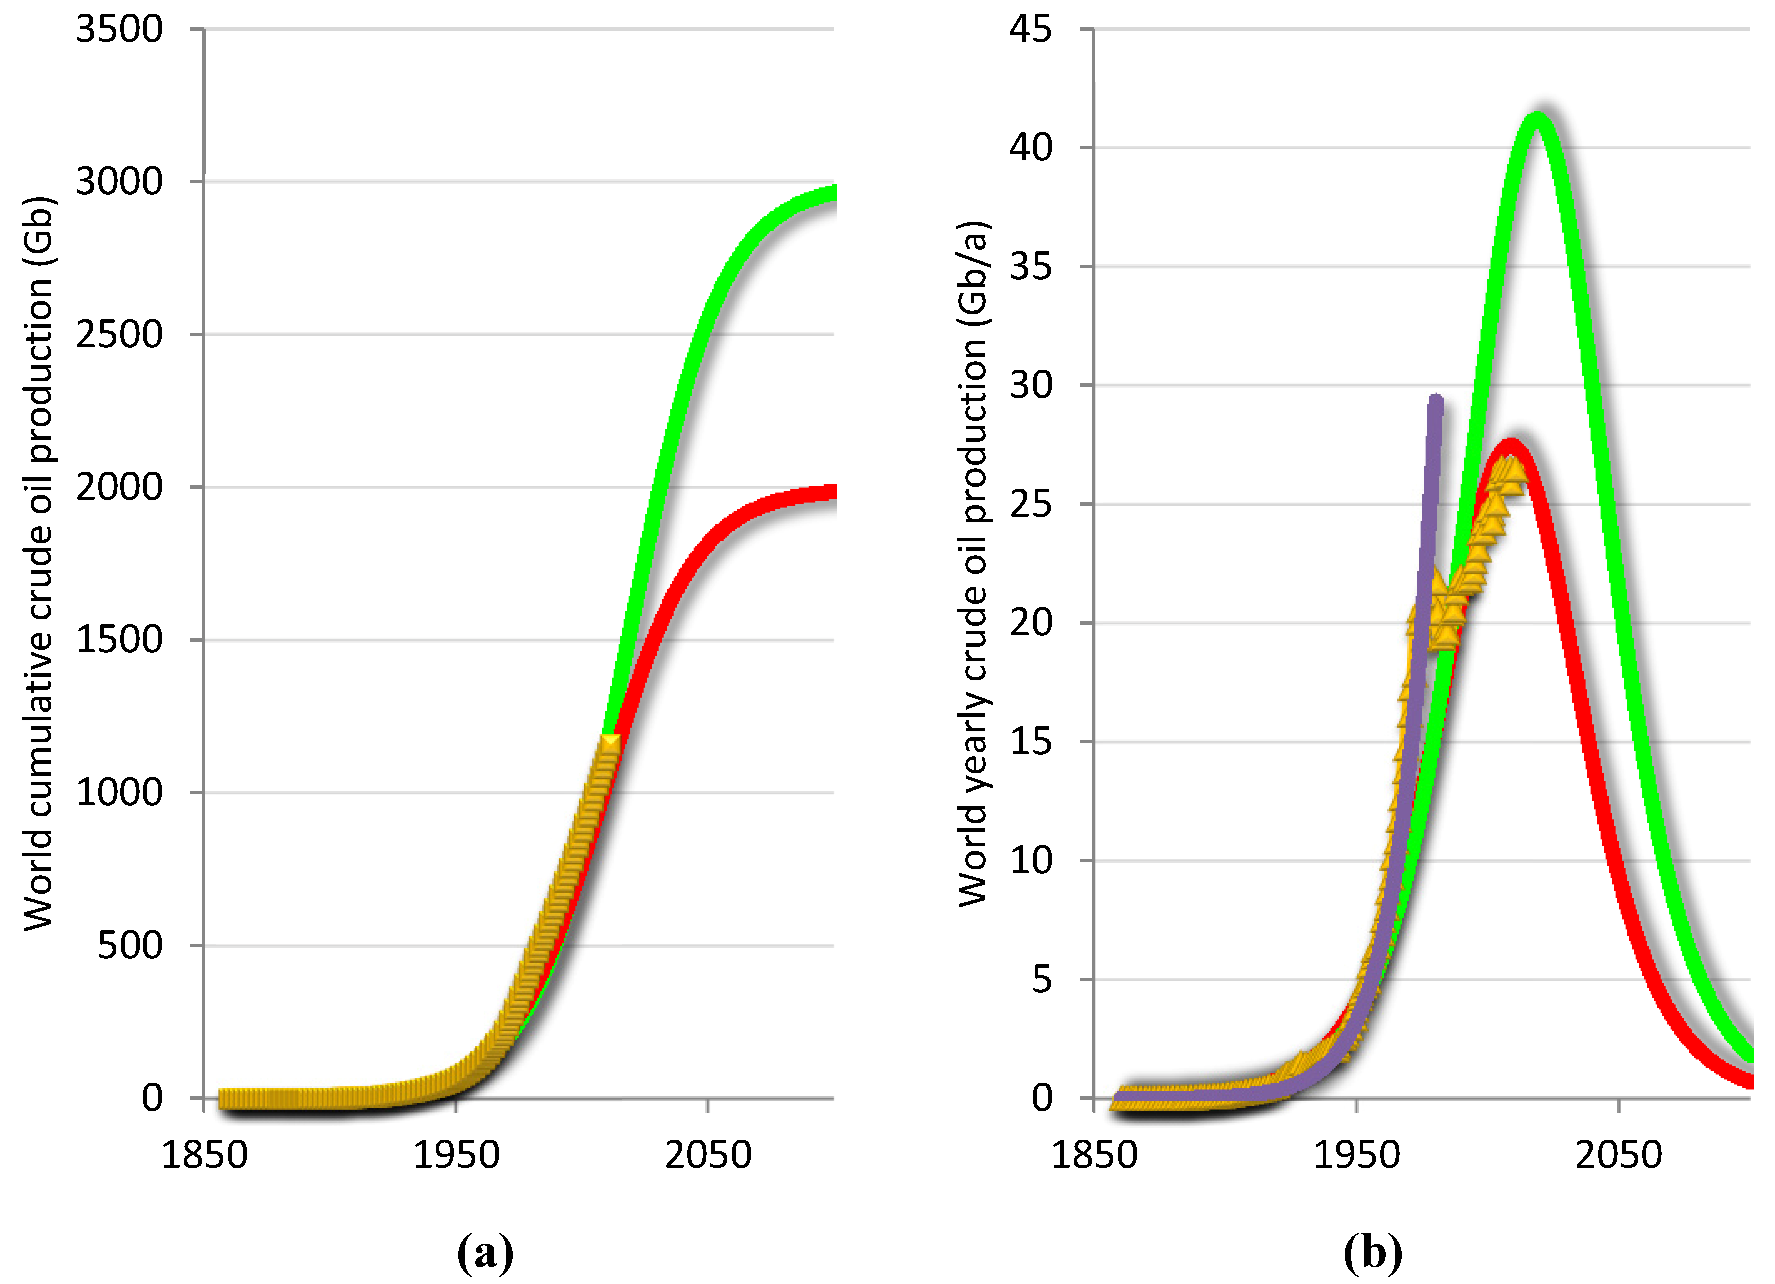
Extensions of the logistic curve technique to world conventional oil production are shown in
Figure 6, where both cumulative and yearly production data and logistic curves are shown. As of 2011, cumulative production was about 1,166 Gb. As has already been discussed, it is difficult to use the logistic function with past data to reliably predict the value of ultimately recoverable resource (URR). Here, we show the result of anon-linear least-squares fit to past production, using two different estimates of ultimately recoverable oil, 2,000 Gb and 3,000 Gb. The former should be considered a minimum value of URR to be expected. Parameters from the fits are such that there is a 5.3%/year initial exponential growth rate and peak-production years of 2008 and 2018 for 2,000 Gb and 3,000 Gb, respectively. Due to a large decrease in OPEC production during the decade between 1975 and 1985, the actual production curve is not smooth, somewhat complicating the interpretation of the logistic fits to the data. However, two main points are illustrated in
Figure 6, independent of the precision of fit between the data and the logistic model. In rough numbers, past production is a bit over 1,000 Gb, and, assuming an additional 1,000 Gb (red curves) or 2,000 Gb (green curves), the delay in timing of peak production is only 10 years. Put another way, each additional billion barrels of oil delays the peak by only about 3.6 days [
40,
41]. The second point, highly relevant to the current special issue, is shown by the purple curve in
Figure 6b, which shows the 7.5% per year exponential growth in rate of production that occurred over the first century of world oil production. Clearly, that exponential growth could not be maintained indefinitely, for many of the reasons discussed in
LtG and in the updates that followed [
1,
2,
3,
42].
The USGS made estimates in its 2,000 Assessment [
43] based on likely discoveries and additions to reserves from existing, already-discovered fields, but only assuming a time-horizon out to 2025. In follow-up work to their 2,000 Assessment [
43], authors from USGS were satisfied that progress toward projected discoveries were on track to meet the 3,000 Gb estimates, especially with respect to reserve growth from previously discovered fields, while less oil had been discovered in new fields [
44]. The issue of how reliable the USGS techniques may be when extended from experience in the U.S. to the rest of the world has also been discussed at length in the UKERC report [
16].
Figure 6.
Fits to actual production data for world conventional crude oil production. (a) World cumulative production (Gb) data (yellow squares) with logistic function fits for 5.5%/year initial growth rate and 2,000 Gb (red, lower curve) and 3,000 Gb (green, upper curve) ultimate recovery. (b) Yearly world crude oil production (Gb/year) with parameters corresponding to the curves in (a). The (purple) curve in the right-hand panel represents a 7.5%/year exponential growth rate that continued for the first century of oil production.
Use of the logistic curve technique requires some comment. It is clear that the method is over-simplified, as far as understanding details of the resource production process is concerned. There are also serious questions that can be raised about the use of the technique as a reliable predictor of the amount of oil to be recovered or of the exact timing of the peak [
16,
45,
46]. On the other hand, the technique works remarkably well as a heuristic model of oil production for a large region. Analyzing data by extrapolating past trends should be viewed critically, as will be discussed below. Although Hubbert himself did not start out using this technique, he did so in later work and refined his analysis over time. One point that is clear, however, is that he did not simply assume that the contemporary stated oil reserves were equivalent to the ultimately recoverable quantity of oil. As shown in figures he used [
5,
47], it was obvious that past production plus current reserves would be supplemented by future field extensions and new discoveries. An additional estimate, beyond that of declared reserves, was necessary for determining the URR.
Beyond the use of data for past production with the hope of understanding the potential for future production growth, there is one method that can perhaps lead to more reliable estimates. As summarized by several authors [
16,
35,
36], rather than concentrating on so-called “1P reserves”, which tend to be reported conservatively, and with the expectation that additional oil in these fields will be found and that the fields will be extended, a more reasonable approach is to count “2P reserves”, which are estimated to be available with a 50% probability. By proper accounting for oil in these fields through back-dating or assigning the resources to the date of initial field discovery, regardless of when a new fraction of the oil in place is deemed declarable as a reserve quantity, a very different picture is found of cumulative discoveries over time [
14]. Although thoroughly discussed in various publications [
16], the technique of backdating suffers from the problem that the necessary data are only available from proprietary databases that are very expensive to access.
2.5. Finding and Development Costs
There is surprisingly little data available on the economic driving factors of oil discovery, but what little exists in the published literature tends to indicate a small price elasticity of new supply, on the order of 0.1–0.2 [
30,
48,
49]. Therefore, economic driving factors are fairly unimportant in driving the discovery of new oil resources. Although the price elasticity of demand for oil is low, rising prices will certainly suppress demand; at the same time, if prices increase sufficiently, additional oil from existing fields or extracted with expensive technologies that were previously not economically viable can be moved into the reserves category. The tradeoff between these two factors may or may not serve to set an upper limit on maximum oil production. Although recently discovered fields have tended to be relatively small compared to the mega-giant and super-giant fields discovered in the middle of the past century, it is not completely out of the question that new, extremely large resources could be found. It is not logically necessary that the largest fields are found first, as evidenced by the discovery of smaller fields in the U.S. prior to those of East Texas [
50]. In any case, finding new sources of oil does appear to have become more difficult (geographically and geologically more challenging) and more expensive (deeper and more complicated drilling).
Over the past several years, as demonstrated by the data gathered by the EIA and other sources [
51,
52,
53], as shown in
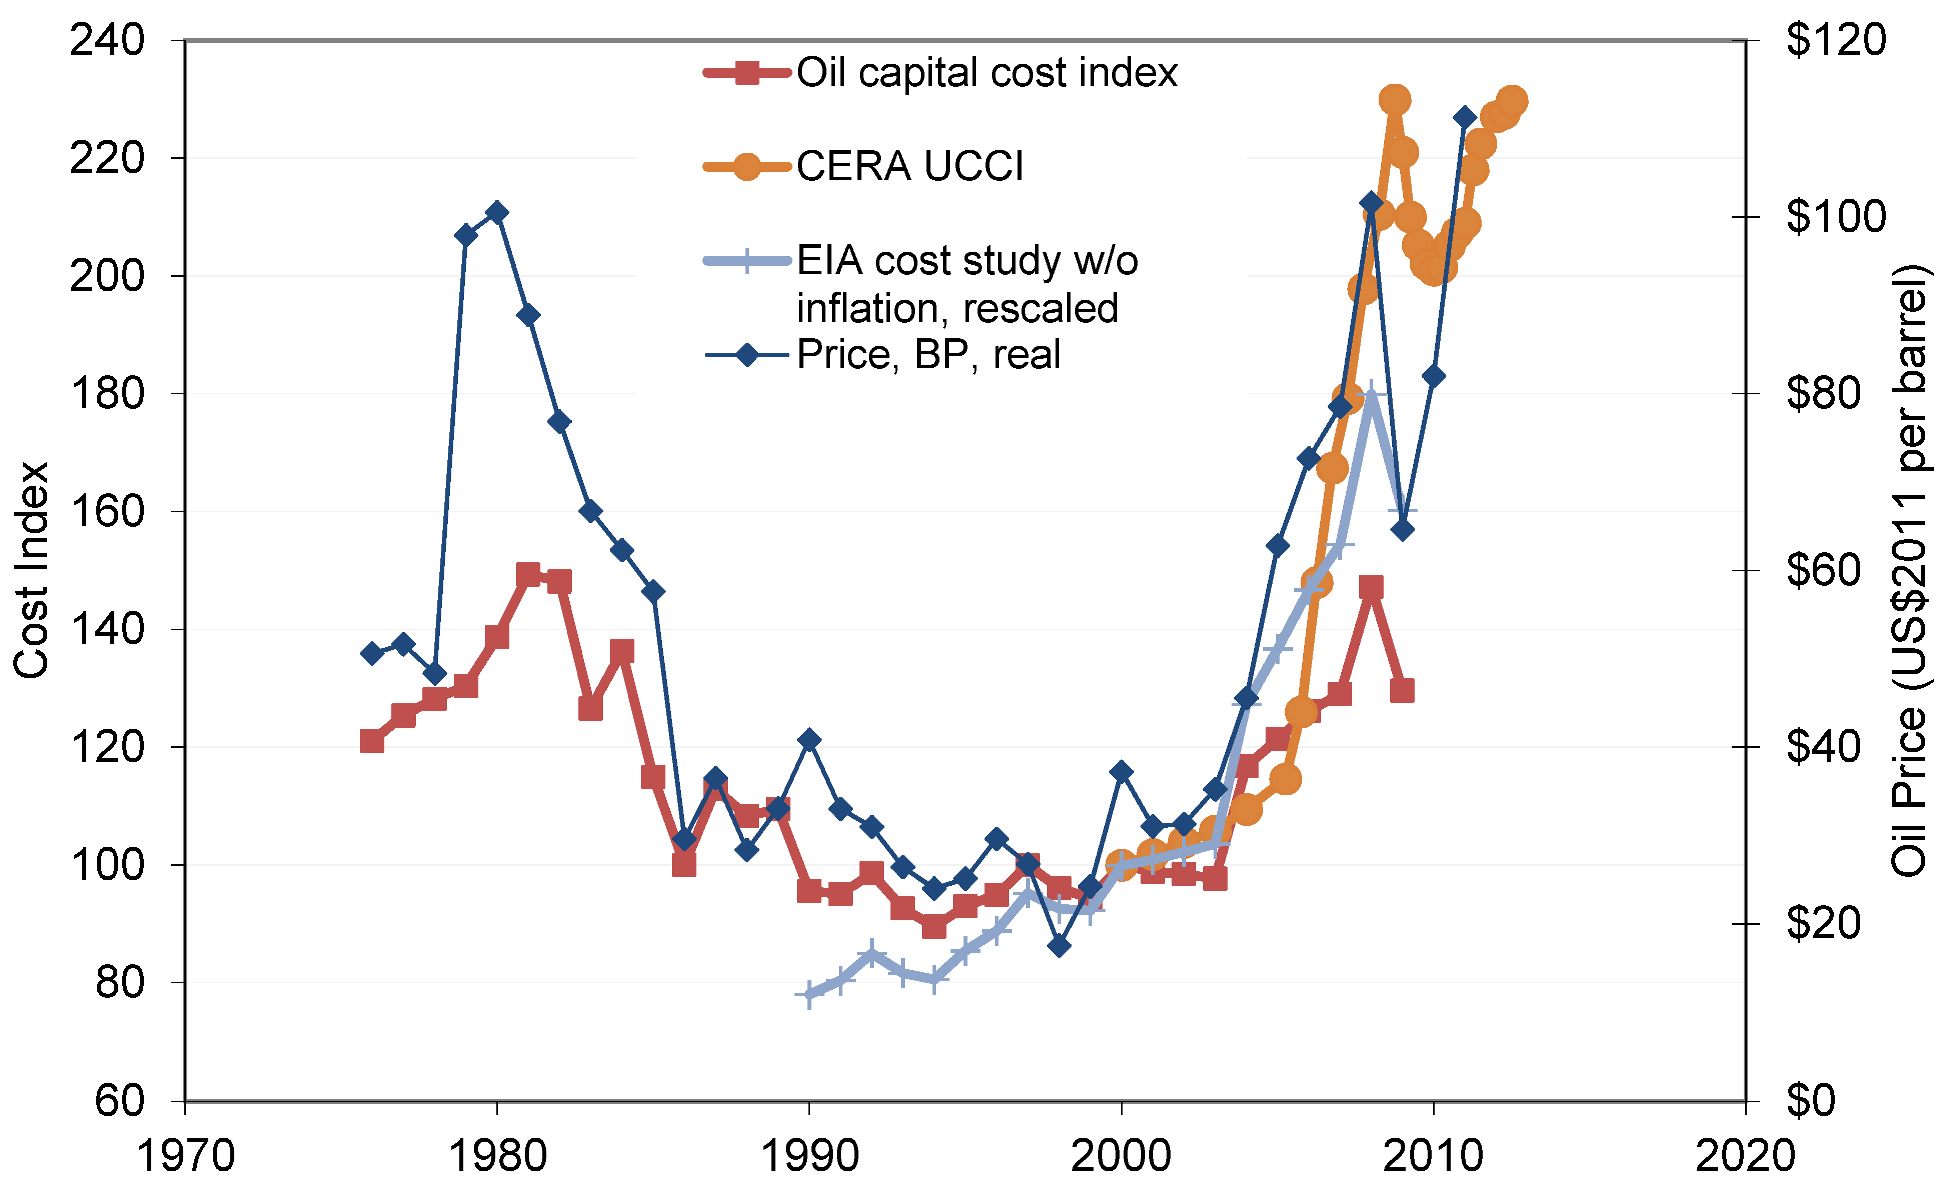
Figure 7, costs for finding new oil resources have risen dramatically.
Figure 6 shows the EIA capital cost index for US oil field operations, scaled such that the index is equal to 100 in the year 2000. Two versions are shown, one (red squares) with deflated values and one (light blue crosses) without inflation. The IHS CERA upstream capital cost index (UCCI) is similarly scaled to a value of 100 in the year 2000 and tracks the relative costs of a portfolio of oil and gas infrastructure (offshore, onshore, pipeline) projects. Part of the rise has been due to industry bottlenecks for equipment and rigs, but the need to explore in increasingly challenging environments and at increasing depths has also played a role [
51,
52,
53,
54]. In another ongoing set of EIA data (recently discontinued), finding and lifting costs for producers of oil and gas were published annually [
51]. These data also show a strong increase in costs over the past decade for those companies reporting data.
Figure 7.
Oil and gas cost indices and the real price of oil. Oil capital cost index from EIA [
52], scaled to 100 for the year 2000, and from IHS Cambridge Energy Research Associates [
53]. Oil price (right-hand axis) is from BP.
Figure 7.
Oil and gas cost indices and the real price of oil. Oil capital cost index from EIA [
52], scaled to 100 for the year 2000, and from IHS Cambridge Energy Research Associates [
53]. Oil price (right-hand axis) is from BP.
These trends seem to indicate that the “easy oil” is no longer available and certainly not in regions that are readily accessible to exploration companies. We will return to this theme below, but it is clear that as exploration and extraction costs increase, we can expect the price of oil to increase as well. The dynamics of supply and demand will have a large role in setting the market price, and inertia in the extraction sector may lead to temporary out-of-balance conditions, but one would expect the market price to be equal to the cost of producing the marginal barrel of oil. An interesting question would be to address the causality of the relationship between oil exploration and production costs, on the one hand, and oil prices on the other; from
Figure 7, there is clearly a strong correlation between the two. In the end, it is clear that increasingly expensive exploration and production efforts are economically viable if the market price of oil is high enough for producers to recover their costs. Costs have been rising, and producers are still moving forward with new projects. Once again, the fact that expensive resources, such as oil sands and light tight (shale) oil, are economically viable is an indicator of scarcity of cheaper conventional resources.
There is an interesting divergence in opinion as to extraction costs of oil. In recently published work [
55], estimates of remaining resources of conventional and non-conventional oil and natural gas are compiled, along with the costs of extraction for these resources. In this estimate, for extraction costs of under $20/bbl, there is a world-wide resource of approximately 3,500 Gb of conventional oil; including unconventional resources, nearly 30,000 Gb of resource is available for extraction costs of less than $35/bbl. Not only are these estimates dramatically different than those presented thus far, they also can lead to the false conclusion that there must currently be a severe distortion in oil markets that leads to both prices exceeding $100/barrel and costs for finding and producing oil that average $40/bbl today, with more expensive regions having costs exceeding $50/bbl [
51]. There are reasons to doubt the reliability of the optimistic resource estimates [
16], but more importantly, the presentation of cumulative availability curves is not equivalent to being able to make a statement about expected prices of oil. Average extraction costs across grades are not equivalent to the marginal cost of barrels being produced at a given time, which should set the market price [
56].
In another example, from the USGS [
57], estimates are made of the cost of producing oil in the National Petroleum Reserve in Alaska, an area that has been relatively well explored and with familiar, if not easy, conditions for putting infrastructure in place. Using the mean estimate for oil in place of 0.9 Gb, the authors calculate that approximately 50% of this amount can be economically extracted if oil prices are $90/bbl or more, and none would be economically viable if market priceAguilera
et al. [
55], and [
57] discusses only well-defined conventional resources.
Although direct comparisons are difficult to make due to varying techniques and definitions used in calculating extraction costs, it is striking that both the more detailed study of a given region [
57] and actual experience within the past decade [
51] show markedly higher costs of producing oil than would be indicated based on a more optimistic estimate of resource availability. One point that is often overlooked in forecasts of energy costs and availability is the potential for a feedback effect of energy prices on extraction costs. As described in Attanasi and Freeman, “Major components of oil and gas industry costs, such as drilling and service industry costs, are affected by oil and gas price levels and changes that commonly follow economic cycles. Between early 2005 and early 2011, world-market prices for crude oil have fluctuated between $34 per barrel and nearly $150 per barrel. The oil and gas industry typically faces increasing costs when price increases, particularly if the industry tries to rapidly increase output.” This phenomenon explains the close correlation seen in
Figure 7.
2.6. Spare Capacity
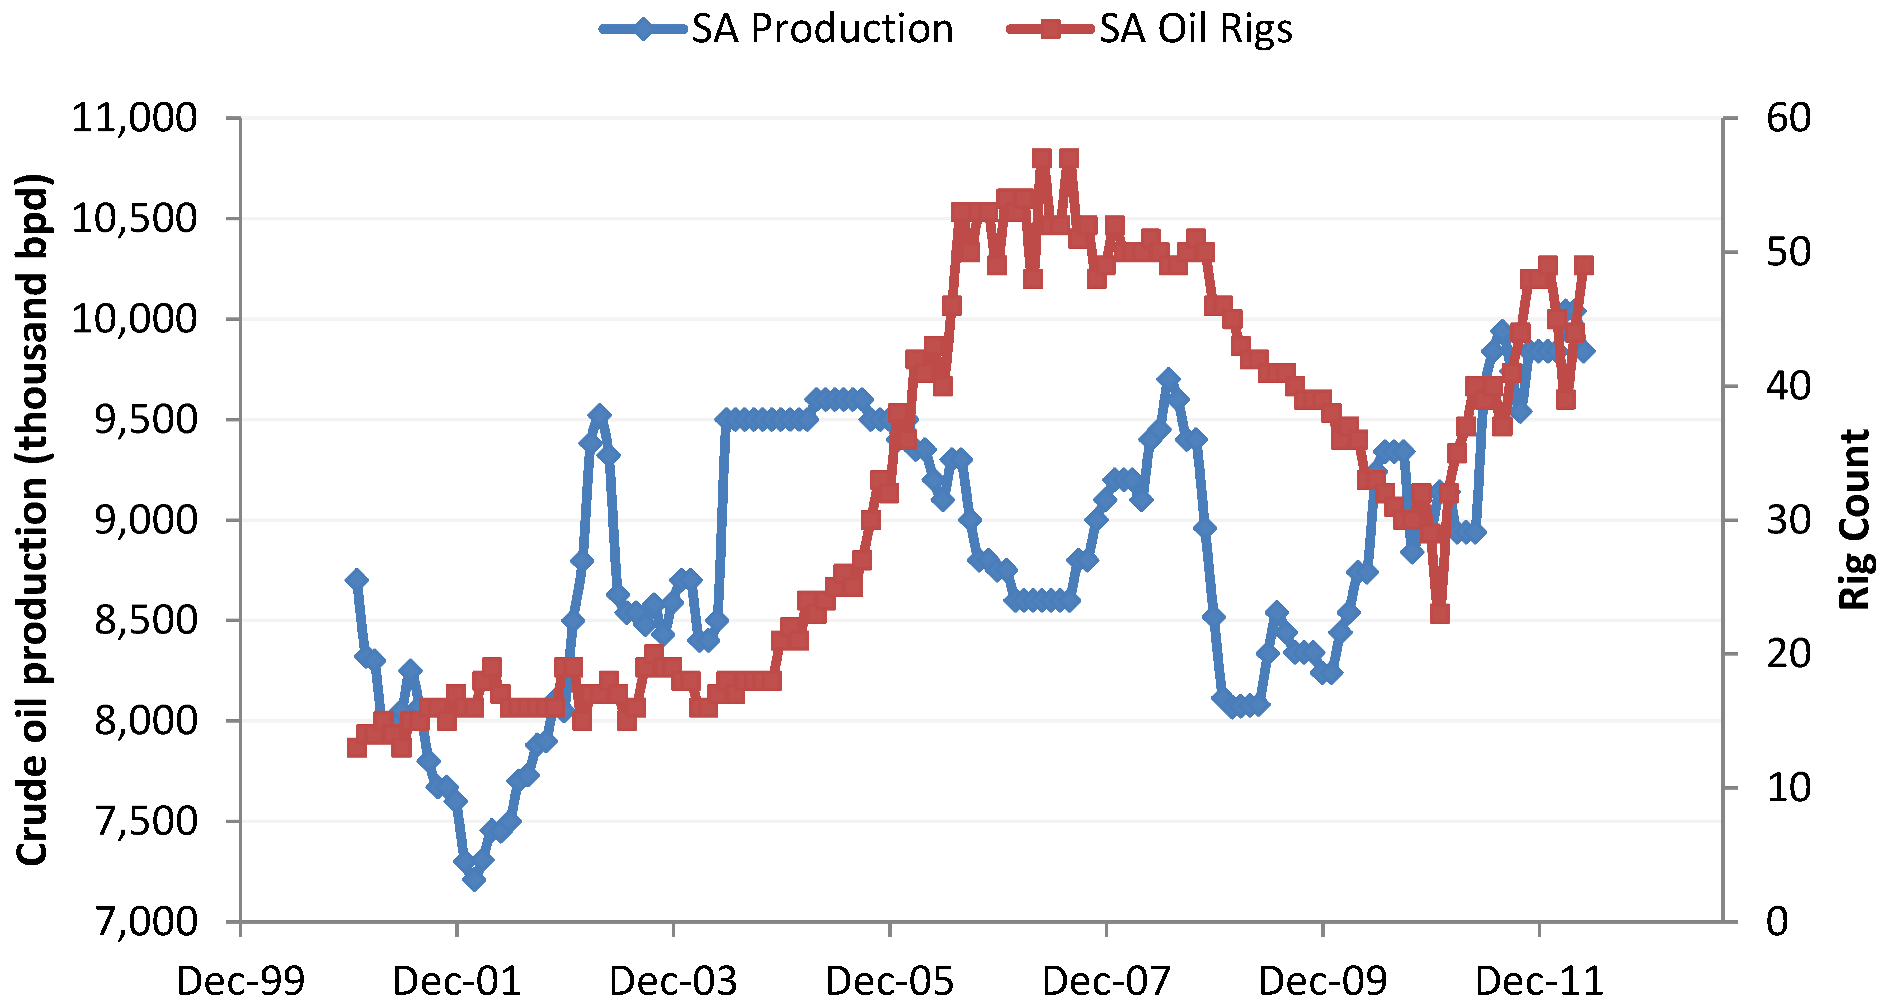
Saudi Arabia is generally seen as the world swing-producer for oil, with the largest reserves of conventional crude oil and the ability to raise output as needed. In fact, Saudi production decreased during the 2006–2008 period, but did start to ramp up again after the recession. As a side note, this overall lack of increase in production came in spite of a dramatic increase in the number of drilling rigs active in the country, as shown in
Figure 8. More to the point, looking at several years’ worth of editions of the US EIA International Energy Outlook shows the optimism with which Saudi capabilities were viewed. Starting in 2003, the reference scenario called for production of 13.6 MMbpd in 2010 and 23.8 MMbpd by 2025 [
58]. In the arguably more relevant “high oil price” scenario, production was expected to be 11.4 MMbpd in 2010 and 17.6 MMbpd in 2025. For more recent editions of the IEO (2009 and 2011), the reference scenario corresponds to recently observed prices that would have belonged to a previous “high price” scenario and projects only about 11 MMbpd in 2025 and only 15 MMbpd in 2035 [
19,
59]. The newest edition from 2012 projects production of about 11 MMbpd throughout the period to 2035, with a slight rise near the end [
60].
Figure 8.
Saudi Arabia output of petroleum. Production is given by the (blue) diamonds, rig count by the (red) squares.
Figure 8.
Saudi Arabia output of petroleum. Production is given by the (blue) diamonds, rig count by the (red) squares.
There are various ways to interpret the past disparity between actual production of Saudi oil and the expectations of energy agencies, such as the IEA and the US EIA, expectations that have been scaled back over time. One view is that OPEC, led by the Saudis, is in favor of high oil prices to increase their own revenue. Therefore, OPEC countries intentionally limit production for their own benefit. A counter-argument is that oil prices of $100+, as experienced currently and prior to the start of the economic recession of 2007–2009, are too high for importing countries and simply lead to demand destruction through moves toward greater efficiency and alternative modes of transportation or through decreased economic activity. The latter possibility has long been recognized, making the lack of increased production by Saudi Arabia and OPEC as a whole prior to 2008 that much more puzzling. It clearly takes a period of years to develop new fields, with investment planning occurring even earlier, but the world production capacity limit was well-defined during the price run-up starting around the turn of the century and certainly played a role in the high prices of oil in recent years [
21]. Is it possible that the Saudis could not increase production as much as was expected from them by importing countries?
A fascinating window into this question was opened by the release of the Wikileaks documents showing a series of discussions between US and Saudi officials, as well as with both current and former Aramco officials [
61,
62,
63]. The gist of the released conversations was essentially that the Saudis had spent $120 billion during the height of the boom in prices to bring their production capacity to 12.5 MMbpd. The Wikileaks documents appear to cast doubt on the possibility of production greater than about 12 MMbpd being achieved for more than short periods of time and this at a time when the US EIA was projecting production of 20 MMbpd or more. In the end, one point that seems clear is that the world lacks transparent sources of information from which fully objective conclusions might be based.
The International Energy Agency, in recent editions of its World Energy Outlook, has been warning about the confluence of relatively rapid economic growth, especially in developing countries, and the lack of sufficient prior investment in the petroleum system [
64,
65]. Due to this under-investment, the IEA has seen the likelihood of a severe supply crunch in the near future. In their most recent World Energy Outlook 2012 [
18], the country expected to contribute by far the most to future supply growth, beyond the shorter-term contribution from the US and a slight increase from Saudi Arabia (an additional 1 MMbpd by 2035), is Iraq. According to these projections, Iraq will triple its production from 2.7 MMbpd to over 8 MMbpd by 2035 to become the world’s fourth leading producer [
18]. Essentially, a large percentage of expected future growth in oil production is from a country with severe political and infrastructural challenges that may delay or preclude such increases in production. Shortages due to lack of investment do not correspond to the conventional definition of peak oil, but should this eventuality come to pass, the effects on world economies will be indistinguishable from a true resource-limited peak.
2.7. Export Capabilities of Producing Countries
One consequence of economic and population growth in oil-producing countries is that consumption increases; if production does not grow at least as much as consumption, the result is a decrease in the availability of oil for export [
66,
67,
68,
69]. Although not a sign of peak oil directly, decreasing export capabilities of producing countries will have the effect on importers of reducing supply. If there is a limited (or no) ability to expand production, as would be the case near a peak, then trade-offs will have to be made between domestic consumption to support industries, commercial activity and household transportation and the potential for income through exports.
As is always the case with energy forecasts, there is a great deal of uncertainty in projecting trends for the consumption paths for countries that are also oil exporters. However, given that developing countries in particular have always followed a path of increased consumption of energy as wealth increases, it is reasonable to assume this as a starting point. Taking this as a starting point, along with production data for these same countries, it is not surprising that one finds many scenarios in which net exports will decrease [
68]. Previous history also shows prominent examples of countries that change from being net exporters and, in the case of Indonesia, even a member of OPEC, to being net-import countries, as both population and per-capita development levels increase [
69].
Data from BP for production and consumption show that the largest exporting countries were able to increase net exports steadily during the late 1980s and 1990s and into the beginning of this century [
70]. China was not a insignificant exporter and has also managed to continue increasing production of oil to the present. However, with China’s rapid economic growth of the past two decades, it has become a large net importer of oil (the BP data show production and consumption data for all liquid fuels, not only conventional crude oil). Since about 2005, at the same time worldwide crude oil production has stagnated, exports from the largest exporters have also reached a plateau or decreased slightly.
A further important point concerning exports is that of subsidies often provided by producing countries to their own citizens [
71]. Prices for fuel in many Middle East countries that are large producers of oil are as much a factor of ten less than prices in other countries, even those at similar stages of development [
71]. These subsidies have two major consequences, both with repercussions for the world oil market. First, by artificially keeping costs for fuels low, inefficiency is encouraged. Whereas most countries have decreased energy intensity (defined as energy consumed per dollar of economic output) over the past several decades, Saudi Arabia, for example, has become less efficient, with energy intensity increasing continuously [
71]. The second effect of artificially low prices for energy is that foregone income to the oil-producing sector leads to lowered incentives for investment in new and expanded infrastructure. The International Energy Agency has already been projecting for several years that current levels of investment in oil and gas infrastructure are significantly less than what is necessary to offset aging and production decline of existing capacity, with the potential to lead to supply bottlenecks [
64,
72].
2.8. System Inertia and Timing
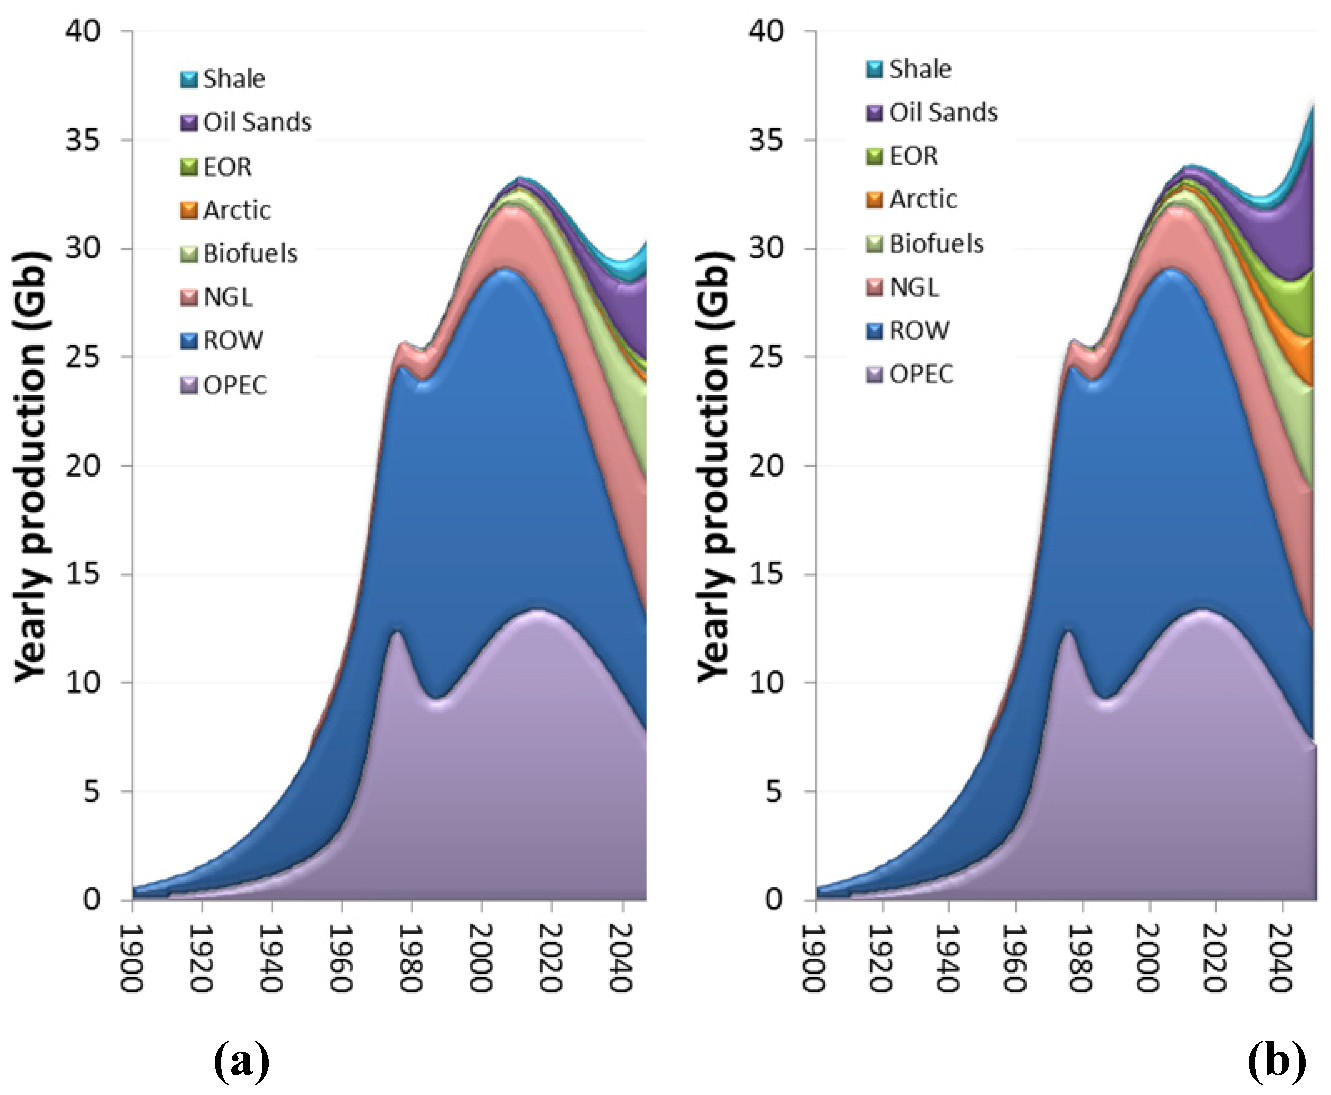
Another approach to looking at peak oil production is that the challenge is fundamentally one of flow rates and time scales and not of stocks. That is, there may be plenty of oil (conventional and non-conventional) in the ground, but that it simply cannot be extracted fast enough to satisfy growing demand. In
Figure 9 are shown two paths for past and potential future production of oil and other liquids. We use the fits discussed in Sec. 5 with a total URR of conventional oil of approximately 2,000 Gb to determine logistic function yearly production curves for past production. In the total for OPEC and ROW (Rest of the World) conventional oil, we have not included enhanced oil recovery and Arctic/Deepwater oil, both additional conventional resources. One adjustment was made in that OPEC historical production was fit using two logistic curves, in an attempt to better account for the form of the historical data that show a breakpoint in the 1970s during the energy crises. For nonconventional oil, we use a combination of current production, historical and industry-projected rates of production increase, along with estimates of total recoverable amounts, to construct curves for future supply [
72,
73]. Finally, using projected growth rates for biofuels and natural gas liquids [
65], we include those curves as well. This is a very simple model, but taken in the spirit of using estimates of recoverable quantities provided by agencies, such as the IEA, as a starting point. Since there is no economic input in the form of supply and demand interactions, these curves are derived purely from the deterministic nature of the logistic function; once the URR has been used as an input parameter and historical data patterns are observed to be certain that the projected logistic curves match with past production, the logistic curve is defined for all time periods. We do leave as a free parameter for unconventional oil resources the growth rate of capacity build-up.
In
Figure 9 (a), we assume that the new technologies (enhanced oil recovery (EOR), Arctic) and nonconventional resources (oil sands and shale) have rates of increase in production of 7%/year, reflecting an optimistic extension of historical experience, whereas in
Figure 9 (b), those rates are 10%, a higher rate than was ever sustained for conventional sources and significantly higher than projected rates for oil sand development, even under recent optimistic economic conditions [
73]. Two main points come from this simple analysis. First, although the resources are assumed to be in the ground, there is a bottleneck in production. Historically, there has never been a prolonged period in which a fossil resource has increased in production by more than about 7%/year, even with conventional resources [
42]. Similar issues have been pointed out previously, with an emphasis on limitations to the economically viable rate of build-up of capital, since investments that are forced to occur too quickly are more expensive [
56].
The second point, that in each case shown in
Figure 9, total world production of liquid fuels peaks temporarily in the very near future, declines and then, in this simple deterministic model, after a few decades, begins to rise again. The reality is that the secondary peak would likely never materialize, since the near-term gap between supply and demand, with little time for world economies to react and adapt, would force large-scale fuel- and technology-switching, following much the same logic discussed in
Section 2. Further implications of the inability to increase supply are discussed in the final section of this paper. More details of this model are presented elsewhere [
45], but it must be pointed out that, due to its simplicity and lack of economic dynamics, the results are again simply indicative of the potential for a near-term peak.
Figure 9.
Possible production trajectories under assumptions of growth rates that reflect past history (a) or for significantly more rapid growth rates (b). Total conventional ultimately recoverable resource (URR) is 2,500 Gb (OPEC, Rest of the World (ROW), enhanced oil recovery (EOR), Arctic); URR for oil sands and shale oil assumed to be 1,000 Gb each. Included in shale is light, tight oil, although that is a recognized to be a different unconventional source.
There is a further interesting feature that arises out of this analysis. We note that non-conventional and other sources begin production well before the “easier” and cheaper sources of oil are depleted and, in fact, well before they peak in production in most cases. A rational approach to optimal exploitation of natural resources would lead one to expect a sequential extraction of resources, starting with the cheapest, progressing to the next more expensive category,
etc. [
74]. Since, however, within each category, we can rather think that there will be an overlapping progression of logistic-like curves, there is a need to pull forward in time the extraction of more-expensive resources before the less-expensive resources are fully depleted. The resulting rapid increase in costs and, therefore, prices of liquid fuels is illustrated schematically in
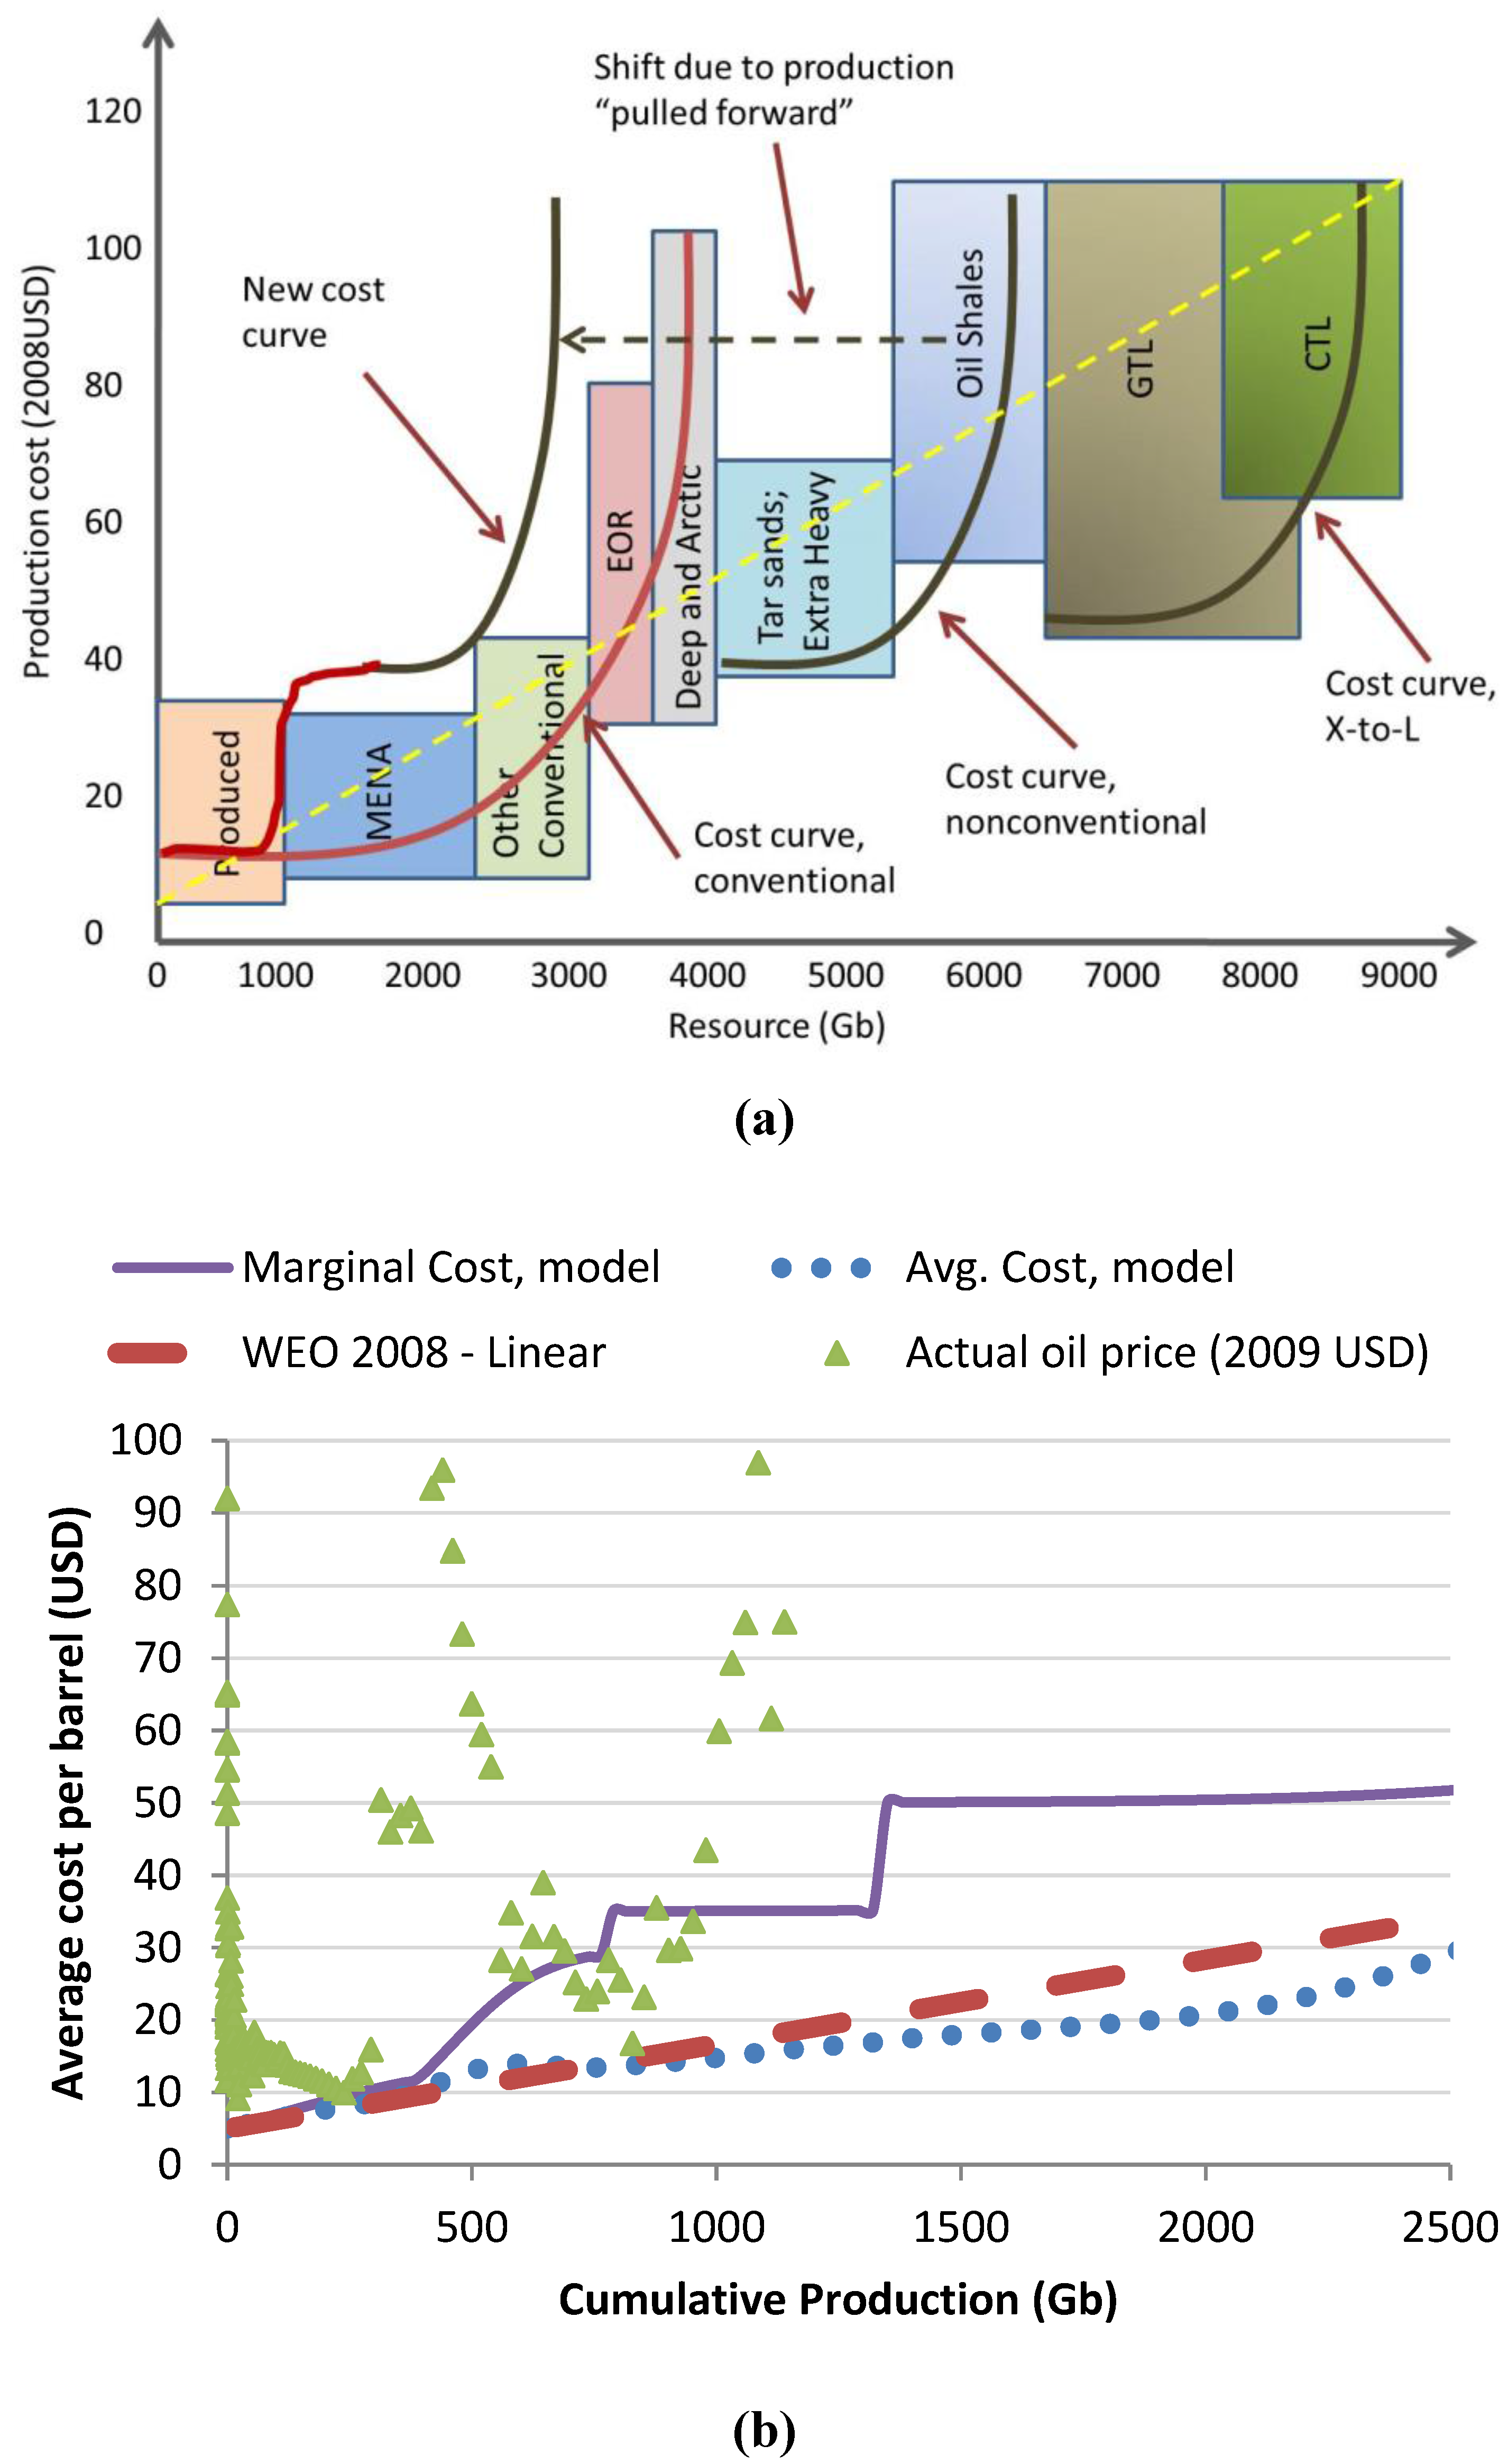
Figure 10 (a), with output data from the deterministic logistic extraction model shown in
Figure 10 (b).
Figure 10.
Cost availability curves.(a) schematic marginal production cost curves. In this representation, extraction costs for each individual resource contribute to an overall curve that increases much more rapidly than one would expect from a “rational” extraction sequence, always proceeding from the cheapest available resource to the next most expensive, etc. Concrete results from the deterministic logistic model of extraction of different resource grades is shown in (b). A linear increase in costs would be predicted from a perfectly sequential extraction of resources; the output of the model shows that the average cost is close to that linear approximation, but the marginal cost is usually much higher.
The starting point for this figure is data for extraction cost and recoverable quantity estimates from the IEA [
72]. Since we model for each resource a logistic-type curve in production, as overall demand increases and depletion of a given resource sets in, although there may be 50% or more of the resource still in place, it is necessary to start extracting the next most expensive resource; if the markets are functioning properly, this will only work if the price paid for that resource covers the increased extraction costs. Effectively, the curves published by IEA [
72] and, more recently, by Aguilera [
75] represent “cost availability curves” and should not be read as a snapshot in time of the amount of resource available at a given cost or to be considered as marginal extraction cost curves. As shown in
Figure 10 (b), as soon as the growth rate of production of one resource begins to slow, as it must, to meet rising demand, a new resource must be tapped. That new resource has a higher extraction cost and, therefore, demands a higher market price to be viable. This dynamic automatically means that the owners of the less expensive resources capture the scarcity rent; in other words, the shift of extraction cost curves leads to a situation that would cause some to ask, “If there is so much cheap oil in the ground, why are the prices so high right now?” Current estimates of costs of producing various types of oil show maximum costs of $80/barrel, although the vast majority of oil is being produced for under $30/barrel [
69].
2.9. Reserves-to-Production Ratio
Resources of oil in the ground can be divided into several different categories that have been mentioned in the passing previous section: conventional crude oil, natural gas liquids, non-conventional oil shale (kerogen), light tight oil (shale oil),
etc. Furthermore, as exploration proceeds, resources become better defined, both geologically and economically. A common categorization of reserves, that fraction of the resource base that is technologically and economically recoverable, is based on probabilities of extraction feasibility. “Proved” or 1P reserves are generally taken to exist with a 90% likelihood, whereas “probable” or 2P reserves will have a 50% likelihood of availability. Defining exact reserve quantities is therefore inherently uncertain [
14,
33,
36,
76].
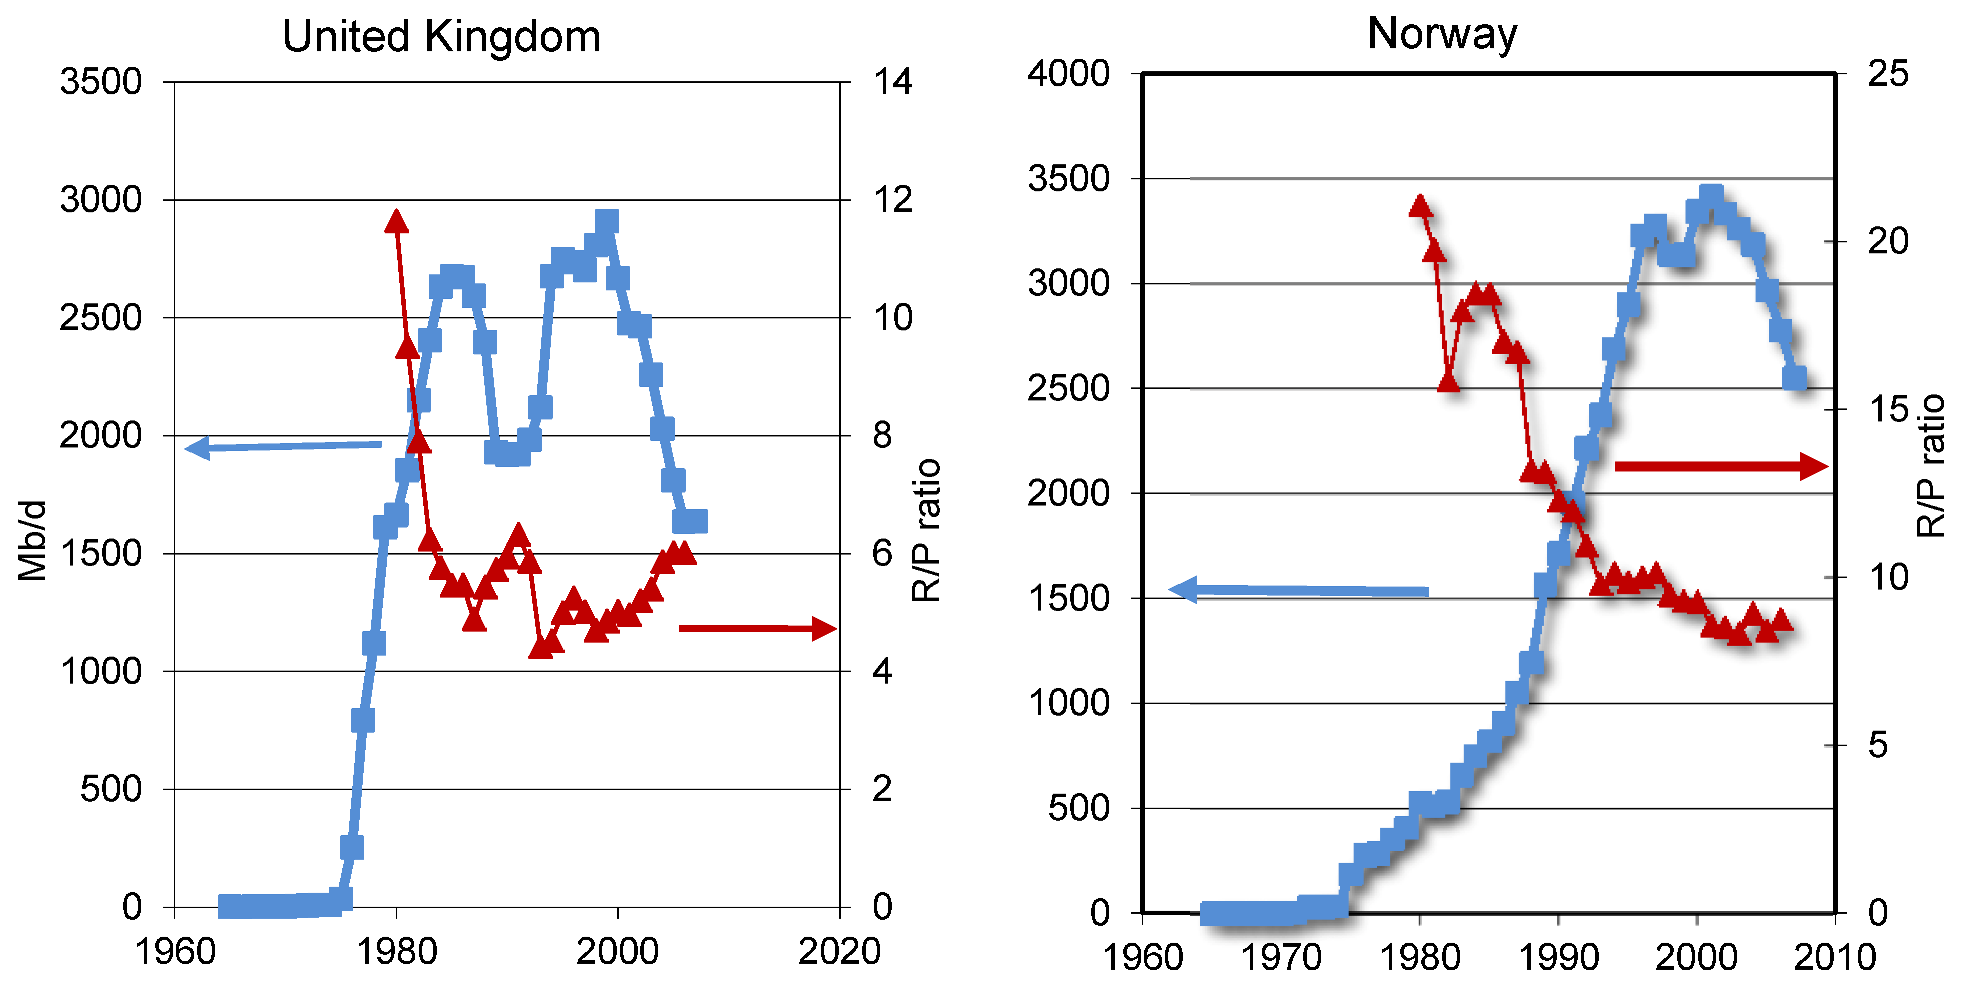
The most easily available data are for 1P reserves [
70]. The ratio of declared reserves to current production is often quoted as the “years left” for a resource. This quantity was critically analyzed in
LtG as being very misleading for a system with growing production. As we see in
Figure 11, for the UK and Norway, R/P has little relation to production itself. In the UK, R/P has been increasing during the time of steepest production decline, whereas in Norway, R/P has leveled out, with production decreasing sharply [
34]. Sorting out reserves information for crude oil alone is difficult; the growth seen in reserves data is augmented by the addition of some of the non-conventional sources mentioned above. From year to year, the reserves data do show increases, even in the face of continued production, as new reserves taken from the “resources” category become economically viable and are more than enough to make up for decreases in reserves due to production.
Figure 11.
Yearly production (blue squares) and the reserves-to-production ratio (red triangles) for the UK and Norway
Figure 11.
Yearly production (blue squares) and the reserves-to-production ratio (red triangles) for the UK and Norway
Note that this interpretation of the R/P ratio is somewhat different from what is often used. Those who are technological and resource optimists rightly criticize the fact that this ratio means little, since it is almost certain that current reserves will increase and that R/P reflects a static view of resources. However, it is rarely pointed out that a constant or even a continually increasing reserve-to-production ratio can be consistent with an actual decline in production of the resource. Thus, it really is the case that this ratio means nothing at all as a diagnostic of a potential peak in world oil production. A detailed discussion of depletion and R/P ratios using more detailed modeling can be found elsewhere [
77].
Declared reserves of oil do continue to grow, as reported in the BP Statistical Review of World Energy [
34]. Some authors have claimed that reserves, especially in the case of OPEC countries, are possibly overstated, due to production quotas in the 1980s that were based on declared reserves [
14]. Several countries showed sudden and dramatic increases in declared reserves from one year to another, often of 100% or more, without convincing evidence of large discoveries. Notwithstanding these possibilities, the more important point is that made above.
2.10. Past History of Depletion and Optimism
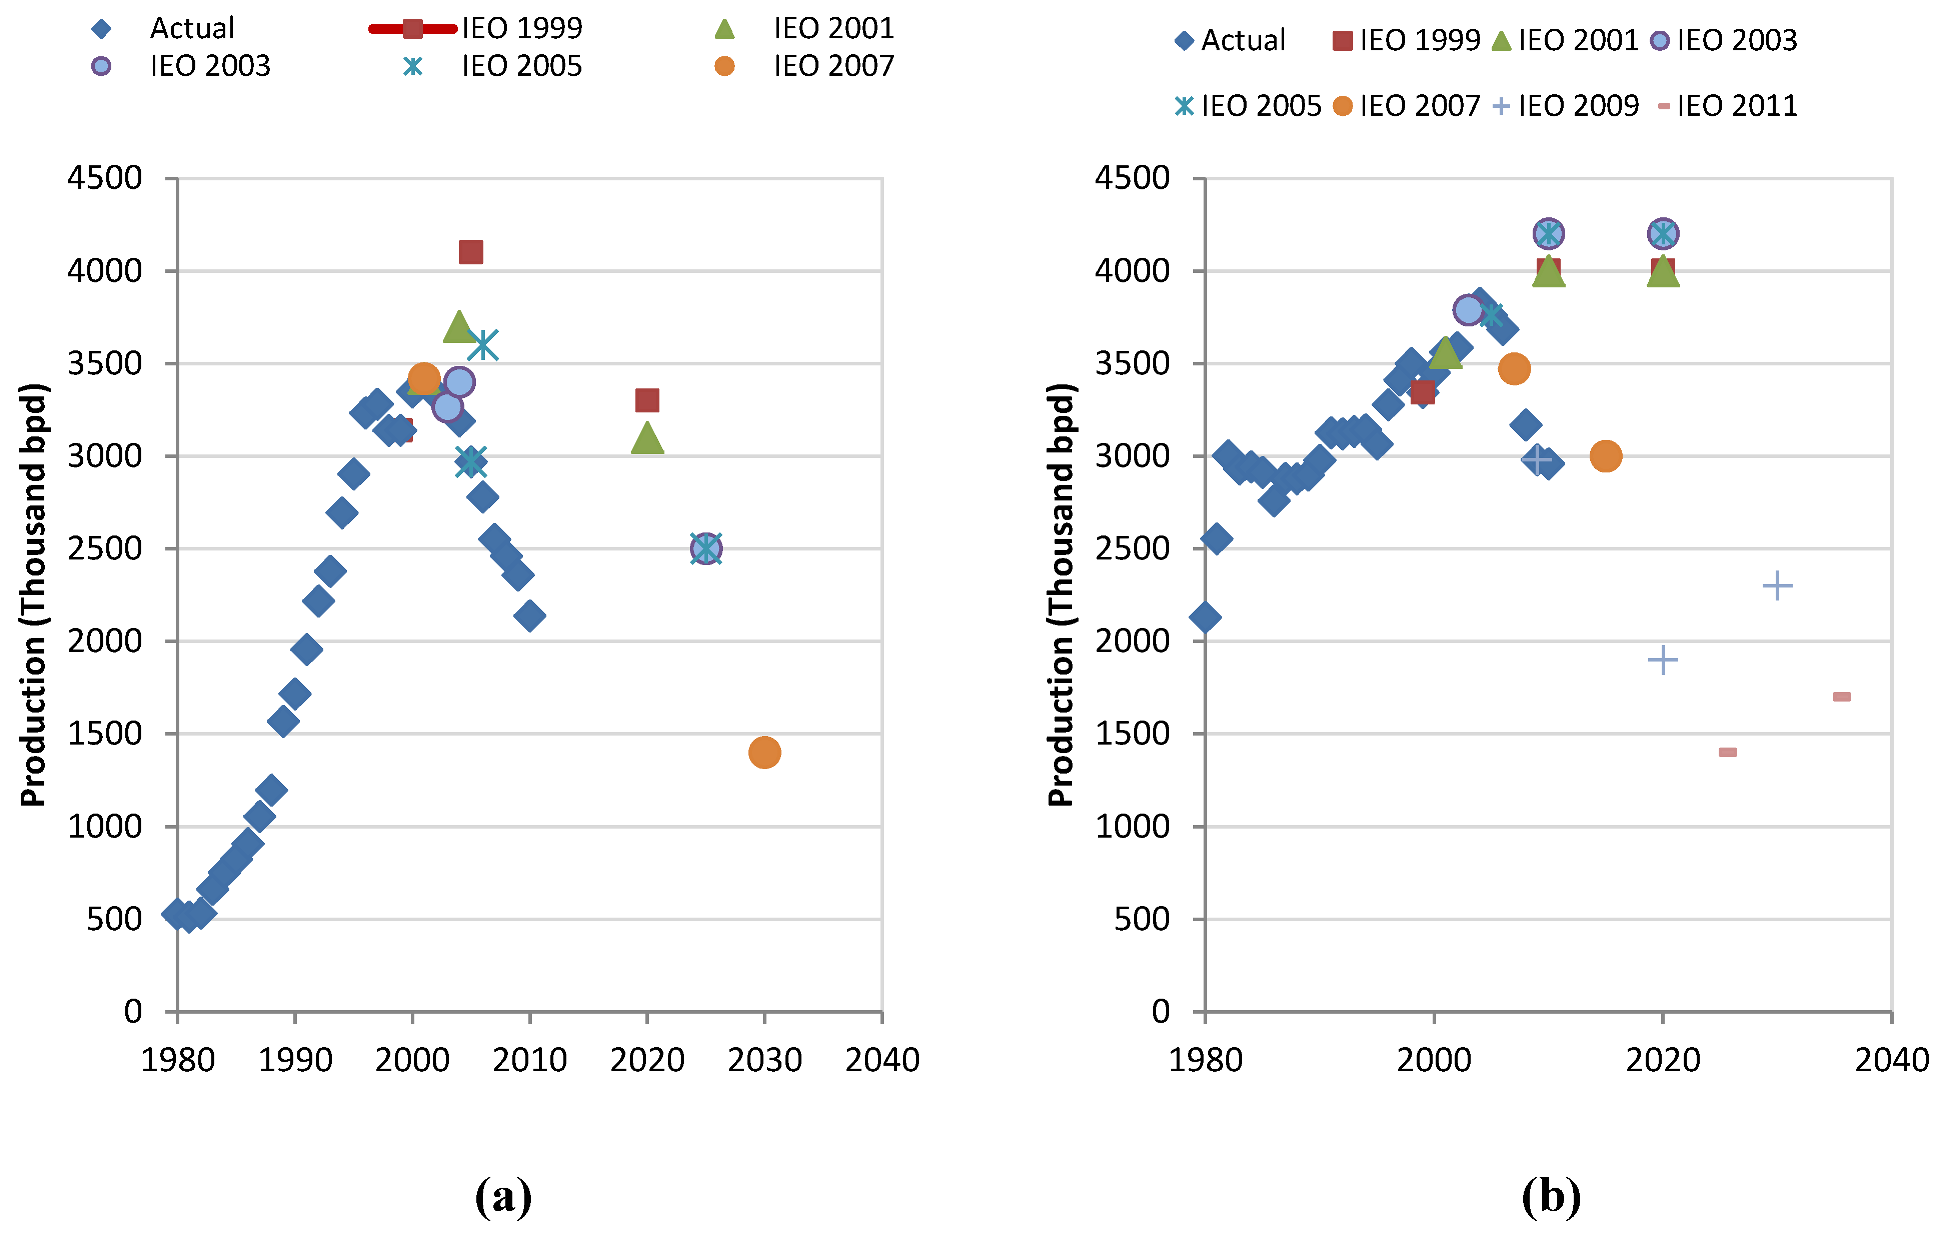
It is certainly clear that fossil fuels represent finite resources and, therefore, cannot be extracted indefinitely. In
Figure 12, the actual past production for two countries, Norway and Mexico, are shown using EIA data. Each year in the International Energy Outlook (IEO), the EIA projects future production for different countries and regions. In several cases, projections were repeatedly made for peak production coming several years in the future for countries whose peak production was
already in the past. For example, production in Norway has been in decline since 2000 (
Figure 12 (a)), although the EIA continued to project increases for several years after that peak. Similarly, for the UK, predictions of future increases in production came well after production had begun to decline. More recently, Mexico, with a large fraction of its production coming from the large Cantarell field, has seen decreasing production (
Figure 12 (b)) and at a rapid rate.
Figure 12.
Yearly production from (a) Norway and (b) Mexico (both with blue diamonds), together with projections by the EIA for future production from various volumes of the International Energy Outlook, as labeled.
Figure 12.
Yearly production from (a) Norway and (b) Mexico (both with blue diamonds), together with projections by the EIA for future production from various volumes of the International Energy Outlook, as labeled.
The point here is not as much the unsurprising one that various countries have passed peak production, but rather, that one of the agencies most actively involved in forecasting the availability of resources could be so much in error and always in the direction of being overly-optimistic. One can imagine that in the case of some countries, making predictions of future production is difficult due to political issues (Iraq or Iran, for example) or due to a lack of certainty in the investment environment, leading to sub-optimal long-term decisions being made. However, Norway and the UK clearly do not fall into that category.
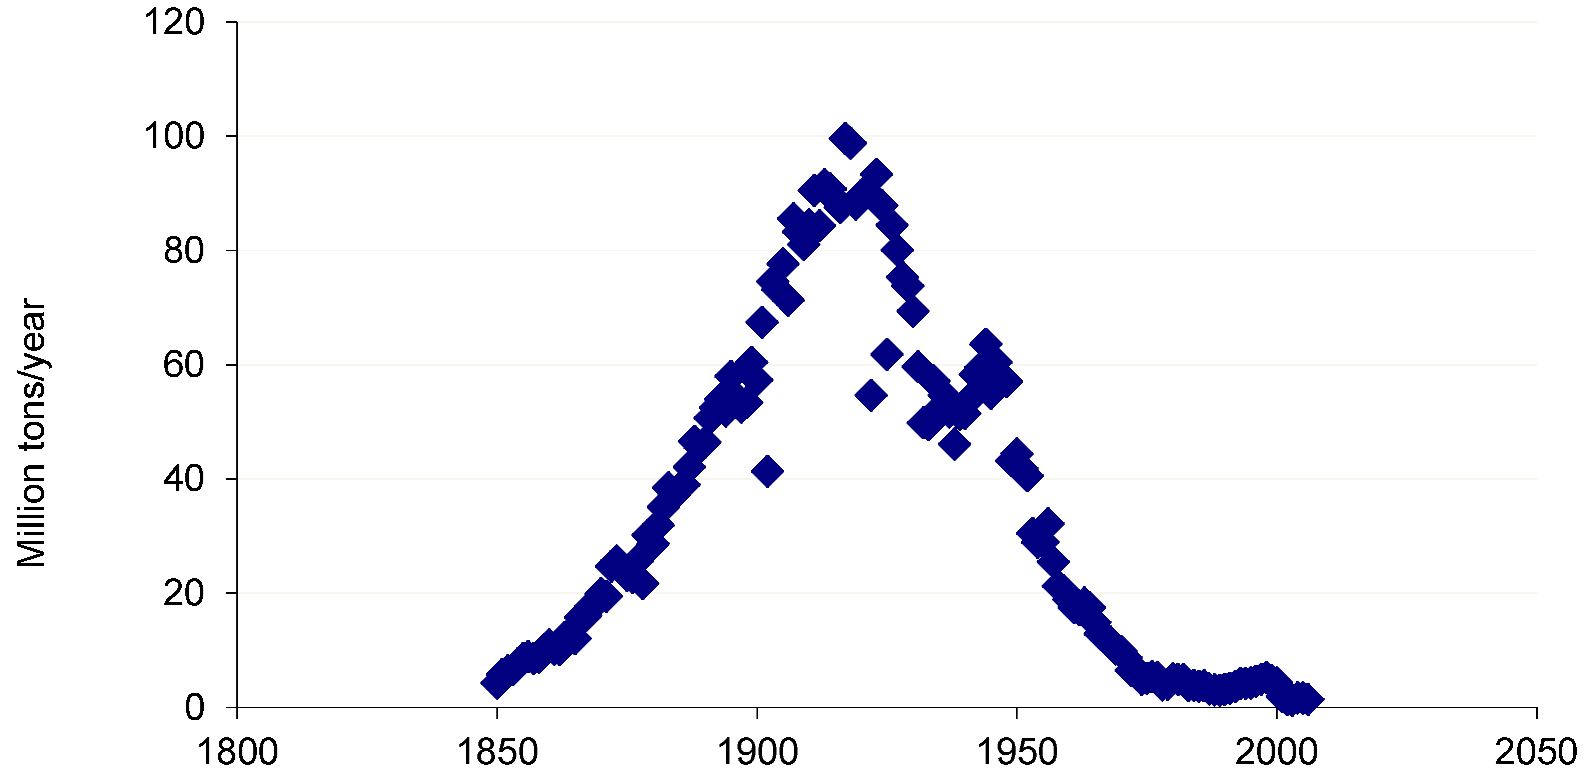
Previous examples of “peaking” include the mining of anthracite coal in the U.S. and production of coal in England. Anthracite is a high-quality, low-sulfur coal, but our maximum rate of yearly production occurred in the very early part of this century, as shown in
Figure 13. There were certainly more reasons than simply geological exhaustion that led to declining production, but geology just as clearly played a role in production decline. Likewise, in England, coal, which had been the fuel of the industrial revolution, went into production decline on the eve of the First World War, as has been discussed in the context of optimistic estimates of world coal resources by Rutledge [
78].
Figure 13.
Yearly production of anthracite in the U.S.
Figure 13.
Yearly production of anthracite in the U.S.
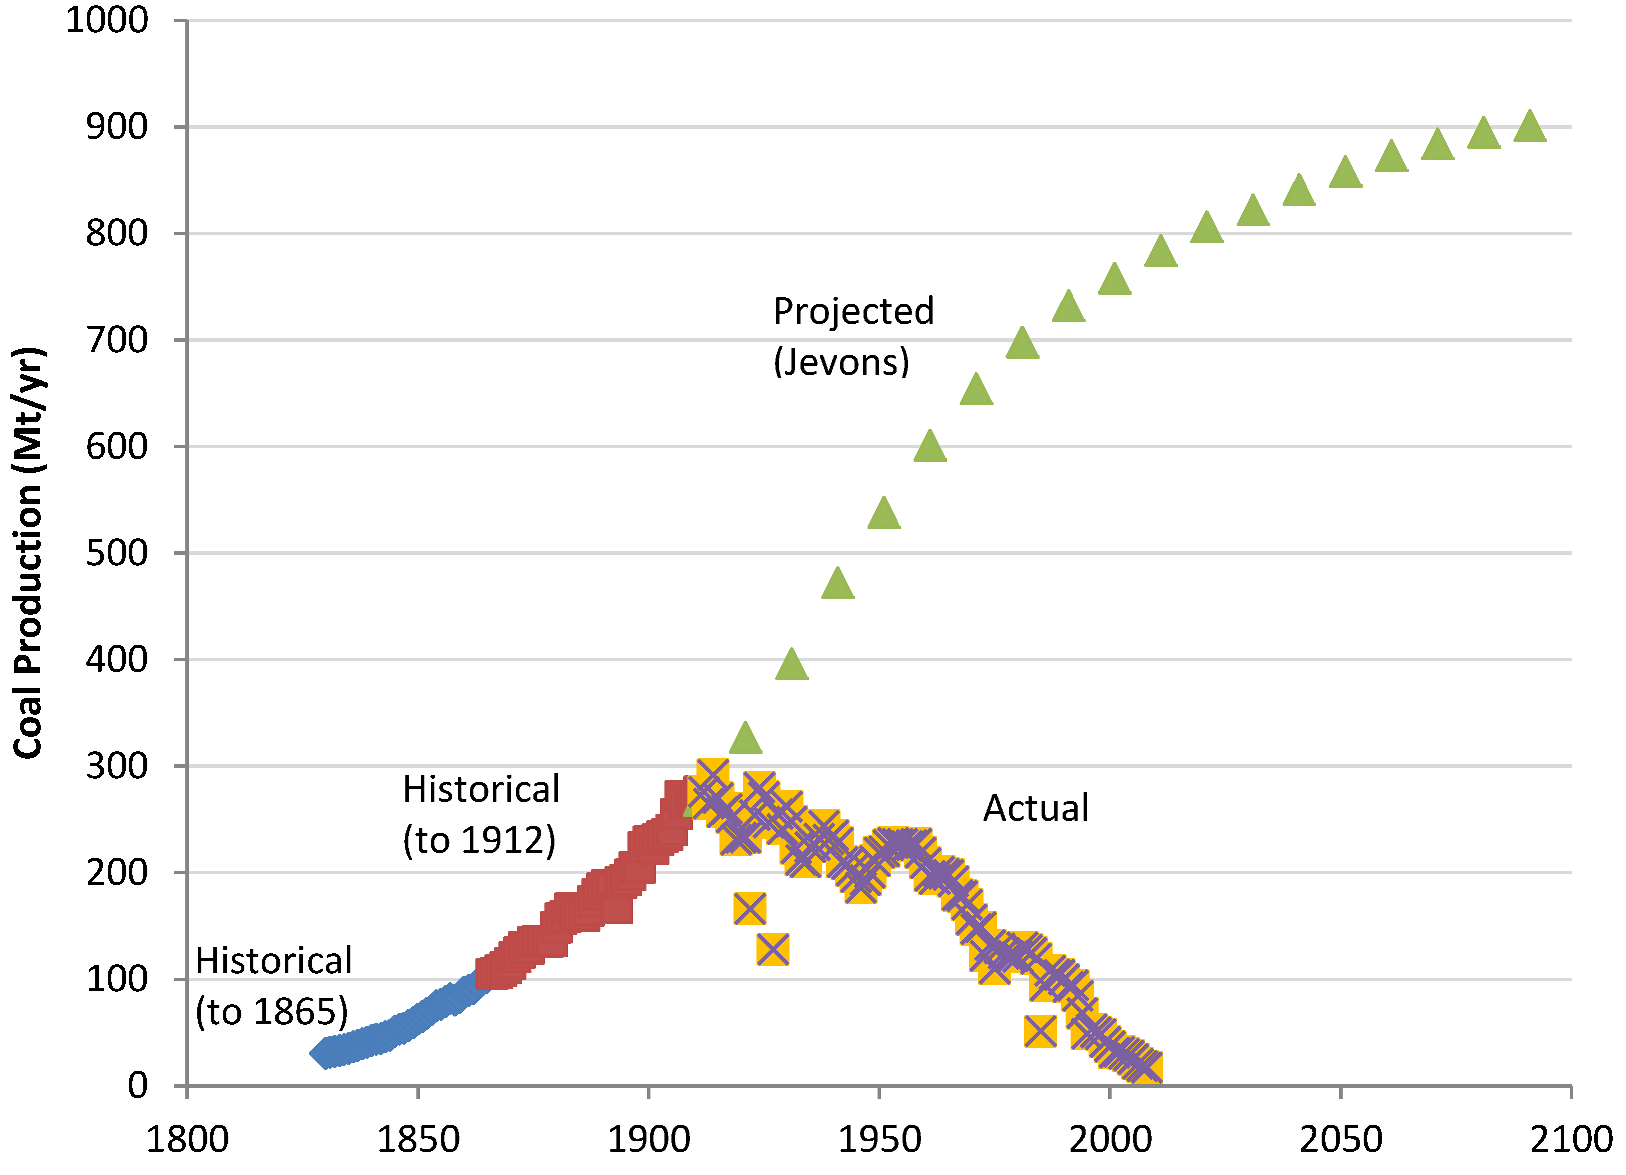
As mentioned in the introduction, the current peak oil debate was preceded over a century ago by the debate in England over peak coal. The economist and philosopher of science, W. Stanley Jevons, wrote about the threat to British economic prosperity if coal production were not to keep pace with internal demand brought about by increasing wealth and population [
10]. His son, H. Stanley Jevons, writing a few decades later, had the advantage of the latest complete data from the British Geological Survey and put together what we might now term an integrated assessment model [
11], including projections of population growth, demand for coal based on growing wealth and, most importantly, estimating the availability of coal at given extraction costs, based on geology and technological progress in being able to extract coal economically.
Figure 14.
Production of coal in England. Historical production is shown in three segments: up to 1865, when W.S. Jevons wrote The Coal Question; from 1865 to 1912, when his son wrote about coal, and then production after 1912. The triangles show projections made by H.S. Jevons in 1912 using careful geological and socioeconomic projections.
The results of his projections are shown in
Figure 14. The different regions of data represent the historical record to 1865, when W. Stanley Jevons started worrying about coal-mine exhaustion in Britain, followed by production data between 1865 and 1912, the data available to H. Stanley Jevons. The latter estimated peak production in about 2100, at a production level approximately three times that of 1912. In actuality, production started declining in the very year that his work was published, never to increase significantly again. Total coal production in Britain will eventually reach somewhat less than 30 Gt; extrapolating the estimates of Jevons would lead to a conclusion that roughly ten-times as much coal should have been available. It is often claimed that a key feature of the peak oil debate is that those warning of a peak are always too pessimistic [
79], but an argument can be made that there is a significant record of intelligent observers being overly optimistic as well. In spite of the production record of coal in England, it was not until the 1960s, a half-century after the peak, that official surveys of estimated ultimate coal production were decreased from 200 Gt to the more realistic 30 Gt range [
78].
It may be pointed out that the actual coal resource in the ground in the UK, fields that extend under the English Channel to continental Europe, may still be very large. However, this is precisely the point about oil resources and part of the often heated discussion between those who accept a near-term (decade or less) peak in oil production and those who see no danger in the near future [
75]. Resources in the ground may be very large, but extractability at acceptable costs may limit what is eventually recovered, as will a turn to alternatives.
