1. Introduction
Project based learning (PjBL) is an educational approach well placed to develop engineering graduate attributes [
1]. This was the driving force behind the renewal of the four year bachelor Chemical Engineering degree at RMIT University in 2003, introduced in 2005, based on other successful engineering programs running at that time in universities such as Aalborg University, Denmark [
2], and University of Queensland, Australia [
3]. A stream of PjBL subjects runs from first to final year, one per semester, instead of the more traditional approach to have a single capstone design project in the final year.
Each project is more complex than the last, broader in scope, more detailed in context, with a focus that reflects the concurrently taught traditional technical subjects. Just in time lectures and workshops are run on relevant technical topics and generic skills respectively, to develop technical and generic graduate attributes.
A study of learning outcomes of a small sample of the first graduates from the renewed program found that the program developed some attributes very well. By self-report, graduates recognised the benefits of undertaking PjBL subjects as well as vacation work, to develop project, time management and communication skills, as well as confidence and systems thinking. Their skills in these areas were confirmed by their managers. However, other skills were not so well developed. A few of the graduates—and their managers—reported a skills gap in terms of problem solving and report writing. The major short-coming in about half the graduates was a lack of understanding of ethics [
4].
A variable outcome from a PjBL program has also been reported elsewhere. A pan-European study compared sustainability subjects in technology universities and found that outcomes were variable even for problem based learning (PBL) subjects. It concluded the most effective pedagogy for students to learn about sustainable development was a community-based project with collaboration of multiple learners as well as use of a constructive-learning pedagogy. PBL was the second most effective, although PBL was not explicitly defined. The outcomes for subjects using a PBL approach were variable, although the authors did not comment on the possible causes [
5]. A recent meta-study of PBL sheds more light on the variability. It sought to identify if the variability derived from “the PBL method employed, the discipline of the intervention, the problem types used, or the assessment level of the outcome”. It classified PBL methods in terms of “(1) the complexity of the problems, (2) the focus on teacher or student centered learning and (3) the order of problem and case and information presentation”. The study found that the effectiveness of PBL programs depended on the discipline, assessment type and the problem type. More favourable outcomes were achieved with closed-loop PBL, assessment based on principle combined with application, and a problem type that was a design problem. Available data were not sufficient to check for interactions between variables. Differences on these points accounted for “a large amount of variance among the findings”, which correlated with variance in the way PBL was implemented [
6]. Hence, although PBL is a pedagogy favoured to develop graduate competencies, much depends on the way it is implemented, and more work is needed to ensure learning outcomes across the full range of competencies.
In addition to the uncertainty about the most effective PBL approaches, there are particular difficulties with teaching sustainability. There are few professional development opportunities for staff, relatively few teaching resources, few reports in the literature on how sustainability is taught in engineering programs, and even fewer evaluations of the effectiveness of those programs. The traditional approach to chemical engineering design is to balance capital and operating costs against safety and damage to the environment: better safety and lower impact on the environment are achieved by higher investment in plant design and more expense during operation. In the RMIT PjBL subjects, a sustainability approach to design means broadening consideration, beyond the immediate location and staff and customers, to include consideration of the impact of the chemical plant across its whole life cycle, from design to decommissioning on the local and global community, in terms of economic, environmental and social issues. A broad range of environmental issues are considered, from global warming to land degradation, as well as a broad range of social issues, from education to health care, from impact on indigenous culture to future generations.
This paper reports on an innovative approach to teaching sustainability to chemical engineers implemented in 2011 (using the GEMI approach), and use of an innovative tool to evaluate of the learning outcomes for students (ConceptMaps). The following research questions were addressed: How does undertaking multiple projects using sophisticated analysis tools enhance students’ understanding of sustainability? What can analysis of student concept maps tell us about student learning?
2. Curriculum Design
The RMIT Chemical Engineering undergraduate program contains a stream of PjBL subjects from first to final year, based on successful programs running elsewhere [
2,
3]. In each project, students must select the best chemical process to meet a particular client’s brief.
Each project has a focus that integrates the year level’s concurrent traditional technical subjects with development of generic skills. The coordinator provides students with a project briefing, two or three pages in length, to set the project scope and define the deliverables Picking a good topic is critical to achieving the right level of complexity. The subject coordinator chooses a new project topic each year, after discussion with the other discipline staff, so that over the course of the many projects, the students will investigate a broad range of process technologies and industries, ranging from oil to food, water and polymer production. This enhances the employability of our graduates. For each project there must be a choice of different process routes described in the literature, so students can make an informed decision.
In the early year levels the teaching schedule includes more structure, with formal lectures and tutorials. In later year levels, teaching is replaced more and more by supervision, simulating a work environment. In first year students might attend a one hour lecture per week and one hour tutorial, covering report writing, project planning, referencing, and an introduction to sustainability. In the final project there are no lectures or tutorials; groups attend only a 30 minute meeting per week with their supervisor, where they discuss their progress and any issues.
The students learn about applying sustainability principals to engineering design through choice of the “best process”. The students must develop criteria for choosing the best process that is not just based on the best economic rate of return on investment. In addition to costs, they must select criteria that reflect sustainability principles. Literature relevant to the project is reviewed to identify potential environmental, social and economic issues, and these are compared with stakeholder viewpoints to select the most critical and important ones. Potential issues might include global warming, water pollution, job creation, education of workers, effect of company culture on local culture, cost of building the plant and decommissioning it. Each group selects an issue, researches it and presents it to the class. Tutorials are used to guide groups on techniques to rank the issues and choose the most important. Each group must select their own set of key issues, limited to four to six for simplicity, and develop these into criteria to choose the best process. Each group must then compare the alternative processes in terms of their selected sustainability issues and justify choice.
Students work in groups of four to six students. Groups generally work on the same project, although they might have different plant capacities or raw materials. Key tasks include an analysis of the literature on the alternative processes, identification of relevant sustainability concepts and issues, justification of criteria for decision-making, assessment of process risks, and selection of the best process based on calculations that are very simple in early years and more in depth in later years. Each group submits a draft and final report, as well as giving a presentation.
Students learn about how to use various decision making techniques and tools, including brain-storming, pair-wise comparison, concept-mapping, process risk analysis, and standard spreadsheets and worksheets. In the first year projects, only simple tools are used, such as brain-storming and pair-wise comparison. In the later years, groups use sophisticated industry-developed spreadsheets and worksheets that lead to a more systematic approach to identifying relevant issues and their relative importance to different stakeholders.
When the renewed program was first implemented, the lecturers provided students with simple sustainability guidelines based on those published by the Institution of Chemical Engineers, UK. Limitations of these guidelines include being UK centric, production rather than design focussed, and lacking social consideration [
7]. This approach was found to yield the poor outcomes in terms of ethics reported in our first evaluation of the new program [
4].
Recently, a more sophisticated management tool has been used in some of the PjBL subjects, with curriculum developed and initially taught by an industry consultant. The Metrics Navigator
TM was developed by the Global Environmental Management Initiative (GEMI). It helps organizations develop and implement metrics that capture complex issues, support business strategy and contribute to business success. It is a worksheet based approach that documents stakeholder views on business success factors and the organization’s perceived degree of control of each issue. The worksheets help students to explore different aspects of the project, such as goals and objectives of the company who want to build the new plant, the plant life cycle and different costs/environmental and social impacts at different life stages, the range of issues that might affect different life stages, and finally, a short list of the key issues that will be used to develop criteria to choose the best design. Alternative designs are compared on the key criteria, and the best design is selected. This has been described in detail in our previous publications [
7,
8].
The subjects range from 2nd to final year. Students choose their group members in 2nd year and are allocated to groups in the final (4th or 5th) year subject. The subject coordinator provides a project brief, with product specifications, and in early year projects, production volume and plant location. The whole class works together to draw up a list of issues that may be relevant to the design problem from the United Nation Commission for Sustainable Development’s Agenda 21 checklist [
9]. A shortlist of most important issues is drawn up after some class discussion. Each issue is assigned to one or two groups. Each group undertakes research on their issue. In 2nd year, a spokesperson presents the group’s research the following week to the rest of the class. The presentations are recorded and made available on the distributed learning system. In final year each group must develop questions on their issue. A community forum is then held with (role-playing) representatives from the company and community. Each group must ask questions on their issue on behalf of the whole group; all questions and answers become a class resource. Each group must assess the forum feedback and use it to justify their decision-making in terms of the best process design. This community forum is a key innovation in the teaching approach developed at RMIT.
3. Methods
Learning outcomes of students were evaluated using a graphical tool (ConceptMaps) as well as through a focus group. Concept mapping is a graphical tool that is a quick and easy way for a group to capture its knowledge during a brain-storming [
10]. A good ConceptMap (Cmap) has a high number of relevant concepts, a complex set of interlinks between the concepts, and an even distribution of concepts among categories. A suitable taxonomy of categories is: environment, resource depletion, social, cultural, future generations, equity, technology, economic, education and stakeholders. These allow for accurate analysis of Cmaps. These may be re-grouped into four clusters, environment (environment & resource), social (social, cultural, future generations, equity), economic (technology, economic) and Institutional (education and stakeholders), to gain a better overview, particularly for category relevance [
11,
12].
The Cmaps are analyzed for complexity indicator (CO) and category relevance (CR). Calculations for CO are per group member, as follows:
NC is the number of concepts per student. LCa is the number of connections between concepts per student per category. NLInt-Ca is the total number of links between concepts in each Cmap.
A benchmark of CO = 25 and CR cluster (environmental, social, economic, institutional) = (16, 30, 21, 32) was set by a group of sustainability experts, described in detail elsewhere [
11,
12]. If all categories are used equally frequently, then CR = 10, and the CR clusters (environmental, social, economic, institutional) = (20, 40, 20, 20).
The GEMI approach is introduced in a 2nd year PjBL subject. In that subject each group submits an initial Cmap drawn during the 1st week of the semester, as well as a final Cmap, submitted with the mid-semester progress report (the semester is 12 weeks). The study used a quasi-experimental pre-test post-test design by comparing the initial with the final Cmap. In later years only a final Cmap is submitted with the mid-semester progress report. Around 350 2nd and 4th year students were involved in producing the approximately 60 Cmaps that were analyzed.
A focus group was held as part of an on-going longitudinal study. Participants were recruited from a 3rd year PjBL class. The desired sample size was 10 students per focus group. The actual sample size was 11 students, nine male (M1 to M9) and two female (F1 and F2). The focus group had a duration of 60 minutes. It was scheduled after a class when the students had a free period. The focus group adopted a semi-structured approach using a framework developed in a previous study [
4]. The questions were framed around two themes: how the work is conducted in the current PjBL subject, and where the attribute of sustainability is being developed. The focus group was recorded and then transcribed verbatim. The transcripts were analyzed thematically using nVivo. A clarificative approach was adopted in the analysis of data, in which outcomes (intentional and incidental) are related to the objectives [
13].
4. Results and Discussion
Two types of data were collected: quantitative (from the Cmaps of a 2nd and final PjBL course), and qualitative (from a focus group of students in a 3rd year PjBL course). The results are compared with a study of European students’ learning outcomes from similar subjects using CMaps. An analysis of the data was carried out to elucidate the following research questions:
- (1)
How does undertaking multiple projects using sophisticated analysis tools enhance students’ understanding of sustainability?
- (2)
What can analysis of student concept maps tell us about student learning?
4.1. Results—ConceptMaps
A comparison of 2nd and final year students Cmaps was undertaken to assess how the students’ understanding of sustainability developed over the course of multiple complex projects. The Cmap documents the students’ understanding of what concepts are relevant to sustainability, and the interactions between the concepts. The results are compared with a reference group of sustainability experts [
11,
12]. In 2nd year each group submits two Cmaps: one in Week 1 of the semester as well as one with their mid-semester progress report. In final year each group submits one Cmap with their mid-semester progress report.
4.1.1. Complexity Indicator (CO) results
The results for the 2nd year subject are shown in
Table 1. NC is the number of concepts per student. L
Ca is the number of connections between concepts per student per category. CO is the complexity indicator, reflecting both the breadth of ideas and their connectivity.
Table 1.
Average complexity indicator (CO) for 2nd year groups, 2011–2013.
Table 1.
Average complexity indicator (CO) for 2nd year groups, 2011–2013.
| Test | Year | Class size | NC | LCa | CO | CO (SD) (%) |
|---|
| Pre-test | 2011 | 85 | 1.6 | 0.1 | 0.1 | 82 |
| 2012 | 50 | 3.3 | 0.3 | 1.3 | 83 |
| 2013 | 84 | 2.6 | 0.3 | 1.0 | 60 |
| Average | 2.5 | 0.2 | 0.8 | 75 |
| Post-test | 2011 | 85 | 3.8 | 0.2 | 1.0 | 121 |
| 2012 | 50 | 8.4 | 1.0 | 9.9 | 77 |
| 2013 | 84 | 5.2 | 0.7 | 5.0 | 82 |
| Average | 5.8 | 0.6 | 5.3 | 93 |
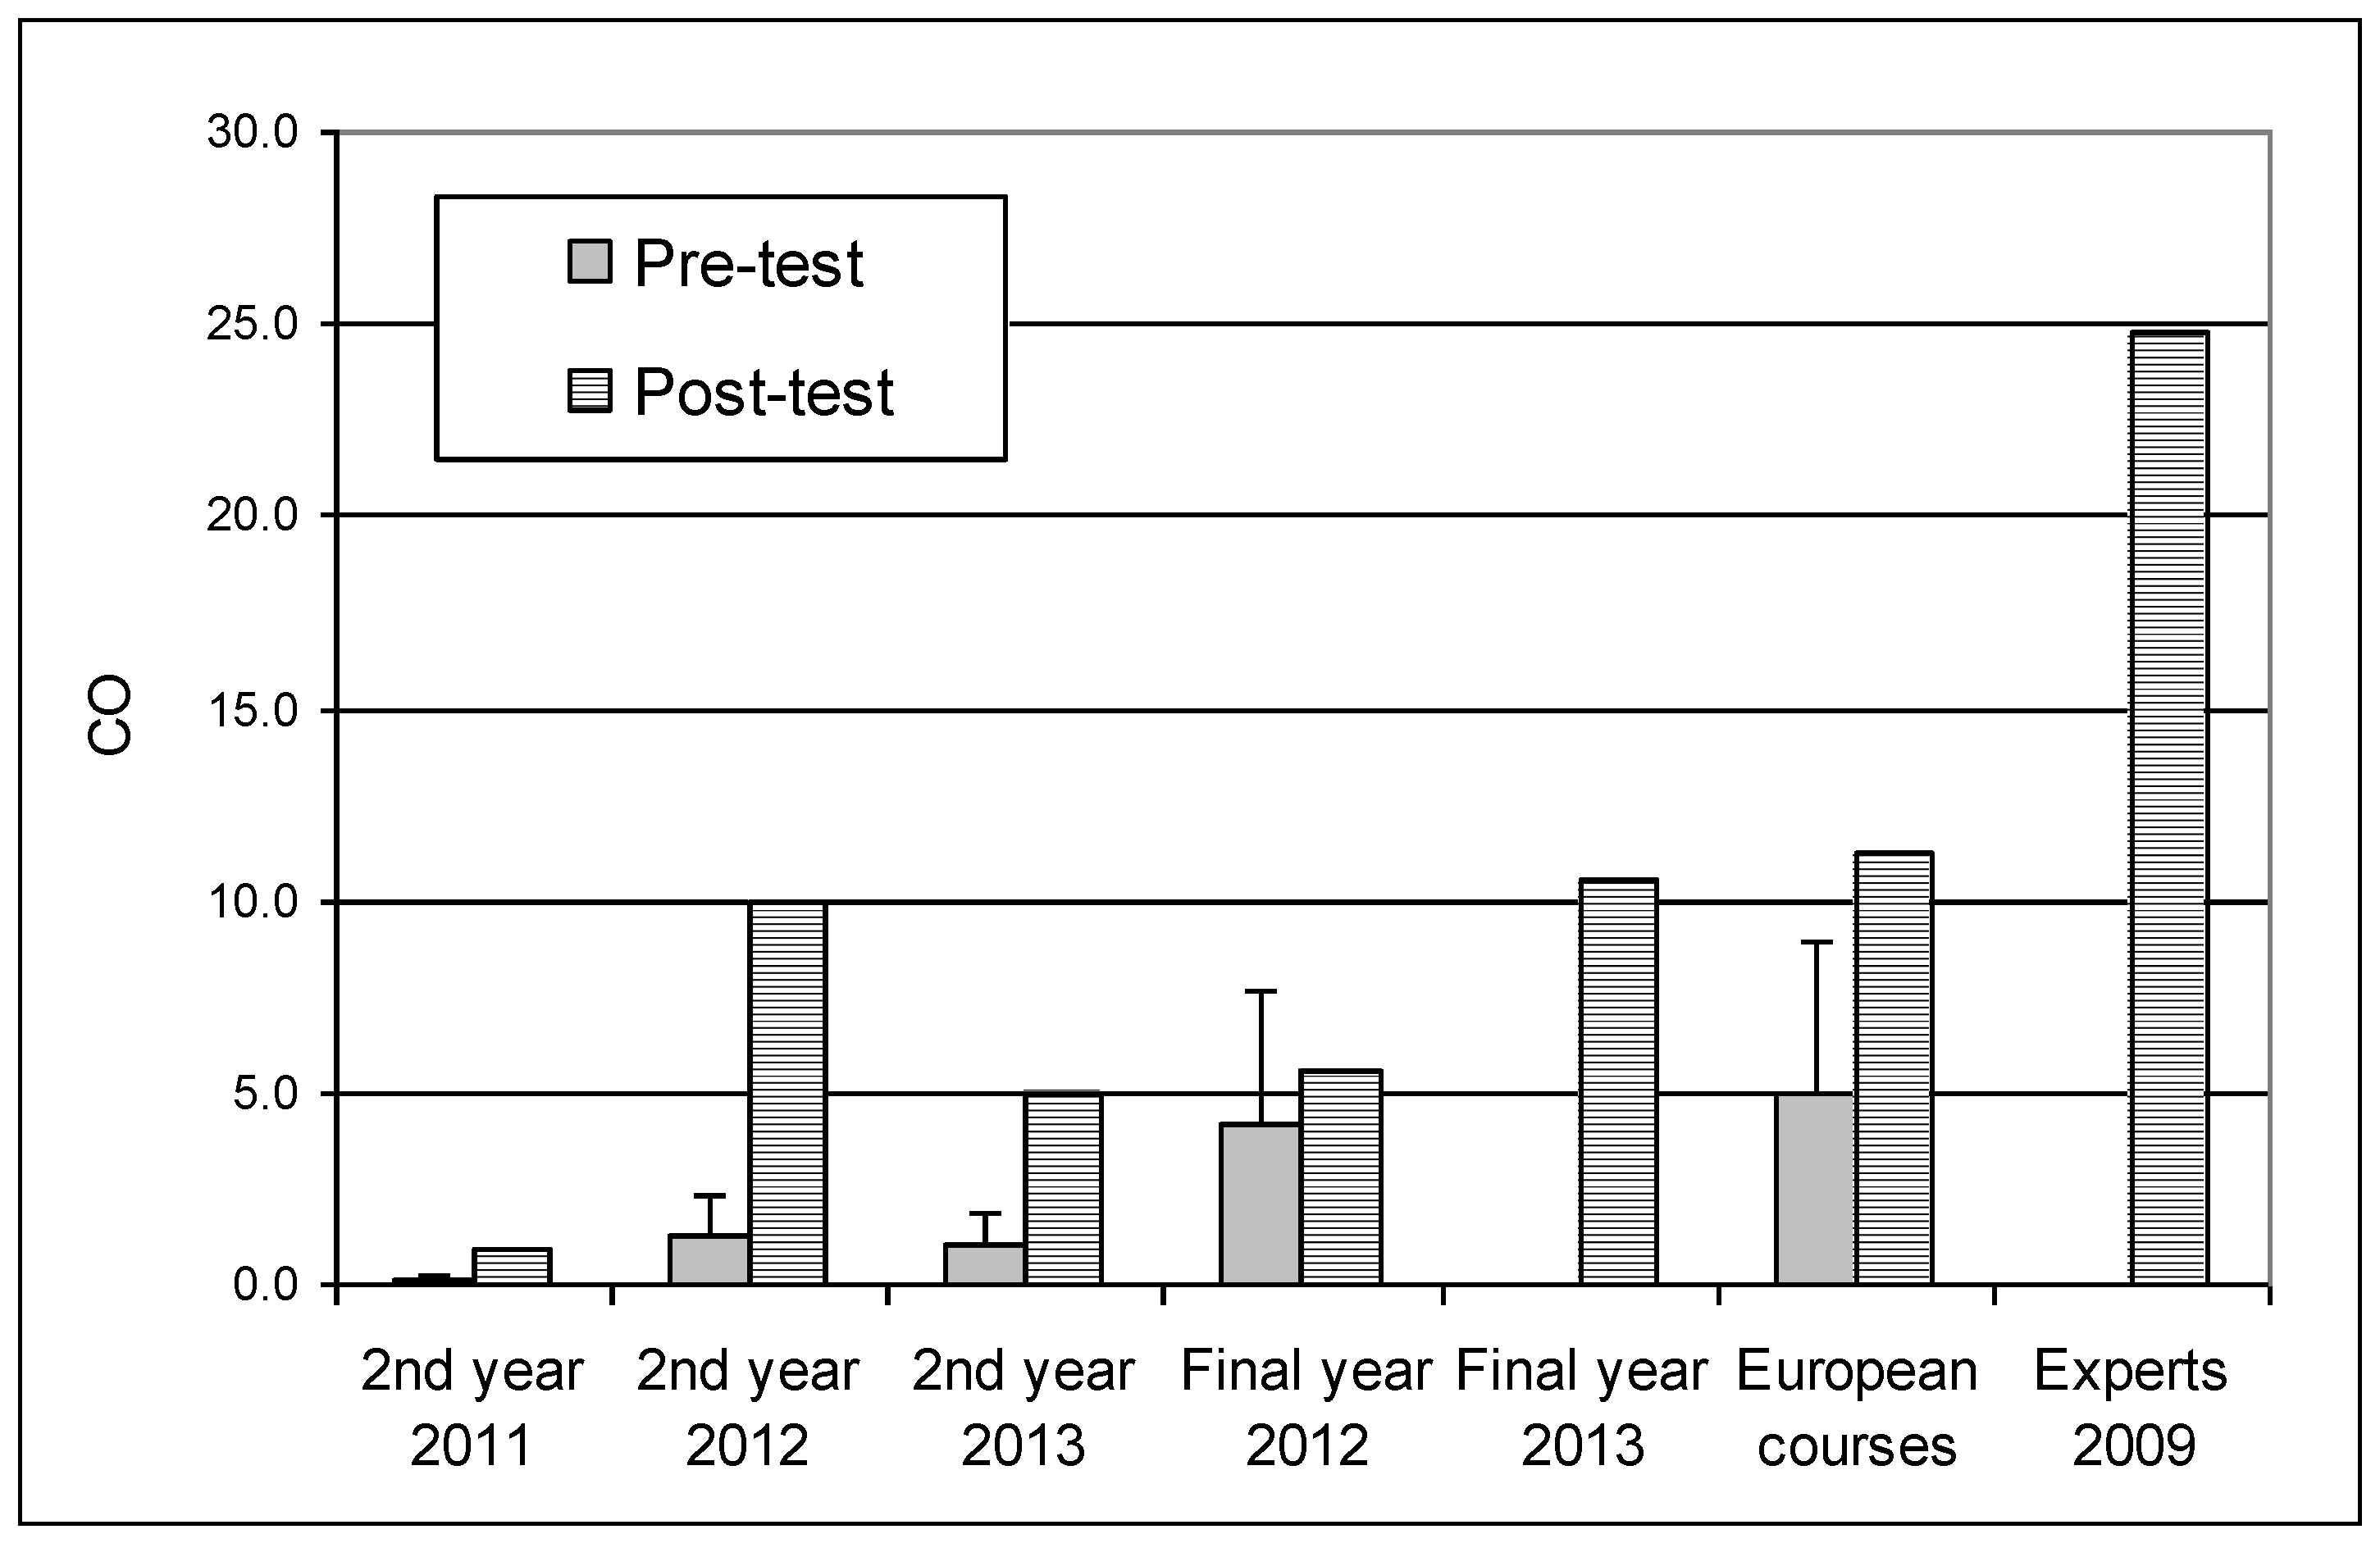
A comparison of the “pre-test” and “post-test” results shows that there were very substantial increases in NC, LCa and CO. The average post-test score is around two, three and five times the average pre-test score, for NC, LCa and CO respectively. The students identified many more concepts and many more complex links between concepts at mid-semester compared to the first week.
The standard deviation of CO was quite high, ranging from 60 to 121%. The high standard deviation may reflect different levels of ability and motivation of the students in the different groups, as well as starting knowledge level and variable class attendance. (It is optional to attend classes at RMIT). Students select their own groups, generally on the basis of friendship groups, which may also enhance the heterogeneity of groups in terms of ability and motivation—the most able students usually like to work together. The standard deviation of CO among groups has not been published for other studies, so cannot be compared.
A comparison of 2011 post-test with 2012 and 2013 results also shows a substantial increase. This may be attributed to variability of the student cohort from one year to the next, as well as the growing experience of the lecturers in delivering the subject.
The results for the final year subject are shown in
Table 2. No data are available for 2011, as Cmaps were not included in the curriculum of the final year subject until 2012. The post-test NC was 25% higher for final year (average 7.2) than 2nd year (average 5.9). The post-test L
CA was 50% higher for final year (average 0.9) than 2nd year (average 0.6). Similarly the post-test CO was 66% higher for final year (average 8.0) than 2nd year (average 4.8). Although the increase from 2nd to final year is less than one standard deviation, it suggests that the learning outcomes in sustainability are higher after undertaking multiple complex projects. A longitudinal study is in progress to collect data to evaluate this over a longer timeframe.
Table 2.
Average CO from final year, 2012–2013.
Table 2.
Average CO from final year, 2012–2013.
| Test | Year | Class size | NC | LCa | CO | CO (SD) (%) |
|---|
| Post-test | 2012 | 50 | 5.9 | 0.7 | 5.6 | 115 |
| 2013 | 84 | 8.4 | 1.1 | 10.4 | 80 |
| Average | 7.2 | 0.9 | 8.0 | 98 |
The variability of CO from group to group was quite high, as in 2nd year. The standard deviation for CO varied from 80 to 115%, a similar range to 2nd year. The first time the subject was taught with GEMI (2012) the average CO value (5.6) was inferior to the following year (10.4), similar to 2nd year. Again this may be attributed to year to year variation in student cohort, as well as increasing skill and experience of the teaching staff leading to better learning outcomes for students.
The results for these classes are within the range reported in other studies that have used Cmaps in this way [
11,
12]. In the study by Segalas and co-workers, 10 European subjects from five institutions were evaluated by analysis of pre- and post-test Cmaps. The pre- results for CO ranged from 0.3 to 20.4, while the post-results ranged from 1.7 to 26.8. The students’ understanding of sustainability was generally observed to improve, although in two subjects it was measured as decreasing. The changes from pre- to post-test ranged from a factor of 0.75 to 11 times. The average improvement was 2.3 times [
12]. The average CO for RMIT 2nd year students Cmaps improved 6.5 times, which is significantly better than the European average. This suggests that the RMIT approach is quite effective, although some European classes have a more effective approach. It would be interesting to learn more about the European subjects that were the most effective, but unfortunately few details are available. It is also noteworthy that the RMIT sustainability module covered only a fraction of the semester—four weeks—while the European sustainability modules were undertaken by students for the whole term/semester. So the increase in CO values pre- and post-test for RMIT students is even more impressive.
As a benchmark, a group of experts were also asked to prepare a Cmap, for which the CO value was 24.8 [
5]. So while there is evidence that RMIT students are developing their understanding of sustainability, with substantial improvements in the CO values pre- and post-test that compare favourably with European students, a comparison with the benchmark of experts indicates there is still potential to achieve better learning outcomes.
The trends for CO are shown graphically in
Figure 1.
Figure 1.
Complexity indicator (CO) by year level, pre- and post-test.
Figure 1.
Complexity indicator (CO) by year level, pre- and post-test.
4.1.2. Category Relevance (CR) Results
The results for category relevance clusters are summarized in
Table 3 and shown graphically in
Figure 2, for both 2nd and final year, both pre- and post-test for 2nd year, as well as the benchmark results for sustainability experts. The results for the category clusters give a better overview of the focus of the students, rather than individual categories.
Table 3 shows that 2nd year students have a strong focus on environmental and economic categories, in both pre- and post-test results, rather than social and institutional. This reflects the strong focus in the general engineering curriculum and the engineering literature on technical, economic and environmental impacts of engineering design. The main difference between pre- and post-test results is a stronger focus on social and institutional categories, that is, the students are starting to have a broader view of sustainability issues after taking the sustainability module.
Table 3 shows that final year students still have a strong focus on the economic categories, but their view of sustainability has continued to broaden, with less focus on environmental and more focus on institutional categories.
Table 3.
Category Relevance Clusters, pre- and post- test, RMIT and other studies [
11,
12].
Table 3.
Category Relevance Clusters, pre- and post- test, RMIT and other studies [11,12].
| RMIT 2nd year Pre- | RMIT 2nd Year Post- | RMIT Final year Post | Ex-perts | Theor-etical | European students |
|---|
| 2011 | 2012 | 2013 | 2011 | 2012 | 2013 | 2012 | 2013 | Pre | Post |
|---|
| Environmental | 50 | 47 | 29 | 43 | 25 | 22 | 19 | 28 | 16 | 20 | 46 | 40 |
| Social | 15 | 12 | 18 | 25 | 27 | 16 | 27 | 23 | 30 | 40 | 8 | 11 |
| Economic | 35 | 36 | 50 | 27 | 40 | 56 | 44 | 39 | 21 | 20 | 34 | 31 |
| Institutional | 0 | 5 | 3 | 6 | 8 | 6 | 11 | 9 | 32 | 20 | 9 | 16 |
Table 3 and
Figure 2 also show that the experts have a stronger focus on social and institutional categories than the students. Note the experts have a greater focus on institutional categories (32%) than might be expected from a theoretical even distribution of concepts for each category (20%).
The RMIT student results for category relevance are similar to those seen in the study of European University subjects, especially the RMIT 2nd years. Students in both RMIT 2nd year and European subjects had a dominant focus on environment and economics, before and after their sustainability subjects, and much less focus on social and institutional. As for the RMIT 2nd years the European students focus before taking a sustainability subject, compared to after, shows the “misunderstanding” was only partly redressed by their sustainability subject [
12]. One major difference to note between the RMIT and European subjects, is that the RMIT sustainability module covered only a fraction of the semester—four weeks—while the European sustainability modules were undertaken by students for the whole term/semester.
Figure 2.
Category Relevance (CR) cluster, by year level, pre- and post-test.
Figure 2.
Category Relevance (CR) cluster, by year level, pre- and post-test.
Table 3 and
Figure 2 show the wide variation from calendar year to year. The second year students both pre- and post-test show a much lower focus on environment and a much stronger focus on economics in 2013 than in 2012. Some variation will occur between student cohorts, the teacher’s approach, and the Cmap analysis. The extent of variation from year to year has not been reported previously, so it is unclear if this variation is as expected.
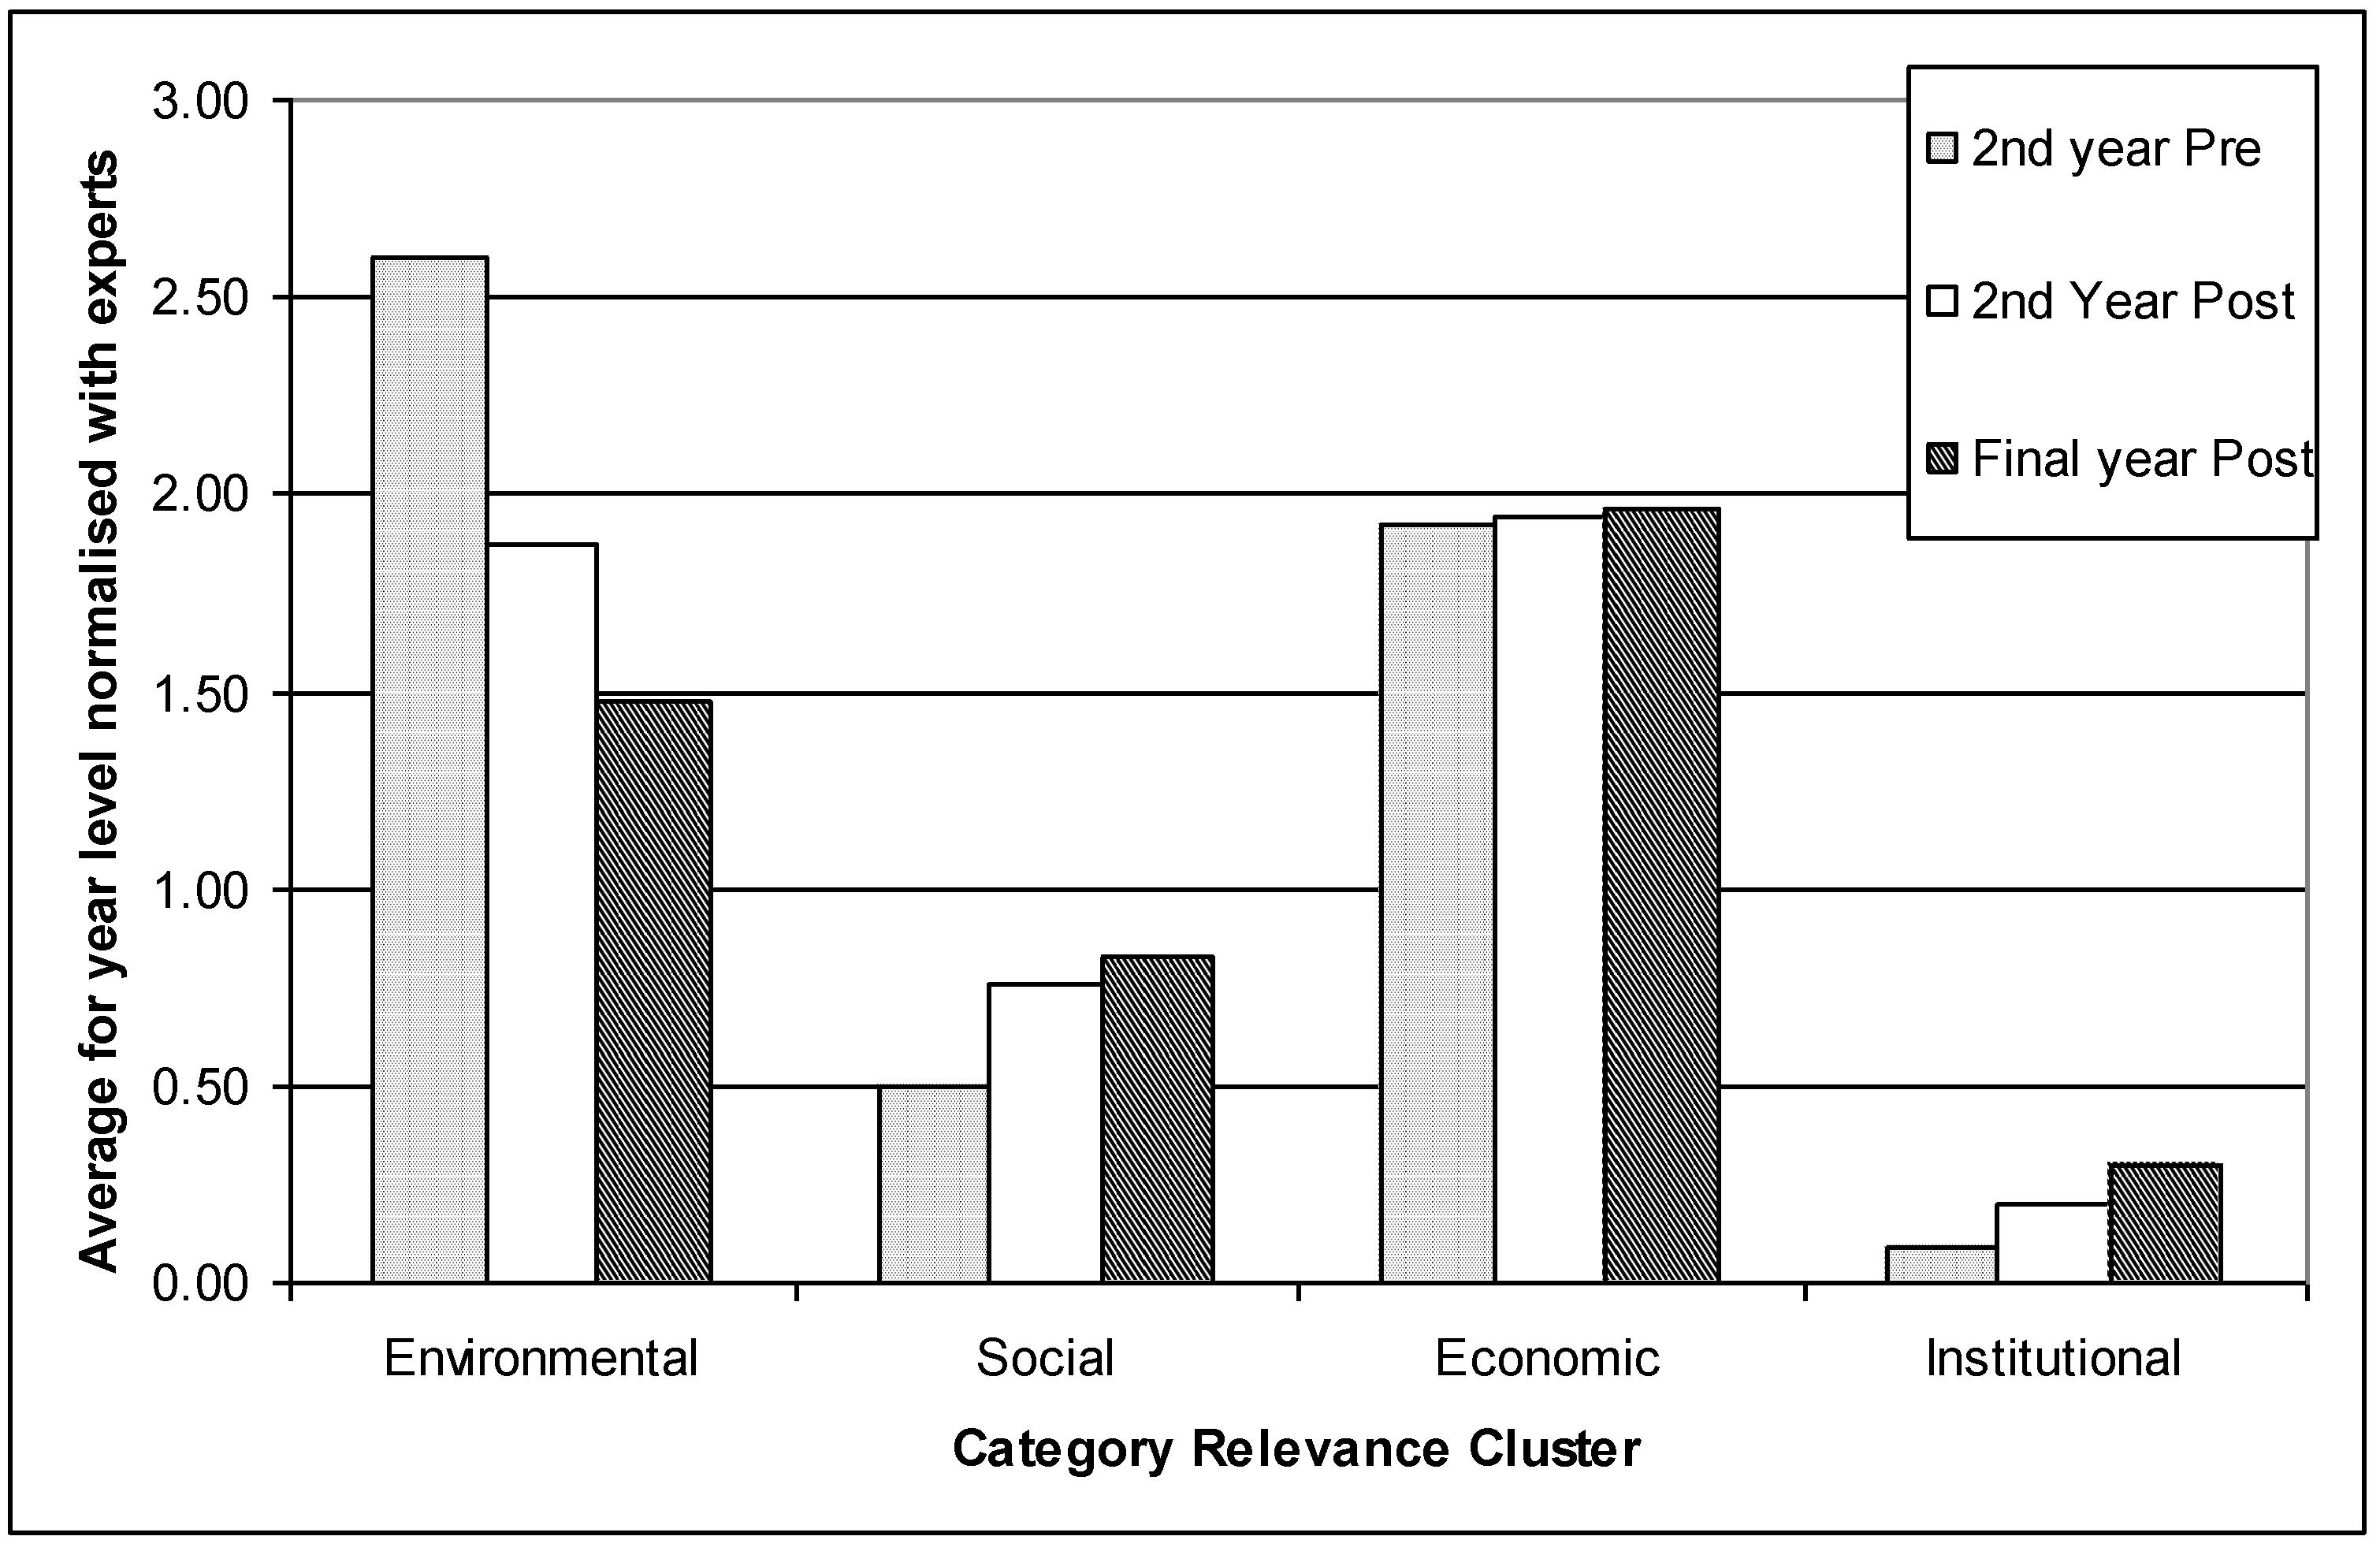
The changes in the students’ results normalized by the expert results are shown in
Figure 3.
Figure 3 shows that in general, the more sustainability modules taken, the closer the students results are to the experts (that is, the normalized value is trending towards 1.00). This shows that the students’ understanding of sustainability is broadening, although there is still a gap for students to reach a mastery of the material, especially in the institutional category cluster. In addition, the predominant focus on “economics” (technology and economics categories) was not modified, even after students have undertaken several projects. The focus on “economics” may be harder to modify that the other clusters, for two reasons. The first is that traditional subjects have a focus predominantly on technology and economics, and each semester the students undertake mostly traditional technical engineering subjects (three) and just one PjBL subject. The second is that not all staff members have a strong interest in sustainability, and in the PBL subjects the students work with an assigned group supervisor other than the sustainability lecturer.
Figure 3.
Category Relevance (CR) cluster, averages, normalised to experts.
Figure 3.
Category Relevance (CR) cluster, averages, normalised to experts.
4.1.3. Implications
The results from analysis of the Cmaps suggest that the RMIT approach taken has been successful in increasing the understanding of the students about sustainability. The concepts identified by 2nd and final years were increasingly numerous, interrelated and covered a broader range of topics after they completed the sustainability module, consistent with a European study of sustainable engineering subjects. Big increases were seen when pre- and post-test averages are compared, bigger than for many similar European subjects, although not as high as some.
The pre-test results were higher for final year students than for 2nd year, showing retention of knowledge from their previous projects. On average, the Cmaps of final years were more complex, interrelated and broad than the 2nd years, trending towards those of sustainability experts. Doing multiple complex projects enhanced their understanding, which supports our view that multiple projects are needed to develop student understanding of sustainability. Learning outcomes after multiple projects have not been reported previously.
The standard deviation for CO values was high. Many trends were not statistically significant because the standard deviation was higher than changes in mean values. Achievement of individual groups of students varied markedly, as well as the averages for different student cohorts. Standard deviation for groups has not been previously reported, only averages.
The Cmap analysis shows that undertaking the sustainability modules increased the student learning in social and institutional categories. This continued to grow over multiple projects, which also supports our view that multiple projects are needed to develop student understanding of sustainability. The dominant focus on economics was not modified by the sustainability modules, and too little focus was given to institutional concepts. The Cmap analysis has identified these as areas for improvement.
Hence, analysis of student Cmaps is a useful way to identify trends in student understanding of sustainability, areas for improvement, and gap between student learning and sustainability experts. The RMIT subject is more effective than the average European subject, but could improve in several areas, including achieving more consistent results between different student groups, more consistent results between student cohorts, and a greater focus on institutional categories and less on economic/technology. Analysis of Cmaps is shown to be a useful way to measure impact of any teaching innovations that might be undertaken to improve student learning in this area.
4.2. Results—Focus Group
A focus group discussion was held with students in an intermediate PjBL subject. A semi-structured approach was used with questions framed around the students’ views on where the graduate attribute of sustainability is being developed. The aim of the focus group was to identify whether use of increasingly complex projects using sophisticated analysis tools enhances students’ understanding of sustainability.
Engineers Australia (EA) identify a range of professional attributes required by the engineer in addition to technical knowledge: a systematic approach to management of projects, effective communication skills, use of information, effective team management and leadership, as well as ethical and professional conduct [
14]. The projects undertaken by the students from 2nd to final year are designed so that students must use all these skills to produce the project deliverables. The problems become more complex with each successive project so that the students continue to be challenged. However, the same skills must be used for each project (project management, communication and so on), so that the students can progress towards mastery of each skill [
4].
About sustainability, EA elaborate that the professional engineer should appreciated “the social, environmental and economic principles of sustainable engineering practice” [
14]. The focus group attempted to explore with the students whether this developed over time across the multiple projects that they undertake, as well as whether the use of sophisticated tools such as GEMI contributed to the development.
4.2.1. Focus Group Data
How does student understanding of sustainability develop over time across multiple projects?
The focus group students all indicated that their understanding of sustainability has changed, in response to new ideas learnt in this project compared to the previous projects. For example, at the beginning of each PjBL subject the lecturer uses a case study to show how to analyze technical literature for sustainability concepts. M2 missed this in the previous project but has a good idea about what he needs to do now: “The thing that I’ve got from this semester’s class was that they actually kind of told us what kind of stuff that we need to look into”. M2 added “In first year, when they told us about sustainability, I thought it was just something that they taught to make the government shut up, but as we went further on with the hazard course and now this sustainability course, you kind of realize that it’s actually a very practical way of doing business. It keeps your business going. It’s not just about letting government do your job. It makes you work better.” M1 elaborated, “What’s good, that I’ve found, about doing these group projects is coming in, in first year, I didn’t really have a concept of it, but now we’re in [penultimate] year and coming out the end of it our way of thinking about a problem or a process will be dictated by our knowledge of sustainability because you always put that first. I didn't really have that thinking before we did our group project.” M6 agreed “the first thing you think of, with the idea of the project is that you make heaps of money…. But the fact of the matter is that you have to consider sustainability, and obviously companies do think about it.”
Hence the students’ understanding of sustainability has developed through undertaking multiple projects.
How does use of sophisticated tools such as GEMI contributed to the development of students’ understanding of sustainability?
In the focus group the students readily identified use of the GEMI management tool as helping to develop their ideas about sustainability. M3 commented “these different worksheets…help you work out what your factors are and how to rate them”. F2 agreed: “it was kind of breaking up the word sustainability …so you can see all the factors and consequences more clearly”. M6 added “the GEMI matrix….it can be really useful, in making sure that you do actually look after your people”.
Other tools are also useful to enhance understanding of breadth of sustainability issues. M3 commented about CMaps: “you just kind of use those things to get your head around what the issues are”.
What are the range of learning outcomes for students?
The focus group showed a snapshot of where the students are along the continuum of developing their understanding of sustainability. There is wide variation in the sophistication of their views. When asked about other subjects where they learnt about sustainability, the following disagreement ensued:
M5: “We did Hazard management last year as well” M2: “Oh yeah… there wasn’t much about sustainability, it was more about safety”; M3: “There’s a lot about sustainability. We were looking at life-cycle analysis and things like that. …and designing processes so that they were inherently environmentally friendly, trying to find ways to clean them up”.
M2 was eventually persuaded that the hazards course did indeed have sustainability in it. He even commented one of the rarer instances of relevant institutional concepts: “We looked at the acts, like the environmental acts and how we were supposed to design our plans based on that sort of stuff”.
4.2.2. Focus Group Implications
The students’ comments show that undertaking multiple projects and use of sophisticated tools help them develop their understanding of sustainability. Students readily identified that undertaking multiple projects enhanced their understanding of sustainability. They recognized that before the sustainability modules their ideas about sustainability were very simplistic, similar to the findings of the analysis of Cmaps “pre-test”. After several projects they had a broader idea of sustainability, as seen in analysis of the Cmaps “post-test”. Students readily identified GEMI as a useful tool to capture and clarify the complexity and breadth of sustainability issues that apply to process design decisions.
The focus group findings support the findings from Cmap analysis, confirming that Cmap analsyis is a useful tool to assess student outcomes from sustainability courses.
The focus group also showed wide variation in depth of learning outcomes after students have undertaken the same subjects. This was also seen in the Cmap analysis, in the high standard deviation of variables.
4. Conclusions
PjBL is an effective approach to developing graduate attributes, especially sustainable engineering practice. RMIT Chemical Engineering has a stream of PjBL subjects from first to final year that are incrementally more complex and cover different industries. A new approach to teaching sustainability was introduced in 2011, and has since been evaluated using quantitative and qualitative measures. Students work in groups to choose a best process design from several alternatives, considering a broad range of economic, environmental and social issues, selecting key issues as criteria for decision making. The students learn to use a variety of management decision making tools to justify their choices. The tools include ConceptMaps (Cmaps) and worksheets based on GEMI The Metrics NavigatorTM. This study evaluated whether students understanding of sustainability is enhanced by undertaking multiple projects, as well as use of sophisticated analysis tools.
Student learning outcomes from several subjects were compared across several student cohorts using Cmaps and a focus group. The analysis of Cmaps showed that the breadth and complexity of students’ understanding of sustainability increased substantially in the 2nd year after taking the sustainability module. It increased again by the final year, similar to results reported in European studies. Students’ initial focus was on environment and economics, but this broadened to include more social and institutional concepts after each project, as reported in European studies. A gap between students and a benchmark set by sustainability experts remained, suggesting there is room for further improvement in the RMIT curriculum and teaching approach. In particular, more focus on institutional categories and less focus on economics would narrow the gap.
The level of conceptual understanding and complexity of ideas apparent in the Cmaps varied markedly from group to group within one cohort, and between cohorts from one calendar year to the next. This was attributed to varying ability and motivation of the students, differences between student cohorts as well as growing experience of the lecturers. A longitudinal study is continuing to evaluate the variability over a longer period.
Development of understanding of sustainability was attributed to undertaking multiple design projects, as well as through other subjects. Use of the GEMI tool was readily identified as facilitating application of sustainability principles to process design decisions. Analysis of Cmaps was found to be an effective way to evaluate an innovation in teaching approach to sustainability.

