Environmental and Financial Evaluation of Passenger Vehicle Technologies in Belgium


Abstract
:1. Introduction

| Segment | Brand | Consumption (L/100km, kWh/100km) | CO2 g/km | Segment | Brand | Consumption (L /100km, kWh/100km) | CO2 g/km |
|---|---|---|---|---|---|---|---|
| City | Citroën C1, P | 4.3 | 99 | Medium | Honda Jazz, HEV | 4.5 | 104 |
| City | Peugeot 107, P | 4.3 | 99 | Medium | Honda Insight, HEV | 4.4 | 101 |
| City | Toyota Aygo, P | 4.3 | 99 | Medium | Toyota Auris, HEV | 3.8 | 89 |
| City | Suzuki Alto, P | 4.4 | 103 | Medium | Lexus CT200h, HEV | 3.8 | 87 |
| City | Smart Fortwo, P | 4.9 | 115 | Medium | Toyota Prius, HEV | 3.9 | 89 |
| City | Smart Fortwo, D | 3.3 | 86 | Medium | Nissan Leaf, BEV | 17.3 | 0 |
| City | Renault Twingo, P | 4.5 | 105 | Medium | Renault Fluence, BEV | 12 | 0 |
| City | Renault Twingo, D | 3.4 | 90 | Medium | Chevrolet Volt, PHEV | 1.2 L and 13kWh | 27 |
| City | Mitsubishi iMiev, BEV | 13.5 | 0 | Medium | Opel Ampera, PHEV | 1.2 L and 13kWh | 27 |
| City | Peugeot iOn, BEV | 13.5 | 0 | Premium | Audi A6, P | 7.7 | 177 |
| City | Citroën C-Zero, BEV | 13.5 | 0 | Premium | Audi A6, D | 5.3 | 139 |
| City | Mia Electric, BEV | 10 | 0 | Premium | BMW 535i, P | 8.9 | 209 |
| City | Tazzari Zero, BEV | 13.5 | 0 | Premium | BMW 535, D | 5.4 | 142 |
| City | Renault Zoe, BEV | 11 | 0 | Premium | Mercedes E250, P | 6.6 | 154 |
| Medium | Citroën C4, P | 6.1 | 140 | Premium | Mercedes E250, D | 5 | 130 |
| Medium | Citroën C4, D | 4.2 | 109 | Premium | Audi A6, HEV | 6.2 | 145 |
| Medium | Ford Focus, P | 4.8 | 109 | Premium | BMW 7-Series, HEV | 6.8 | 158 |
| Medium | Ford Focus, D | 4.2 | 109 | Premium | Mercedes E300, HEV (D) | 4.3 | 112 |
| Medium | Renault Fluence, P | 6.8 | 157 | Premium | Tesla Model S 40, BEV | 18.8 | 0 |
| Medium | Renault Fluence, D | 4.6 | 120 | Premium | Tesla Model S 60, BEV | 18.8 | 0 |
| Medium | VW Golf, P | 6 | 139 | Premium | Tesla Model S 85, BEV | 18.8 | 0 |
| Medium | VW Golf, D | 3.8 | 99 |
2. Environmental Impact
2.1. Methodology
2.2. Inventory
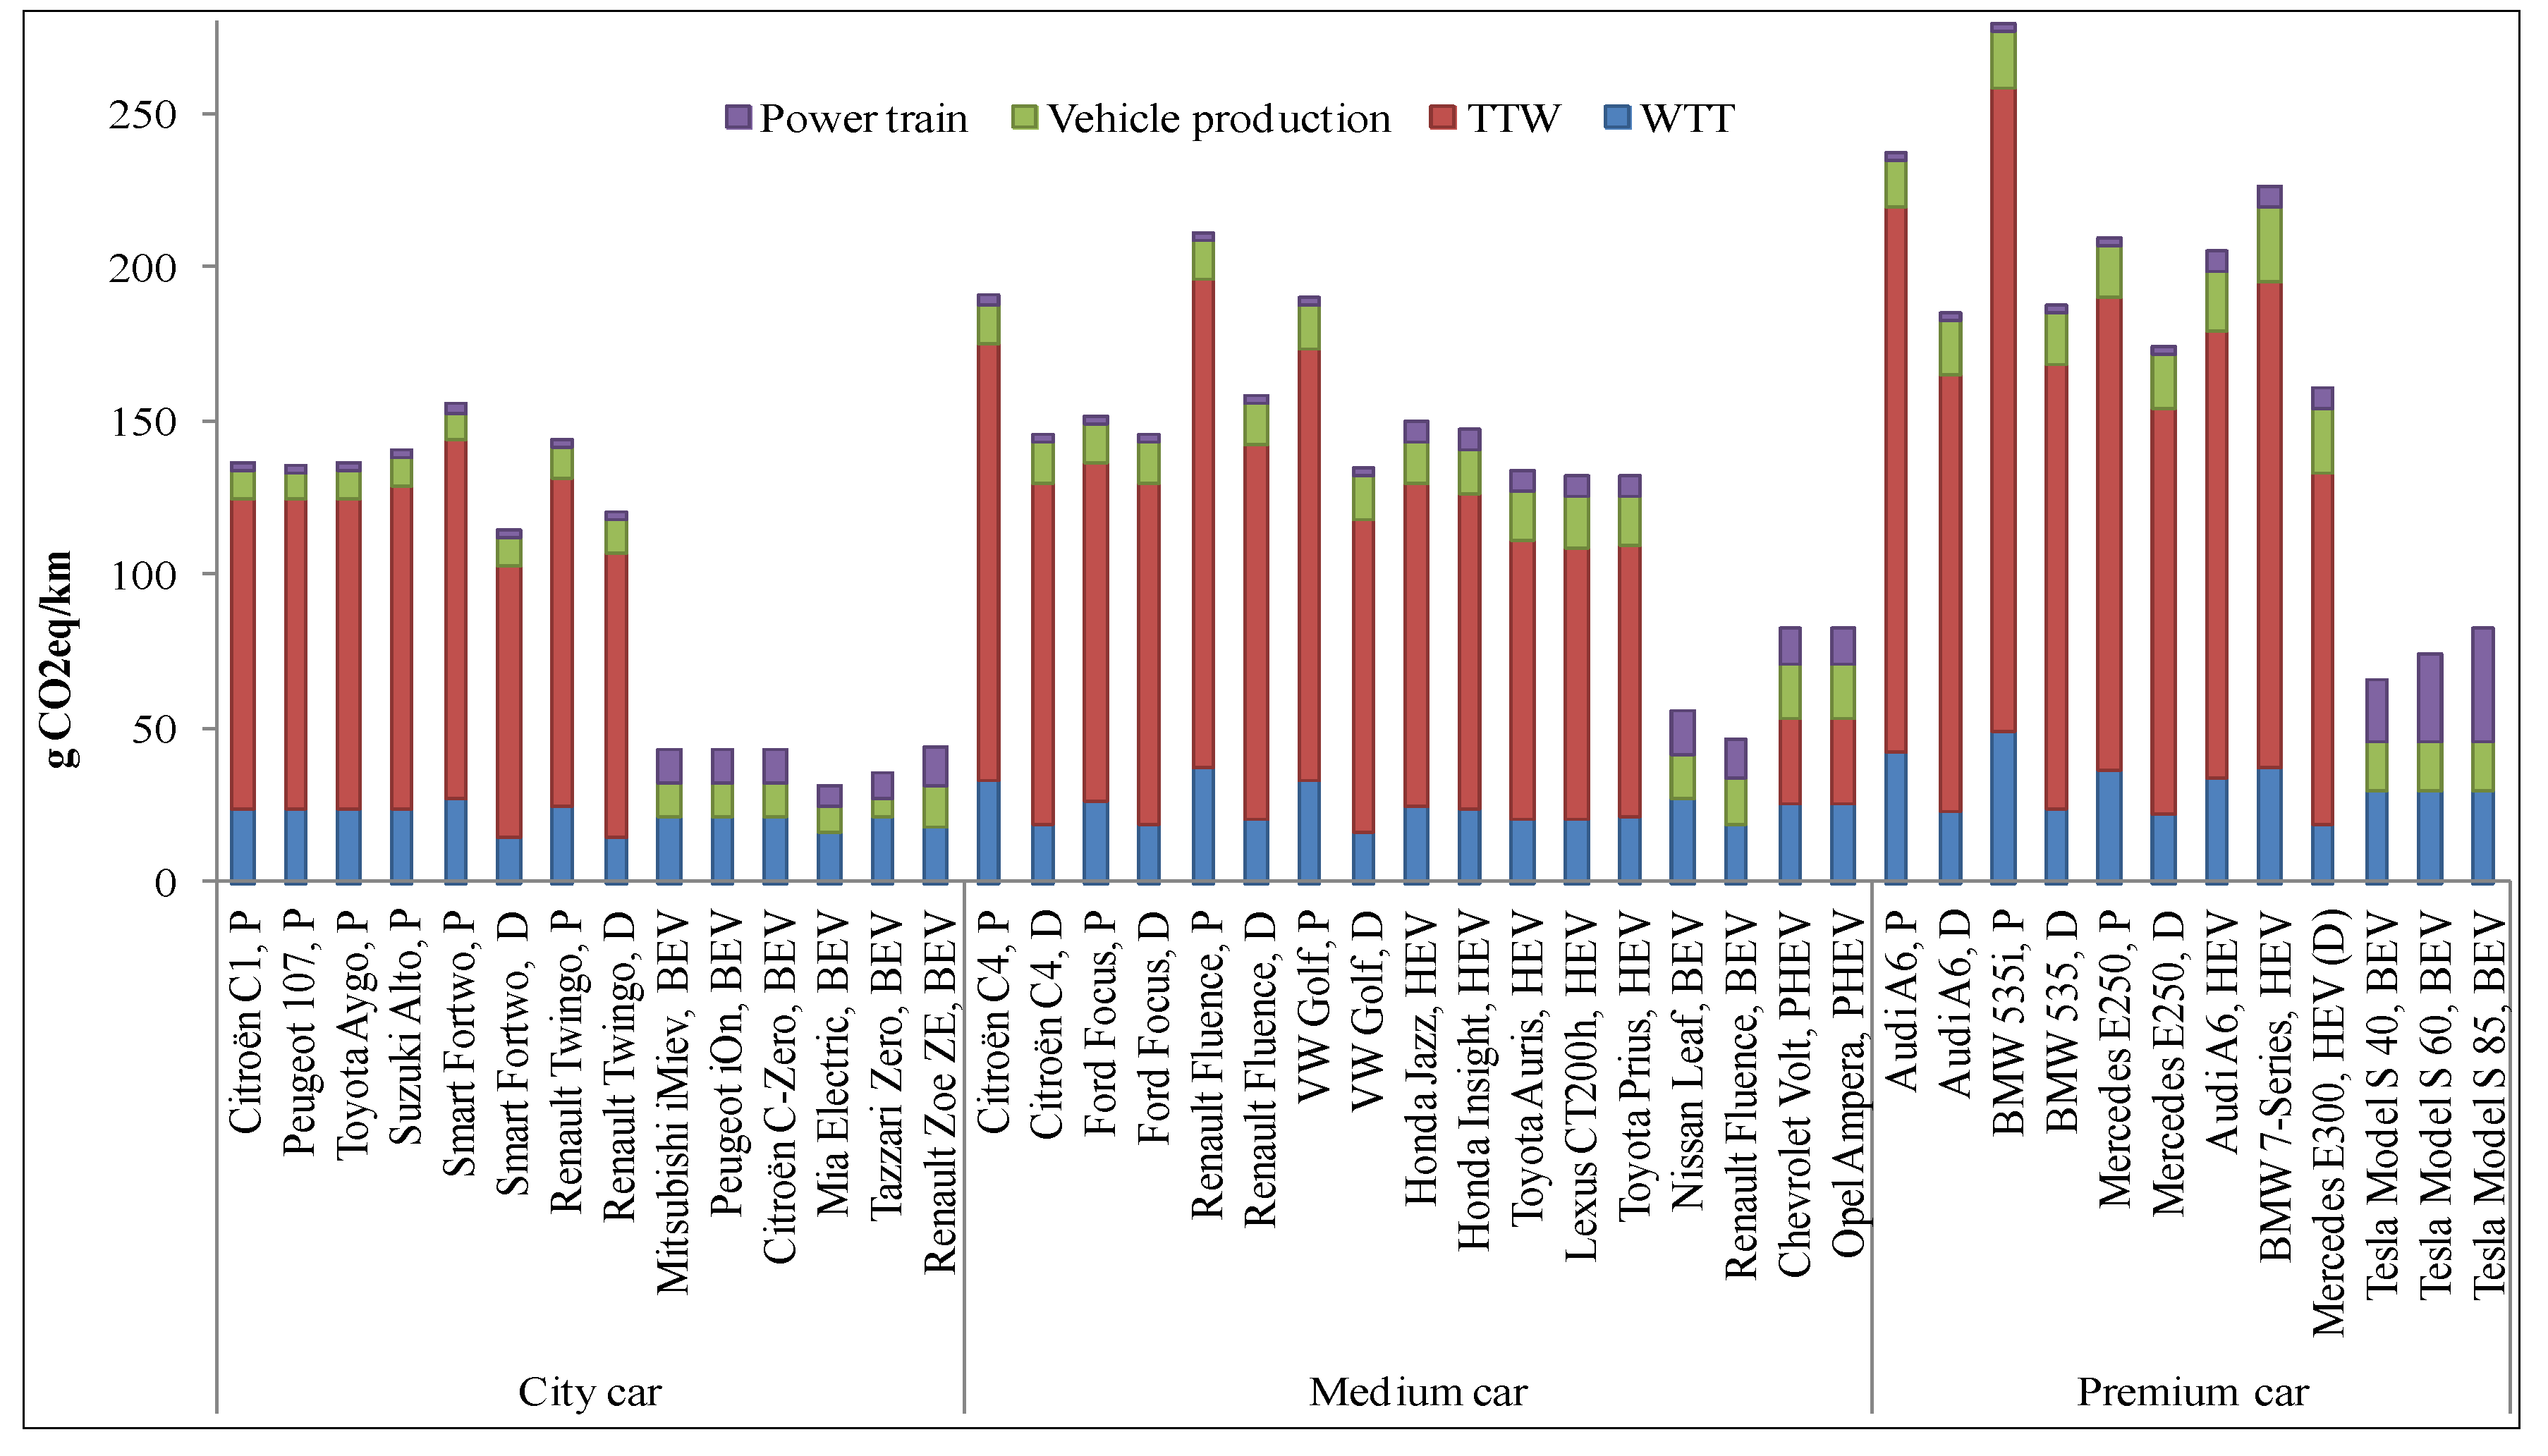
2.3. Results

3. Total Cost of Ownership
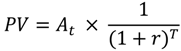
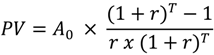
3.1. Methodology
- PV = Present value
- At = Amount of one-time cost at a time t
- A0 = Amount of recurring cost
- r = Real discount rate
- T = Time (expressed as number of years)
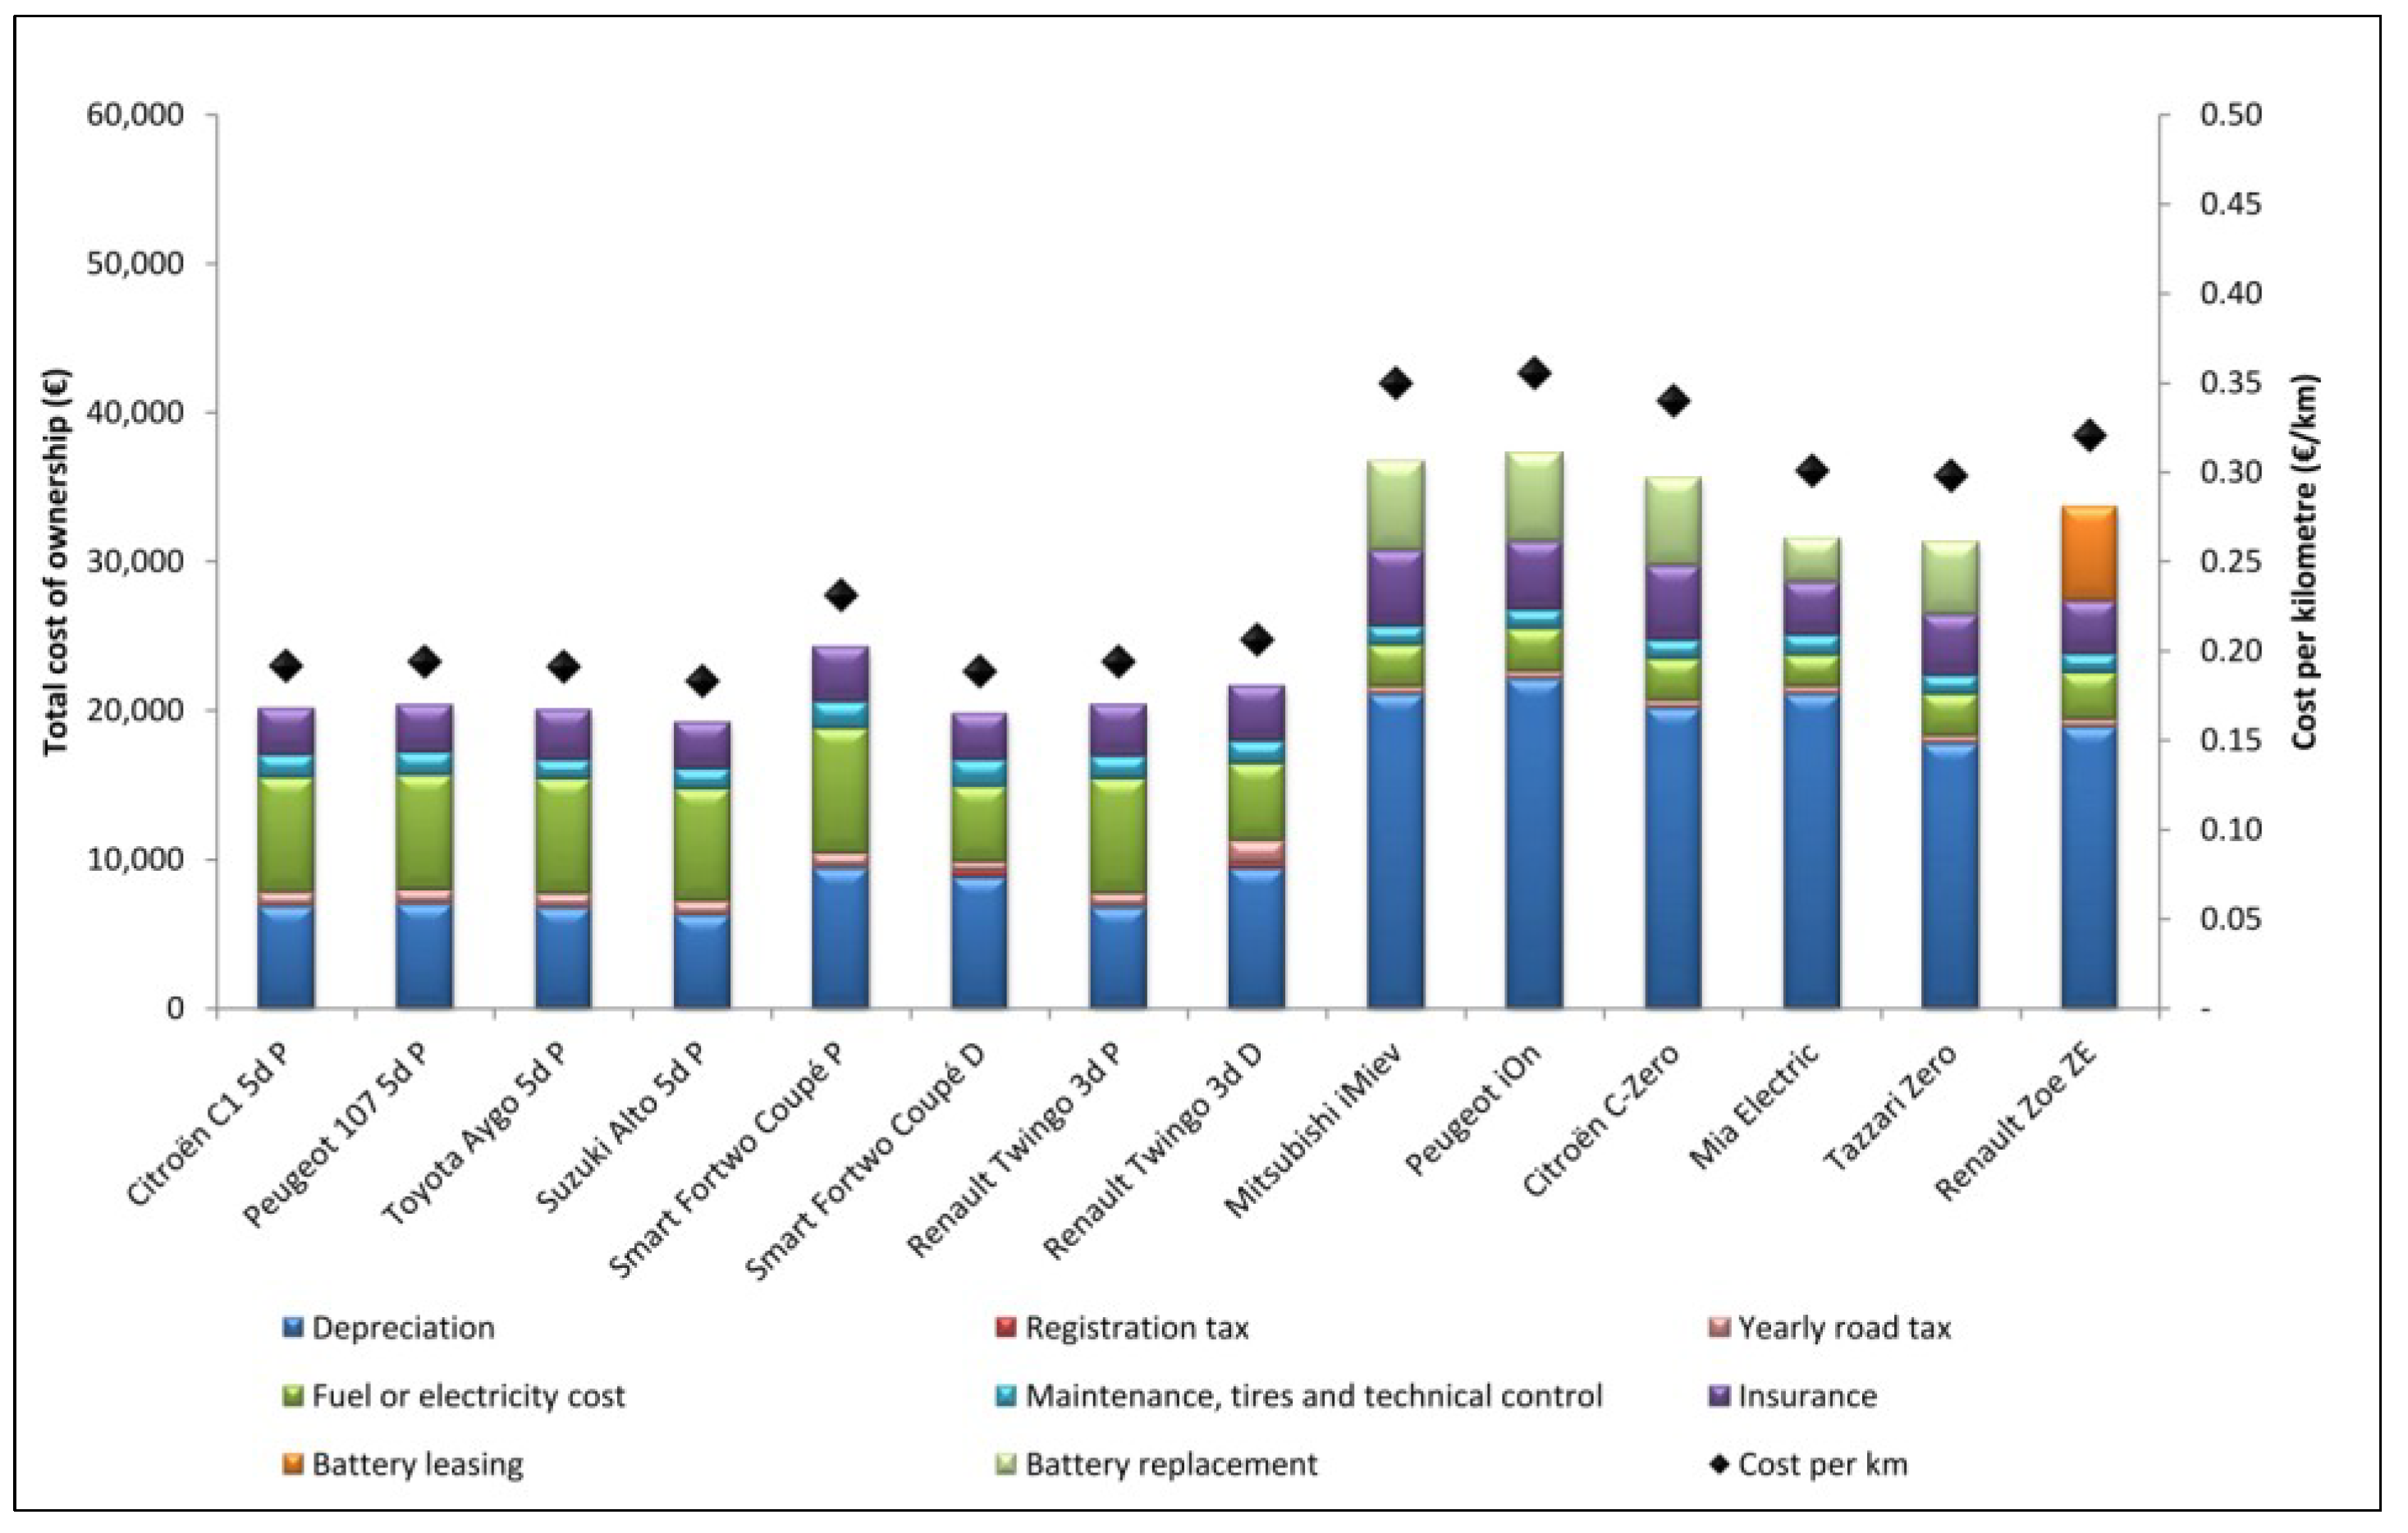
- The initial purchase price of a vehicle in this TCO analysis includes the VAT (value added tax, 21% in Belgium) but excludes dealer price reductions and promotions. Vehicles depreciate over time, according to the vehicle technology. As BEVs and PHEVs have only recently entered the market, the depreciation rate for these vehicles is still uncertain. For this TCO analysis, we use the following yearly depreciation rates, calculated through exponential regression based on available data from the past 7 years: 0.845 for petrol, 0.827 for diesel, 0.834 for HEVs, 0.720 for BEVs and 0.773 for PHEVs.
- The vehicle registration tax (VRT) has to be paid once, when purchasing the vehicle, and is based on the basis of the CO2 emission, the EURO norm, the age of the vehicle and the presence of a diesel particulate filter.
- The Belgian yearly road tax is linked to the fiscal horsepower (fiscal hp) of the vehicle, which is in relationship with the cylinder capacity of the engine of the vehicle.
- In this TCO analysis, the omnium insurance (insures vehicle of driver as well as damage done to another vehicle in collision) is taken during the first three years, followed by the civil liability premium (only damage done to another vehicle in collision is insured) for the next years.
- The battery pack of a BEV has to be replaced according to the expected lifetime. Here, we assume a battery lifetime of approximately 6 years, resulting in 90,000 km driven [38]. When this range falls within the car manufacturer’s warranty, no costs are included. If not, we consider a battery replacement cost of €400/kWh, which is the expected cost for lithium ion batteries in 6 years [39]. If the battery pack of the BEV is replaced during the investigated 7 years, the residual value of the vehicle is increased linearly based on the replacement value of the battery.
- Some BEVs are sold with a battery leasing contract, in which the manufacturer ensures the quality of the battery.
- Maintenance costs depend on the vehicle technology and the annual mileage. In this analysis, the maintenance prices are specific for every model. Maintenance costs for BEVs are expected to be lower than those of internal combustion engine vehicles (ICEVs), as there are fewer moving components, they face less temperature stress and do not need oil and filter replacements [40]. We assume a maintenance cost for BEVs of 60% of a comparable ICE vehicle.
- Tires are replaced every 40,000 km. We include the cost for the replacement as well as for the balancing of the tires.
- Finally, all cars have to be inspected on the technical control, starting 4 years after purchase.
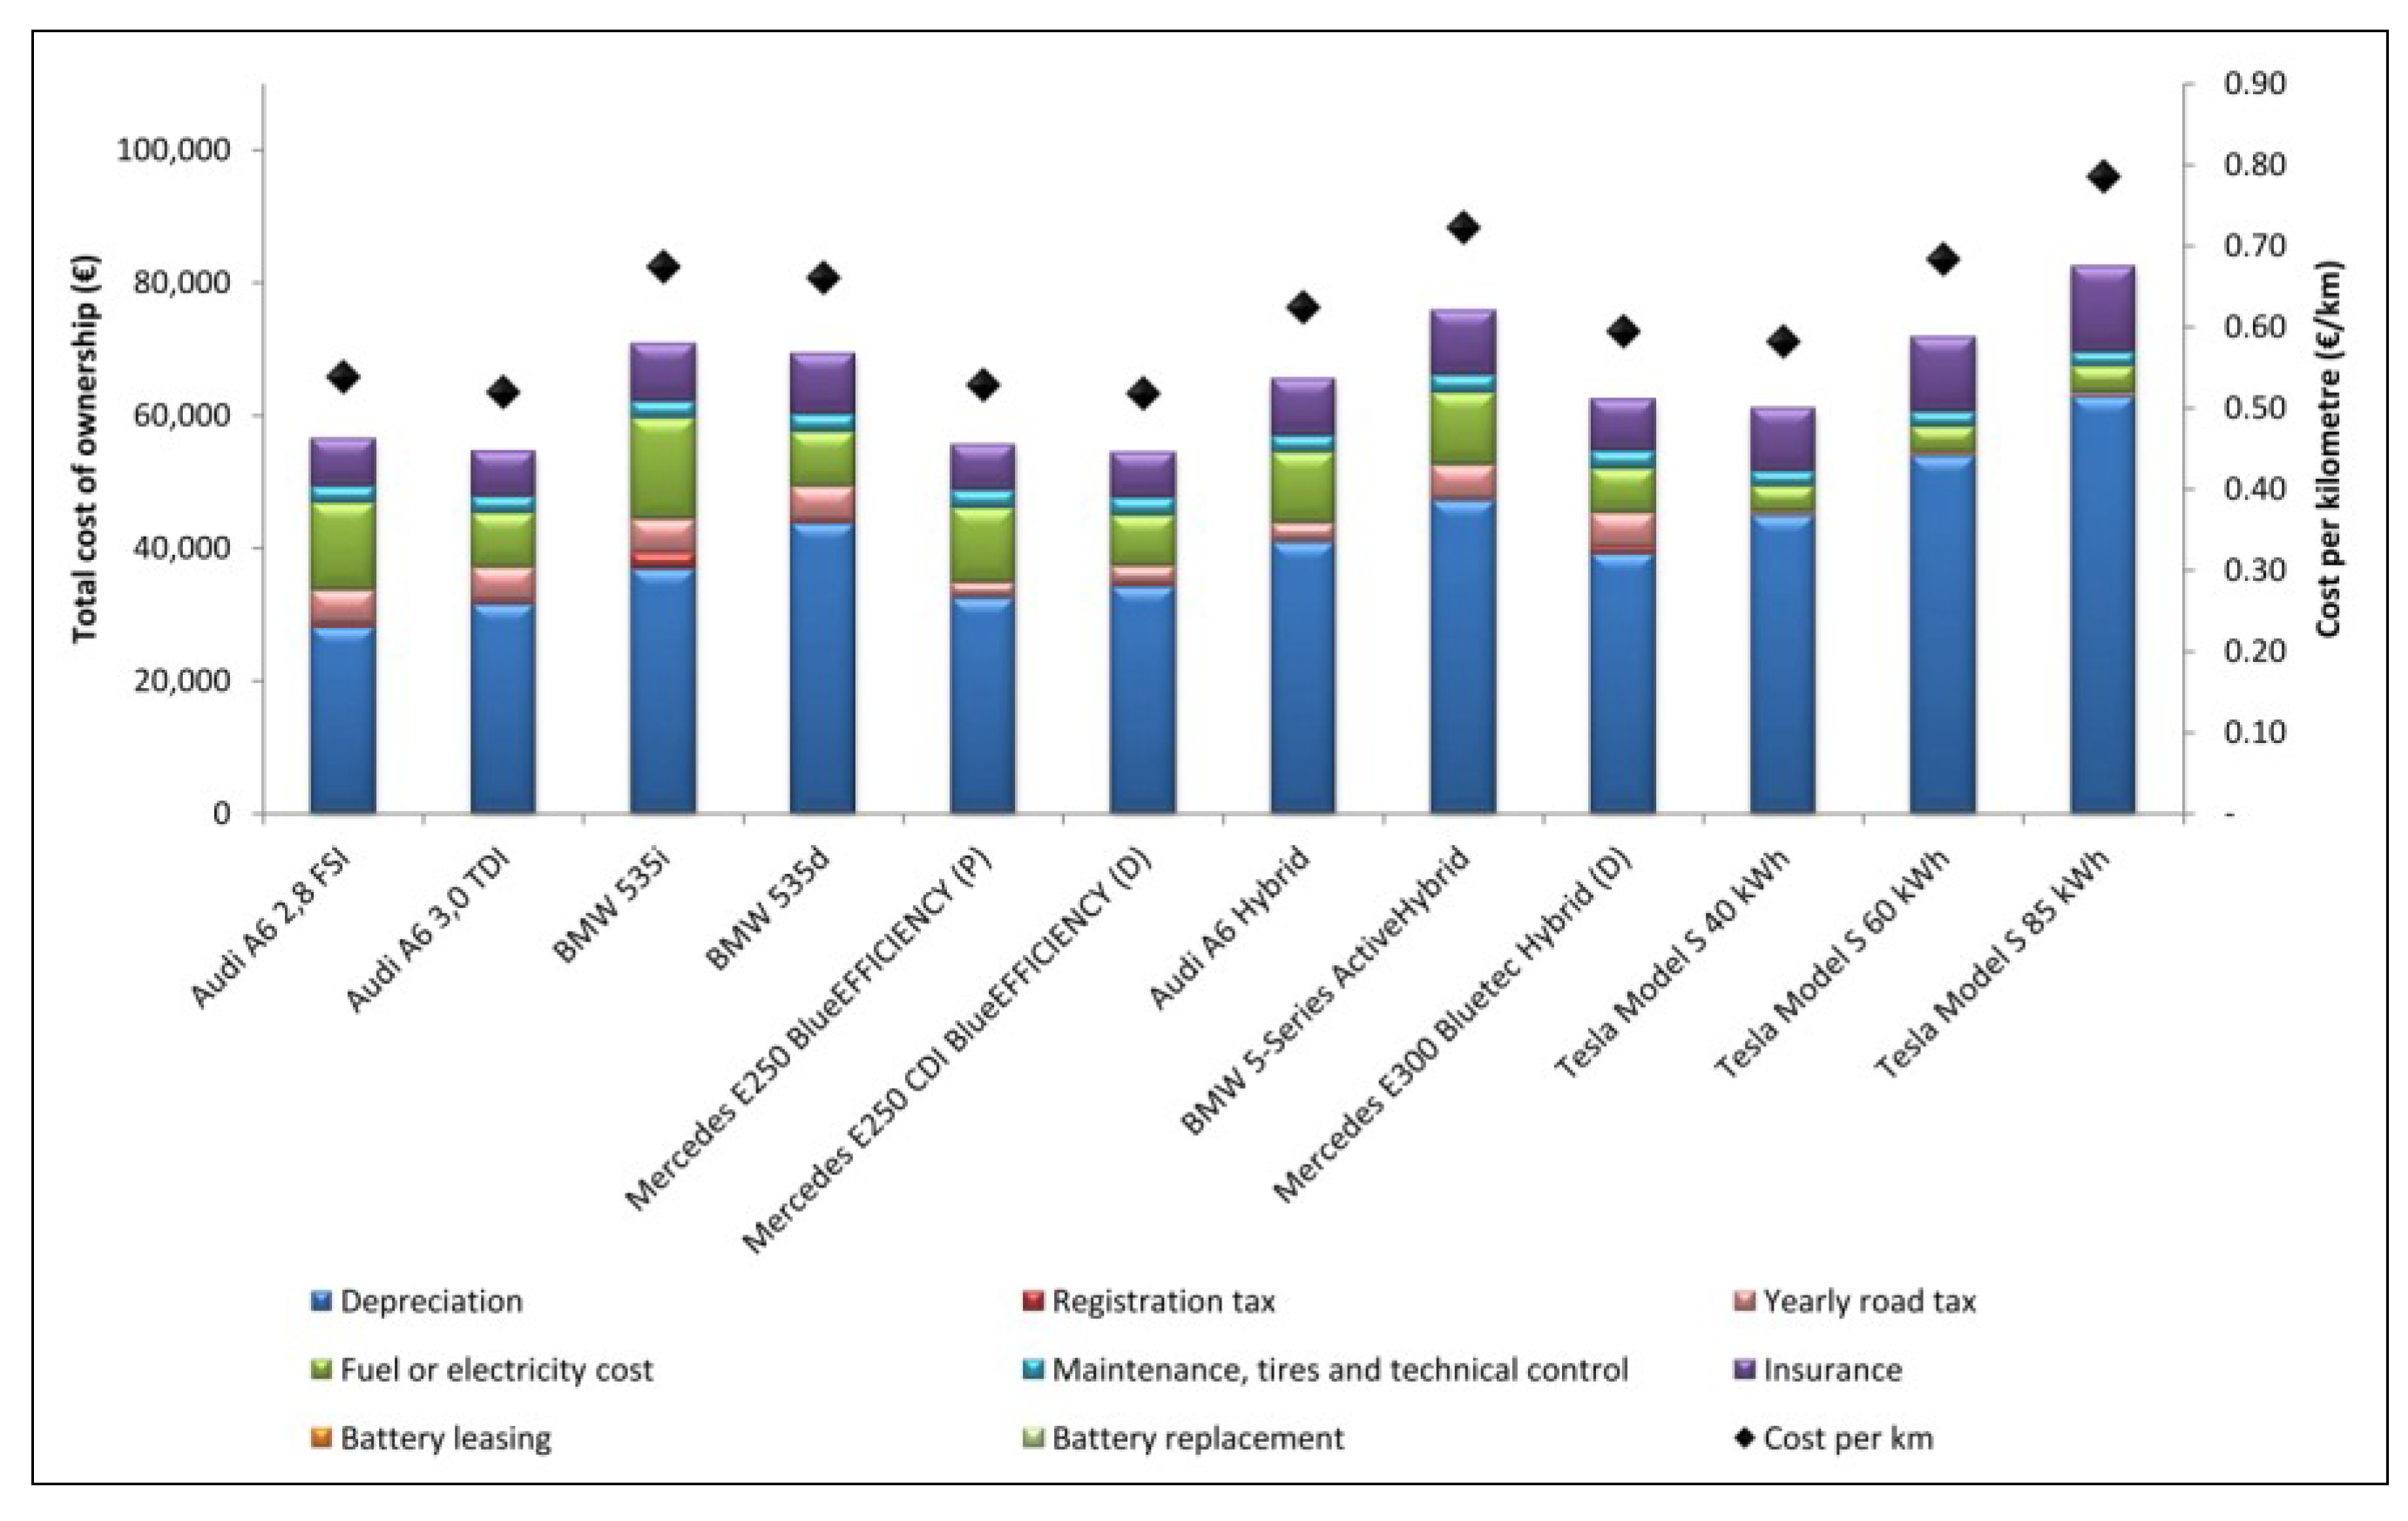
3.2. Results for TCO


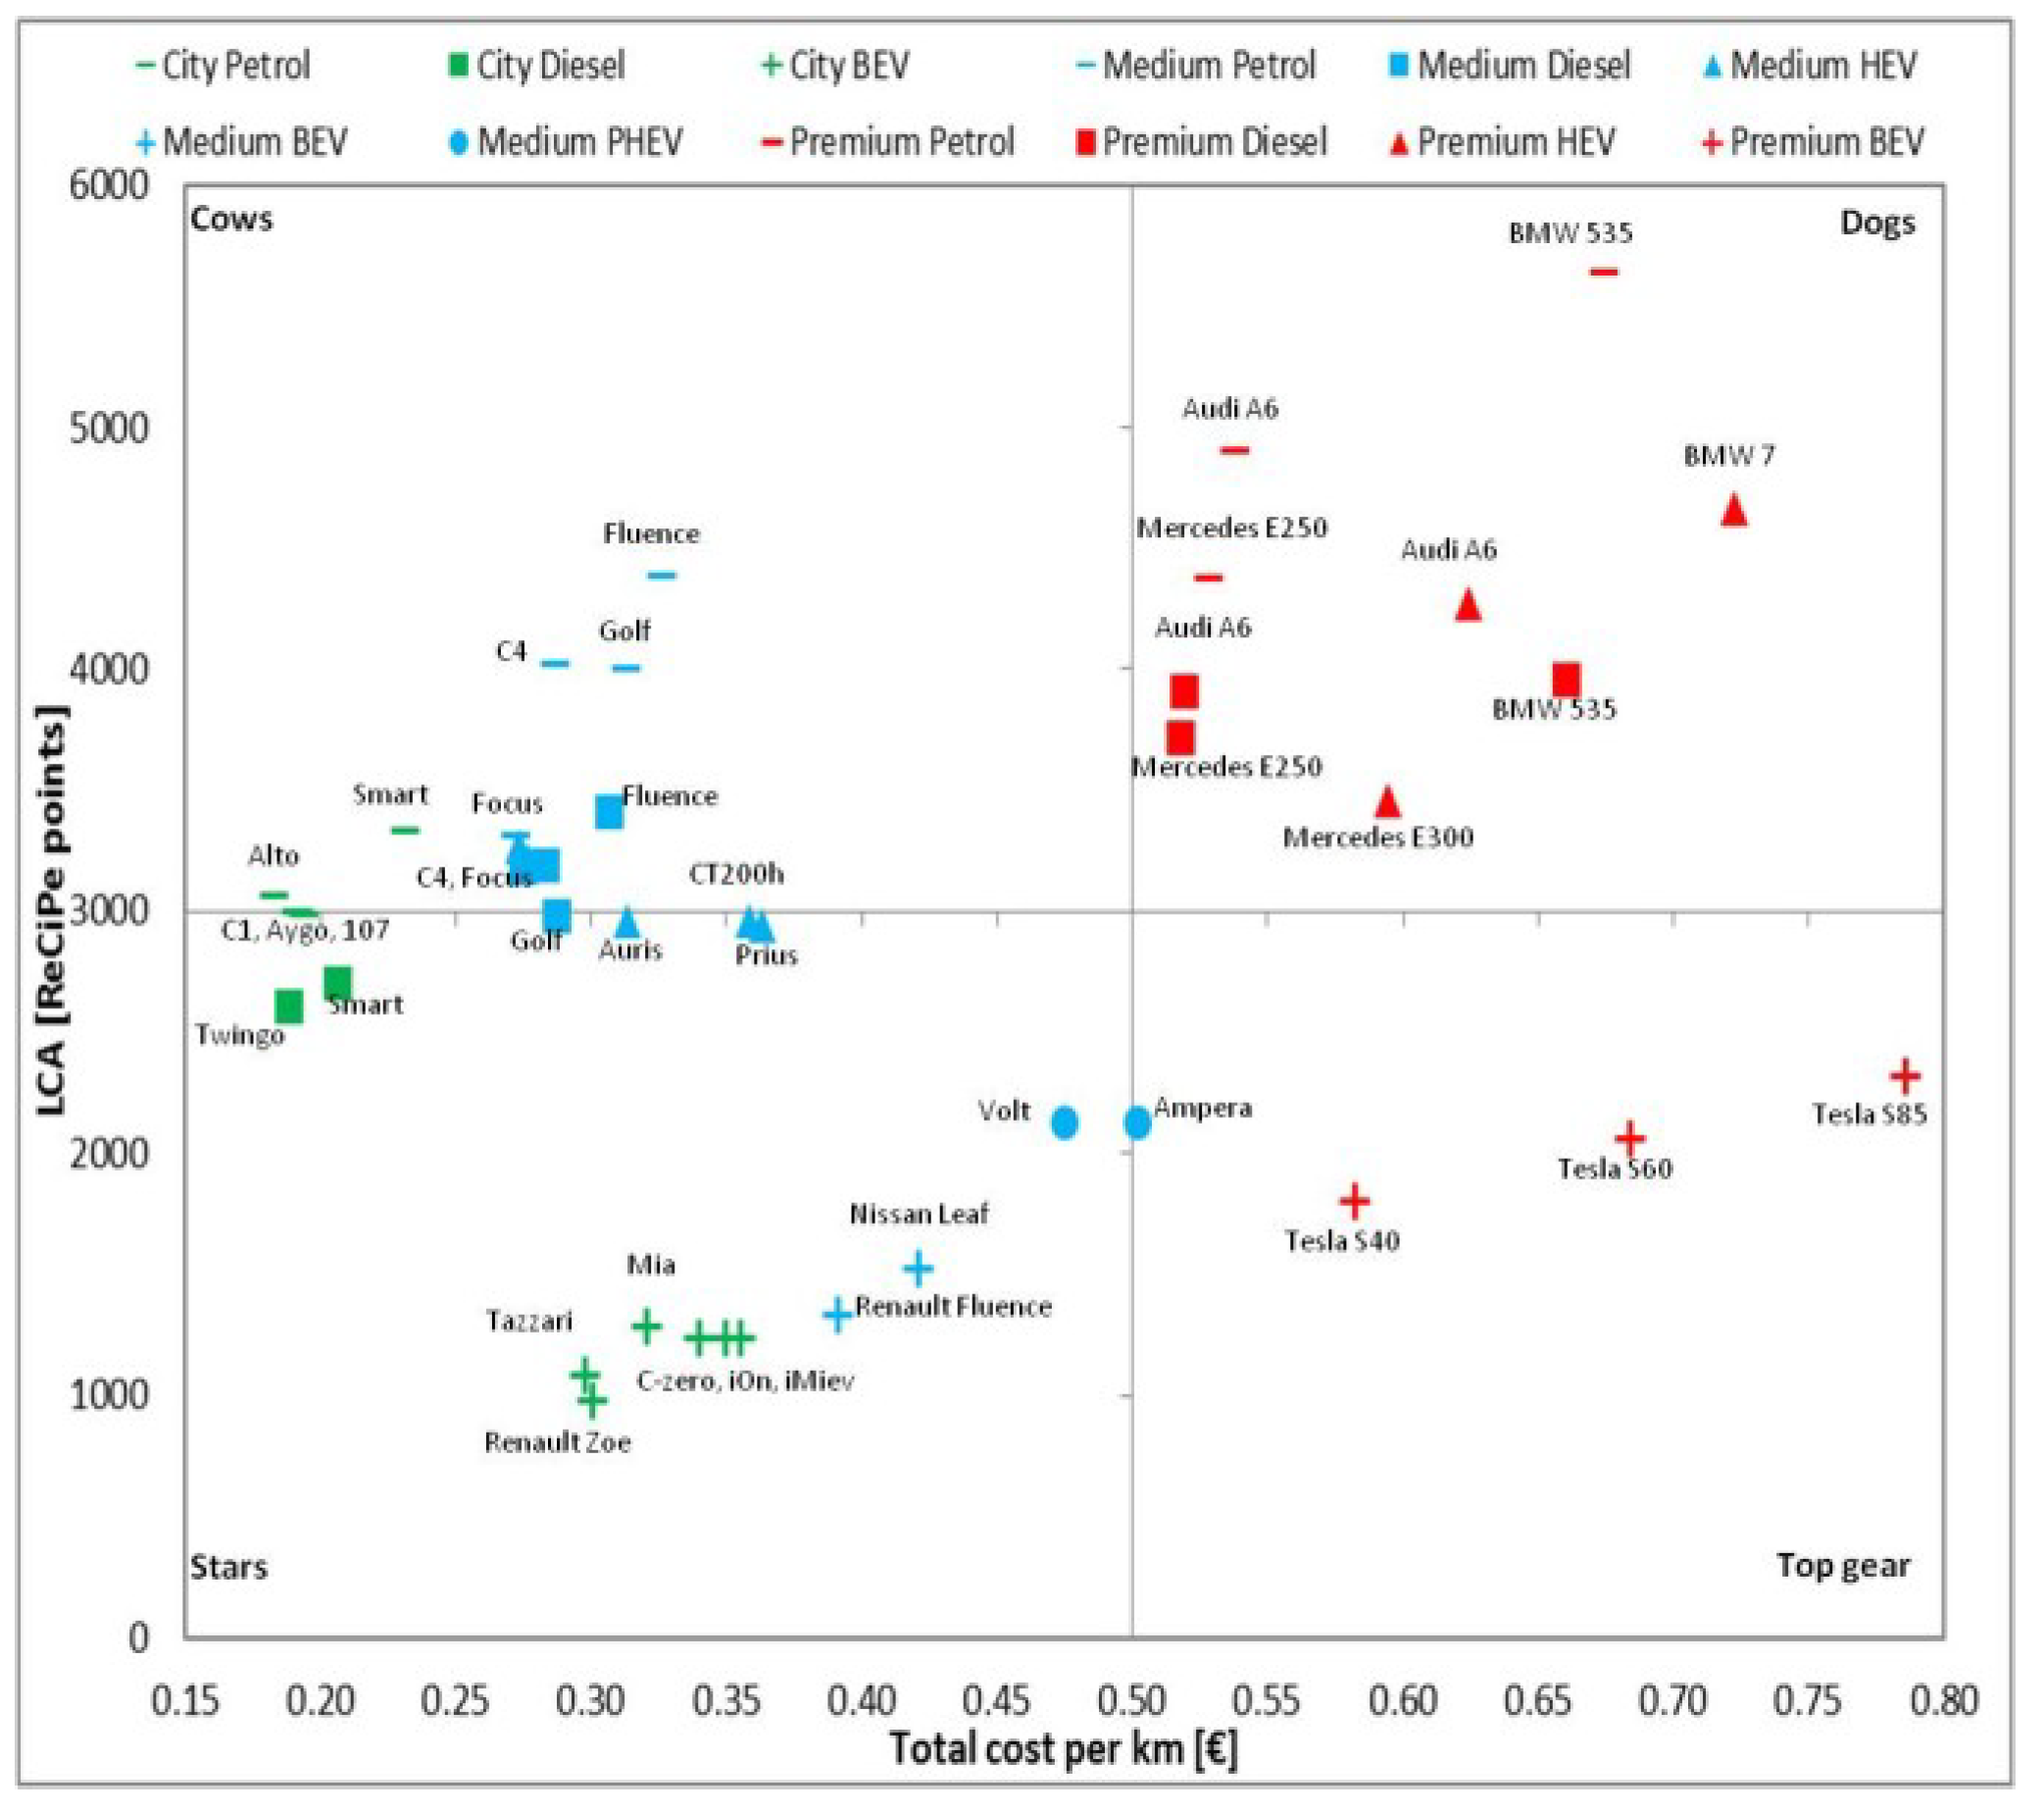
4. Economic and Environmental Balance
5. Conclusions: Cost Efficient Clean Vehicles
Conflicts of Interest
References and Notes
- Messagie, M.; Boureima, F.; Matheys, J.; Sergeant, N.; Timmermans, J.-M.; Macharis, C.; van Mierlo, J. Environmental performance of a battery electric vehicle: A descriptive life cycle assessment approach. World Electr. Veh. J. 2011, 4, 782–786. [Google Scholar]
- Van Mierlo, J.; Maggetto, G. Fuel cell or battery: Electric cars are the future. Fuel Cells 2007, 7, 165–173. [Google Scholar] [CrossRef]
- Hacker, F.; Harthan, R.; Matthes, F.; Zimmer, W. Environmental Impacts and Impact on the Electricity Market of a Large Scale Introduction of Electric Cars in Europe—Critical Review of Literature; ETC/ACC Technical Paper 2009/4; European Topic Centre on Air and Climate Change: Bilthoven, The Netherlands, 2009; p. 169. [Google Scholar]
- Van Mierlo, J.; Maggetto, G.; van de Burgwal, E.; Gense, R. Driving style and traffic measures—influence on vehicle emissions and fuel consumption. J. Automob. Eng. 2004, 218, 43–50. [Google Scholar]
- Lebeau, K.; van Mierlo, J.; Lebeau, P.; Mairesse, O.; Macharis, C. Consumer attitudes towards battery electric vehicles: A large scale survey. Int. J. Electr. Hybrid Veh. 2013, 5, 28–41. [Google Scholar]
- Lebeau, K.; van Mierlo, J.; Lebeau, P.; Mairesse, O.; Macharis, C. The market potential for (plug-in hybrid) electric vehicles in Flanders: A choice-based conjoint analysis. Trans. Res. D: Trans. Environ. 2012, 17, 592–597. [Google Scholar] [CrossRef]
- Mairesse, O.; Macharis, C.; Lebeau, K.; Turcksin, L. Understanding the attitude-action gap: Functional integration of environmental aspects in car purchase intentions. Psicologica 2011, 33, 547–574. [Google Scholar]
- Althaus, H. Life-Cycle Assessment of Electric Vehicles. In Proceedings of LowCVP/IMechE Life-Cycle Seminar, One Birdcage Walk, Westminster, London, UK, 14 November 2011.
- Lane, B. Life Cycle Assessment of Vehicle Fuels and Technologies; Final Report London Borough of Camden; Ecolane Transport Consultancy: Bristol, UK, 2006. [Google Scholar]
- Helms, H.; Pehn, M.; Lambrecht, U.; Liebich, A. Electric Vehicle and Plug-In Hybrid Energy Efficiency and Life Cycle Emissions. In Electro and Hybrid Vehicles, Proceedings of 18th International Symposium Transport and Air Pollution, Dübendorf, Switzerland, 18–19 May 2010; p. 113.
- Simons, A. LCA Comparison of Electric Drivetrains in Passenger Cars; Paul Scherrer Institute: Villigen, Switzerland, 2011. [Google Scholar]
- Hawkins, T.R.; Singh, B.; Majeau-Bettez, G.; Stromman, A.H. Comparative environmental life cycle assessment of conventional and electric vehicles. J. Ind. Ecol. 2012, 17, 53–64. [Google Scholar]
- Held, M.; Baumann, M. Assessment of the Environmental Impacts of Electric Vehicle Concepts. In Towards Life Cycle Sustainability Management; Finkbeiner, M., Ed.; Springer: Berlin, Germany, 2011; pp. 535–546. [Google Scholar]
- Lambrecht, U. Electric Vehicles in a Future Energy System Context. In Proceedings of 43rd LCA Discussion Forum on life Cycle Assessment of Electromobility Answers and Challenges, Zürich, Switzerland, 6 April 2011.
- Frischknecht, R.; Flury, K. Life cycle assessment of electric mobility: Answers and challenges. Int. J. Life Cycle Assess. 2011, 16, 691–695. [Google Scholar] [CrossRef]
- Freire, F. Comparative life-cycle assessment of electric and conventional vehicles in Portugal. In proceedings of 43rd LCA Discussion Forum on life Cycle Assessment of Electromobility Answers and Challenges, Zürich, Switzerland, 6 April 2011.
- Boureima, F.; Messagie, M.; Sergeant, N.; Matheys, J.; van Mierlo, J.; de Vos, M.; de Caevel, B.; Turcksin, L.; Macharis, C. Environmental assessment of different vehicle technologies and fuels. Urban Trans. 2012, 18. [Google Scholar] [CrossRef]
- Al-Alawi, B.; Bradley, T. Total cost of ownership, payback, and consumer preference modeling of plug-in hybrid electric vehicles. Appl. Energy 2012, 103, 488–506. [Google Scholar] [CrossRef]
- Goedecke, M.; Therdthianwong, S.; Gheewala, S. Life cycle cost analysis of alternative vehicles and fuels in Thailand. Energy Policy 2007, 35, 3236–3246. [Google Scholar] [CrossRef]
- Lipman, T.; Delucchi, M. A retail and lifecycle cost analysis of hybrid electric vehicles. Trans. Res. D: Trans. Environ. 2006, 11, 115–132. [Google Scholar] [CrossRef]
- Werber, M.; Fischer, M.; Schwartz, P. Batteries: Lower cost than gasoline? Energy Policy 2009, 37, 2465–2468. [Google Scholar] [CrossRef]
- Windisch, E. The Uptake of Electric Vehicles in the Paris Region: A Financial Analysis of Total Costs of Ownership. In Proceedings of European Transport Conference 2011, Glasgow, Scotland, UK; 2011. [Google Scholar]
- Halog, A.; Manik, Y. Advancing integrated systems modelling framework for life cycle sustainability assessment. Sustainability 2011, 3, 469–499. [Google Scholar] [CrossRef]
- International Organization for Standardization (ISO). Environmental Management—Life Cycle Assessment—Principles and Framework; ISO: Geneva, Switzerland, 2006; ISO 14040:2006. [Google Scholar]
- International Organization for Standardization (ISO). Environmental management—Life cycle assessment—Requirements and Guidelines; ISO: Geneva, Switzerland, 2006; ISO 14044:2006. [Google Scholar]
- Messagie, M. Environmental Performance of Electric Vehicles, A Life Cycle System Approach. Ph.D. Thesis, Vrije Universiteit Brussel, Brussels, Belgium, 2013. [Google Scholar]
- Goedkoop, M.; Heijungs, R.; Huijbregts, M.; de Schryver, A.; Struijs, J.; van Zelm, R. ReCiPe 2008—A Life Cycle Impact Assessment Method Which Comprises Harmonized Category Indicatorsat the Midpoint and the Endpoint Level; Report I: Characterisation; Ministerie van VROM Rijnstraat: Den Haag, The Netherlands, 2009. [Google Scholar]
- Rapport annuel 2011. Available online: http://www.febelauto.be/nl/jaarverslag2011 (accessed on 17 October 2013).
- Statistics Belgium. Available online: http://statbel.fgov.be/nl/statistieken/cijfers/verkeer_vervoer/verkeer/voertuigpark/ (accessed on 17 October 2013).
- Ecoscore. Available online: http://www.ecoscore.be (accessed on 17 October 2013).
- Jungbluth, N. Erdöl. In Sachbilanzen von Energiesystemen; (in German). Final report No. 6; Swiss Centre for Life Cycle Inventories: Zürich, Switzerland, 2007. [Google Scholar]
- Schweimer, G.W.; Levin, M. Life Cycle Inventory for the Golf A4. Available online: http://www.volkswagenag.com/content/vwcorp/info_center/en/publications/2007/01/Golf_A4__Life_Cycle_Inventory.-bin.acq/qual-BinaryStorageItem.Single.File/golfa4_english.pdf (accessed on 17 November 2013).
- Mearig, T.; Coffee, N.; Morgan, M. Life Cycle Cost Analysis Handbook. Available online: http://www.wbdg.org/resources/lcca.php (accessed on 17 October 2013).
- Van Mierlo, J.; Messagie, M.; Boureima, F.; Sergeant, N.; Six, D.; Michiels, H.; Denys, T. Trans2House: Transition Pathways to Efficient (Electrified) Transport for Households; Belgian Federal Science Policy Office: Brussels, Belgium, 2012. [Google Scholar]
- ECB. Statistical Data Warehouse. Available online: http://sdw.ecb.europa.eu/ (accessed on 17 October 2013).
- Evolutie van de maximumprijzen van brandstoffen in België. Available online: http://www.petrolfed.be/nl/maximumprijzen/samenstelling-huidige-maximumprijzen (accessed on 17 October 2013).
- Evolutie elektriciteits-en aardgasprijzen (incl. btw) voor huishoudelijke afnemers. Available online: http://www.vreg.be/sites/default/files/uploads/evolutie_elektriciteits-en_aardgasprijzen_incl__btw_voor_huishoudelijke_afnemers_25_oktober_2012.pdf (accessed on 17 October 2013).
- Van den Bossche, P.; Vergels, F.; van Mierlo, J.; Matheys, J.; van Autenboer, W. SUBAT: An assessment of sustainable battery technology. J. Power Sour. 2006, 162, 913–919. [Google Scholar] [CrossRef]
- The China New Energy Vehicles Program—Challenges and Opportunities. Available online: http://documents.worldbank.org/curated/en/2011/04/14082658/china-new-energy-vehicles-program-challenges-opportunities (accessed on 17 October 2013).
- Van Vliet, O.; Brouwer, A.S.; Kuramochi, T.; van den Broek, M.; Faaij, A. Energy use, cost and CO2 emissions of electric cars. J. Power Sour. 2012, 196, 2298–2310. [Google Scholar]
© 2013 by the authors; licensee MDPI, Basel, Switzerland. This article is an open access article distributed under the terms and conditions of the Creative Commons Attribution license (http://creativecommons.org/licenses/by/3.0/).
Share and Cite
Messagie, M.; Lebeau, K.; Coosemans, T.; Macharis, C.; Van Mierlo, J. Environmental and Financial Evaluation of Passenger Vehicle Technologies in Belgium. Sustainability 2013, 5, 5020-5033. https://doi.org/10.3390/su5125020
Messagie M, Lebeau K, Coosemans T, Macharis C, Van Mierlo J. Environmental and Financial Evaluation of Passenger Vehicle Technologies in Belgium. Sustainability. 2013; 5(12):5020-5033. https://doi.org/10.3390/su5125020
Chicago/Turabian StyleMessagie, Maarten, Kenneth Lebeau, Thierry Coosemans, Cathy Macharis, and Joeri Van Mierlo. 2013. "Environmental and Financial Evaluation of Passenger Vehicle Technologies in Belgium" Sustainability 5, no. 12: 5020-5033. https://doi.org/10.3390/su5125020