<?xml version="1.0" encoding="UTF-8"?>
<!DOCTYPE article PUBLIC "-//NLM//DTD Journal Publishing DTD v2.3 20070202//EN" "journalpublishing.dtd">
<article xmlns:mml="http://www.w3.org/1998/Math/MathML" xmlns:xlink="http://www.w3.org/1999/xlink" xml:lang="en" article-type="research-article">
  <front>
    <journal-meta>
      <journal-id journal-id-type="publisher-id">sustainability</journal-id>
      <journal-title>Sustainability</journal-title>
      <abbrev-journal-title abbrev-type="publisher">Sustainability</abbrev-journal-title>
      <abbrev-journal-title abbrev-type="pubmed">Sustainability</abbrev-journal-title>
      <issn pub-type="epub">2071-1050</issn>
      <publisher>
        <publisher-name>MDPI</publisher-name>
      </publisher>
    </journal-meta>
    <article-meta>
      <article-id pub-id-type="doi">10.3390/su5010357</article-id>
      <article-id pub-id-type="publisher-id">sustainability-05-00357</article-id>
      <article-categories>
        <subj-group>
          <subject>Article</subject>
        </subj-group>
      </article-categories>
      <title-group>
        <article-title>Enabling Eco-Friendly Choices by Relying on the Proportional-Thinking Heuristic</article-title>
      </title-group>
      <contrib-group>
        <contrib contrib-type="author">
          <name>
            <surname>Dutt</surname>
            <given-names>Varun</given-names>
          </name>
          <xref rid="af1-sustainability-05-00357" ref-type="aff">1</xref>
          <xref rid="c1-sustainability-05-00357" ref-type="corresp">*</xref>
        </contrib>
        <contrib contrib-type="author">
          <name>
            <surname>Gonzalez</surname>
            <given-names>Cleotilde</given-names>
          </name>
          <xref rid="af2-sustainability-05-00357" ref-type="aff">2</xref>
        </contrib>
      </contrib-group>
      <aff id="af1-sustainability-05-00357"><label>1</label> School of Computing and Electrical Engineering, School of Humanities and Social Sciences, Indian Institute of Technology, Mandi, 175001, India</aff>
      <aff id="af2-sustainability-05-00357"><label>2</label> Dynamic Decision Making Laboratory, Department of Social and Decision Sciences, Carnegie Mellon University, Pittsburgh, PA 15213, USA; E-Mail: <email>coty@cmu.edu</email></aff>
      <author-notes>
        <corresp id="c1-sustainability-05-00357"><label>*</label> Author to whom correspondence should be addressed; E-Mail: <email>varun@iitmandi.ac.in</email>; Tel.: +91-862-797-4036; Fax: +91-1905-237942.</corresp>
      </author-notes>
      <pub-date pub-type="epub">
        <day>22</day>
        <month>01</month>
        <year>2013</year>
      </pub-date>
      <pub-date pub-type="collection"><month>01</month>
        <year>2013</year>
      </pub-date>
      <volume>5</volume>
      <issue>1</issue>
      <fpage>357</fpage>
      <lpage>371</lpage>
      <history>
        <date date-type="received">
          <day>11</day>
          <month>10</month>
          <year>2012</year>
        </date>
        <date date-type="rev-recd">
          <day>25</day>
          <month>12</month>
          <year>2012</year>
        </date>
        <date date-type="accepted">
          <day>09</day>
          <month>01</month>
          <year>2013</year>
        </date>
      </history>
      <permissions>
        <copyright-statement>©  2013 by the authors; licensee MDPI, Basel, Switzerland.</copyright-statement>
        <copyright-year>2013</copyright-year>
        <license xmlns:xlink="http://www.w3.org/1999/xlink" license-type="open-access" xlink:href="http://creativecommons.org/licenses/by/3.0/">
          <p>This article is an open-access article distributed under the terms and conditions of the Creative Commons Attribution license (http://creativecommons.org/licenses/by/3.0/).</p>
        </license>
      </permissions>
      <abstract>
        <p>Ecological (eco) taxes are promising mechanisms to enable eco-friendly decisions, but few people prefer them. In this study, we present a way in which eco-tax options may be communicated to general public to encourage their payment. Our implementation (called “information presentation”) takes advantage of the non-linear relationship between eco-tax payments and CO<sub>2</sub> emissions and the human reliance on the proportional-thinking heuristic. According to the proportional-thinking heuristic, people are likely to prefer a small eco-tax increase and judge larger eco-tax increases to cause proportionally greater CO<sub>2</sub> emissions reductions. In an online study, participants were asked to choose between eco-tax increases in two problems: In one, a smaller eco-tax increase resulted in greater CO<sub>2</sub> emissions reduction, while in the other, a smaller tax increase resulted in lesser CO<sub>2</sub> emissions reduction. Although the larger eco-tax increase did not reduce CO<sub>2</sub> emissions the most, across both problems, people judged larger eco-tax increases to cause proportionally greater reductions in CO<sub>2</sub> emissions and preferred smaller tax increases. Thus, eco-tax policies would benefit by presenting information in terms of eco-tax increases, such that smaller eco-tax increases (which are more attractive and are likely to be chosen by people) cause greater CO<sub>2</sub> emissions reductions.</p>
      </abstract>
      <kwd-group>
        <kwd>proportional thinking</kwd>
        <kwd>eco-tax</kwd>
        <kwd>climate change</kwd>
        <kwd>carbon-dioxide emissions</kwd>
      </kwd-group>
    </article-meta>
  </front>
  <body>
    <sec sec-type="intro">
      <title>1. Introduction</title>
      <p>Literature on human decision making broadly demonstrates that humans rely upon a number of heuristics [<xref ref-type="bibr" rid="B1-sustainability-05-00357">1</xref>]. Many of these heuristics might adversely affect human decision making on important global problems (e.g., climate change). To improve human decisions, one option is to design manipulations that make humans aware and help them overcome their reliance on heuristics; however, another and perhaps easier manipulation is to present information in a way that people’s reliance on heuristics improves their decisions [<xref ref-type="bibr" rid="B2-sustainability-05-00357">2</xref>,<xref ref-type="bibr" rid="B3-sustainability-05-00357">3</xref>,<xref ref-type="bibr" rid="B4-sustainability-05-00357">4</xref>]. In this paper, we follow the latter approach and show how information about ecological (eco) tax increases may be presented such that this presentation takes advantage of people’s reliance on a “proportional-thinking” heuristic and enables them to make choices that result in larger reductions in CO<sub>2</sub> emissions. Furthermore, we discuss that our information-presentation manipulation may be used to improve people’s decision choices in many other societal problems (e.g., cigarette smoking, pollution in rivers, air pollution and overfishing).</p>
      <p>An eco-tax (or carbon price) is the cost people would pay to emit a unit of CO<sub>2</sub> in the atmosphere (units: $/ton of CO<sub>2</sub> emissions or $/ton). Eco-taxes are promising economic mechanisms to enable eco-friendly decisions—decisions that reduce carbon-dioxide (CO<sub>2</sub>) emissions in the atmosphere and mitigate climate change [<xref ref-type="bibr" rid="B5-sustainability-05-00357">5</xref>,<xref ref-type="bibr" rid="B6-sustainability-05-00357">6</xref>,<xref ref-type="bibr" rid="B7-sustainability-05-00357">7</xref>,<xref ref-type="bibr" rid="B8-sustainability-05-00357">8</xref>]. Yet, very few people would likely agree to pay eco-taxes to reduce CO<sub>2</sub> emissions on account of their reliance on heuristics. One of these heuristics is called proportional thinking, according to which people assume a strong positive correlation between a problem’s independent (input) and dependent (output) variables [<xref ref-type="bibr" rid="B9-sustainability-05-00357">9</xref>,<xref ref-type="bibr" rid="B10-sustainability-05-00357">10</xref>,<xref ref-type="bibr" rid="B11-sustainability-05-00357">11</xref>,<xref ref-type="bibr" rid="B12-sustainability-05-00357">12</xref>,<xref ref-type="bibr" rid="B13-sustainability-05-00357">13</xref>,<xref ref-type="bibr" rid="B14-sustainability-05-00357">14</xref>,<xref ref-type="bibr" rid="B15-sustainability-05-00357">15</xref>,<xref ref-type="bibr" rid="B16-sustainability-05-00357">16</xref>]. For example, by relying on the proportional-thinking heuristic for the Earth’s climate, people might wrongly infer that the shape of CO<sub>2</sub> concentration (output) over time should be identical to the shape of the CO<sub>2</sub> emissions (input) [<xref ref-type="bibr" rid="B14-sustainability-05-00357">14</xref>,<xref ref-type="bibr" rid="B17-sustainability-05-00357">17</xref>,<xref ref-type="bibr" rid="B18-sustainability-05-00357">18</xref>]. Therefore, if CO<sub>2</sub> emissions are assumed to increase linearly over time, then by relying on proportional thinking, people will infer a linear increasing shape for the atmospheric CO<sub>2</sub> concentration that is similar to the shape of CO<sub>2</sub> emissions. Consequently, such linear judgments are likely to make people underestimate the actual nonlinear increase in CO<sub>2</sub> concentration, undermine the seriousness of the climate problem, and cause them to defer acting on climate change [<xref ref-type="bibr" rid="B19-sustainability-05-00357">19</xref>].</p>
      <p>
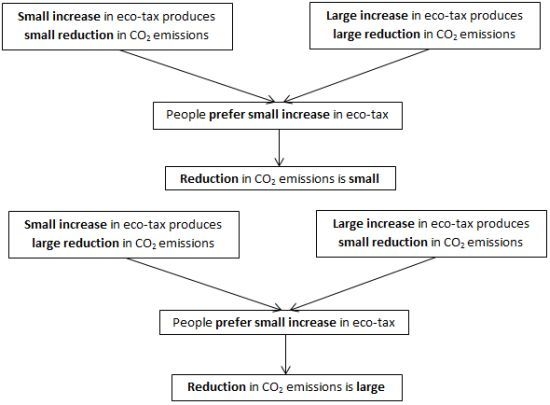
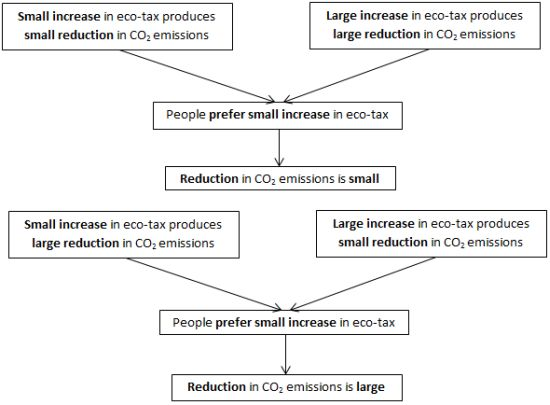
People’s reliance on the proportional-thinking heuristic is likely to be present for their decisions about eco-tax payment preferences and judgments. For example, by relying on the proportional-thinking heuristic, people are likely to prefer smaller tax increases, while associating larger tax increases to mean <italic>proportionally</italic> greater benefits or reductions in CO<sub>2</sub> emissions. An evidence for this belief comes from the marketing literature. For example, most shoppers believe that higher prices are a sign of greater product quality, and repeated studies have shown that while shopping, people expect more expensive products to be beneficial or better in quality [<xref ref-type="bibr" rid="B20-sustainability-05-00357">20</xref>,<xref ref-type="bibr" rid="B21-sustainability-05-00357">21</xref>,<xref ref-type="bibr" rid="B22-sustainability-05-00357">22</xref>]. A recent evidence of this finding comes from [<xref ref-type="bibr" rid="B21-sustainability-05-00357">21</xref>], who told their participants that they were drinking five different varieties of wine and disclosed the prices for each as participants drank. In practice, the participants were only consuming three different wines, since two were offered twice: a $5 wine described as costing $5 and $45 and a $90 bottle presented as $90 and $10. (There was also a $35 wine with the accurate price.) People rated identical wines as tasting better when they were priced higher (e.g., $45), and fMRI scans showed greater activity in the brain’s pleasure regions.</p>
      <p>According to the proportional-thinking heuristic, given a range of options for eco-tax payments to choose between and due to people’s tendency to avoid the displeasure of paying higher taxes [<xref ref-type="bibr" rid="B21-sustainability-05-00357">21</xref>], people are likely to prefer an option with the smallest possible tax increase. Indeed, there is some real world evidence to support this expectation. For example, in a large poll conducted in the U.S. (n &gt; 600), only 17% of respondents preferred an increase in carbon taxes [<xref ref-type="bibr" rid="B23-sustainability-05-00357">23</xref>,<xref ref-type="bibr" rid="B24-sustainability-05-00357">24</xref>]. Similarly, when the French President Nicolas Sarkozy recently scrapped a planned carbon tax, 69% of respondents endorsed his decision, while only 21% said that it was wrong (n = 948) [<xref ref-type="bibr" rid="B25-sustainability-05-00357">25</xref>].</p>
      <p>In addition, for eco-tax payments and the corresponding CO<sub>2</sub> emission reductions, relying on proportional-thinking means that people believe that larger eco-tax increases will result in proportionally greater CO<sub>2</sub> emissions reductions (<italic>i.e.</italic>, benefits) compared to smaller increases. For example, under the 2009 America’s Energy Security Trust Fund Act, a yearly $10/ton increase in carbon tax was believed by Congressmen to result in a <italic>proportional</italic> 31% reduction in CO<sub>2</sub> emissions below their 2005 level. Thus, policymakers, including laypeople, are likely to believe that <italic>larger</italic> tax increases are also those that result in <italic>greater</italic> reductions of CO<sub>2</sub> emissions.</p>
      <p>The problem with applying the proportional-thinking heuristic to eco-taxes is that it is not true that larger eco-tax increases result in greater CO<sub>2</sub> emissions reductions. According to [<xref ref-type="bibr" rid="B26-sustainability-05-00357">26</xref>], there is considerable uncertainty and difficulty in determining the base tax (in $/ton of CO<sub>2</sub> emissions in the atmosphere) for eco-taxes (believed to vary between $3/ton to $95/ton). A suggested method is to allow people to choose between multiple tax increases with different base taxes [
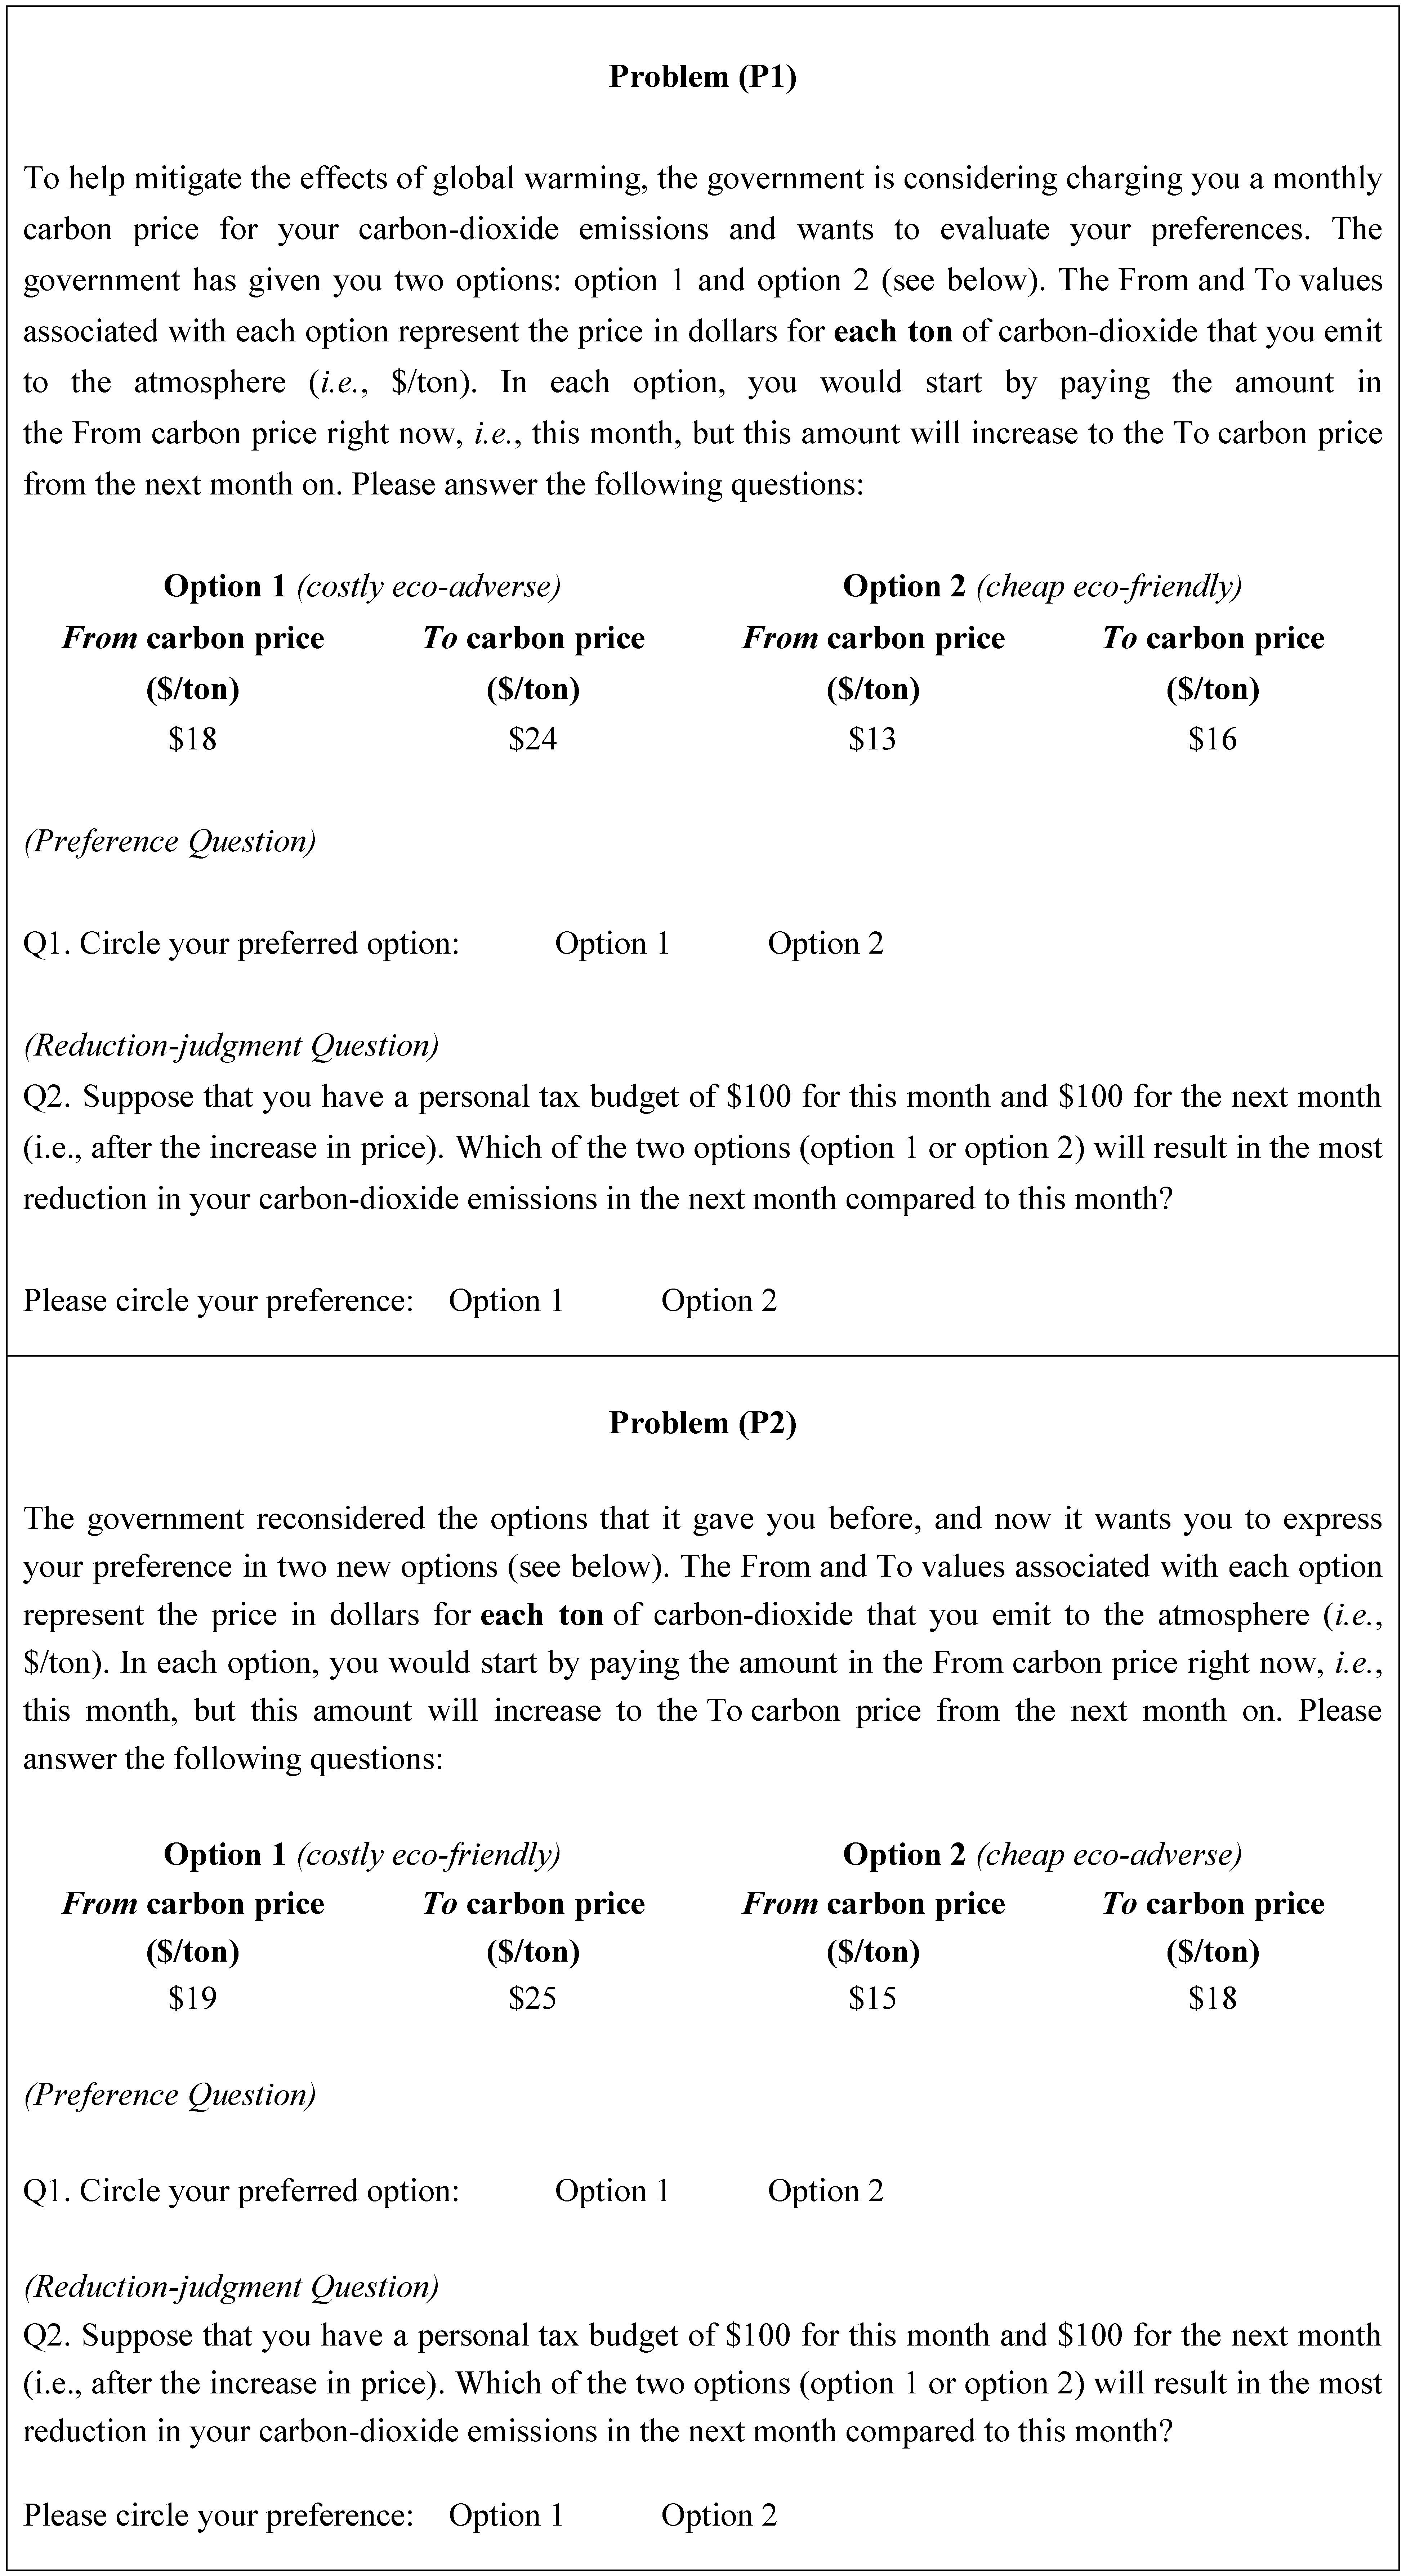
<xref ref-type="bibr" rid="B27-sustainability-05-00357">27</xref>]. For example, suppose a person has a budget constraint (based on his monthly income) of $100 each month [<xref ref-type="bibr" rid="B32-sustainability-05-00357">32</xref>]. This constraint is the limit on the CO<sub>2</sub> emissions that this person could afford each month [<xref ref-type="bibr" rid="B31-sustainability-05-00357">31</xref>]. Under this scenario, if the person uses this budget on carbon tax, then a $6/ton tax increase from a base tax of $18/ton tax would reduce this person’s emissions by 1.39 tons (=100<italic>×</italic> (1/18 – 1/24)). However, a smaller $3/ton increase from a smaller base tax of $13/ton would reduce his emissions by 1.44 tons. Thus, in this case, the smaller base tax with a smaller tax increase is associated with a greater reduction of CO<sub>2 </sub>emissions, in contrast to the proportional-thinking heuristic. In fact, the problem is mathematically similar to the ones that involve judgments with reciprocals, including the common misconception of associating a large increase in mileage of an automobile in “miles per gallon” (mpg) to equate to large savings in fuel used in gallons [<xref ref-type="bibr" rid="B15-sustainability-05-00357">15</xref>]. Similarly, by relying on the proportional-thinking heuristic, people are likely to prefer a smaller base tax with the smaller increase over a larger base tax with the larger increase and are likely to judge a larger base tax with the larger increase to reduce CO<sub>2</sub> emissions the most. </p>
      <p>The main idea that we demonstrate in this paper is that a proper presentation of eco-taxes and their increases is likely to enable more eco-friendly choices, while people continue to associate larger tax increases with greater CO<sub>2</sub> emissions reductions. Prior research in human psychology shows that a change in information presentation of a nonlinear mathematical problem can improve people’s decisions in that problem [<xref ref-type="bibr" rid="B2-sustainability-05-00357">2</xref>,<xref ref-type="bibr" rid="B3-sustainability-05-00357">3</xref>,<xref ref-type="bibr" rid="B4-sustainability-05-00357">4</xref>]. We demonstrate the effectiveness of this information-presentation manipulation with an experiment involving eco-taxes in the next section.</p>
    </sec>
    <sec>
      <title>2. Method</title>
      <p>In order to test people’s tax preferences with respect to their judgments about CO<sub>2</sub> emissions reductions, we ran an online experiment using two problems: one in which reliance on the proportional-thinking heuristic is likely to cause more eco-friendly preferences and is likely to hamper correct judgments about CO<sub>2</sub> emissions reductions; and the other, where reliance on the proportional-thinking heuristic is likely to support correct judgments about emissions reductions and is likely to cause less eco-friendly preferences.</p>
      <sec sec-type="subjects">
        <title>2.1. Participants</title>
        <p>One hundred and sixty-five participants were recruited using Amazon’s Mechanical Turk (MTurk). A majority of the participants were from the U.S., a few belonged to India and Mexico and the rest belonged to the European Union. In self-reports, more than 90% of participants indicated that they understood the text of the questions without any problem. Based on self-reported demographics, 54% were males, 40% held graduate degrees and the other 60% held undergraduate and high-school degrees and 67% had a background in science, technology, engineering, mathematics or medicine (STEM). Ages ranged from 18 to 55 years (M = 25, S.D. = 8). No participant took more than 5 minutes to complete the experiment, and each participant was paid ¢5. The payment amount is considered standard for studies of this length on MTurk [<xref ref-type="bibr" rid="B29-sustainability-05-00357">29</xref>,<xref ref-type="bibr" rid="B30-sustainability-05-00357">30</xref>]. </p>
      </sec>
      <sec sec-type="subjects">
        <title>2.2. Participants</title>
        <p>Two problems, P1 and P2, each involving a choice between two options, were presented in a within-subjects design to participants [<xref ref-type="bibr" rid="B33-sustainability-05-00357">33</xref>]. In the online experiment, the order of presentation of the two options (left or right) was randomized within each problem, and the two options that appeared together in a problem were also randomized across the two problems. Both options in a problem involved an increase of a carbon-price from the “From” price this month to the “To” price next month and were designed such that a smaller carbon-price increase with a smaller base tax was tied to either greater or less CO<sub>2</sub> emissions reduction. For example, depending upon the random assignment of options across the two problems, if the option with a smaller carbon-price increase reduced greater CO<sub>2</sub> emissions in P1, then the option with the smaller price increase reduced less CO<sub>2</sub> emissions in P2.</p>
        <p><xref ref-type="fig" rid="sustainability-05-00357-f001">Figure 1</xref> shows the problems given to participants. Given a budget constraint of $100 per month for tax payment, P1’s option 1 reduces CO<sub>2</sub> emissions by (1/18 – 1/24)<italic> × </italic>$100 = 1.39 tons, with a price increase of $6/ton, and P1’s option 2 by (1/13 – 1/16)<italic> × </italic>$100 = 1.44 tons, with a price increase of $3/ton. Therefore, P1’s option 1 is a greater carbon-price increase that results in less CO<sub>2</sub> emissions reduction (costly eco-adverse), and P1’s option 2 is a low carbon-price increase that results in greater CO<sub>2</sub> emissions reduction (cheap eco-friendly). In contrast, P2’s option 1 reduces CO<sub>2</sub> emissions by (1/19 – 1/25)<italic> × </italic>$100 = 1.26 tons, with a price increase of $6/ton, and P2’s option 2 by (1/15 – 1/18)<italic>× </italic>$100 = 1.11 tons, with a price increase of $3/ton. Therefore, P2’s option 1 involves a high carbon-price increase that results in greater CO<sub>2</sub> emissions reduction (costly eco-friendly), and P2’s option 2 involves a low carbon-price increase that results in less CO<sub>2</sub> emissions reduction (cheap eco-adverse). Moreover, the ranges and values of carbon-prices ($/ton) given as part of the two options in each of the two problems is representative of the actual anticipated eco-taxes in the real world [<xref ref-type="bibr" rid="B26-sustainability-05-00357">26</xref>,<xref ref-type="bibr" rid="B27-sustainability-05-00357">27</xref>].</p>
        <fig id="sustainability-05-00357-f001" position="float">
          <label>Figure 1</label>
          <caption>
            <p>The two problems, P1 and P2, given to participants in the experiment. Each problem involved two options, option 1 and 2, and two questions, question 1 and 2. The order of the presentation of the two options (left or right) was randomized within each problem, and the two options that appeared together in a problem were also randomized across the two problems. Question 1 asked people their preference for one of the two options. Question 2 gave people a tax budget of $100 per month and asked them to judge which option reduced most CO<sub>2 </sub>emissions in the atmosphere. The order of presentation of questions in each problem was first question 1 and then followed by question 2. The text in italics was not provided to participants and has been solely placed to aid in understanding of the material.</p>
          </caption>
          <graphic xmlns:xlink="http://www.w3.org/1999/xlink" xlink:href="sustainability-05-00357-g001.tif"/>
        </fig>
        <p>For each problem, participants were asked two questions. The first question (Q1, preference question) asked participants to choose one of the two options that they preferred. The second question (Q2, reduction-judgment question) gave participants a fixed personal tax-payment budget (=$100 per month) and asked them to choose the option that they thought would reduce CO<sub>2</sub> emissions the most. In Q1, we expected participants to prefer the cheap eco-friendly and cheap eco-adverse options, while we expected participants to simultaneously judge the costly eco-friendly and costly eco-adverse options as reducing CO<sub>2</sub> emissions the most for Q2.</p>
      </sec>
      <sec>
        <title>2.3. Procedure</title>
        <p>The problems were administered through a website online, with participants answering both questions in both problems. Only one problem was presented at a time. MTurk was used to recruit and compensate participants. Participants read an advertisement about an eco-tax study and were asked to click a link to participate. </p>
      </sec>
    </sec>
    <sec sec-type="results">
      <title>3. Results</title>
      <p>We compared the proportions of cheap and costly choices and the proportions of eco-friendly and eco-adverse choices in the preference question (Q1) aggregated across the two problems (see <xref ref-type="table" rid="sustainability-05-00357-t001">Table 1</xref>a). The proportion of cheap choices (70%) was greater than costly choices (30%) (χ2(1) = 108.824, <italic>p </italic>&lt; 0.001, <italic>r </italic>= 0.41), but there was no difference between the proportions of eco-friendly choices (48%) and eco-adverse choices (52%) (χ2(1) = 1.552, <italic>ns</italic>, <italic>r </italic>= 0.05), showing participants’ preferences for smaller tax increases to be irrespective of whether the increase reduced greater or lesser CO<sub>2</sub> emissions. </p>
      <p>When comparing individual preferences in <xref ref-type="table" rid="sustainability-05-00357-t001">Table 1</xref>b, the proportions of cheap eco-friendly choices (68%) and cheap eco-adverse choices (73%) were greater than the proportions of costly eco-adverse choices (32%) and costly eco-friendly choices (27%), respectively (cheap eco-friendly &gt; costly eco-adverse: χ2(1) = 42.194, <italic>p </italic>&lt; 0.001, <italic>r </italic>= 0.36; cheap eco-adverse &gt; costly eco-friendly: χ2(1) = 68.182, <italic>p </italic>&lt; 0.001, <italic>r </italic>= 0.46). Furthermore, the proportions of cheap eco-friendly choices (68%) and cheap eco-adverse choices (73%) and proportions of costly eco-friendly choices (27%) and costly eco-adverse choices (32%) were not significantly different (χ2(1) = 0.929, <italic>ns</italic>, <italic>r </italic>= 0.05). Consistent with the proportional-thinking heuristic, these results suggest that participants preferred the cheap options, irrespective of the actual reductions in CO<sub>2</sub> emissions.</p>
      <p>We performed similar comparisons between choices, but now for the reduction-judgment question (Q2). For the reduction-judgments in <xref ref-type="table" rid="sustainability-05-00357-t001">Table 1</xref>c, the proportion of costly choices (67%) was greater than the proportion of cheap choices (33%) (χ2(1) = 73.333, <italic>p </italic>&lt; 0.001, <italic>r </italic>= 0-.33), but there was no difference between proportions of eco-friendly choices (52%) and eco-adverse choices (48%) (χ2(1) = 0.873, <italic>ns</italic>, <italic>r </italic>= 0.04), showing participants implicitly assumed that larger tax increases would reduce CO<sub>2</sub> emissions the most, irrespective of whether or not they actually reduced CO<sub>2</sub> emissions. Upon comparing individual judgments for the reduction-judgment question in <xref ref-type="table" rid="sustainability-05-00357-t001">Table 1</xref>d, the proportions of costly eco-adverse choices (65%) and costly eco-friendly choices (68%) were greater than the proportions of cheap eco-friendly choices (35%) and cheap eco-adverse choices (32%), (costly eco-adverse &gt; cheap eco-friendly: χ2(1) = 29.103, <italic>p </italic>&lt; 0.001, <italic>r </italic>= 0.30; costly eco-friendly &gt; cheap eco-adverse: χ2(1) = 45.103, <italic>p </italic>&lt; 0.001, <italic>r </italic>= 0.37). Moreover, the proportions of costly eco-friendly and costly eco-adverse choices and proportions of cheap eco-friendly and cheap eco-adverse choices were not significantly different (χ2 (1) = 0.491, <italic>ns</italic>, <italic>r</italic> = 0.04). Consistent with proportional thinking, these results suggest that participants judged the costly options to reduce CO<sub>2</sub> emissions the most, irrespective of the actual reductions.</p>
    <table-wrap-group id="sustainability-05-00357-t001" position="float">   
          <label>Table 1</label>
          <caption>
            <p>(<bold>a</bold>) Proportion of choices across the two problems for preferences, (<bold>b</bold>) Proportion of choices for preferences.(<bold>c</bold>) Proportion of choices across the two problems for reduction-judgments. (<bold>d</bold>) Proportion of choices for reduction-judgments.</p>
          </caption>
	 <table-wrap>
        <label>(a)</label>
        <table>
          <thead>
            <tr>
              <th align="center" valign="middle"> </th>
              <th align="center" valign="middle">
                <italic>Costly</italic>
              </th>
              <th align="center" valign="middle">
                <italic>Cheap</italic>
              </th>
            </tr>
          </thead>
          <tbody>
            <tr>
              <td align="center" valign="middle">Preference (Q1)</td>
              <td align="center" valign="middle">30% (n = 98/330 <sup>1</sup>)</td>
              <td align="center" valign="middle">70% (n = 232/330)</td>
            </tr>
            <tr>
              <td align="center" valign="middle"> </td>
              <td align="center" valign="middle">
                <bold>
                  <italic>Eco-friendly</italic>
                </bold>
              </td>
              <td align="center" valign="middle">
                <bold>
                  <italic>Eco-adverse</italic>
                </bold>
              </td>
            </tr>
            <tr>
              <td align="center" valign="middle">Preference (Q1)</td>
              <td align="center" valign="middle">48% (n = 157/330)</td>
              <td align="center" valign="middle">52% (n = 173/330)</td>
            </tr>
          </tbody>
		</table>
    <table-wrap-foot>
      <fn>
        <p><italic>Note.</italic> <sup>1 </sup>This number is double the total number of participants in the experiment, because it is aggregated across both problems that were presented within-subjects and that contained n = 165 participants, each.</p>
      </fn>
    </table-wrap-foot>		
	  </table-wrap>
  <table-wrap>
        <label>(b)</label>
        <table>
<tbody>
            <tr>
              <td style="border-bottom:solid thin" align="center" valign="middle">
                <italic>Questions</italic>
              </td>
              <td style="border-bottom:solid thin" align="center" valign="middle"><bold><italic>Costly Eco-adverse </italic></bold>(6 unit increase; 1.39 tons CO<sub>2</sub> emissions reduction)</td>
              <td style="border-bottom:solid thin" align="center" valign="middle"><bold><italic>Cheap Eco-friendly </italic></bold>(3 unit increase; 1.44 tons CO<sub>2</sub> emissions reduction)</td>
              <td style="border-bottom:solid thin" align="center" valign="middle"><bold><italic>Costly Eco-friendly </italic></bold>(6 unit increase; 1.26 tons CO<sub>2</sub> emissions reduction)</td>
              <td style="border-bottom:solid thin" align="center" valign="middle"><bold><italic>Cheap Eco-adverse </italic></bold>(3 unit increase; 1.11 tons CO<sub>2</sub> emissions reduction)</td>
            </tr>
            <tr>
              <td align="center" valign="middle">Preference (Q1)</td>
              <td align="center" valign="middle">32% (n = 53/165 <sup>1</sup>)</td>
              <td align="center" valign="middle">68% (n = 112/165)</td>
              <td align="center" valign="middle">27% (n = 45/165)</td>
              <td align="center" valign="middle">73% (n = 120/165)</td>
            </tr>
          </tbody>
        </table>
    <table-wrap-foot>
      <fn>
        <p><italic>Note</italic>. <sup>1 </sup>This number represents the total number of participants in the experiment.</p>
      </fn>
    </table-wrap-foot>	  
	  </table-wrap>
      <table-wrap>
        <label>(c)</label>
        <table>
		 <thead>
            <tr>
              <th align="center" valign="middle"> </th>
              <th align="center" valign="middle">
                <bold>
                  <italic>Costly</italic>
                </bold>
              </th>
              <th align="center" valign="middle">
                <bold>
                  <italic>Cheap</italic>
                </bold>
              </th>
            </tr>
		</thead>
          <tbody>
            <tr>
              <td align="center" valign="middle">Reduction-judgment (Q2)</td>
              <td align="center" valign="middle">67% (n = 220/330 <sup>1</sup>)</td>
              <td align="center" valign="middle">33% (n = 110/330)</td>
            </tr>
            <tr>
              <td align="center" valign="middle"> </td>
              <td align="center" valign="middle">
                <bold>
                  <italic>Eco-friendly</italic>
                </bold>
              </td>
              <td align="center" valign="middle">
                <bold>
                  <italic>Eco-adverse</italic>
                </bold>
              </td>
            </tr>
            <tr>
              <td align="center" valign="middle">Reduction-judgment (Q2)</td>
              <td align="center" valign="middle">52% (n = 171/330)</td>
              <td align="center" valign="middle">48% (n = 159/330)</td>
            </tr>
          </tbody>
        </table>
    <table-wrap-foot>
      <fn>
        <p><italic>Note.</italic> <sup>1 </sup>This number is double the total number of participants in the experiment, because it is aggregated across both problems that were presented within-subjects and that contained n = 165 participants each.</p>
      </fn>
    </table-wrap-foot>	  
	  </table-wrap>
      <table-wrap>
        <label>(d)</label>
        <table>
<tbody>
            <tr>
              <td style="border-bottom:solid thin" align="center" valign="middle">
                <italic>Questions</italic>
              </td>
              <td style="border-bottom:solid thin" align="center" valign="middle"><bold><italic>Costly Eco-adverse </italic></bold>(6 unit increase; 1.39 tons CO<sub>2</sub> emissions reduction)</td>
              <td style="border-bottom:solid thin" align="center" valign="middle"><bold><italic>Cheap Eco-friendly </italic></bold>(3 unit increase; 1.44 tons CO<sub>2</sub> emissions reduction)</td>
              <td style="border-bottom:solid thin" align="center" valign="middle"><bold><italic>Costly Eco-friendly </italic></bold>(6 unit increase; 1.26 tons CO<sub>2</sub> emissions reduction)</td>
              <td style="border-bottom:solid thin" align="center" valign="middle"><bold><italic>Cheap Eco-adverse </italic></bold>(3 unit increase; 1.11 tons CO<sub>2</sub> emissions reduction)</td>
            </tr>
            <tr>
              <td align="center" valign="middle">Reduction-judgment (Q2)</td>
              <td align="center" valign="middle">65% (n = 107/165 <sup>1</sup>)</td>
              <td align="center" valign="middle">35% (n = 58/165)</td>
              <td align="center" valign="middle">68% (n = 113/165)</td>
              <td align="center" valign="middle">32% (n = 52/165)</td>
            </tr>
          </tbody>
        </table>
    <table-wrap-foot>
      <fn>
        <p><italic>Note</italic>. <sup>1 </sup>This number represents the total number of participants in the experiment.</p>
      </fn>
    </table-wrap-foot>	  
	  </table-wrap>
	  </table-wrap-group>
      <sec>
        <title>3.1. Consistency Between Preferences And Reduction-Judgments</title>
        <p>Next, we determined how people’s reduction-judgments (Q2) matched with their preferences (Q1) within a problem. As shown in <xref ref-type="table" rid="sustainability-05-00357-t002">Table 2</xref>, 44% of participants simultaneously preferred cheap options and judged costly options as reducing CO<sub>2</sub> emissions the most, while only 7% of participants simultaneously preferred costly options and judged cheap options as reducing emissions the most. This pattern of choices for costly and cheap options seems to be consistent with reliance on proportional-thinking heuristic in preferences and judgments about CO<sub>2</sub> emissions reductions, respectively. In addition, the proportion for simultaneous preferences and judgments about CO<sub>2</sub> emissions reductions were comparatively smaller for the Costly-Costly and Cheap-Cheap choice combinations (see <xref ref-type="table" rid="sustainability-05-00357-t002">Table 2</xref>). Moreover, preferences for eco-friendly or eco-adverse options and simultaneous reduction-judgments for eco-friendly or eco-adverse options were about the same in all choice combinations. These results show that people decided primarily based upon options being costly or cheap, irrespective of whether their choices reduced greater or less CO<sub>2</sub> emissions.</p>
      </sec>
      <sec>
        <title>3.2. Consistency Of Preferences And Reduction-Judgments Between The Two Problems</title>
        <p>As shown in <xref ref-type="table" rid="sustainability-05-00357-t003">Table 3</xref>, 63% preferred cheap options in both problems, while the proportion of preferences were comparatively smaller for the following combination of options across the two problems: cheap in the first problem and costly in the second problem, costly in the first problem and cheap in the second problem, and costly in both problems. Similarly, in <xref ref-type="table" rid="sustainability-05-00357-t004">Table 4</xref>, 55% judged costly options in both problems to reduce CO<sub>2</sub> emissions the most, while the proportion of reduction-judgments were comparatively smaller for the following combination of options across the two problems: costly in the first problem and cheap in the second problem, cheap in the first problem and costly in the second problem, and cheap in both problems. </p>
        <table-wrap id="sustainability-05-00357-t002" position="float">
          <object-id pub-id-type="pii">sustainability-05-00357-t002_Table 2</object-id>
          <label>Table 2</label>
          <caption>
            <p>Participants’ proportion of reduction-judgments with respect to their proportion of preferences within problems.</p>
          </caption>
          <table>
            <thead>
              <tr>
                <th align="center" valign="middle"> </th>
                <th colspan="4" align="center" valign="middle" style="border-bottom:solid thin">Preference (Q1)</th>
              </tr>
              <tr>
                <th align="center" valign="middle">Reduction-judgment (Q2)</th>
                <th align="center" valign="middle"><italic>Costly</italic> (n = 98)</th>
                <th align="center" valign="middle"><italic>Cheap</italic> (n = 232)</th>
                <th align="center" valign="middle"><italic>Eco-friendly</italic> (n = 157)</th>
                <th align="center" valign="middle"><italic>Eco-adverse</italic> (n = 173)</th>
              </tr>
            </thead>
            <tbody>
              <tr>
                <td align="center" valign="middle"><bold><italic>Costly</italic></bold> (n = 220)</td>
                <td align="center" valign="middle">23% (n = 76/330 <sup>1</sup>)</td>
                <td align="center" valign="middle">44% (n = 144/330)</td>
                <td align="center" valign="middle"> </td>
                <td align="center" valign="middle"> </td>
              </tr>
              <tr>
                <td align="center" valign="middle"><bold><italic>Cheap</italic></bold> (n = 110)</td>
                <td align="center" valign="middle">7% (n = 22/330)</td>
                <td align="center" valign="middle">26% (n = 88/330)</td>
                <td align="center" valign="middle"> </td>
                <td align="center" valign="middle"> </td>
              </tr>
              <tr>
                <td align="center" valign="middle"><bold><italic>Eco-friendly</italic></bold> (n = 171)</td>
                <td align="center" valign="middle"> </td>
                <td align="center" valign="middle"> </td>
                <td align="center" valign="middle">25% (n = 81/330)</td>
                <td align="center" valign="middle">27% (n = 90/330)</td>
              </tr>
              <tr>
                <td align="center" valign="middle"><bold><italic>Eco-adverse</italic></bold> (n = 159)</td>
                <td align="center" valign="middle"> </td>
                <td align="center" valign="middle"> </td>
                <td align="center" valign="middle">23% (n = 76/330)</td>
                <td align="center" valign="middle">25% (n = 83/330)</td>
              </tr>
            </tbody>
          </table>
    <table-wrap-foot>
      <fn>
        <p><italic>Note</italic>. <sup>1 </sup>This number is double the total number of participants in the experiment, because it is aggregated across both problems that were presented within-subjects and that contained n = 165 participants each.</p>
      </fn>
    </table-wrap-foot>		
		</table-wrap>
        <p>These results show that participants were pretty consistent about their preferences for cheap options and reduction-judgments for costly options across the two problems, irrespective of whether their preferences and reduction-judgments reduced greater or less emissions.</p>
        <table-wrap id="sustainability-05-00357-t003" position="float">
          <object-id pub-id-type="pii">sustainability-05-00357-t003_Table 3</object-id>
          <label>Table 3</label>
          <caption>
            <p>Participants’ proportion of preferences across the first and second presented problems.</p>
          </caption>
          <table>
            <thead>
              <tr>
                <th align="center" valign="middle"> </th>
                <th colspan="2" align="center" valign="middle" style="border-bottom:solid thin">First Presented Problem’s Preference (Q1)</th>
              </tr>
              <tr>
                <th align="center" valign="middle">Second Presented Problem’s Preference (Q1)</th>
                <th align="center" valign="middle"><italic>Costly</italic> (n = 48)</th>
                <th align="center" valign="middle"><italic>Cheap</italic> (n = 117)</th>
              </tr>
            </thead>
            <tbody>
              <tr>
                <td align="center" valign="middle"><bold><italic>Costly</italic></bold> (n = 50)</td>
                <td align="center" valign="middle">22% (n = 36/165 <sup>1</sup>)</td>
                <td align="center" valign="middle">8% (n = 14/165)</td>
              </tr>
              <tr>
                <td align="center" valign="middle"><bold><italic>Cheap</italic></bold> (n = 115)</td>
                <td align="center" valign="middle">7% (n = 12/165)</td>
                <td align="center" valign="middle">63% (n = 103/165)</td>
              </tr>
            </tbody>
          </table>
    <table-wrap-foot>
      <fn>
        <p><italic>Note</italic>. <sup>1 </sup>This number represents the total number of participants in the experiment.</p>
      </fn>
    </table-wrap-foot>		
		</table-wrap>
        <table-wrap id="sustainability-05-00357-t004" position="float">
          <object-id pub-id-type="pii">sustainability-05-00357-t004_Table 4</object-id>
          <label>Table 4</label>
          <caption>
            <p>Participants’ proportion of reduction-judgments in the first and second presented problems.</p>
          </caption>
          <table>
            <thead>
              <tr>
                <th align="center" valign="middle"> </th>
                <th colspan="2" align="center" valign="middle" style="border-bottom:solid thin">First Presented Problem’s Reduction-judgment (Q2)</th>
              </tr>
              <tr>
                <th align="center" valign="middle">Second Presented Problem’s Reduction-judgment (Q2)</th>
                <th align="center" valign="middle"><italic>Costly</italic> (n = 112)</th>
                <th align="center" valign="middle"><italic>Cheap</italic> (n = 53)</th>
              </tr>
            </thead>
            <tbody>
              <tr>
                <td align="center" valign="middle"><bold><italic>Costly</italic></bold> (n = 108)</td>
                <td align="center" valign="middle">55% (n = 91/165 <sup>1</sup>)</td>
                <td align="center" valign="middle">10% (n = 17/165)</td>
              </tr>
              <tr>
                <td align="center" valign="middle"><bold><italic>Cheap</italic></bold> (n = 57)</td>
                <td align="center" valign="middle">13% (n = 21/165)</td>
                <td align="center" valign="middle">22% (n = 36/165)</td>
              </tr>
            </tbody>
          </table>
    <table-wrap-foot>
      <fn>
        <p><italic>Note</italic>. <sup>1 </sup>This number represents the total number of participants in the experiment.</p>
      </fn>
    </table-wrap-foot>
	   </table-wrap>
      </sec>
      <sec>
        <title>3.3. Are Preferences Based on Options being Eco-Friendly or Cheap?</title>
        <p>In our results, a large majority (68%) of participants preferred the cheap eco-friendly option (see <xref ref-type="table" rid="sustainability-05-00357-t001">Table 1</xref>). A possible explanation for this 68% (=112/165) preference is that it is based on the option being eco-friendly rather than it being cheap. The cheap eco-friendly option boasts a small carbon-price increase (=3 units), but also reduces CO<sub>2</sub> emissions most (=1.44 tons) at the same time. However, 60% (=68/112) of those that preferred the cheap eco-friendly option also judged the costly eco-adverse option to save more CO<sub>2</sub> emissions in the same problem. Furthermore, 92% (=103/112) of those that preferred the cheap eco-friendly option also judged the cheap eco-adverse option as reducing CO<sub>2</sub> emissions the most in the next problem. In both judgments, the costly or cheap eco-adverse options do not reduce CO<sub>2</sub> emissions the most, and thus, these options are not eco-friendly. Therefore, a closer inspection of results reveals that the 68% of cheap eco-friendly preferences represented participants that were relying on the proportional-thinking heuristic and driven by selecting a cheap option, rather than participants that acted because the option was eco-friendly.</p>
      </sec>
      <sec>
        <title>3.4. Are Preferences Driven by Accumulated CO<sub>2</sub> Reductions or Choice for the Cheaper Option?</title>
        <p>We believe that people’s preference for cheap options is likely due to their displeasure of incurring a greater loss due to tax payment. But, as we simply asked people which option they <italic>preferred</italic>, one possibility could be that they prefer a smaller increase with a smaller base tax, because the smaller increase causes the most <italic>accumulated</italic> CO<sub>2</sub> reductions over the two months compared to the larger tax increase [<xref ref-type="bibr" rid="B34-sustainability-05-00357">34</xref>]. For example, smaller tax increases like $13/ton to $16/ton and $15/ton to $18/ton, cause greater CO<sub>2 </sub>reductions of 13.9 tons and 12.2 tons, respectively, compared to those for larger tax increases, like $18/ton to $24/ton (=9.7 tons) and $19/ton to $25/ton (=9.3 tons), respectively. In order to test this possibility, we ran an identical study with n = 155 participants [<xref ref-type="bibr" rid="B35-sustainability-05-00357">35</xref>]; however, where we now changed one problem to be a choice between an increase from $19/ton to $25/ton or an increase from $21/ton to $24/ton, the other problem with increases $18/ton to $24/ton and $13/ton and $16/ton was unchanged. The $21/ton to $24/ton increase is a small three units increase, but the accumulated CO<sub>2</sub> reduction in this increase equals 8.9 tons, which is less than that in the $19/ton to $25/ton increase (=9.3 tons). If people decided according to accumulated CO<sub>2</sub> reductions, then fewer people should have chosen the smaller increase; however, results indicated that 63% of participants still chose the smaller tax increase ($21/ton to $24/ton), thereby preferring the cheaper option.</p>
      </sec>
    </sec>
    <sec sec-type="conclusions">
      <title>4. Conclusions</title>
      <p>We find that consistent with the proportional-thinking heuristic, people prefer smaller rather than larger eco-tax increases, while simultaneously judging larger increases as reducing CO<sub>2</sub> emissions more, consistent with the proportional-thinking heuristic. Furthermore, we demonstrated how one could make use of the proportional-thinking heuristic to enable participants to make more eco-friendly choices: when participants are provided with ranges of tax increases, they prefer smaller increases, and their preference can result in greater CO<sub>2</sub> reductions, depending on how information is presented.</p>
      <p>People’s preferences for smaller eco-taxes is likely due to the proportional-thinking heuristic [<xref ref-type="bibr" rid="B19-sustainability-05-00357">19</xref>]: people are likely to perceive that a larger increase with a larger base tax (e.g., $18/ton to $24/ton) will reduce their current wealth more and bring them greater displeasure [<xref ref-type="bibr" rid="B20-sustainability-05-00357">20</xref>,<xref ref-type="bibr" rid="B21-sustainability-05-00357">21</xref>,<xref ref-type="bibr" rid="B22-sustainability-05-00357">22</xref>]. Furthermore, people’s implicit reasoning of a proportional relationship between increases in eco-taxes and the corresponding increases in CO<sub>2</sub> emissions reductions is also likely driven by the proportional-thinking heuristic. People are more likely to associate a larger eco-tax increase with a larger base tax as resulting in <italic>proportionally</italic> greater emissions reduction compared to a smaller increase with a smaller base tax. This reasoning is more so because we specifically asked people to choose the option with most CO<sub>2</sub> reduction next month <italic>compared to</italic> the reduction this month in the reduction-judgment question. </p>
      <p>Therefore, people’s reliance on the proportional-thinking heuristic can be used to enable more eco-friendly choices, even while people believe that they are saving money by preferring the smallest eco-tax increase. This manipulation does not require any change in people’s psychological processes, but only a change in the way information is presented for decision making. This kind of manipulation is also effective in enabling improved judgments in other decision problems [<xref ref-type="bibr" rid="B2-sustainability-05-00357">2</xref>,<xref ref-type="bibr" rid="B3-sustainability-05-00357">3</xref>,<xref ref-type="bibr" rid="B4-sustainability-05-00357">4</xref>]. For example, [<xref ref-type="bibr" rid="B2-sustainability-05-00357">2</xref>] have shown that changing probability numbers from fractions (e.g., 29/36) to decimals (e.g., 0.8) caused people to make consistent choices for risky options in two lotteries that had the same expected value, but where the risky option had a small probability of a large outcome in one lottery and a large probability of a small outcome in the other. Similarly, changing the presentation of eco-taxes such that a smaller increase also reduces CO<sub>2</sub> emissions more will promote more eco-friendly decisions.</p>
      <p>According to [<xref ref-type="bibr" rid="B5-sustainability-05-00357">5</xref>], the current prices of gasoline, electricity and fuels in most parts of the world include none of the costs associated with catastrophic climate change. This omission suppresses incentives to develop and deploy CO<sub>2</sub> reduction measures that are energy efficient (e.g., high-mileage cars, high-efficiency heaters and air conditioners in homes). Conversely, taxing people’s consumption of fuels according to their emissions will infuse these incentives at every link in the chain of decision and action—from individuals’ choices and uses of vehicles, appliances, and housing. The main implication of our manipulation benefits eco-tax policies, provided policymakers present eco-friendly options as the ones that also offer smaller increases. By doing so, we expect that society’s adoption of eco-friendly taxes will be more readily accepted, because people would not need to change their current behavior. </p>
      <p>Although eco-tax is specifically used in this study, the applicability of our manipulation is broad and widespread, given people’s reliance on heuristics. A number of other important real-world problems (e.g., cigarette smoking, pollution in rivers, air pollution and overfishing) could be improved by presenting information in a similar form. For example, the government could consider increasing the tax per packet of cigarette to reduce smoking. One of the tax options could be a tax increase of a dollar, from $1 per cigarette packet this month to $2 per packet next month. Another option could be a tax increase of $2, from $3 per packet this month to $5 per packet next month. If smokers spend on average a $100 tax buying cigarettes each month, then the first option will reduce their consumption by 50 cigarette packets, while the latter option only by 13 packets. On account of the proportional-thinking heuristic, we expect smokers to also readily prefer the option with a $1 tax increase compared to the $2 tax increase. The end result would be a larger reduction in packets smoked—a desirable outcome. In the real world, it might be very difficult to change existent human behavior and reliance on heuristics [<xref ref-type="bibr" rid="B3-sustainability-05-00357">3</xref>]. We suggest an alternative: to change people’s decision environment such that existent behavior and reliance on heuristics enables people to improve their decision choices. </p>
    </sec>
  </body>
  <back>
    <ack>
      <title>Acknowledgments</title>
      <p>This research was partially supported by a professional development allowance to Varun Dutt from Indian Institute of Technology, Mandi, India; and, by the National Science Foundation’s Human and Social Dynamics: Decision, Risk, and Uncertainty, award number: 0624228, to Cleotilde Gonzalez. The authors are thankful to Hau-yu Wong, Sarah Levens and Michael Yu, Dynamic Decision Making Laboratory, Carnegie Mellon University, for providing comments on an earlier version of the manuscript. </p>
    </ack>
    <ref-list>
      <title>References and Notes</title>
      <ref id="B1-sustainability-05-00357">
        <label>1.</label>
        <citation citation-type="book">
          <person-group person-group-type="author">
            <name>
              <surname>Gilovich</surname>
              <given-names>T.</given-names>
            </name>
            <name>
              <surname>Griffin</surname>
              <given-names>D.</given-names>
            </name>
            <name>
              <surname>Kahneman</surname>
              <given-names>D.</given-names>
            </name>
          </person-group>
          <source>Heuristics and biases: The psychology of intuitive judgment</source>
          <edition>1st</edition>
          <publisher-name>Cambridge University Press</publisher-name>
          <publisher-loc>New York, USA</publisher-loc>
          <year>2002</year>
        </citation>
      </ref>
      <ref id="B2-sustainability-05-00357">
        <label>2.</label>
        <citation citation-type="journal">
          <person-group person-group-type="author">
            <name>
              <surname>Johnson</surname>
              <given-names>E.J.</given-names>
            </name>
            <name>
              <surname>Payne</surname>
              <given-names>J.W.</given-names>
            </name>
            <name>
              <surname>Bettman</surname>
              <given-names>J.R.</given-names>
            </name>
          </person-group>
          <article-title>Information displays and preference reversals</article-title>
          <source>Organ. Behav. Hum. Dec.</source>
          <year>1988</year>
          <volume>42</volume>
          <fpage>21</fpage>
        </citation>
      </ref>
      <ref id="B3-sustainability-05-00357">
        <label>3.</label>
        <citation citation-type="journal">
          <person-group person-group-type="author">
            <name>
              <surname>Klayman</surname>
              <given-names>J.</given-names>
            </name>
            <name>
              <surname>Brown</surname>
              <given-names>K.</given-names>
            </name>
          </person-group>
          <article-title>Debias the environment instead of the judge: An alternative approach to reducing error in diagnostic (and other) judgment</article-title>
          <source>Cognition</source>
          <year>1993</year>
          <volume>49</volume>
          <fpage>97</fpage>
          <lpage>122</lpage>
          <pub-id pub-id-type="doi">10.1016/0010-0277(93)90037-V</pub-id>
        </citation>
      </ref>
      <ref id="B4-sustainability-05-00357">
        <label>4.</label>
        <citation citation-type="journal">
          <person-group person-group-type="author">
            <name>
              <surname>Payne</surname>
              <given-names>J.W.</given-names>
            </name>
            <name>
              <surname>Bettman</surname>
              <given-names>J.R.</given-names>
            </name>
            <name>
              <surname>Schkade</surname>
              <given-names>D.A.</given-names>
            </name>
          </person-group>
          <article-title>Measuring constructed preferences: Towards a building code</article-title>
          <source>J. Risk Uncertainty</source>
          <year>1999</year>
          <volume>19</volume>
          <fpage>243</fpage>
          <lpage>270</lpage>
          <pub-id pub-id-type="doi">10.1023/A:1007843931054</pub-id>
        </citation>
      </ref>
      <ref id="B5-sustainability-05-00357">
        <label>5.</label>
        <citation citation-type="web">
          <article-title>Carbon Tax Center (CTC)</article-title>
          
          <comment>Available online:<ext-link xmlns:xlink="http://www.w3.org/1999/xlink" xlink:href="http://www.carbontax.org/introduction/#what" ext-link-type="uri">http://www.carbontax.org/introduction/#what</ext-link></comment><access-date>(accessed on 3 October 2012)</access-date>
        </citation>
      </ref>
      <ref id="B6-sustainability-05-00357">
        <label>6.</label>
        <citation citation-type="book">
          <person-group person-group-type="author">
            <name>
              <surname>Dawson</surname>
              <given-names>B.</given-names>
            </name>
            <name>
              <surname>Spannagle</surname>
              <given-names>M.</given-names>
            </name>
          </person-group>
          <source>The Complete Guide to Climate Change</source>
          <edition>1st</edition>
          <publisher-name>Routledge</publisher-name>
          <publisher-loc>New York, NY, USA</publisher-loc>
          <year>2009</year>
        </citation>
      </ref>
      <ref id="B7-sustainability-05-00357">
        <label>7.</label>
        <citation citation-type="book">
          <person-group person-group-type="author">
            <name>
              <surname>Nordhaus</surname>
              <given-names>W.</given-names>
            </name>
          </person-group>
          <source>A question of balance</source>
          <edition>1st</edition>
          <publisher-name>Yale University Press</publisher-name>
          <publisher-loc>New Haven, USA</publisher-loc>
          <year>2008</year>
        </citation>
      </ref>
      <ref id="B8-sustainability-05-00357">
        <label>8.</label>
        <citation citation-type="web">
          <article-title>Stern Review</article-title>
          
          <comment>Available online:<ext-link xmlns:xlink="http://www.w3.org/1999/xlink" xlink:href="http://www.hm-treasury.gov.uk/sternreview_index.htm" ext-link-type="uri">http://www.hm-treasury.gov.uk/sternreview_index.htm</ext-link></comment><access-date>(accessed on 3 October 2012)</access-date>
        </citation>
      </ref>
      <ref id="B9-sustainability-05-00357">
        <label>9.</label>
        <citation citation-type="journal">
          <person-group person-group-type="author">
            <name>
              <surname>Sweeney</surname>
              <given-names>L.B.</given-names>
            </name>
            <name>
              <surname>Sterman</surname>
              <given-names>J.D.</given-names>
            </name>
          </person-group>
          <article-title>Bathtub dynamics: Initial results of a systems thinking inventory</article-title>
          <source>Syst. Dynam. Rev.</source>
          <year>2000</year>
          <volume>4</volume>
          <fpage>249</fpage>
          <lpage>286</lpage>
        </citation>
      </ref>
      <ref id="B10-sustainability-05-00357">
        <label>10.</label>
        <citation citation-type="journal">
          <person-group person-group-type="author">
            <name>
              <surname>Cronin</surname>
              <given-names>M.</given-names>
            </name>
            <name>
              <surname>Gonzalez</surname>
              <given-names>C.</given-names>
            </name>
          </person-group>
          <article-title>Understanding the building blocks of system dynamics</article-title>
          <source>Syst. Dynam. Rev.</source>
          <year>2007</year>
          <volume>23</volume>
          <fpage>1</fpage>
          <lpage>17</lpage>
          <pub-id pub-id-type="doi">10.1002/sdr.356</pub-id>
        </citation>
      </ref>
      <ref id="B11-sustainability-05-00357">
        <label>11.</label>
        <citation citation-type="journal">
          <person-group person-group-type="author">
            <name>
              <surname>Cronin</surname>
              <given-names>M.</given-names>
            </name>
            <name>
              <surname>Gonzalez</surname>
              <given-names>C.</given-names>
            </name>
            <name>
              <surname>Sterman</surname>
              <given-names>J.D.</given-names>
            </name>
          </person-group>
          <article-title>Why don't well-educated adults understand accumulation? A challenge to researchers, educators and citizens</article-title>
          <source>Organ. Behav. Hum. Dec.</source>
          <year>2009</year>
          <volume>108</volume>
          <fpage>116</fpage>
          <lpage>130</lpage>
          <pub-id pub-id-type="doi">10.1016/j.obhdp.2008.03.003</pub-id>
        </citation>
      </ref>
      <ref id="B12-sustainability-05-00357">
        <label>12.</label>
        <citation citation-type="book">
          <person-group person-group-type="author">
            <name>
              <surname>Dörner</surname>
              <given-names>D.</given-names>
            </name>
          </person-group>
          <source>The Logic of Failure: Recognizing and Avoiding Error in Complex Situations</source>
          <edition>1st</edition>
          <publisher-name>Basic Books</publisher-name>
          <publisher-loc>Cambridge, USA</publisher-loc>
          <year>1996</year>
        </citation>
      </ref>
      <ref id="B13-sustainability-05-00357">
        <label>13.</label>
        <citation citation-type="journal">
          <person-group person-group-type="author">
            <name>
              <surname>Dutt</surname>
              <given-names>V.</given-names>
            </name>
            <name>
              <surname>Gonzalez</surname>
              <given-names>C.</given-names>
            </name>
          </person-group>
          <article-title>Human “mis”-perceptions of climate change</article-title>
          <source>Hum. Fac. Erg. Soc. P.</source>
          <year>2009</year>
          <volume>53</volume>
          <fpage>384</fpage>
          <lpage>388</lpage>
        </citation>
      </ref>
      <ref id="B14-sustainability-05-00357">
        <label>14.</label>
        <citation citation-type="journal">
          <person-group person-group-type="author">
            <name>
              <surname>Dutt</surname>
              <given-names>V.</given-names>
            </name>
            <name>
              <surname>Gonzalez</surname>
              <given-names>C.</given-names>
            </name>
          </person-group>
          <article-title>Human Control of Climate</article-title>
          <source>Climatic Change</source>
          <year>2012</year>
          <volume>3</volume>
          <fpage>497</fpage>
          <lpage>518</lpage>
        </citation>
      </ref>
      <ref id="B15-sustainability-05-00357">
        <label>15.</label>
        <citation citation-type="journal">
          <person-group person-group-type="author">
            <name>
              <surname>Larrick</surname>
              <given-names>R.P.</given-names>
            </name>
            <name>
              <surname>Soll</surname>
              <given-names>J.B.</given-names>
            </name>
          </person-group>
          <article-title>The MPG illusion</article-title>
          <source>Science</source>
          <year>2008</year>
          <volume>320</volume>
          <fpage>1593</fpage>
          <lpage>1594</lpage>
          <pub-id pub-id-type="doi">10.1126/science.1154983</pub-id>
        </citation>
      </ref>
      <ref id="B16-sustainability-05-00357">
        <label>16.</label>
        <citation citation-type="journal">
          <person-group person-group-type="author">
            <name>
              <surname>Van Dooren</surname>
              <given-names>W.</given-names>
            </name>
            <name>
              <surname>de Bock</surname>
              <given-names>D.</given-names>
            </name>
            <name>
              <surname>Janssens</surname>
              <given-names>D.</given-names>
            </name>
            <name>
              <surname>Verschaffel</surname>
              <given-names>L.</given-names>
            </name>
          </person-group>
          <article-title>Pupils' over-reliance on linearity: A scholastic effect?</article-title>
          <source>Brit. J. Ed. Psychol.</source>
          <year>2007</year>
          <volume>77</volume>
          <fpage>307</fpage>
          <lpage>321</lpage>
          <pub-id pub-id-type="doi">10.1348/000709906X115967</pub-id>
        </citation>
      </ref>
      <ref id="B17-sustainability-05-00357">
        <label>17.</label>
        <citation citation-type="journal">
          <person-group person-group-type="author">
            <name>
              <surname>Sterman</surname>
              <given-names>J.D.</given-names>
            </name>
            <name>
              <surname>Sweeney</surname>
              <given-names>L.B.</given-names>
            </name>
          </person-group>
          <article-title>Understanding public complacency about climate change: Adults’ mental models of climate change violate conservation of matter</article-title>
          <source>Climatic Change</source>
          <year>2007</year>
          <volume>80</volume>
          <fpage>213</fpage>
          <lpage>238</lpage>
          <pub-id pub-id-type="doi">10.1007/s10584-006-9107-5</pub-id>
        </citation>
      </ref>
      <ref id="B18-sustainability-05-00357">
        <label>18.</label>
        <citation citation-type="journal">
          <person-group person-group-type="author">
            <name>
              <surname>Sterman</surname>
              <given-names>J.D.</given-names>
            </name>
          </person-group>
          <article-title>Risk Communication on Climate: Mental Models and Mass Balance</article-title>
          <source>Science</source>
          <year>2008</year>
          <volume>322</volume>
          <fpage>532</fpage>
          <lpage>533</lpage>
          <pub-id pub-id-type="doi">10.1126/science.1162574</pub-id>
        </citation>
      </ref>
      <ref id="B19-sustainability-05-00357">
        <label>19.</label>
        <citation citation-type="thesis">
          <person-group person-group-type="author">
            <name>
              <surname>Dutt</surname>
              <given-names>V.</given-names>
            </name>
          </person-group>
          <article-title>Why do we want to defer actions on climate change? A psychological perspective</article-title>
          <source>Ph.D. Dissertation</source>
          <publisher-name>Carnegie Mellon University</publisher-name>
          <publisher-loc>Pittsburgh, PA, USA</publisher-loc>
          <year>2011</year>
        </citation>
      </ref>
      <ref id="B20-sustainability-05-00357">
        <label>20.</label>
        <citation citation-type="journal">
          <person-group person-group-type="author">
            <name>
              <surname>Dodds</surname>
              <given-names>W.B.</given-names>
            </name>
            <name>
              <surname>Monroe</surname>
              <given-names>K.B.</given-names>
            </name>
            <name>
              <surname>Grewal</surname>
              <given-names>D.</given-names>
            </name>
          </person-group>
          <article-title>Effects of Price, Brand and Store Information on Buyer’s Product Evaluations</article-title>
          <source>J. Market. Res.</source>
          <year>1991</year>
          <volume>28</volume>
          <fpage>307</fpage>
          <lpage>319</lpage>
          <pub-id pub-id-type="doi">10.2307/3172866</pub-id>
        </citation>
      </ref>
      <ref id="B21-sustainability-05-00357">
        <label>21.</label>
        <citation citation-type="journal">
          <person-group person-group-type="author">
            <name>
              <surname>Plassman</surname>
              <given-names>H.</given-names>
            </name>
            <name>
              <surname>O'Doherty</surname>
              <given-names>J.</given-names>
            </name>
            <name>
              <surname>Shiv</surname>
              <given-names>B.</given-names>
            </name>
            <name>
              <surname>Rangel</surname>
              <given-names>A.</given-names>
            </name>
          </person-group>
          <article-title>Marketing actions can modulate neural representations of experienced pleasantness</article-title>
          <source>Proc. Natl. Acad. Sci. USA</source>
          <year>2007</year>
          <volume>105</volume>
          <fpage>1050</fpage>
          <lpage>1054</lpage>
        </citation>
      </ref>
      <ref id="B22-sustainability-05-00357">
        <label>22.</label>
        <citation citation-type="journal">
          <person-group person-group-type="author">
            <name>
              <surname>Rao</surname>
              <given-names>A.R.</given-names>
            </name>
            <name>
              <surname>Monroe</surname>
              <given-names>K.B.</given-names>
            </name>
          </person-group>
          <article-title>The Effect of Price, Brand Name and Store Name on Buyers' Perceptions of Product Quality: An Integrative Review</article-title>
          <source>J. Market. Res.</source>
          <year>1989</year>
          <volume>26</volume>
          <fpage>351</fpage>
          <lpage>357</lpage>
          <pub-id pub-id-type="doi">10.2307/3172907</pub-id>
        </citation>
      </ref>
      <ref id="B23-sustainability-05-00357">
        <label>23.</label>
        <citation citation-type="thesis">
          <person-group person-group-type="author">
            <name>
              <surname>Leiserowitz</surname>
              <given-names>A.</given-names>
            </name>
          </person-group>
          <article-title>Global warming in the American mind: The roles of affect, imagery and worldviews in risk perception, policy preferences and behavior</article-title>
          <source>Ph.D. dissertation</source>
          <publisher-name>University of Oregon</publisher-name>
          <publisher-loc>Corvallis, Eugene, OR, USA</publisher-loc>
          <year>2003</year>
        </citation>
      </ref>
      <ref id="B24-sustainability-05-00357">
        <label>24.</label>
        <citation citation-type="web">
          <person-group person-group-type="author">
            <name>
              <surname>Leiserowitz</surname>
              <given-names>A.</given-names>
            </name>
          </person-group>
          <article-title>International Public Opinion,Perception,and Understanding of Global Climate Change</article-title>
          
          <comment>Available online:<ext-link xmlns:xlink="http://www.w3.org/1999/xlink" xlink:href="http://hdr.undp.org/en/reports/global/hdr2007-8/papers/leiserowitz_anthony6.pdf" ext-link-type="uri">http://hdr.undp.org/en/reports/global/hdr2007-8/papers/leiserowitz_anthony6.pdf</ext-link></comment><access-date>(accessed on 3 October 2012)</access-date>
        </citation>
      </ref>
      <ref id="B25-sustainability-05-00357">
        <label>25.</label>
        <citation citation-type="web">
          <person-group person-group-type="author">
            <name>
              <surname>Kennedy</surname>
              <given-names>S.</given-names>
            </name>
          </person-group>
          <article-title>French Endorse Sarkozy’s Scrapping of Carbon Tax: Public Poll</article-title>
          
          <comment>Available online:<ext-link xmlns:xlink="http://www.w3.org/1999/xlink" xlink:href="http://www.tert.am/en/news/2010/03/29/carbontax" ext-link-type="uri">http://www.tert.am/en/news/2010/03/29/carbontax</ext-link></comment><access-date>(accessed on 3 October 2012)</access-date>
        </citation>
      </ref>
      <ref id="B26-sustainability-05-00357">
        <label>26.</label>
        <citation citation-type="gov">
		  <collab>IPCC</collab>
          <source>Climate Change 2007: The Physical Science Basis</source>

          <publisher-name>Intergovernmental Panel on Climate Change</publisher-name>
          <publisher-loc>Geneva, Switzerland</publisher-loc>
          <year>2007</year>
        </citation>
      </ref>
      <ref id="B27-sustainability-05-00357">
        <label>27.</label>
        <citation citation-type="web">
          <person-group person-group-type="author">
            <name>
              <surname>Metcalf</surname>
              <given-names>G.E.</given-names>
            </name>
            <name>
              <surname>Weisbach</surname>
              <given-names>D.A.</given-names>
            </name>
          </person-group>
          <article-title>Design of a Carbon Tax</article-title>
          
          <comment>Available online:<ext-link xmlns:xlink="http://www.w3.org/1999/xlink" xlink:href="http://ssrn.com/abstract=1324854" ext-link-type="uri">http://ssrn.com/abstract=1324854</ext-link></comment><access-date>(accessed on 3 October 2012)</access-date>
        </citation>
      </ref>
      <ref id="B28-sustainability-05-00357">
        <label>28.</label>
        <citation citation-type="web">
          <person-group person-group-type="author">
            <name>
              <surname>Gale</surname>
              <given-names>I.</given-names>
            </name>
          </person-group>
          <article-title>The consumer’s budget constraint</article-title>
          
          <comment>Available online:<ext-link xmlns:xlink="http://www.w3.org/1999/xlink" xlink:href="http://www9.georgetown.edu/faculty/galei/2-Budget%20sets.pdf" ext-link-type="uri">http://www9.georgetown.edu/faculty/galei/2-Budget%20sets.pdf</ext-link></comment><access-date>(accessed on 3 October 2012)</access-date>
        </citation>
      </ref>
      <ref id="B29-sustainability-05-00357">
        <label>29.</label>
        <citation citation-type="web">
          <person-group person-group-type="author">
            <name>
              <surname>Mason</surname>
              <given-names>W.</given-names>
            </name>
            <name>
              <surname>Suri</surname>
              <given-names>S.</given-names>
            </name>
          </person-group>
          <article-title>Conducting Behavioral Research on Amazon's Mechanical Turk</article-title>
          
          <comment>Available online:<ext-link xmlns:xlink="http://www.w3.org/1999/xlink" xlink:href="http://ssrn.com/abstract=1691163" ext-link-type="uri">http://ssrn.com/abstract=1691163</ext-link></comment><access-date>(accessed on 3 October 2012)</access-date>
        </citation>
      </ref>
      <ref id="B30-sustainability-05-00357">
        <label>30.</label>
        <citation citation-type="journal">
          <person-group person-group-type="author">
            <name>
              <surname>Paolacci</surname>
              <given-names>G.</given-names>
            </name>
            <name>
              <surname>Chandler</surname>
              <given-names>J.</given-names>
            </name>
            <name>
              <surname>Ipeirotis</surname>
              <given-names>P.G.</given-names>
            </name>
          </person-group>
          <article-title>Running experiments on Amazon Mechanical Turk</article-title>
          <source>Judgm. Dec. Mak.</source>
          <year>2010</year>
          <volume>5</volume>
          <fpage>411</fpage>
          <lpage>419</lpage>
        </citation>
      </ref>
      <ref id="B31-sustainability-05-00357">
        <label>31.</label>
        <citation citation-type="web">
          <person-group person-group-type="author">
            <name>
              <surname>Seppälä</surname>
              <given-names>J.</given-names>
            </name>
          </person-group>
          <article-title>The Budget Constraint: What the Consumer Can Afford</article-title>
          
          <comment>Available online:<ext-link xmlns:xlink="http://www.w3.org/1999/xlink" xlink:href="http://www.econ.uiuc.edu/~seppala/econ102/lect17.pdf" ext-link-type="uri">http://www.econ.uiuc.edu/~seppala/econ102/lect17.pdf</ext-link></comment><access-date>(accessed on 19 December 2012)</access-date>
        </citation>
      </ref>
      <ref id="B32-sustainability-05-00357">
        <label>32.</label>
        <note><p>It is common to find that a majority of families with monthly wages or income have such budgetary constraints, which limit their spending on products they could purchase [<xref ref-type="bibr" rid="B28-sustainability-05-00357">28</xref>]. Thus, a person is likely to be limited by their monthly income to pay for carbon dioxide emissions. Such budget constraints are a common assumption in economic models for utility maximization, as well as in real life [<xref ref-type="bibr" rid="B31-sustainability-05-00357">31</xref>].</p></note>
      </ref>
      <ref id="B33-sustainability-05-00357">
        <label>33.</label>
        <note><p>The text of these two problems was pretested in an initial pilot study. In the pilot study, 50 participants were presented with the text of the problems and asked to rate whether the text was understandable on a five-point likert scale (non-understandable to completely-understandable). More than 90% of participants of different nationalities felt the problems’ text was completely-understandable.</p></note>
      </ref>
      <ref id="B34-sustainability-05-00357">
        <label>34.</label>
        <note><p>Accumulated CO2 reduction is Budget/Tax rate this month + Budget/Tax rate next month. For example, for a $100 budget, a change from $13/ton to $16/ton leads to 100/13 + 100/16 = 13.9 tons of accumulated CO2 reduction.</p></note>
      </ref>
      <ref id="B35-sustainability-05-00357">
        <label>35.</label>
        <note><p>The procedure and experimental design in this new study were identical to those reported for the original study. In the new study 155 participants were recruited using Amazon’s Mechanical Turk (MTurk). Based on self-reported demographics 55% were males; 50% held graduate degrees and the other 50% held undergraduate and high-school degrees; and 70% had a background in science, technology, engineering, mathematics or medicine (STEM). Ages ranged from 18 to 50 years (M = 19, S.D. = 4). No participant took more than 5 minutes to complete the new study and each participant was paid ¢5.</p></note>
      </ref>
    </ref-list>
  </back>
</article>
