3.1. Building Characteristics
Table 3 shows the building characteristics among the investigated households. Most of the investigated buildings were built in the 90s, accounting for 43% in total, and 29% of the buildings were built after the year of 2000.
Concerning the floor area, 27.4% of the dwelling units are between 60 m
2 and 80 m
2, which is the largest part. Twenty five percent of the dwelling units are between 100 m
2 and 120 m
2. The average floor area is 111.3 m
2. It was about 80 m
2 in the year 2004 [
6], and has increased by about 31 m
2 in four years.
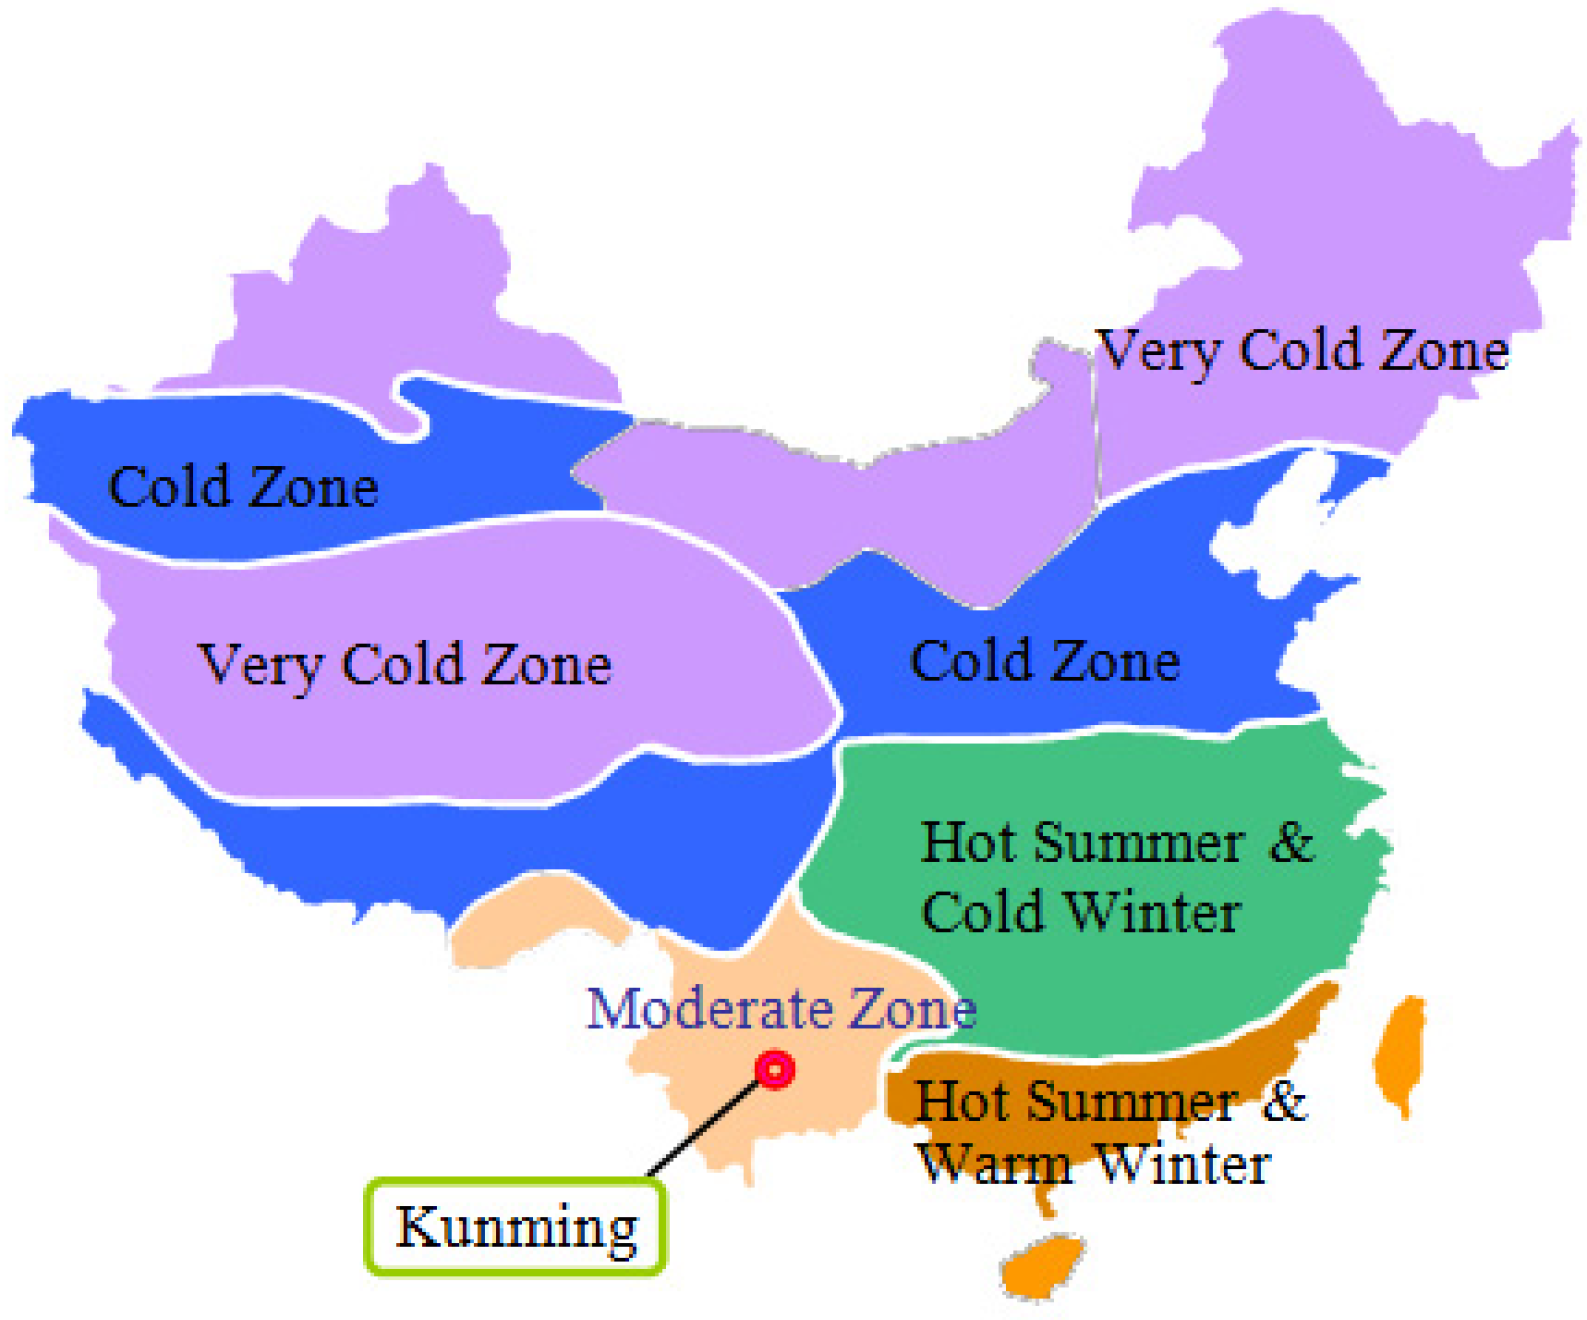
For the building envelop, 29.7% of the investigated buildings use reinforced concrete as building structure, and 52.0% use brick concrete as a building structure. Sixty two percent of the buildings use aluminum as a window frame, and 3% use plastic steel as a window frame. Most of buildings use single glass as window panes. Eighty six percent of the external wall of the buildings is a 240 mm thick brick wall while most households in very cold and cold zones use a 490 mm thick brick wall. This is because Kunming is in a moderate climate zone.
Regarding the sun shading, 64.3% of the investigated households use a curtain as a sun shading measure, and 17.9% use blinds.
Table 3.
Building characteristics.
Table 3.
Building characteristics.
| Item | Categories | Percentage (%) |
|---|
| Construction year | Before 1980 | 7.8 |
| | 80s | 20.7 |
| | 90s | 42.9 |
| | After 2000 | 28.6 |
| Floor area | <60 m2 | 3.6 |
| | 60 – 80 m2 | 27.4 |
| | 80 – 100 m2 | 21.4 |
| | 100 – 120 m2 | 25.0 |
| Structure | >120 m2 | 22.7 |
| Brick concrete | 29.7 |
| | Reinforced | 52.0 |
| | Other | 8.3 |
| Window frame | Aluminum | 62.0 |
| | Plastic steel | 23.0 |
| | Wood | 3.0 |
| | Iron | 12.0 |
| Window pane | Single glass | 75.0 |
| | Double glass | 25.0 |
| Sun shading | Curtain | 64.3 |
| Blind | 17.9 |
| Awning | 9.5 |
| Other | 8.3 |
3.2. Building Appliances
Twelve percent of the investigated households have air conditioning. Fourteen percent of the households have fans. Only 5% of the households have domestic heating appliances. The possession rate of heating and cooling is less because the winter in Kunming is not cold and summer is not hot. Seventy five percent of the households use an individual water heater.
Because the duration of sunshine in Kunming is very long, 55% of the investigated households use solar energy as an energy source of their water heater. Nineteen percent and 26% of the households use gas and electricity as energy source of water heater, respectively.
3.5. Energy Consumption
All kinds of energy sources are converted into caloric value, and the unit caloric values of different energy sources are shown in
Table 4 [
8].
Table 4.
Energy conversion value of energy source.
Table 4.
Energy conversion value of energy source.
| Energy source | Electricity | LPG | City gas |
|---|
| Calorific values of units | 3.6 MJ/kWh | 46.2 MJ/kg | 27.3 MJ/m³ |
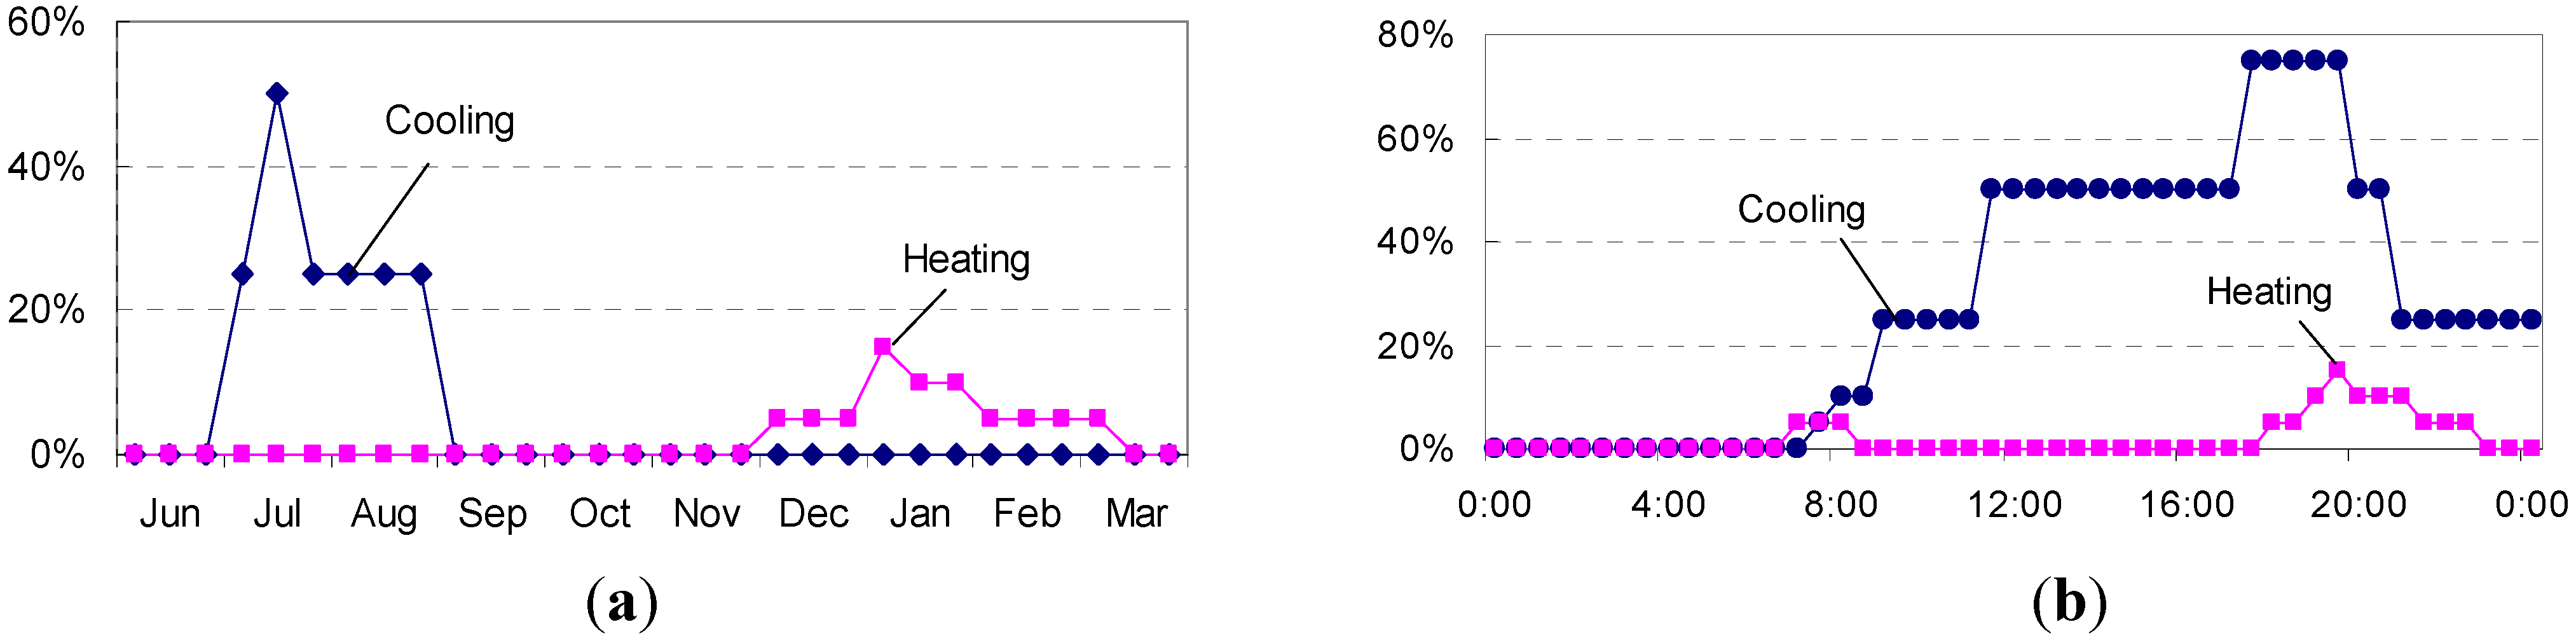
Monthly measurement data of gas & electricity consumption in a year are obtained. Energy consumption of space heating is not included in this study, because very few households use space heating in winter, as shown in
Figure 2.
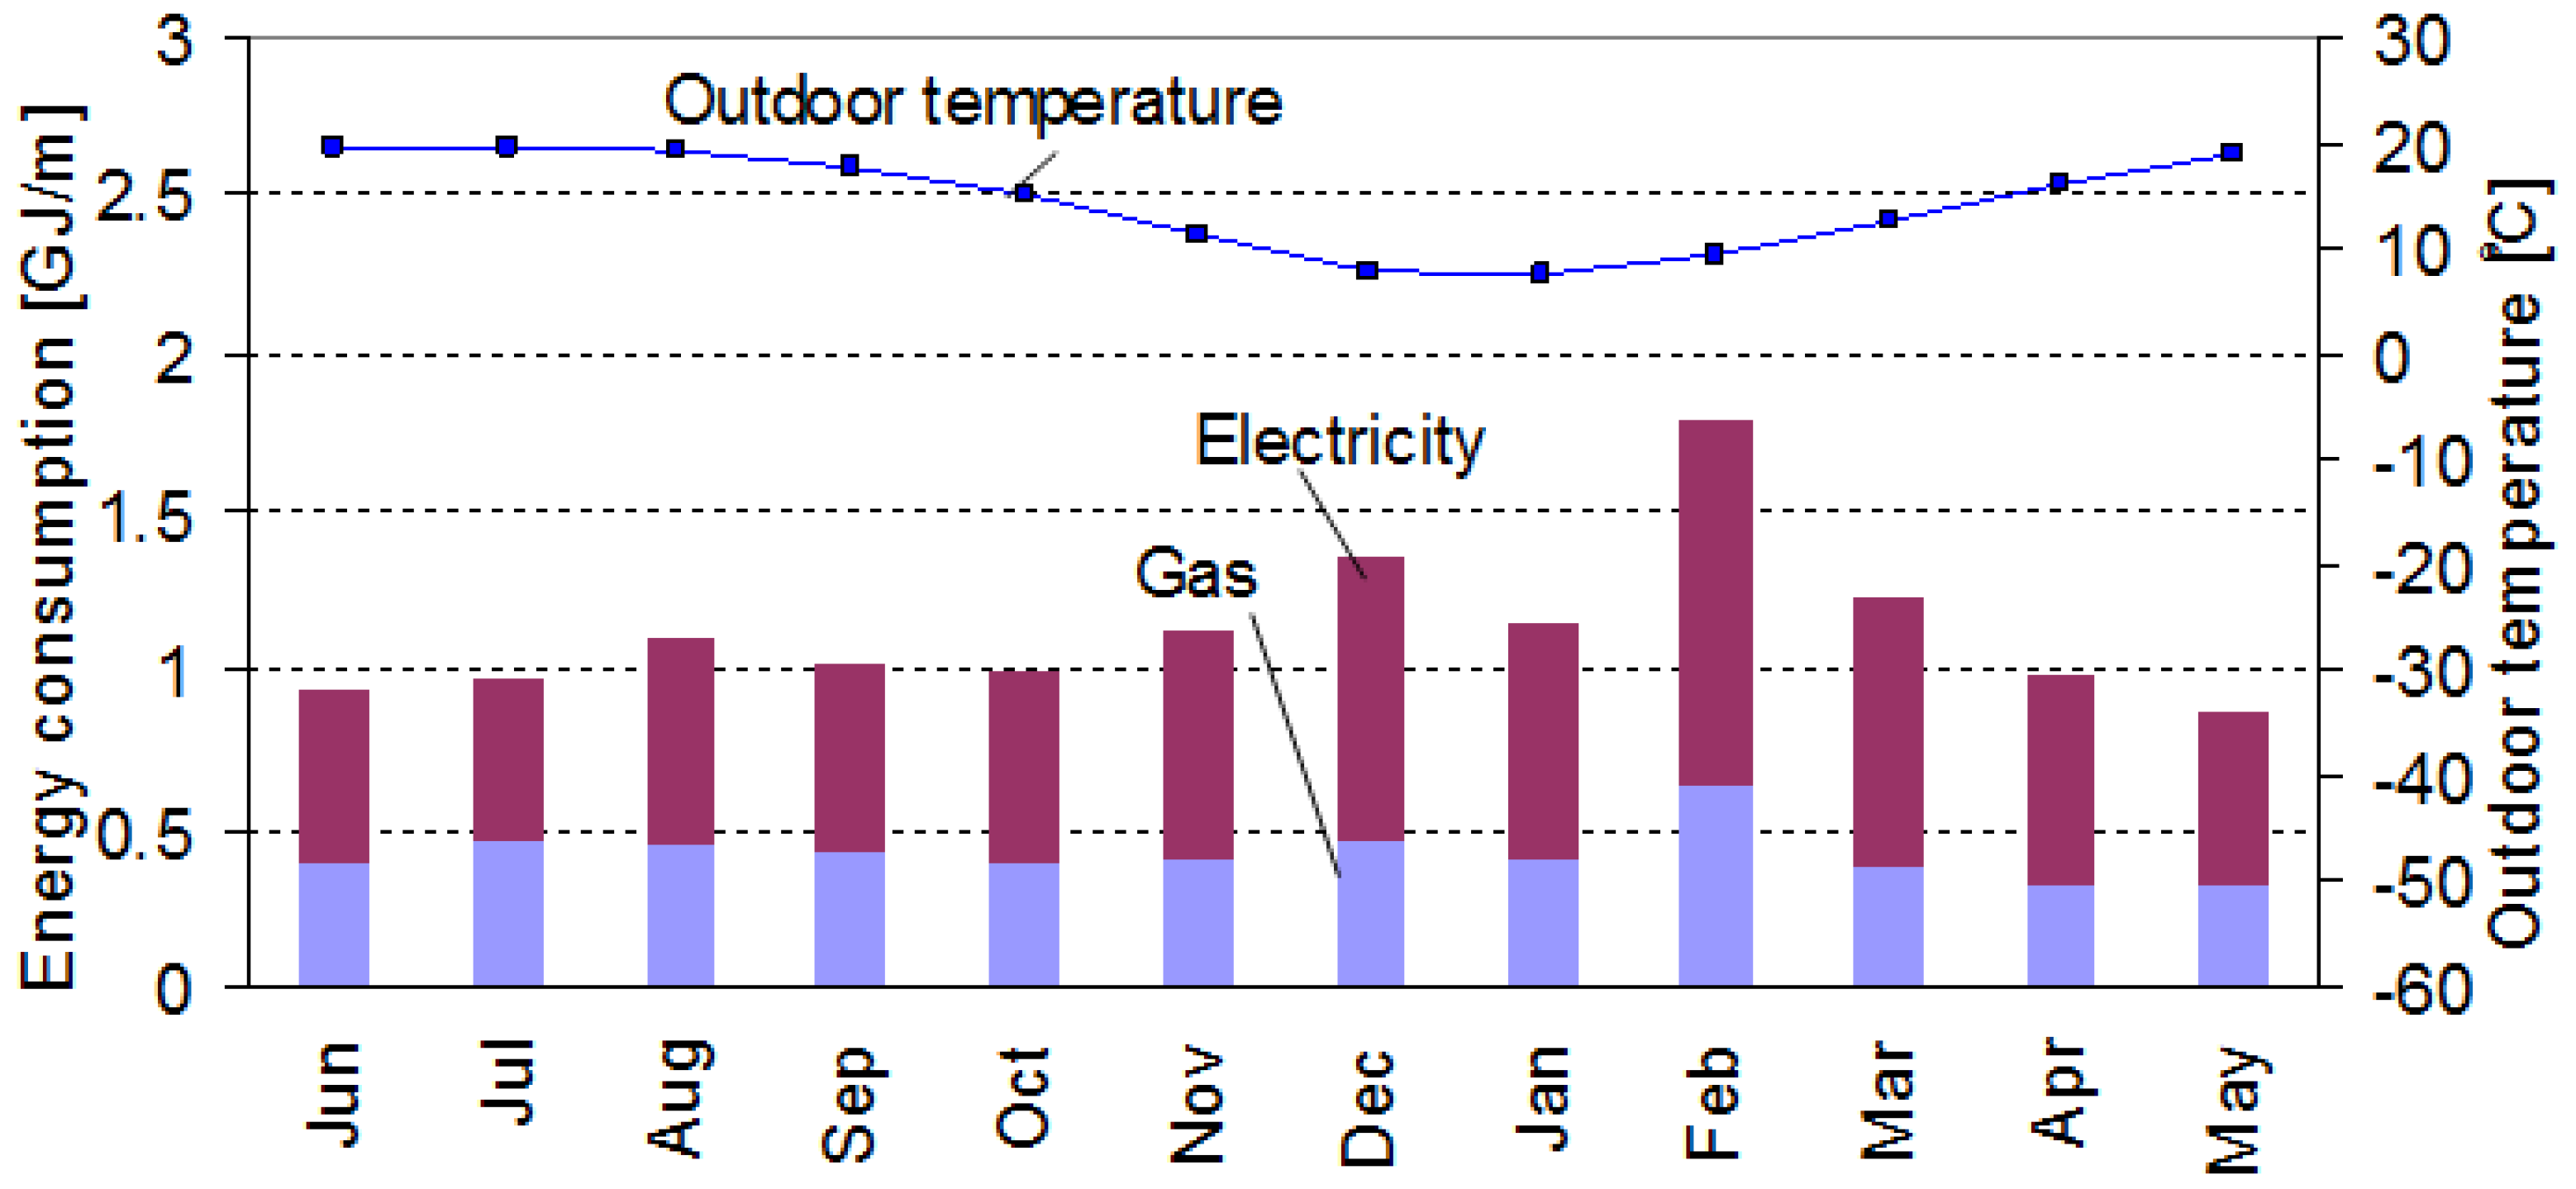
For the average monthly energy consumption shown on
Figure 3, the peak appears in February with the value of 1.76 GJ/month per household because the Chinese spring festival is in February. Generally, people cook more delicious food during that festival and the time spent at home is also much longer than other months. The second largest energy consumption month is in December with the value of 1.35 GJ/month, and the electricity consumption is almost twice that of gas consumption. In the other 10 months, energy consumption is almost the same, except in August and March.
Figure 3.
Monthly energy consumption per household.
Figure 3.
Monthly energy consumption per household.
There are two types of energy use by households in each city. Type 1 has 14 households and Type 2 has 3 households. The classification of the end use of energy consumption is shown in
Table 5. Based on the information in this table, the energy consumption of end use is speculated by using the method as follows;
Table 5.
End use of energy consumption.
Table 5.
End use of energy consumption.
| Type | Energy source | End use | Sample size |
|---|
| Type 1 | Electricity | Heating & cooling, lighting, others | 14 |
| Gas | Cooking, hot water |
| Typ 2 | Electricity | Heating & Cooling, lighting, hot water others | 3 |
| Gas | Cooking |
In the case of Type 1, the energy consumption for cooling was speculated by using the electricity consumptions (Type 1) in winter and summer minus the average consumption of mild seasons (spring and autumn) respectively, because typical weather for spring and autumn in China is generally comfortable, there is no need for cooling [
9], and the lighting consumption does not vary much between the four seasons [
10]. Energy consumption for hot water was speculated by using gas consumption of Type 1 minus that of Type 2 because the cooking habits of residents is alike in the same city; the energy consumptions of Type 1 and Type 2 for cooking can be regarded as the same. Energy consumption of Type 1 can be divided into space heating, space cooling, hot water, cooking and others by the method above.
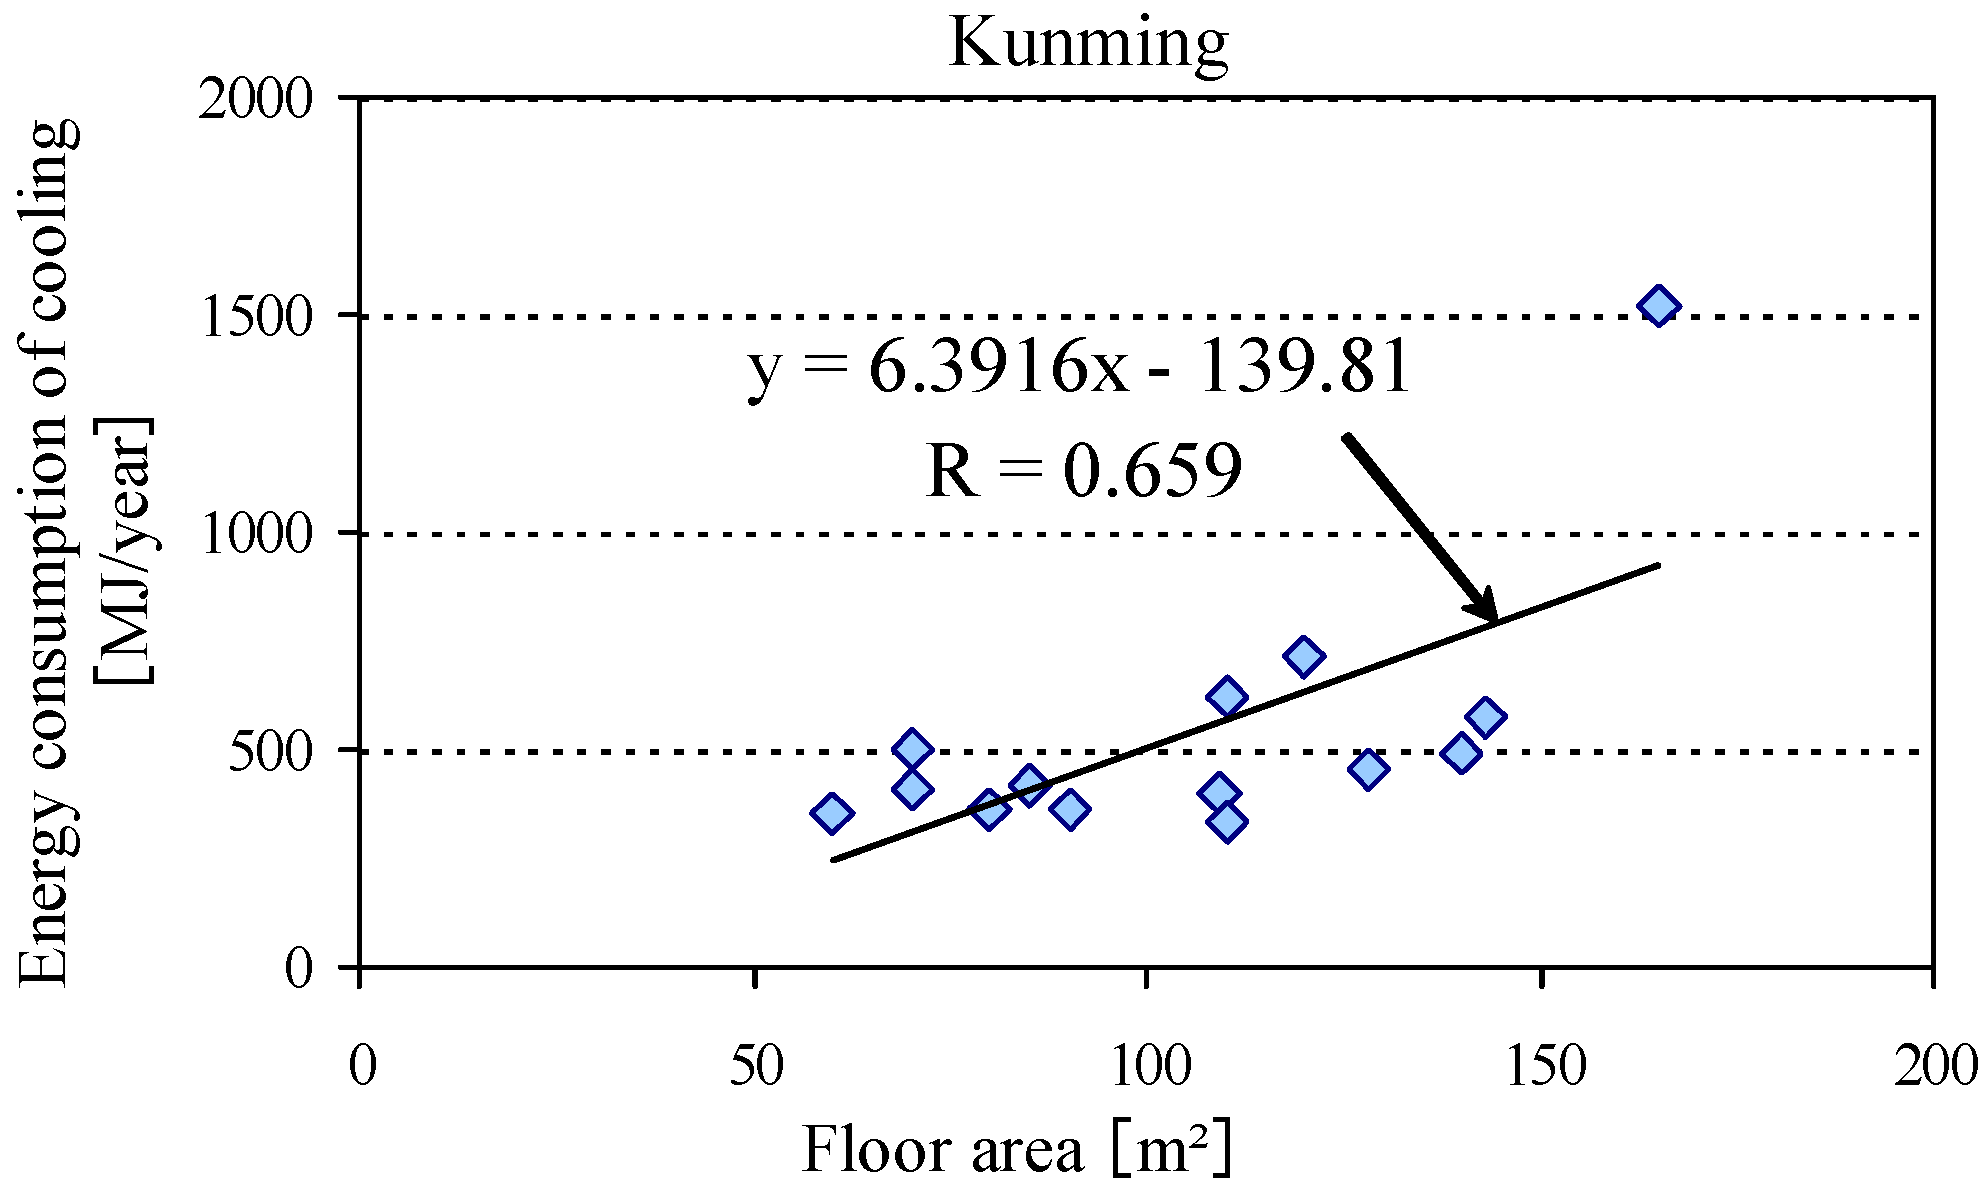
Figure 4.
Correlation between consumptions of cooling and floor area.
Figure 4.
Correlation between consumptions of cooling and floor area.
Based on the information from the survey, the correlation between energy consumption of cooling and floor area was analyzed, and the results are given in
Figure 4. For the case of Type 2, the energy consumption for Heating & cooling cannot be speculated using the method that was adopted in the case of Type 1. This is because the energy consumption of hot water varies from season to season in China. However, energy consumption for cooling can be calculated by the equation of regression between energy consumption of cooling and floor area in Type 1 (Yoshino
et al., 2008). Consumption of gas was used for cooking. Annual energy consumption of hot water can be considered to be the same as in Type 1 and Type 2 in the same city. Energy consumption of Type 2 was divided into space cooling, cooking and others by using the above-mentioned method for Type 2. Hence, the average consumptions of space heating, space cooling, hot water, cooking and others can be calculated by the mean value of Type 1 and Type 2, respectively.
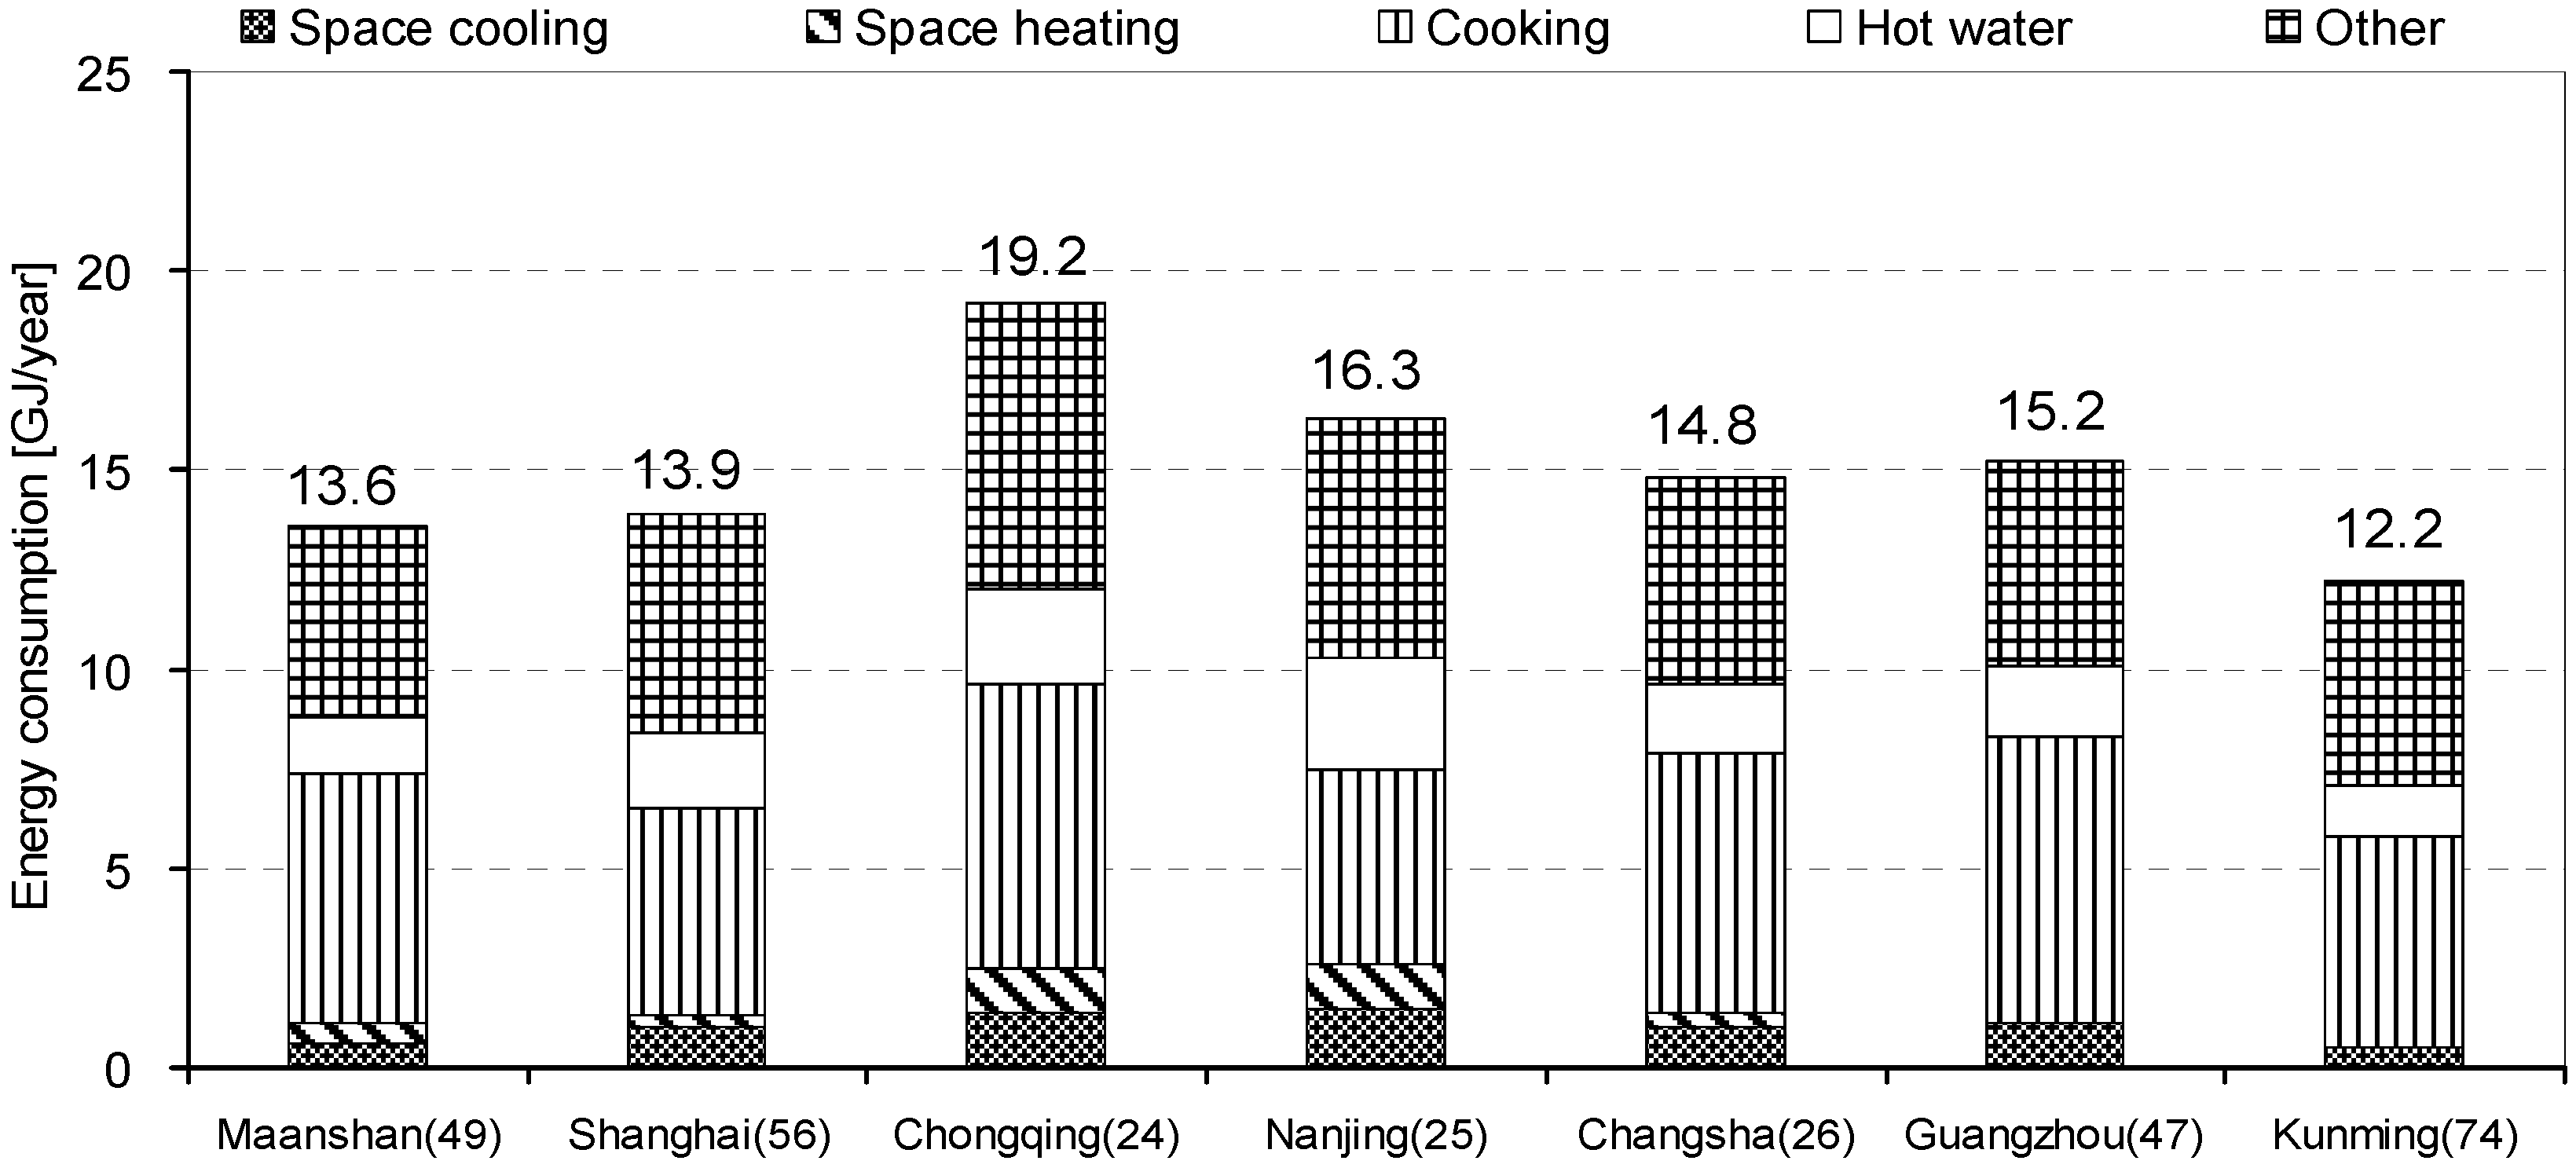
Annual energy consumption reaches 12.2 GJ/year per household, and consumption of cooking accounts for 5.3 GJ/year, which is the largest part of total energy consumption, as shown on
Figure 5. The annual energy consumption is low compared to Shanghai, Changsha, Maanshan, Chongqing and Guangzhou [
9].
Figure 5.
Annual energy consumption per household.
Figure 5.
Annual energy consumption per household.
3.6. Humidity and Temperature
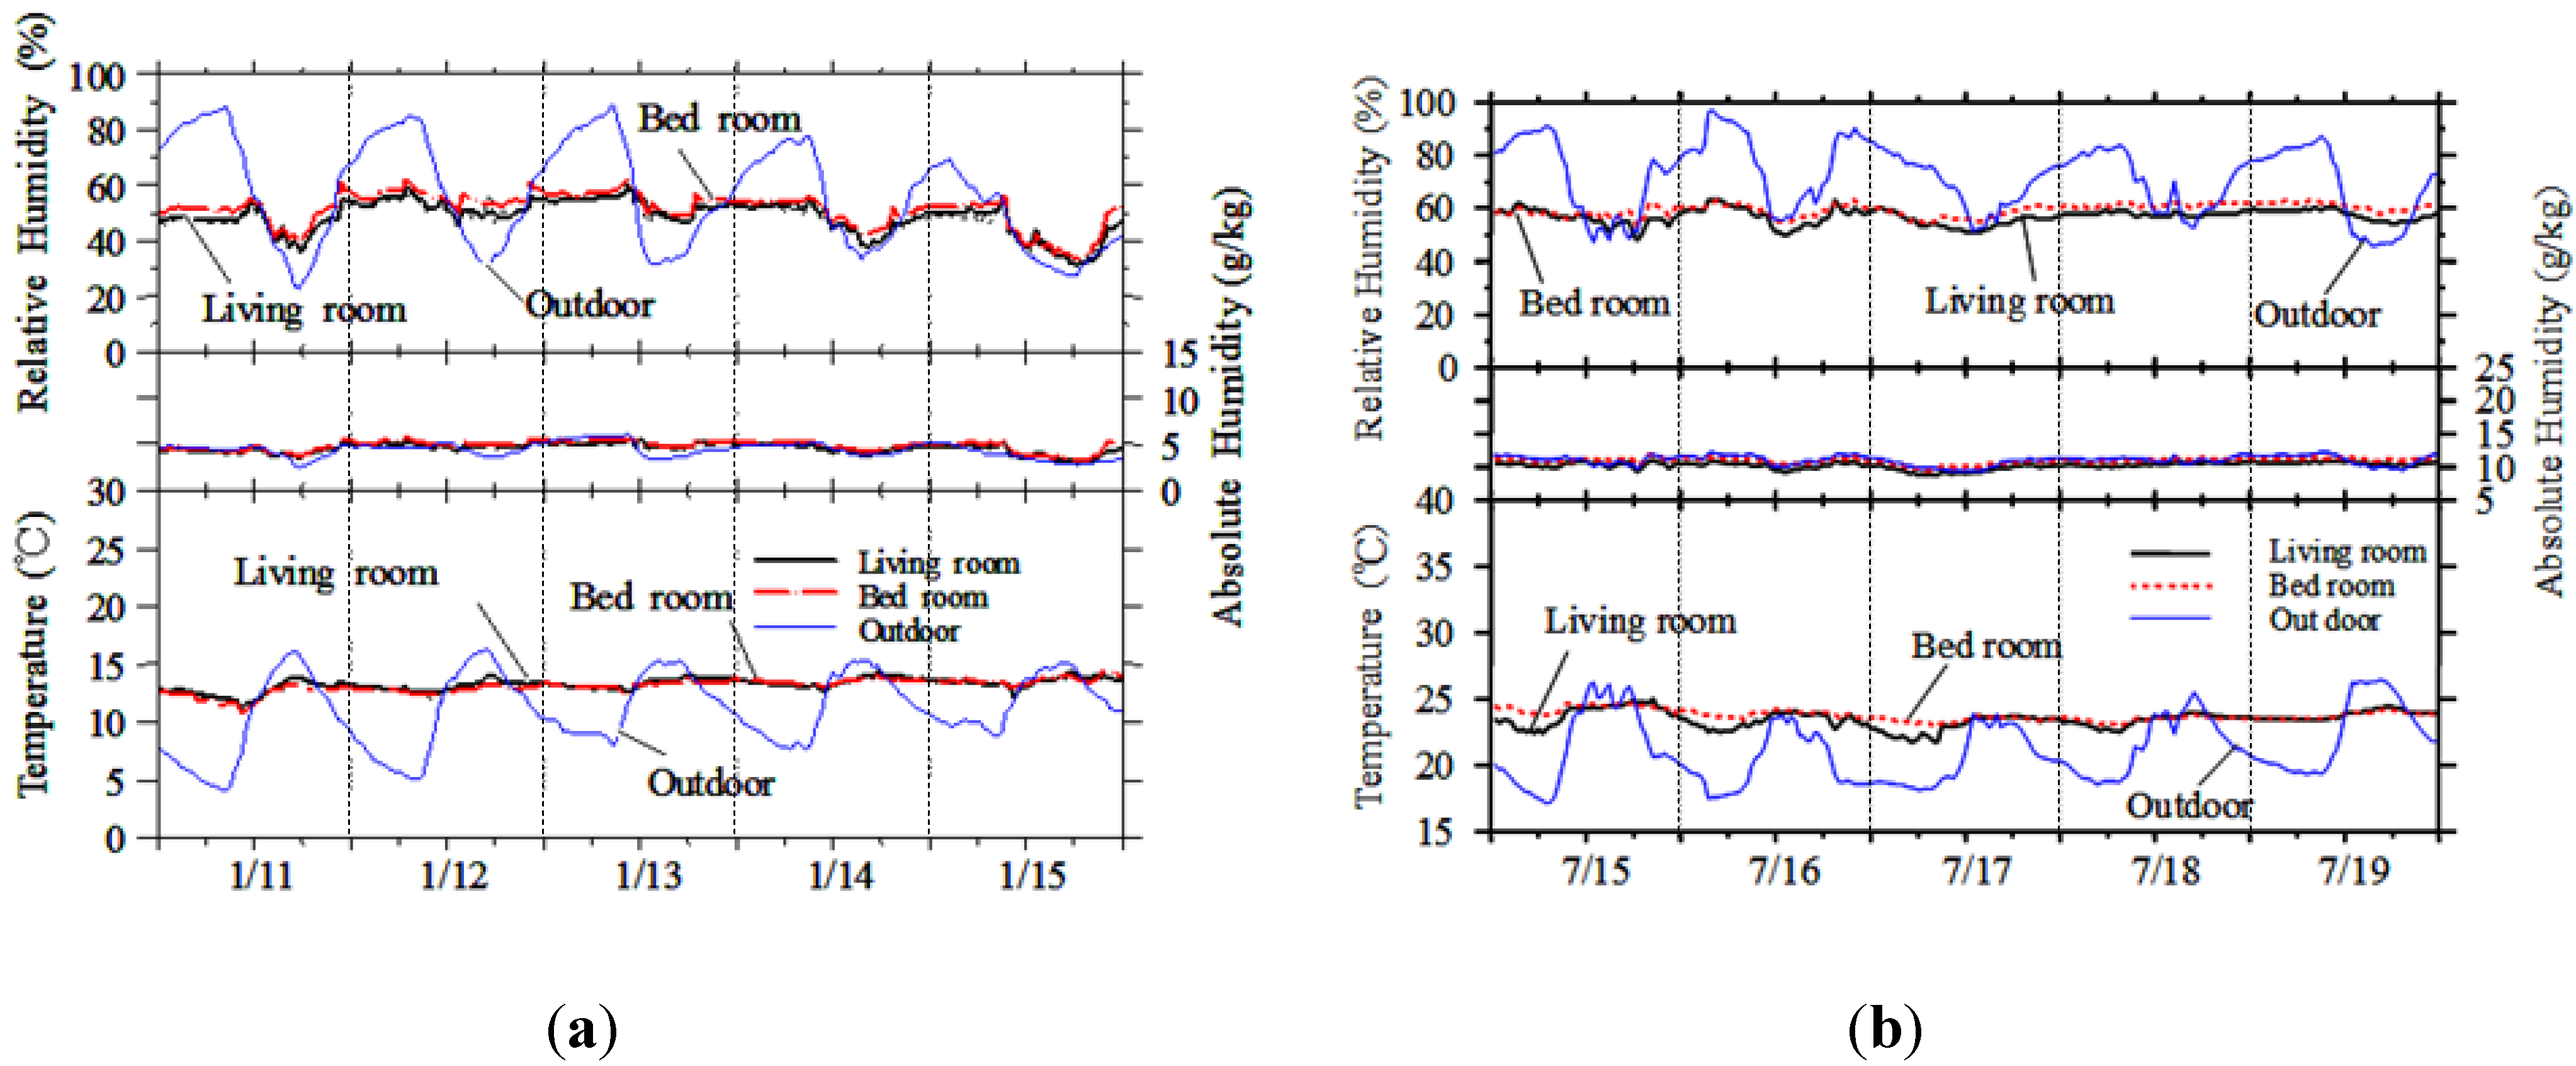
One typical household in the investigated city was selected for the measurement of humidity and temperature by a researcher of a local university. The measured points are set in the living room, master bedroom and outdoors. The small sensor with a data logger records humidity and temperature every 30 minutes.
Figure 6 (a) shows the results of humidity and temperature for a household in winter which includes the coldest day. The indoor fluctuating curve of temperature is more even than that of the outdoor. The relative humidity in the bedroom is slightly higher than the living room. As for the indoor temperature, the living room is almost the same as the bedroom, varying from 11 °C to 14 °C.
Figure 6 (b) shows the results of humidity and temperature for the same household in summer which includes the hottest day. Most of the time, the outdoor humidity is higher than that in the living room and bedroom. The outdoor temperature is lower than that in the living room and bedroom, thus natural ventilation is a useful cooling method for the household in Kunming. The absolute humidity in winter is about 5 g/kg, while in summer it is about 11 g/kg.
Figure 6.
(a) Humidity and temperature in winter. (b) Humidity and temperature in summer.
Figure 6.
(a) Humidity and temperature in winter. (b) Humidity and temperature in summer.

