Abstract
The two methods of processing synthetic crude from organic marlstone in demonstration or small-scale commercial status in the U.S. are in situ extraction and surface retorting. The considerable uncertainty surrounding the technological characterization, resource characterization, and choice of the system boundary for oil shale operations indicate that oil shale is only a minor net energy producer if one includes internal energy (energy in the shale that is used during the process) as an energy cost. The energy return on investment (EROI) for either of these methods is roughly 1.5:1 for the final fuel product. The inclusions or omission of internal energy is a critical question. If only external energy (energy diverted from the economy to produce the fuel) is considered, EROI appears to be much higher. In comparison, fuels produced from conventional petroleum show overall EROI of approximately 4.5:1. “At the wellhead” EROI is approximately 2:1 for shale oil (again, considering internal energy) and 20:1 for petroleum. The low EROI for oil shale leads to a significant release of greenhouse gases. The large quantities of energy needed to process oil shale, combined with the thermochemistry of the retorting process, produce carbon dioxide and other greenhouse gas emissions. Oil shale unambiguously emits more greenhouse gases than conventional liquid fuels from crude oil feedstocks by a factor of 1.2 to 1.75. Much of the discussion regarding the EROI for oil shale should be regarded as preliminary or speculative due to the very small number of operating facilities that can be assessed.1. Introduction
The vast shale resources of the Western United States have long been known to contain kerogen, a combination of chemical compounds that can be converted into petroleum. A large portion of these resources existed on Federal lands in the early 20th century, and these were set aside as the Naval Petroleum and Oil Shale Reserves. Divestment in the 1980s and 1990s transferred ownership of some oil shale resources to the Northern Ute Indian Tribe, while others were transferred to the Department of the Interior and private ownership.
The kerogen in the shale can be transformed into petroleum through one of two primary processes. In surface retorting, the shale is mined, extracted, and processed. For in situ extraction, energy is applied to the shale while it is underground, with the kerogen converted into a liquid synthetic crude oil, pumped out, and refined. Both processes require a considerable amount of direct energy inputs, as well as water, capital and material inputs.
World production of oil from shale was about 684,000 tons in 2005 [1], equivalent to about 5 million barrels, or 13,700 barrels per day. By way of comparison, global crude oil production in 2005 averaged 84.6 million barrels per day. A considerable amount of oil shale is also used as a fuel rather than as a feedstock. Estonia, which has for decades led the world in the production of oil shale, mined 14.6 million tons in 2005. Of this, 10.9 million tons were used for electricity generation.
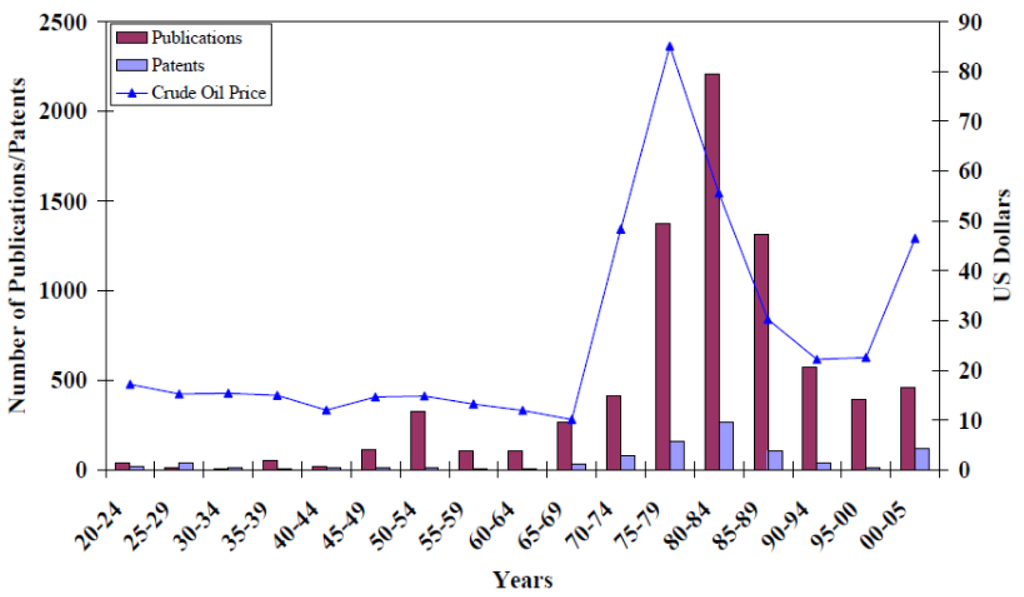
Interest in oil shale has waxed and waned. During the oil crises of the 1970s, the U.S. Government funded efforts to develop liquid fuels from oil shale. When oil prices dropped in the 1980s, projects were abandoned and companies saw their investments become worthless. Oil prices remained low most of the 1990s. As oil prices began to rise again in the 2000s, some energy companies expressed a modest level of renewed interest in the resource. Two barometers of interest in shale oil—the number of patents filed and the number of publications on the subject—illustrate this history (Figure 1).
The Energy Policy Act of 2005 included a number of provisions related to the development of shale oil. Among these, the Department of the Interior's Bureau of Land Management (BLM) was to begin leasing its oil shale properties for development. BLM requested proposals in 2005. Winning applicants received leases to develop shale oil research and development projects on BLM properties in the Western United States; the initial leases were for 640 acres each, with options to expand if the sites and processes proved commercially viable. A 2007 report from the U.S. Department of Energy's Office of Petroleum Reserves, Office of Naval Petroleum and Oil Shale Reserves [3], provides an overview of 27 companies that are major participants in the U.S. shale oil industry, including many of those who had submitted applications through this process. The 2007 report illustrates the fairly limited experience in actual development of oil from shale resources.
The Energy Policy Act also provided for the creation of a Strategic Unconventional Fuels Task Force. In 2007 this Task Force produced a report on the technological and economic aspects of shale oil production [4], but the report did not contain any specific information on the EROI for shale oil.
2. Energy Return on Investment (EROI) Methodology
One technique for evaluating energy systems is net energy analysis, which seeks to compare the amount of energy delivered to society by a technology to the total energy required to find, extract, process, deliver, and otherwise upgrade that energy to a socially useful form. Figure 2 depicts a hypothetical energy system and the types of energy inputs (energy costs) and energy outputs (energy production) associated with that system. Figure 2 could refer to a single oil well or coal mine, a nuclear power plant, a wind farm, or an oil shale facility. The magnitude and timing of the energy production and energy costs are not intended to represent any particular energy system.
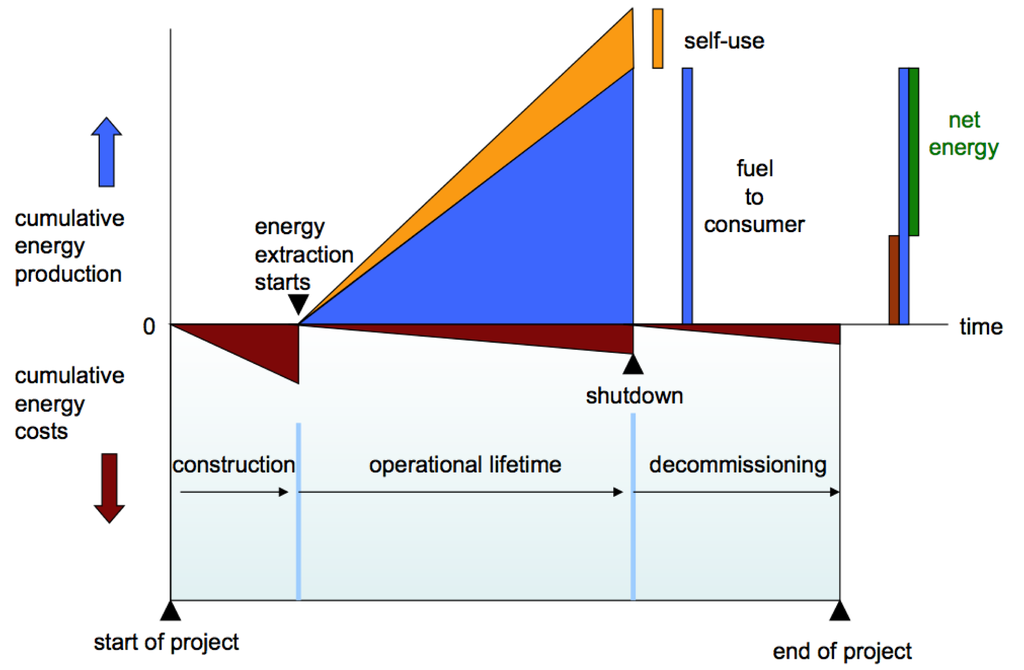
Net energy analysis seeks to assess the direct and indirect energy required to produce a unit of energy. In reference to Figure 2, net energy analysis attempts to quantify all the energy produced and all the energy costs. Energy costs are the sum of direct and indirect energy costs. Direct energy is the fuel or electricity used directly in the extraction or generation of a unit of energy. An example is the natural gas burned in engines that pump oil to the surface. Indirect energy is the energy used elsewhere in the economy to produce the goods and services used to extract or generate energy. An example is the energy used to manufacture the drilling rig used to find oil. The direct and indirect energy use is called embodied energy. Both the energy product and the embodied energy can be expressed in common physical units of measurement, such as British Thermal Units (BTU) or megajoules (MJ).
Energy return on investment (EROI) is the ratio of energy produced to energy costs. In the case of shale oil, the EROI entails the comparison of the energy content of the fuel produced to the amount of primary energy used in the manufacture, transport, construction, operation, decommissioning, and other stages of the shale oil facility's life cycle. Comparing cumulative energy requirements with the amount of energy the technology produces over its lifetime yields a simple ratio for energy return on investment (EROI):
EROI is a dimensionless number. An EROI = 10 means that 10 units of energy are produced for each unit of direct plus indirect energy used in the production process. This is sometimes expressed as “10:1.” An EROI = 1 is an absolute cutoff point for an energy source, the point at which as much energy is used to deliver a unit of energy as that unit yields.
While simple in concept, implementation of net energy analysis requires a number of assumptions regarding the treatment of co-products, the calculation of indirect energy inputs, and in boundary conditions (discussed below). A well-known example of a co-product is “distillers grain” from the fermentation of corn to manufacture ethanol fuel. Drymill ethanol production process uses only the starch portion of the corn, which is about 70% of the kernel. All the remaining nutrients—protein, fat, minerals, and vitamins—are concentrated into distillers grain, a valuable feed for livestock. Should the analysts credit the energy content of the distillers grain as an energy output (or, more accurately, the energy that would have been required to produce feed to replace the distillers grain), and thus include it in the numerator of the EROI for ethanol? Energy analysts debate this point.
These differences account for the well-publicized differences on ethanol EROI, with some studies finding an EROI above 1.0 (a positive net energy) and others finding an EROI below 1.0. See Hammerschlag (2006) [5] or Farrell et al. [6] (2006) for a review of the literature and the EROI the various studies have found. Many studies pay little heed to these assumptions, producing confusion when trying to compare results across studies. We return to this issue below in the context of oil shale.
2.1. System Boundary
The choice about system boundaries is perhaps the most important decision made in most in net energy analyses. This often boils down to what extent indirect energy costs are included in the analysis, and how “self energy use” or “internal energy” is accounted for. Some of the analyses in this survey assess only direct energy costs, such as the energy used to heat the shale or to pump fluids. Other studies also include indirect energy in the form of energy embodied in materials and capital equipment, although they vary in the extent and method with which they calculate such costs. Hall and Murphy (2010) [7] categorize the various types of EROI analysis based on their system boundaries. The studies reviewed here would be EROIstnd or EROI1,d; it is noted in the description of each study whether or not it addresses indirect energy. In several cases, the environmental impacts are quantified, but they are not translated into energy equivalents.
Self-use or internal energy is an important issue in the assessment of the EROI for oil shale. The Shell method of in situ retorting of kerogen produces significant quantities of hydrocarbon (HC) gas, which is burned to generate the electricity used by the process [8]. Similarly, the Alberta Taciuk Processor (ATP) above-ground oil shale retort method produces HC gases and a solid char substance that are burned as fuels. One could argue that these internally generated fuels should not be counted as an energy cost because they do not have an opportunity cost—society did not give something up to create them, unlike the electricity an oil shale facility purchases from the grid. On the other hand, the char or gas generated by the process literally is used up to perform useful work, and thus is a necessary expenditure of energy to produce the desire liquid fuel. This argues for including the self or internal energy in the calculation of the EROI. As Brandt (2008) [8] notes, the internal energy is essential to account for in the assessment of the greenhouse gas emissions from shale oil. Under the EROI Protocol from Murphy and Hall (2010) [7], internal energy consumed is designated Irec, “recycled energy”, and is normally considered in an EROI analysis but not in an External Energy Ratio (EER) analysis.
Energy systems have external costs as well, most notably environmental and human health costs, although these are sometimes more difficult to assess in energy terms. Energy systems also require inputs that are difficult to quantify in energy terms, such as the use of land and water. The shale oil system, for example, requires significant inputs of water and releases solid waste and greenhouse gases. Mulder and Hagens (2008) [9] argue for the use of a multicriteria EROI in which additional metrics are added to the analysis, such as energy yield per unit land or per unit water consumed.
2.2. Shale Oil Conversion Technology
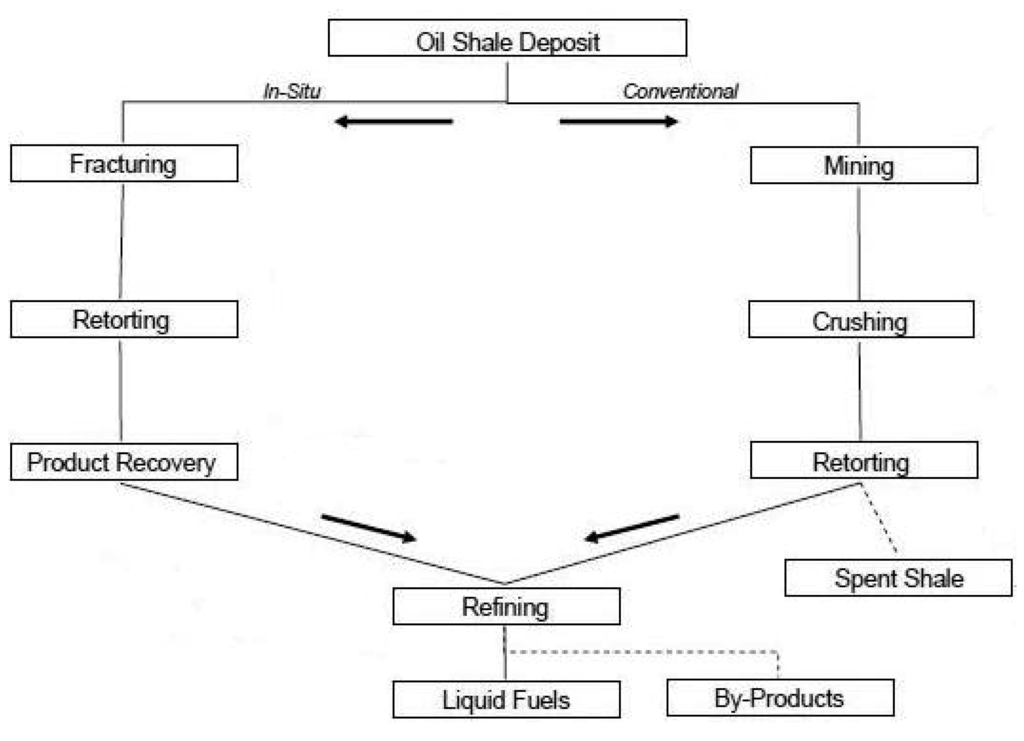
The two main processing options for shale oil are surface retorting and in situ extraction. In surface retorting, the shale is mined and brought to the surface, with the material then heated in a retort to extract the compounds that are processed into synthetic crude oil (Figure 3). In situ extraction involves heating the material underground and pumping liquids to the surface, where they then undergo further processing. Shell conducted research on an in situ extraction at its Mahogany Research Project, in Rio Blanco County, Colorado. The small number and small scale of existing facilities limits the assessments that can be done. These and a few other projects form the basis of most recent analyses.
3. Review of Existing Studies
Table 1 summarizes the existing studies that report data on the EROI for oil shale. Note that these studies vary widely in their scope, method of assessment, and the degree to which the veracity of their conclusions can be objectively assessed. We exclude most references to the EROI for oil shale that lacked sufficient explanation of assumptions and methods. We also exclude studies prior to 2000 because they reflect technologies and resource assessments that are outdated and/or inaccurate.

3.1. Brandt (2008) [8] and (2009) [13]
The most authoritative work on the energy and carbon balance of oil shale is by Brandt (2008, 2009) [8,13] in which he models current technologies for in situ and surface oil shale operations. Brandt's analysis defines two different measures of EROI based on a distinction between what he calls “external energy” and “net energy.” The external energy ratio (EER) compares the energy produced to the direct and indirect energy purchased by the oil shale facility. This method excludes the internal or self energy use as an “energy cost”.
The net energy ratio (NER) includes purchased energy plus primary energy input from the feedstock resource itself (e.g., coproduced HC gas consumed for electricity generation). That is, the NER approach counts self or internal energy as an energy cost of producing liquid fuel.
Brandt (2008) [8] models the Shell in situ conversion process that utilizes electricity to heat the underground shale over a period of two years. Hydrocarbons are produced using conventional oil production techniques. The Shell process co-produces HC gas that powers a combined-cycle gas turbine, which in turn meets some of the project's electricity needs. External energy is needed for construction, drilling, refining, and product transport, and possibly as supplemental heating power.
The resulting External Energy Ratio ranges from 2.4–15.8:1, depending on assumptions. The Net Energy Ratio, which takes into account the internal energy consumed, is much lower, in the range of 1.2–1.6:1.
The resulting greenhouse gas emissions are projected to be about 20–50% higher than those of conventional oil (range of 30.6 to 37.1 grams C per megajoule (MJ) of fuel, compared to 25.3 for the average of gasoline and diesel). These values are comparable to oil sands (29–36) and lower than those of coal-derived liquids (42–49). This analysis does include fugitive greenhouse gas emissions.
Brandt (2009) [13] assesses the surface retorting method for producing liquid fuel from Green River oil shale using the Alberta Taciuk Processor (ATP). The ATP is an above-ground oil shale retort method that combusts the coke or “char” deposited on the shale during retorting to fuel the retorting process. As with the in situ method, much of the energy input comes from the shale itself. Mining and refining account for about 1/3 of the overall energy demand; the energy used to operate the retort accounts for most of the remainder. Mining and refining are major external energy demands, and in some cases use external electric power for the retort. Systems that generate on-site using co-produced natural gas will count electricity as internal.
The External Energy Ratio ranges from 2.6–6.9:1. The lower range of uncertainty compared to the in situ method is probably due to the greater experience with actual systems. Variations in mining energy requirements and upgrading energy requirements account for more than half of the variation between the “low” and “high” cases. The Net Energy Ratio ranges from 1.1–1.8:1. Energy requirements for materials such as steel and cement are included in this analysis, though the magnitude of this impact is relatively small according to the study's supporting materials.
Brandt (2009) [13] conservatively estimates that the resulting greenhouse gas emissions are about 50–75% higher than those of conventional oil, and that is without considering fugitive emissions.
3.2. The RAND Study (Bartis et al. 2005) [11]
This study provides an overview of the land use, conventional pollutants, greenhouse gas emissions, water quality, and water consumption associated with oil shale development. The RAND report is not a specialized EROI analysis per se, and it does not contain a full calculation of indirect energy inputs or a quantitative assessment of all externalities. However, it does provide data on certain direct energy inputs, as well as a qualitative description of externalities.
The report provides a detailed description of both surface retorting and in situ extraction technologies. Surface retorting involves crushing the oil shale and heating it to approximately 500 °C for over half an hour. The report also mentions the challenges encountered by the Unocal plant in the Piceance Basin, which closed in 1991 after producing at only half of its design output. Exxon's surface retorting Colony project was abandoned before completion. International experience in Estonia, China, Brazil, and Russia is seen as not illustrative for U.S. applications due to the plants' size and regulatory conditions.
The primary in situ process considered is the thermally conductive in situ extraction process demonstrated by Shell. This involves slowly heating the shale to a lower temperature (approximately 350 °C) over a period of three years. Fluids (oil and gas) are then pumped out of the formation. The principal direct energy inputs are the electricity used to heat the shale and the energy used to create the “freeze wall” that protects the local groundwater and prevents the valuable hydrocarbons from escaping the project boundaries.
The report states that “the heating energy required for this process equals about one-sixth the energy value of the extracted product.” This by itself would suggest an EROItherm of 6:1, but as noted, there are additional energy demands for the freeze wall, and indirect energy inputs in materials and capital. More importantly, the heating energy is electricity that must be generated by burning a fuel. Specifically, the energy inputs are 250–300 kWh per barrel of extracted product. A value of 300 kWh equals about 1 GJ, and a barrel of oil contains about 6 GJ. However, if the electricity was produced from coal converted at an efficiency of 40%, then the actual primary energy inputs are 2.5 times as great as the nominal heating energy, or 2.5 GJ. Thus, the EROIelec would be 2.4:1. The size of a generating plant would be considerable, accounting for a significant share of the water demands. An in situ process capable of producing 100,000 barrels per day would require a generating capacity of 1.2 GW. Along with EROI impacts, the use of coal for generation would produce a significant greenhouse gas impact. Every 6 GJ of synthetic crude would produce, in addition to the emissions from its own combustion, the emissions from 2.5 GJ of coal. Another fuel source that might be utilized is the natural gas that is co-produced with shale oil; however, this would carry a higher cost.
Water consumption is specified as about three barrels of water per barrel of oil produced. RAND notes that earlier studies found water as a limiting factor for shale oil development.
3.3. Bunger et al. (2004) [10]
Bunger et al. (2004) [10] authored a report for the Department of Energy entitled “Strategic Significance of America's Oil Shale Resource.” Volume 2 of this report focused on the economic and technological aspects of oil shale development. This report characterizes the processing of oil shale through the Alberta Taciuk Processor (a surface retort) as “energy self-sufficient” for the purposes of heating. This means that the combustion of some of the compounds present in the shale provide the thermal energy required to extract the remaining compounds. External energy inputs (electricity) are only required for mechanical energy in the process, and amount to about 12–15 kWh per metric ton of ore. At 25 gallons of synthetic crude per ton, and a heat rate of 10,000 BTU per kWh (34% generation efficiency), this would be about 5% of the energy content in the shale. However, that does not include energy for mining and ore transport.
Bunger et al. (2004) [10] is not a specialized EROI analysis per se, and it does not contain a full calculation of indirect energy inputs or a quantitative assessment of all externalities. It also does not discuss the energy inputs required for in situ shale oil production. It provides a qualitative discussion of environmental impacts, with particular attention to how these compare to the impacts of production of petroleum from oil sands.
A subsequent Department of Energy fact sheet on the EROI of various unconventional oil resources cited Bunger's work to provide a value of over 10:1 for surface retorting, roughly 7:1 for non-electric heating in situ extraction, and 2.5:1 for electric heating in situ extraction (DOE, 2007) [12]. The fact sheet provides no methodological detail, so it is impossible to judge the veracity of its conclusions. It appears to consider only the external energy supplied to the process—the energy used for electricity generation for electric heating is excluded, as are indirect energy costs. Thus, the EROI reported in the DOE fact sheet is certainly too high, although the margin of error is impossible to ascertain due to the lack of documentation.
3.4. Backer and Duff et al. (2007) [14]
“Peak Oil Production and the Implications to the State of Connecticut” was submitted to Connecticut's legislative leaders and Governor in November 2007 by the Legislative Peak Oil and Natural Gas Caucus. The lead members were Representative Terry Backer and Senator Bob Duff, with support from Paul Sankowski and Steve Andrews. A December 2007 addendum on tar sands and shale oil also assessed the impacts of these resources. The report also cites EROI of 3:1 for surface retorting, though not specifying a source. There is no documentation for this result, so little confidence can be placed in its accuracy. Water demand is stated as one to three barrels of water per barrel of oil for industrial operations. The municipal and industrial growth required to support the production of 2.5 million barrels per day would require another 50 million gallons per day, in addition to the 100–300 million gallons of industrial water demand. The long timeframe for power plant construction is noted as a hurdle to development, and the water-related issues are given particular attention.
3.5. House Committee on Resources (2005) [15]
The House of Representatives Committee on Natural Resources held hearings on the oil shale resource in June 2005. One of the speakers was Jack Savage, President and CEO of Oil-Tech, Inc. This company produced shale oil in a surface retorting process at a small facility in Utah. Mr. Savage discussed the operation, including the thermal energy self-sufficiency of the process. Mr. Savage also described his company's operations as requiring relatively low capital investment, which would argue for low indirect energy inputs in materials.
The representative from Shell, Mr. Terry O'Connor, discussed in situ production. Some specific practical challenges were identified, such as developing heaters that would last for the multi-year duration of the process.
Mark Maddox, Principal Deputy Assistant Secretary of Energy for Fossil Energy, answered a number of questions on shale oil. Citing Shell's work, he quoted an EROI value of 3:1 for in situ extraction, or 6:1 if the natural gas co-produced with the shale oil is used to provide the necessary heat. Mr. Maddox notes the connection between EROI and greenhouse gas emissions for shale oil development. Mr. Maddox also noted an additional source of CO2 emissions: beyond that from the combustion of the shale oil and that of the energy used for heating, some process CO2 emissions result when the carbonate compounds in the shale are heated in a retort. Finally, Maddox cites a figure of 1 to 2 barrels of water per barrel of oil produced.
The wording of Mr. Maddox's response to the energy balance question suggests that the answer refers to direct energy consumption. The values cited line up with the downhole heating energy demands in the RAND study, which are “one-sixth the energy value of the extracted product,” or a 6:1 EROI if natural gas provides the heat. With 50% efficient generation, the EROI would be 3:1 for electric heating in situ production. Other indirect energy costs and indirect energy costs are excluded.
3.6. Cleveland (2005) [16]
Cleveland (2005) [16] offers an extensive discussion of EROI methodology. The values reported for the EROI for oil shale are above and below the break-even point, with the median estimate around 5:1 or less. These findings are based on Cleveland et al. (1984) [15], which assessed the EROI of a range of energy resources based on the then-current literature. The studies referenced by Cleveland et al. (1984) [17] via Lind and Mitsch (1981) [18] date from the mid-1970s. They show EROI ranging from 0.7:1 to 13.3:1. This wide range is partly due to very limited experience with actual projects, and partly due to the less-developed state of EROI analysis at the time. The range cited by Cleveland (2005) [16], based as it is on these earlier studies, is not representative of the current state of technology and resource assessment.
3.7. Burnham et al. (2010) [19]
American Shale Oil LLC (AMSO) has proposed a new method of producing oil shale from the source rock. This method relies on heating an illitic shale layer under pressure to fracture it, increase permeability, and perform in situ retorting, while a nahcolitic shale oil layer above serves to insulate the producing layer from groundwater. The process is still under development and has not yet been field-tested. AMSO projects water consumption of less than one barrel per barrel of oil produced, CO2 emissions from downhole heating of 50 kg per barrel of oil (roughly 10% of the CO2 from burning that oil), and an EROI of possibly 5:1 (considering all energy uses) to 8:1 (considering direct energy only).
3.8. Bunger and Russell (2010) [20]
Bunger and Russell (2010) [20] analyze the thermal efficiency of shale oil production, modeling a surface retort. The study notes the increasing energy cost of petroleum recovery, and states that shale oil production will soon be “thermodynamically competitive” with petroleum. Bunger and Russell use an “efficiency of conversion” approach, where the energy required for each step gives an efficiency value for that point in the process. For example, mining and ore preparation require approximately 4% of the energy content in the shale (96% efficiency), while upgrading requires about 2.5% of the energy in the feedstock (97.5% efficiency). The analysis also notes that the internal energy consumed has no other economic use. The overall energy efficiency is seen to be 81%, corresponding to an EROI of 5.3:1. That is, if Ef/E0 = 0.81, then Ef/(E0 − Ef) = 5.3, The analysis does not included embodied energy in materials or other indirect energy. Direct energy is considered, as is the energy required for electricity generation (40% generation efficiency is assumed).
4. Comparison with Conventional Oil Production
Most of the world's liquid fuels are derived from conventional extraction and processing of crude oil. How does the EROI for shale oil compare with that for conventional oil? Delucchi (1991 [21], 1993 [22], 2003 [23]) estimates the amount of energy used in various fuel cycles related to the use of alternative transportation fuels. This work is used in the GREET (Greenhouse gases, Regulated Emissions, and Energy use in Transportation) model sponsored by the Argonne National Laboratory. GREET evaluates the fuel cycle from well to wheel and for various fuel and vehicle technologies. Delucchi's (1991) [21] data indicate an EROI of about 43:1 for crude oil at the wellhead that is destined to be refined into motor gasoline (Figure 4). Delucchi's (2003) [23] revisions project an EROI of about 20:1 for crude oil at the wellhead by 2015. The decline from 43:1 to 20:1 from 1991 to 2015 is due in part to Delucchi's assumption that an increasing share of production will come from energy-intensive offshore drilling, heavy oil, and enhanced recovery.
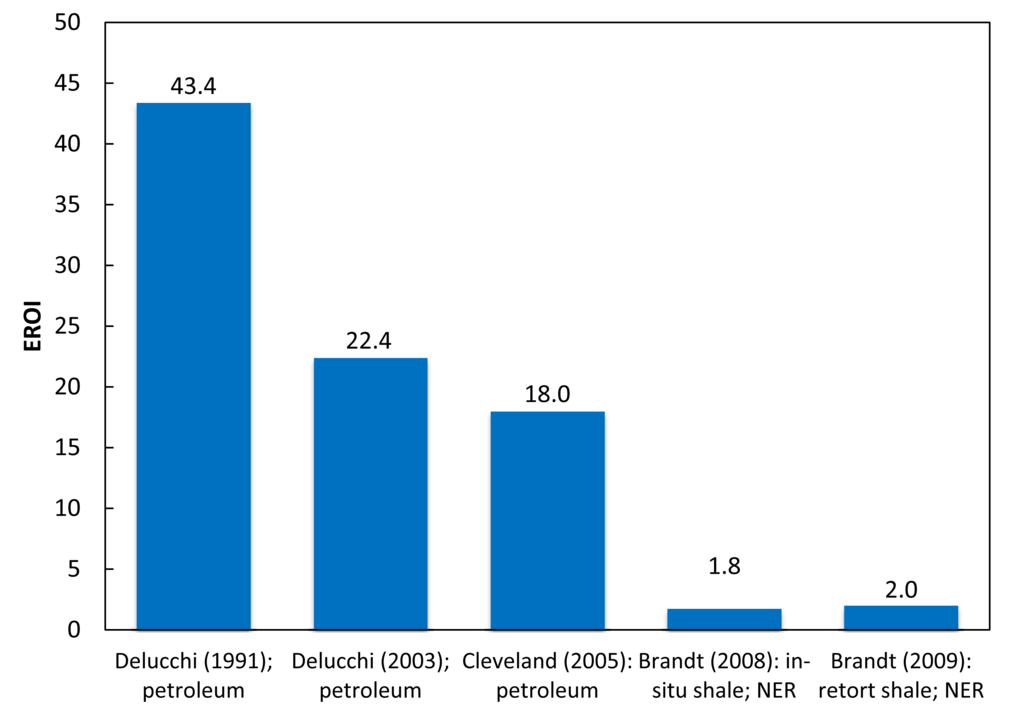
Cleveland (2005) [16] uses a different methodology to estimate an EROI for oil and gas production at the wellhead of about 23:1 in 1997. This figure is based on direct fuel and electricity costs only, and is the return to the sum of oil plus gas produced-no attempt is made to allocate joint energy costs separately to oil and gas. Cleveland estimates the EROI for oil and gas production to be about 18:1 in 1997 when direct plus indirect energy costs are included. Cleveland's estimates of EROI are lower than Delucchi's (1991) [21] because his method uses a much more comprehensive definition of indirect energy use.
Brandt's work [8,13] can be used as the basis for calculating the EROI for shale oil at a stage of processing similar to crude oil at the wellhead. Both the in situ and surface retorting methods produce a “crude” product that must be refined into a useful fuel. Brandt's data indicate an EROI of around 2:1 for the extraction of the crude product from the shale (Figure 4). The estimates in Figure 4 are the average of Brandt's “high” and “low” scenarios prior to the energy costs of refining.
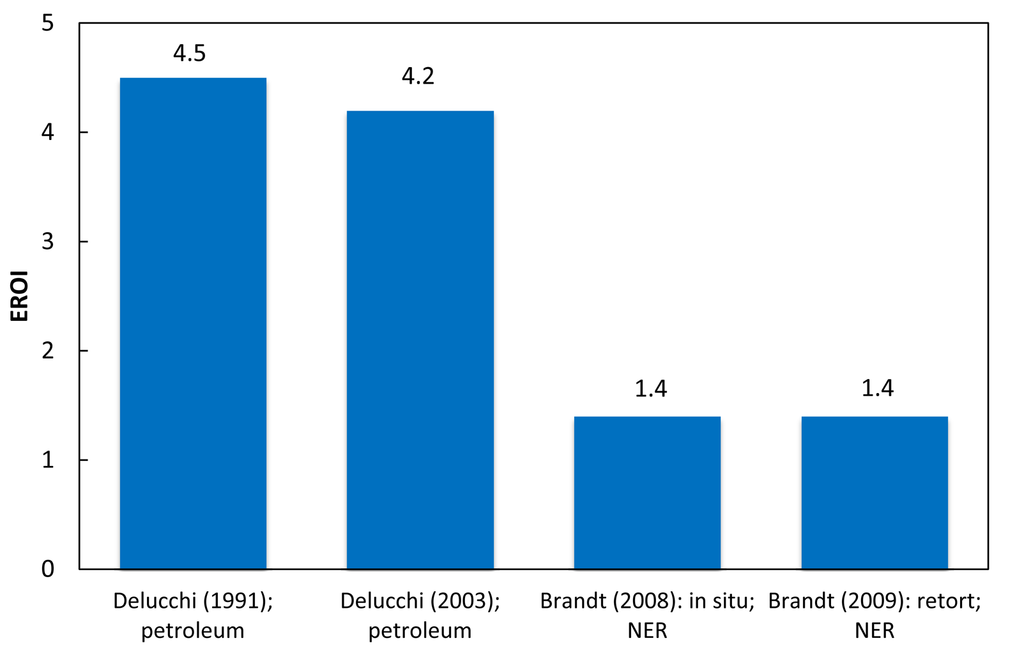
We can also compare these two technologies at the refining stage (Figure 5). Here the EROI is the energy content of the refined fuel compared to the energy required to extract, process, and refine the crude product into a finished fuel that is ready for end use. Delucchi's (1991, 2003) [21,23] work suggests an EROI of about 4.7 for motor gasoline refined from conventional crude oil. Brandt's (2008, 2009) [8,13] indicates an EROI of about 1.4 for liquid fuel refined from shale oil.
The drop in EROI from the wellhead to the pump seems very large for refined petroleum because EROI is a ratio. Delucchi (1991) [21], Table 3, indicates that for every 100 MJ of reformulated gasoline sold to a consumer, roughly 2.5 MJ are expended in extracting the crude, 1.2 MJ in transporting the crude, 18.5 MJ in refining it, and 0.8 MJ in distributing it. For the 2003 revision, the costs are 4.8 MJ for extraction, 1.1 MJ for transport, 17.0 MJ for refining, and 0.95 MJ for distribution. The refining costs for shale oil are not greatly different (around 11 MJ for in situ or 15 MJ for surface retorting), but because EROI is already so low, the costs have a lesser impact on the EROI for shale oil. An added energy cost equal to 15% of final energy will reduce an EROI of 40 down to 5.7, but it will only reduce an EROI of 4 down to 2.5.
5. Conclusions
The discussion surrounding the net energy balance of shale oil is characterized by data and conclusions that that lack rigorous analysis and review. Among those studies that apply some type of formal analysis, most focus on the assessment of a portion of direct energy use, ignoring other direct energy use and indirect energy use.
By a wide margin, Brandt's (2008, 2009) [8,13] are the most credible studies. Brandt's work suggests that the EROI for oil shale falls between 1:1 and 2:1 when internal or self-use energy is included as an energy cost. This choice of system boundary is consistent with method used to calculate the EROI for conventional oil and coal extraction (Cleveland, 2005) [16]. In the case of conventional oil extraction, for example, considerable co-produced natural gas is burned as a fuel to power field operations. Cleveland (2005) [16] includes so called “captive ” fuel use as an energy cost of oil because it is energy that is literally used up to produce oil. The gaseous and char fuels generated and then burned in the oil shale production process should be viewed in the same way. As noted above, however, one could argue that these fuels should not be counted as an energy cost because they do not have an economic opportunity cost. Of course, the environmental impact from the combustion of those fuels occurs regardless of the accounting scheme.
This places the EROI for shale oil considerably below the EROI for conventional crude oil. This conclusion holds for both the crude product and refined fuel stages of processing. Even in its depleted state—smaller and deeper fields, depleted natural drive mechanisms, etc.—conventional crude oil generates a significantly larger energy surplus than shale oil. This is not a surprising result considering the nature of the natural resource exploited in each process. The kerogen in oil shale is solid organic material that has not been subject to the temperature, pressure, and other geologic conditions required to convert it to liquid form. In effect, humans must supply the additional energy required to “upgrade” the oil shale resource to the functional equivalent of conventional crude oil. This extra effort carries a large energy penalty, producing a much lower EROI for oil shale.
There remains considerable uncertainty surrounding the technological characterization, resource characterization, and choice of the system boundary for oil shale operations. Even the most thorough analyses (Brandt, 2008, 2009) [8,13] exclude some energy costs. Based on Brandt's analysis, it is likely that oil shale is still a net energy producer, but it does not appear to carry a large energy surplus.
An important caveat is in order here: the EROI of 1–2 reported by Brandt includes self energy use, i.e., energy released by the oil shale conversion process that is used to power that operation. For example, most of the retorting energy in the ATP process is provided by the combustion of char and produced gas, significantly reducing energy needs from the point of view of the operator. From a net energy perspective, how should this internal use of energy be treated? The answer depends on the question being asked. One could argue that the char and gas produced and consumed within the shale conversion process has zero opportunity cost—i.e., that energy would not, or could not, be used somewhere else in the economy, so it should not be treated as a “cost.” The EROI calculated using this perspective is in the range of 2 to 16. On the other hand, the internal energy is an essential expenditure of work necessary to produce the liquid fuel. The internal energy is absolutely necessary to accurately assess greenhouse gas emissions.
Another issue is energy quality. Society willingly sacrifices 3 BTUs of coal to generate 1 BTU of electricity in thermal power plants. This makes economic sense because a BTU of electricity is more valuable than a BTU of coal. Oil shale operations consume large quantities of electricity to upgrade a low quality resource (oil shale) to a higher quality form (liquid fuel). But liquid fuel is still a lower quality form of energy than electricity, at least from a macroeconomic perspective. Accounting for these differences can dramatically alter the results of EROI analyses (Cleveland, 1992) [24]. The Shell in situ process is very electricity-intensive, and accounting for energy quality would, ceteris paribus, lower the reported EROI. Note, however, that one could argue against accounting for quality because if that electricity is self-generated, it may have zero opportunity cost. Future work should address these issues.
The low EROI for oil shale is closely connected to a significant release of greenhouse gases. The large quantities of energy needed to process oil shale, combined with the thermochemistry of the retorting process, produce carbon dioxide and other greenhouse gas emissions. Oil shale unambiguously emits more greenhouse gases than conventional liquid fuels from crude oil feedstocks by a factor of 1.2 to 1.75 (Brandt, 2008, 2009) [8,13]. Brandt (2010) [25] provides greater discussion of CO2 emissions from oil shale, including those from carbonate decomposition.
A fuel with a modest EROI that emitted few greenhouse gases could at least be a candidate for an alternative source of energy. However, a very low EROI combined with a very high carbon intensity should remove an energy system from serious consideration as an alternative to conventional crude oil extraction and refining. Oil shale in the western United States appears to fall into this category. Generally speaking, a fuel with high EROI and high carbon emissions per unit of net energy delivered, such as coal, enables a considerable expansion of economic activity at the cost of environmental impact. A fuel with low EROI but relatively low carbon emissions per unit of net energy delivered does not allow much expansion of economic activity, but has a reduced adverse effect on climate. A fuel that has both low EROI and high carbon emissions offers neither the potential for economic gain nor the potential of mitigating environmental impact.
References and Notes
- Dyni, J.R. Oil Shale. In 2007 Survey of Energy Resources; Clarke, A.W., Trinnaman, J.A., Eds.; World Energy Council: London, UK, 2007; pp. 93–118. [Google Scholar]
- Smith, M.W.; Shadle, L.J.; Hill, D.L. Oil Shale Development from the Perspective of NETL's Unconventional Oil Resource Depository, Presentation at 26th Oil Shale Symposium; Golden, CO, 18 October 2006.
- Crawford, P.M.; Knaus, E. Secure Fuels from Domestic Resources: The Continuing Evolution of America's Oil Shale and Tar Sands Industries (Profiles of Companies Engaged in Domestic Oil Shale and Tar Sands Resource and Technology Development); U.S. Department of Energy: Washington, DC, USA, 2007. [Google Scholar]
- U.S. Department of Energy, Strategic Unconventional Fuels Task Force. Development of America's Strategic Unconventional Fuels; U.S. Department of Energy: Washington, DC, USA, 2007. [Google Scholar]
- Hammerschlag, R. Ethanol's energy return on investment: A survey of the literature 1990-present. Environ. Sci. Technol. 2006, 40, 1744–1750. [Google Scholar]
- Farrell, A.; Plevin, R.J.; Turner, B.T.; Jones, A.D.; O'Hare, M.; Kammen, D.M. Ethanol can contribute to energy and environmental goals. Science 2006, 311, 506–508. [Google Scholar]
- Murphy, D.J.; Hall, C.A.S.; Cleveland, C. Order from Chaos: A preliminary protocol for determining EROI of fuels. Sustainability 2011, 3, 1888–1907. [Google Scholar]
- Brandt, A. Converting oil shale to liquid fuels: Energy inputs and greenhouse gas emissions of the shell in situ conversion process. Environ. Sci. Technol. 2008, 42, 7489–7495. [Google Scholar]
- Mulder, K.; Hagens, N.J. Energy return on investment: Toward a consistent framework. Ambio 2008, 37, 74–79. [Google Scholar]
- Bunger, J.W.; Johnson, H.R.; Crawford, P.M. Strategic Significance of America's Oil Shale Resource, Volume II: Oil Shale Resources Technology and Economics; U.S. Department of Energy: Washington, DC, USA, 2004. [Google Scholar]
- Bartis, J.T.; LaTourrette, T.; Dixon, L.; Peterson, D.J.; Cecchine, G. Oil Shale Development in the United States: Prospects and Policy Issues; RAND Corporation: Santa Monica, CA, USA, 2005. [Google Scholar]
- U.S. Department of Energy. Fact Sheet: Energy Efficiency of Strategic Unconventional Resources; U.S. Department of Energy: Washington, DC, USA, 2007. [Google Scholar]
- Brandt, A. Converting oil shale to liquid fuels with the alberta taciuk processor: Energy inputs and greenhouse gas emissions. Energ. Fuel. 2009, 23, 6253–6258. [Google Scholar]
- Backer, T.; Duff, B. Peak Oil Production and the Implications to the State of Connecticut: Report of Legislative Peak Oil and Natural Gas Caucus; Connecticut General Assembly: Hartford, CT, USA, 2007. [Google Scholar]
- U.S. House of Representatives. The Vast North American Resource Potential Of Oil Shale, Oil Sands, And Heavy Oils, Parts 1 And 2: Oversight Hearings Before The Subcommittee On Energy And Mineral Resources Of The Committee On Resources, U.S. House Of Representatives, One Hundred Ninth Congress, First Session, 23 and 30 June, 2005; U.S. House of Representatives: Washington, DC, USA, 2005. [Google Scholar]
- Cleveland, C.J. Net energy from the extraction of oil and gas in the United States 1954–1997. Energy 2005, 30, 769–782. [Google Scholar]
- Cleveland, C.J; Costanza, R; Hall, C.A.S.; Kaufmann, R. Energy and the U.S. economy: A biophysical perspective. Sci. New Ser. 1984, 225, 890–897. [Google Scholar]
- Lind, C.G.; Mitsch, W.J. A net energy analysis including environmental cost of oil shale development in Kentucky. In Energy and Ecological Modelling; Mitsch, W.J., Bosserman, R.W., Klopatek, J.M., Eds.; Elsevier Scientific: New York, NY, USA, 1981; pp. 689–696. [Google Scholar]
- Burnham, A.K.; Day, R.L.; Hardy, M.P.; Wallman, P.H. AMSO's Novel Approach to in situ oil shale recovery. In Oil Shale: A Solution to the Liquid Fuel Dilemma; Ogunsola, O.I., Hartstein, A.M., Ogunsola, O., Eds.; Oxford University Press: New York, NY, USA, 2010; pp. 149–160. [Google Scholar]
- Bunger, J.W.; Russell, C.P. Thermodynamics of Shale Oil Production. In Oil Shale: A Solution to the Liquid Fuel Dilemma; Ogunsola, O.I., Hartstein, A.M., Ogunsola, O., Eds.; Oxford University Press: New York, NY, USA, 2010; pp. 89–101. [Google Scholar]
- Delucchi, M.A. Emissions of Greenhouse Gases from the Use of Transportation Fuels and Electricity, Volume 1: Summary; Center for Transportation Research, Argonne National Laboratory: Argonne, IL, USA, 1991. [Google Scholar]
- Delucchi, M.A. Emissions of Greenhouse Gases from the Use of Transportation Fuels and Electricity, Volume 2: Appendices; Center for Transportation Research, Argonne National Laboratory: Argonne, IL, USA, 1993. [Google Scholar]
- Delucchi, M.A. A Lifecycle Emissions Model (LEM): Lifecycle Emissions from Transportation Fuels, Motor Vehicles, Transportation Modes, Electricity Use, Heating and Cooking Fuels, and Materials, Documentation of methods and data; University of California at Davis: Davis, CA, USA, 2003. [Google Scholar]
- Cleveland, C.J. Energy quality and energy surplus in the extraction of fossil fuels in the U.S. Ecol. Econ. 1992, 6, 139–162. [Google Scholar]
- Brandt, A.R.; Boak, J.; Burnham, A.K. Carbon dioxide emissions from oil shale derived liquid fuels. In Oil Shale: A Solution to the Liquid Fuels Dilemma; Ogunsola, O., Ed.; ACS Symposium Series 1032; American Chemical Society: Washington, DC, USA, 2010. [Google Scholar]
© 2011 by the authors; licensee MDPI, Basel, Switzerland. This article is an open access article distributed under the terms and conditions of the Creative Commons Attribution license (http://creativecommons.org/licenses/by/3.0/).