

Wildfire Scenarios for Assessing Risk of Cover Loss in a Megadiverse Zone within the Colombian Caribbean


1
Escuela de Ciencias Exactas e Ingeniería, Universidad Sergio Arboleda, Bogotá 110110, Colombia
2
Departamento de Investigación, Aqualogs SAS, Bogotá 110110, Colombia
3
Earth System Physics, Abdus Salam International Centre for Theoretical Physics, 34151 Trieste, Italy
*
Author to whom correspondence should be addressed.
Sustainability 2024, 16(8), 3410; https://doi.org/10.3390/su16083410
Submission received: 21 January 2024
/
Revised: 15 April 2024
/
Accepted: 16 April 2024
/
Published: 18 April 2024
(This article belongs to the Section Hazards and Sustainability)
Abstract
:Rising wildfire incidents in South America, potentially exacerbated by climate change, require an exploration of sustainable approaches for fire risk reduction. This study investigates wildfire-prone meteorological conditions and assesses the susceptibility in Colombia’s megadiverse northern region. Utilizing this knowledge, we apply a machine learning model and the Monte Carlo approach to evaluate sustainability strategies for mitigating fire risk. The findings indicate that a substantial number of fires occur in the southern region, especially in the first two seasons of the year, and in the northeast in the last two seasons. Both are characterized by high temperatures, minimal precipitation, strong winds, and dry conditions. The developed model demonstrates significant predictive accuracy with the HIT, FAR, and POC of 87.9%, 28.3%, and 95.7%, respectively, providing insights into the probabilistic aspects of fire development. Various scenarios showed that a decrease in soil temperature reduces the risk mostly in lower altitudes and leaf skin reservoir content in the highest altitudes, as well as in the north region. Sustainability strategies, such as tree belts, agroforestry mosaics, and forest corridors emerge as crucial measures. The results underscore the importance of proactive measures in mitigating wildfire impact, offering actionable insights for crafting effective sustainability strategies amid escalating fire risks.
1. Introduction
Wildfires in tropical regions, housing Earth’s intricate ecosystems and highest carbon storage [1], have profound destructive consequences. They alter the structure and composition of natural assemblages unadapted to fire effects [2,3]. The extensive scientific literature documents fire’s substantial impact on ecological processes and dynamics [4]. Notably, Latin America faces significant threats, losing around 51 million hectares of forests from 1980 to 2010 [5]. Colombia is ranked among the top four countries most affected by wildfires relative to its territory [6]. Wildfires may initiate positive feedback loops, heightening ecosystems’ vulnerability to irreparable losses [7,8]. This situation is especially significant in the Colombian Caribbean, which hosts one of the world’s most irreplaceable nature reserves [9].
In Colombia, previous studies (e.g., [10,11,12]) have explored critical factors influencing wildfires. The findings reveal a peak in fire activity from December to March, attributed to elevated temperatures, intense winds, reduced humidity, and diminished precipitation [13,14,15,16]. However, explanatory biophysical and human factors vary across regions, emphasizing the significance of conducting analyses at the regional level [6]. Hoyos et al. [15] emphasize the significant impact of land cover transformations on wildfires in the humid tropics of the Colombian Caribbean. The challenge of controlling wildfires in these regions has intensified due to elevated drought levels and the proliferation of flammable non-native vegetation that rapidly responds to drought conditions [12,17]. Climate change could potentially exacerbate these effects in tropical regions, especially at high altitudes. This is evident in cloud forests, which are undergoing a notable shift, experiencing intermittent rainfall instead of the customary fog [18].
Within this framework, a wide-ranging set of modeling approaches has been devised for wildfire forecasting [1]. Some of these models showcase the rapid progress in machine learning (ML), leveraging algorithms that autonomously enhance performance by analyzing datasets to discern patterns and infer outcomes from input data. For instance, Hung et al. [19] employed deep neural computing, a subset of ML, to assess its effectiveness in generating a forest fire susceptibility map. Other studies have also underscored the efficacy of these models in various domains, including the forecasting of pollutant concentrations and the analysis of their precursors [20,21]. Such efforts have yielded robust algorithms that hold promise for analyzing spatial and temporal patterns.
This progress enables the creation of scenarios in diverse fields, as demonstrated by Agudelo et al. [22], assessing tropical forest loss, and Celis et al. [16], analyzing wildfire development to anticipate potential future situations and impacts. These scenarios provide valuable insights for sustainable regional territorial planning, underscoring the need to adopt effective strategies tailored to the unique characteristics of each region.
Building on these studies, the primary objective of this manuscript is to analyze scenarios for reducing the wildfire risk of cover loss in a megadiverse zone in the Colombian Caribbean. This entails the identification of key factors driving these events and applying machine learning methods to construct a probabilistic wildfire risk model. The model is designed to formulate risk scenarios that facilitate the identification of crucial points. Through this assessment, we aim to propose cost-effective and sustainable approaches to accurately address these perturbations. This effort is valuable for informed decision making, underscoring the urgent need for comprehensive strategies and interventions. It aligns with the United Nations Sustainable Development Goal 15: Life on Land [23] and contributes to the Land Degradation Neutrality Challenge [24].
2. Literature Review
A wildfire is an uncontrolled fire that occurs in wildland areas, typically involving vegetation [1,5]. Wildfires can be ignited by natural causes (e.g., lightning strikes), and in Colombia, it is mostly caused by human activities (e.g., campfires, agricultural burning) [3,21]. These fires can spread quickly, driven by multiple factors (e.g., fuel availability, wind) and can cause significant damage to ecosystems and infrastructure [10,18].
Due to the aforementioned reasons, wildfires are a significant environmental concern globally, impacting ecosystems, human health, and socio-economic well-being. In Colombia, these phenomena have garnered increasing attention due to their frequency, severity, and diverse impacts [13,14,15,21]. Understanding the drivers, dynamics, and implications of wildfires in Colombia is essential for developing effective mitigation and adaptation strategies [10,16,22]. This section synthesizes key findings from academic research to elucidate the brief state of knowledge of wildfire research in Colombia.
2.1. Causes and Drivers of Wildfires
Anthropogenic activities, coupled with natural factors, contribute to the ignition and spread of wildfires in Colombia. Agricultural practices such as slash-and-burn farming, land clearing for cultivation, and illegal logging are primary human-induced causes [1,3]. The proliferation of these activities, often driven by socio-economic factors, exacerbates fire risk, particularly in rural areas where forest resources are crucial for livelihoods [5,16,22]. Moreover, climate change-induced alterations in temperature and precipitation patterns amplify fire conditions, increasing the likelihood of wildfire occurrence [12,15,17]. The theoretical lens of the socio-ecological system framework provides a useful framework for understanding the interconnectedness of human activities, environmental dynamics, and fire regimes in Colombia [22]. By conceptualizing wildfires as emergent properties of coupled human–environment systems, the framework highlights the complex interactions shaping fire regimes and underscores the importance of integrated management approaches [16].
2.2. Climate Change and Wildfires in Colombia
Climate change has emerged as a significant driver of wildfires in Colombia, exacerbating fire risk and altering fire regimes across diverse ecosystems [16]. Rising temperatures, shifting precipitation patterns, and changes in vegetation dynamics interact to create conditions conducive to increased fire occurrence and intensity [5,16,18,23,24]. Studies have documented a positive correlation between temperature increases and wildfire frequency in Colombia, with projections indicating a further escalation in fire activity in the coming decades [8,12].
Furthermore, changing precipitation patterns, including prolonged droughts and shifts in the timing and distribution of rainfall, contribute to drier conditions, fueling the ignition and spread of wildfires [15,16,18]. These climate-induced alterations in moisture availability and vegetation moisture content amplify fire risk, particularly in regions characterized by seasonal variability in precipitation. Nevertheless, more detailed analyses and target research are needed to create informed strategies to reduce wildfire impacts in Colombia.
2.3. Impacts of Wildfires
Wildfires in Colombia exert profound impacts, posing challenges for sustainable development and biodiversity conservation [7,9,22]. Forest loss, habitat degradation, and soil erosion are among the ecological consequences, undermining ecosystem resilience and biodiversity conservation efforts [8,10,11]. Furthermore, the socio-economic repercussions of wildfires are far-reaching, impacting rural communities heavily reliant on forest resources for sustenance and livelihoods. However, limited attention has been given to these impacts in academic research, primarily due to challenges associated with accessing relevant data and conducting quantitative assessments [15,16,22]. Displacement, the loss of income, and compromised food security exacerbate socio-economic vulnerabilities, particularly among marginalized populations, and these factors could yield a change in wildfire frequency [16]. The concept of social-ecological resilience offers valuable insights into understanding and addressing the impacts of wildfires. By recognizing the interconnectedness of social and ecological systems and the adaptive capacities of communities and ecosystems, resilience theory emphasizes the importance of fostering adaptive governance, building social capital, and enhancing ecological integrity to mitigate wildfire risks [6,18,19,22].
2.4. Wildfire Risk Prevention: Vulnerability and Machine Learning Forecast
2.4.1. Vulnerability Assessment
Vulnerability assessments play a crucial role in wildfire risk prevention by identifying socio-economic and environmental factors that exacerbate communities’ susceptibility to fire incidents. Factors such as proximity to forested areas, land use patterns, socio-economic status, and access to resources influence communities’ vulnerability to wildfires [1,4,7,22]. Integrating vulnerability assessments into wildfire management strategies enables targeted interventions to reduce risk and enhance resilience among vulnerable populations. Furthermore, vulnerability mapping facilitates the prioritization of resources and allocation of support to high-risk areas, contributing to more effective wildfire prevention and response efforts [2,6,8].
2.4.2. Machine Learning Forecasts
Machine learning algorithms offer promising tools for predicting wildfire occurrence, behavior, and potential impacts. By analyzing diverse datasets encompassing meteorological and land use variables, ML models can generate accurate forecasts of fire risk at various spatial and temporal scales [16,22]. These forecasts enable robust planning and decision making, allowing authorities to allocate resources efficiently, implement targeted prevention measures, and issue timely warnings to at-risk communities, as previous research has shown [12,15,19,20,21]. Moreover, machine learning-based wildfire models have been more recently used to facilitate scenario planning and risk assessment, supporting the development of adaptive management strategies that account for future uncertainties and changing environmental conditions [16,22].
2.5. Wildfire Management Strategies
Effective wildfire management in Colombia necessitates a comprehensive approach encompassing prevention, preparedness, response, and recovery efforts. Prevention strategies focus on addressing underlying drivers of wildfires, promoting sustainable land use practices, and enhancing public awareness and education [18,20]. Early detection and monitoring systems enable a timely response and intervention, minimizing the extent and severity of wildfires [16,22]. Community-based approaches, rooted in participatory decision making and local knowledge systems, enhance resilience and foster an adaptive capacity among vulnerable communities [23]. Integrating indigenous and traditional ecological knowledge into wildfire management strategies not only enhances the effectiveness of interventions but also promotes cultural continuity and social-ecological sustainability [16,24]. The adaptive co-management framework offers a theoretical basis for collaborative governance arrangements that empower local stakeholders, facilitate learning, and promote adaptive management in fire-prone landscapes, but always basing decision making on reliable data [10,12].
3. Materials and Methods
3.1. Study Area
This study focuses on the northern region of Colombia (Lat: 10 to 11.5; Lon: −74.5 to −73; Figure 1b), situated within three local administrative zones (i.e., Magdalena, Cesar, and La Guajira) and being part of the Colombian Caribbean (Figure 1a). This area is renowned for its remarkable microclimatic gradients, highlighted by an isolated mountainous expanse known as the Sierra Nevada de Santa Marta (SNSM). The Sierra Nevada is the highest coastal mountain range globally, soaring to an elevation of 5775 m above sea level—MASL [25]. This geographical uniqueness, coupled with its proximity to the equator, oceanfront location, and the prevalence of northeast trade winds, has bestowed the region with prominent ecological significance.
The area is characterized by an array of diverse ecological units, defined in this research as biomes (Figure 1c), that include dry and wet tropical forests, Sub-Andean forests, Andean forests, mountain moorlands, and even snow-covered territories. This exceptional ecological richness has earned it a reputation as a biodiversity hotspot. This is further exemplified by its high level of species endemism [9]. Notably, the region is home to two National Natural Parks, Tayrona, and Sierra Nevada, recognized as being among the most irreplaceable protected areas worldwide in terms of conservation efforts [25].
Despite its immense ecological significance, this region is under the looming threat of an elevated number of wildfires, primarily concentrated during February and March, a trend consistently observed in various previous studies (e.g., [26,27]). This distinctive characteristic makes it a particularly compelling area for study and holds great relevance in the modeling and prediction of wildfires. However, it is worth noting that this area lacks ground-based meteorological stations that could offer comprehensive data for rigorous analysis or model development. Consequently, data must be sourced from reanalysis datasets and satellite-derived information.
3.2. Atmospheric Characteristics Present during Wildfires Episodes
To identify functional diversity traits and atmospheric and edaphic conditions present in specific locations when a wildfire occurs, the days and zones with and without wildfires were selected for each of the 4 seasons of the year, with the idea of avoiding changes associated with the seasonality of the atmosphere, which could provide misleading conclusions. For this purpose, hotspot data from 1 January of 2016 to 31 December of 2021 were obtained from the Moderate Resolution Imaging Spectroradiometer (MODIS), featuring a 1 km spatial resolution, and the Visible Infrared Imaging Radiometer (VIIRS), offering a finer 375 m spatial resolution, distributed by the Fire Information for Resource Management System, FIRMS [28], which represent the presence of these events and have been previously used by several studies (e.g., [29,30]) including some in Colombia (e.g., [15,26]).
We identified a total of 6385 wildfire events in the region (Figure 2) and subsequently conducted composite analyses for each season throughout the year, following the approach outlined by Casallas et al. [31]. Additionally, anomaly maps were developed for each variable to enhance the understanding of geographical patterns. In this case, the mean of the days when the study area experienced at least one wildfire was compared with the mean of the days with no wildfires. Our analyses were based on hourly meteorological data sourced from the ERA5 Reanalysis dataset [32], with a spatial resolution of 0.25° × 0.25°, spanning the period from 1 January 2016 to 31 December 2021. It is noteworthy that ERA5 data have been widely validated by numerous researchers (e.g., [33,34]). The dataset encompassed essential meteorological variables, including daily mean temperature at 2 m, surface solar radiation, 2 m dew point temperature, 10 m meridional (v) component of the wind, 10 m zonal (u) component of the wind, leaf area index for both high and low vegetation, soil temperature, volumetric soil water content, leaf skin reservoir content, total daily evaporation and total daily precipitation. These variables were instrumental in discerning the most critical factors contributing to the development of wildfires in our study area.
Additionally, to obtain more information about meteorological behavior, the Canadian forest fire weather index (FWI) was calculated with inputs from ERA5 [36,37]. First, daily dry air temperature, relative humidity (RH), wind speed, and precipitation were used as inputs to calculate the Fine Fuel Moisture Code (FFMC), the Duff Moisture Code (DMC), and the Drought Code (DC). These, in turn, were used to generate the initial spread index (ISI) and the buildup index (BUI). And finally, we combined them to obtain the FWI and daily severity rating (DSR).
3.3. Machine Learning Model
3.3.1. Multicollinearity Analysis
Considering that the development of a robust forecasting model hinges on the quality of input data, we meticulously curated a comprehensive set of variables. These encompassed the aforementioned meteorological data sourced from ERA5 and included FWI indicators. To ensure the reliability of our model, we performed a multicollinearity analysis among these variables. Multicollinearity occurs when two or more independent variables exhibit high correlations, potentially undermining the ML model’s ability to accurately estimate the individual impact of each independent variable on the dependent variable [38,39]. Therefore, to identify multicollinearity, we used the variable inflation factor (VIF) among the predictor variables, and those with the highest VIF were subsequently excluded until the multicollinearity was reduced to less than 7 (Table A1), as advised by Kline [40], obtaining as a result nine input variables: evaporation, precipitation, leaf area index, leaf skin reservoir content, solar radiation, and from the FWI index, WIND, DMC, and DSR.
3.3.2. Machine Learning Structures and Statistical Validation
Once the VIF method was performed, we adopted two different ML approaches to determine the prediction models. These were appraised to set the one that generated the best results in terms of temperature forecasting [41]. For this purpose, we followed the work of Casallas et al. [21] and compared (i) random forest regression (RF) with (ii) an artificial neural network (ANN) (Figure 3 shows the ANN structure).
The RF algorithm employs a bagging approach, which trains a set of individual prediction models of decision trees in parallel using a random set of training data for each of them [42] to subsequently combine the result of the multiple predictions. In our RF configuration, we included as parameters 100 estimators (the number of decision trees) and squared_error (loss function) as a criterion, with a max depth of trees that holds until every leaf is pure (all data on the leaf have the same class). Regarding the ANN, the interconnected layers of nodes acquire information through training data that they use for their learning process by assigning random weights to each variable, testing the output and modifying this weight to identify the connection between inputs and outputs [43]. In this case, different combinations of layers (3D convolutional neural networks, convolutional long short-term memory networks, and dense neural networks) were tested (Figure 3) following a grid search method [44]. We tested 120 combinations of the types of layers, number of layers and neurons, optimizers, activation, and loss function to select the structure and hyperparameters that produced the smallest errors on the validation dataset. The model was constructed in the TensorFlow library [45], with help of Keras [46], in Python 3.9 and trained for 100 epochs. The loss selected was the mean square error (MSE), Adam [47] was used as an optimizer, and for the activation, the dense layer used the rectified linear unit (ReLU) [48], which were the hyperparameters identified as the best via the grid search method. Furthermore, we applied an early stopping method [49] and dropout rate to mitigate overfitting.
In terms of the input and output variables of the ML techniques, the input tensor contained the 9 variables resulting from the VIF method, and the output matrix was constructed with the combination of two datasets as outlined in Figure 4, where we matched the hotspot brightness temperature from MODIS/VIIRS with the date, latitude, and longitude of the air temperature from ERA5, replacing the pixel values of the latter with the data records of MODIS/VIIRS. For validation, the data were divided into two sets, the training set with 80% of the data and the test set with the remaining 20% for validation, and to prevent the possible bias generated by the unequal magnitudes of the variables, min–max normalization was applied.
To validate and compare the results of the two models, we established a threshold at the 95th percentile of the modified temperature dataset to classify the temperature value indicative of a wildfire. For the evaluation, the selected indicators of the model performance were the categorical statistics hit rate (HIT), false alarm rate (FAR), and the proportion of correctness (POC)—the reader is referred to the Supplementary Material of Celis et al. [20] for a complete explanation of the parameters, including the equation of the categorical parameters. Furthermore, given the spatial characteristics of wildfires, where the adjacent area of a pixel with a hotspot may also be fire-prone [50,51], we introduced a proximity evaluation. This evaluation involved situations where the model predicted values above the threshold (95%-tile) for a pixel, but the real condition did not involve a wildfire. In such cases, the pixel was considered correct if one of the surrounding pixels showed an actual wildfire occurrence.
The use of ANNs and RF enables the estimation of critical wildfire points based on diverse variables. These advanced techniques facilitate the capture of complex and non-linear relationships between meteorological variables and fire risk, thereby providing a robust foundation for risk prediction and assessment. However, given the fundamental connection between the accuracy of ML model predictions and the availability and quality of training data, it is essential to acknowledge the inherent constraints of this approach. While utilizing information from global models may offer benefits in regions with limited instrumentation, such as in this study, these data may introduce biases in meteorological variables due to limitations in representing complex physical processes, simplified assumptions, or errors in data assimilation. As a result, the inputs to ML models inherently incorporate bias.
3.4. Monte Carlo Simulations
To address the inherent uncertainty in input variables and to derive probabilistic outcomes rather than deterministic ones, we implemented Monte Carlo simulations, considering that several studies (e.g., [20,52]) have generated satisfactory results explaining these strong variations through statistical analysis [41]. To implement the Monte Carlo method, we determined the probability distribution for each variable (Table A2), and these distributions were displaced, aligning the median with the daily value of each variable. Subsequently, random values were generated from these latter probability distributions, constrained within the maximum and minimum values of each pixel. The outcome of this process comprised 100 simulations per day that were used as inputs of the ML-trained model, producing a range of probable outputs that were then classified into three categories of wildfire probability according to the modified temperature: low (below the 40th percentile), medium (between the 40th and 95th percentiles), and high (above the 95th percentile) [53]. It is important to note that only ERA5 variables were selected for generating the random inputs, and the fire weather index (FWI)-related indexes were derived from these simulation results.
The utilization of Monte Carlo simulations to assess uncertainty in ML models represents a valuable tool in risk management, such as wildfires. These simulations enable not only the estimation of uncertainty in predictions but also the consideration of inherent variability in the data and the models themselves. However, it is essential to acknowledge the limitation that not all probability distributions align exactly with every variable across all pixels. When the data exhibit non-standard characteristics, it can be challenging to find a probability distribution that fully captures their complexity. This discrepancy may result in error propagation, underscoring the importance of considering its impact on the precision of model outcomes.
3.5. Land Cover Analysis and Risk Assessment
After obtaining the wildfire probability, which serves as a representation of the hazard (in the following, the terms wildfire probability and hazard are used interchangeably), the next step involves assessing the risk of vegetation cover loss. To accomplish this, it is imperative to incorporate the vulnerability of the vegetation cover into the analysis. Therefore, in this study, we evaluated the global vulnerability to wildfires through an assessment of four distinct criteria. These criteria can be categorized into two ecological vulnerability indicators and two socio-economic vulnerability indicators. Specifically, we calculated the net susceptibility of vegetation and threat level of strategic ecosystems to represent ecological vulnerability, while the socio-economic vulnerability was assessed through a proximity indicator utilizing the wildland–urban interface (WUI) and response capacity. To ascertain the relative importance of each of these indicators, we carried out a multicriteria matrix, which we will elaborate on in the subsequent sections.
First, to determine the net susceptibility (NS) of vegetation, we used the method of [54], which is defined as the assessment of the susceptibility of vegetation to burn, suffer damage, recover from a wildfire, or spread fire due to its intrinsic traits and extrinsic factors and the influence of fire on ecological units. This process was divided into two criteria: the calculation of the raw susceptibility (RS) index and the net susceptibility (NS) index of vegetation.
The RS index (Equation (1)) assesses the pyrogenic condition of vegetation and the role of fire for each ecological unit type. This assessment is based on four key factors: (i) Type of vegetation cover: this is derived from the 2018 land cover map provided by the Colombian Environmental Information System (SIAC) [55]. (ii) Duration of fuel: This variable quantifies the duration of the ignition process, with shorter ignition times resulting in faster vegetation burning and consequently a greater area affected. It is measured in ignition hours [54]. (iii) Total fuel load: measured in ton/ha, this variable accounts for the total amount of fuel available [56]. (iv) Fire influence on ecological units: This refers to the classification of ecosystems vegetation according to the biomes, based on their susceptibility to fire [57]. We utilized the map of continental, marine, and coastal ecosystems from SIAC [55] for this classification. Although some of these variables should be evaluated locally, using satellite images give a good enough approximation, especially in terms of the meteorological resolution. The RS index is calculated following Equation (1):
where RS is the raw susceptibility of vegetation, FT is the rating of the vegetal fuel type, D is the rating of the duration, FL is the rating of the fuel load, and FI is the rating of the fire influence according to the ecological unit.
Each of these four variables is categorized into five levels, ranging from one to five, where higher values signify a greater combustibility. The classification system follows the fire risk protocol outlined by IDEAM [57] for all variables, except for fuel load and duration. For these, we adapted the categorization based on IDIGER [56] and Moreno et al. [58]. These adaptations were chosen to provide a more detailed classification, featuring five categories instead of four. It is essential to note that the assignment of the duration of fuel and total fuel load categories was made by the specific vegetation cover type. (For further details, please refer to Table A3 and Table A4). The next procedure was to calculate the NS index using Equation (2):
where NS is the net susceptibility of vegetation, RS denotes the raw susceptibility of vegetation, PP indicates the rating of the average precipitation and T signifies the rating of the average temperature of the last 30 years. NS combines (i) RS with climatic conditions (i.e., extrinsic factors) obtained from the SIAC. These climatic conditions encompass multiyear (ii) average precipitation and (iii) average temperature for each biome.
The second criterion to be evaluated to calculate the global vulnerability was the threat level of the strategic ecosystem. To this end, we used the classification of Etter et al. [59] and assigned values for each category as follows: critically endangered (5), endangered (4), vulnerable (3), minor concern (2), and not classified (1). In the third criterion, we identified the WUI as an indicator of socio-economic vulnerability by evaluating the proximity of these zones to urban areas [60]. To achieve this, we selected the peripheral areas of urban centers in a range of 2.5 km, and we classified them into four categories with their corresponding scores as follows: wet areas (1), urban area, transitory crops, artificial green areas (2), heterogeneous agricultural area, open areas without little vegetation, permanent crops, agricultural areas (3), and herbaceous vegetation, pastures, forests, and shrubs (4).
In the fourth criterion, response capacity, we used data from the capacity index [61], which evaluates the preparedness of each territory to effectively manage disaster risks and considers financial, socioeconomic, and institutional capacity. To create the multicriteria matrix (Casallas et al. [60]) for the obtained variables, we considered indicators commonly used by other researchers to assess wildfire land vulnerability (please refer to Table A3). For each indicator, we assigned a value of one (1) if it was present and zero (0) if it was absent. We then tallied the occurrences of each criterion to identify the most frequently used ones. This process allowed us to assign weights to each global vulnerability criterion based on their frequency of use, as shown in Equation (3):
where GV is the global vulnerability, WUI represents the wildland–urban interface, RC is the risk capacity, NT is the net susceptibility of vegetation, and SE represents the threat level of the strategic ecosystem.
Finally, to obtain the daily risk of vegetation cover loss due to wildfires, the vulnerability was first normalized on a scale from zero (0) to one (1), where 0 represents low vulnerability and 1 represents high vulnerability. Subsequently, the vulnerability was multiplied by the fire probability, resulting in the generation of daily wildfire risk maps, as is elucidated in Equation (4):
where GV is the global vulnerability and WP represents the wildfire probability.
3.6. Modeling and Management Strategies
After validating the wildfire probability model and assessing global vulnerability, we proceeded to create risk reduction scenarios by adjusting specific variables that have the potential to decrease it. These variables are associated with activities that can be implemented in the area and are aligned with different United Nations Sustainable Development Goals [23]. In this sense, the following adjustments were made to the inputs of the Monte Carlo simulations to lower the wildfire probability in four experimental scenarios. The variables subject to modification for the four hazard scenarios included (i) leaf skin reservoir content, (ii) soil temperature, (iii) relative humidity (used in the FWI indexes), and (iv) wind speed. Given the significant variations and differences in magnitudes and probability distributions among variables and pixels, we made these modifications based on values corresponding to 0.2 of the normalization of each pixel for each variable. Our approach involved selecting ninety-six days distributed throughout the year. These included eight (8) representative days for each month, capturing various behavioral patterns under different weather, soil, and vegetation conditions.
Regarding risk with the global vulnerability scenarios, we created three situations: (i) vegetation cover change, (ii) response capacity increase, and (iii) climate change scenario. The modified variables in the first scenario (vegetation cover change) were those related to the vegetation cover type, that is, fuel type, duration, fuel load, and fire influence on ecological units. Therefore, the vegetation cover was changed according to the native and most predominant vegetation of each ecological unit [62]. The only ecological unit that remained consistent was the paramo. This is because the vegetation cover categories do not differentiate between its native cover, including certain pasture and herb species, and disturbed vegetation (such as crops) [63], and both are categorized together. In addition, we adjusted the threat level of the strategic ecosystems of Etter et al. [59], because the restoration of the vegetation structure also entails the recovery of the geographical extent and distribution of ecological units, which are aspects considered in this index. Consequently, the same areas were assigned a minor risk concerning this variable (in the latter case, the paramo was included).
For the second vulnerability scenario (response capacity increase) the vulnerability was decreased based on the modification of the index capacity for all municipalities. This index encompasses three critical dimensions that define how municipalities respond to risk: financial, socioeconomic, and institutional capacities. Therefore, in this scenario, we focused on the variables addressed by institutional capacity, which involves investment and instruments allocated for disaster risk management [61]. This included the adoption of (i) the Municipal Committee for Disaster Risk Management, (ii) the Municipal Disaster Risk Management Plan or the Emergency Response Management Strategy, and (iii) the increase in the risk management investment per capita by 10% in knowledge and risk reduction. In cases where the initial investment was non-existent, the minimum investment allocation was directed toward Colombia’s 55th percentile. This value produced a notable change, while lower values resulted in non-significant changes.
In the third vulnerability scenario (climate change), we incorporated the notion that climatic factors induce fluctuations in intrinsic vegetation performance, such as humidity levels within plant tissues [54]. Consequently, we elevated the mean temperature by 1.5 °C [64], with the overarching aim of appraising alterations in climatic susceptibility. Based on these findings, we proposed specific strategies [65] tailored to activities that can be implemented within the study area. These strategies aim to induce targeted changes in critical variables, thereby influencing and mitigating wildfire risk [66]. This approach not only enhances the scientific understanding of ecological dynamics but also contributes significantly to sustainability objectives. Specifically, our scenarios and proposed activities align with key Sustainable Development Goals, notably, SDG 15: Life on Land, SDG 11: Sustainable Cities and Communities, and SDG 13: Climate Action.
It is important to mention that the hazard and vulnerability scenarios do not interact between them. This means that the hazard scenarios do not produce changes in vulnerability or vice versa [67]. Although this is a limitation that clearly produces uncertainty, we would not allow interactions between vulnerability and hazard since these relations are not very well understood, and understanding them is not the aim of this paper. Nevertheless, many studies have shown, including the last IPCC report, that many models do not allow vegetation to interact with the climate in a prognostic way [64]. Another element which is important to mention is that the data spatial resolution could be a source of uncertainty, and it would be desirable to produce regional studies with regional climate models to reduce and quantify the uncertainty related to the data.
In summary, we use a methodological approach that combines ML with traditional programming practices. This study addresses the extraction of crucial relationships between meteorological variables and hotspots through ML techniques. In turn, traditional programming is incorporated, which includes considering coverages and formulating risk scenarios. By integrating these approaches, our work seeks to effectively evaluate the efficacy of various preventive measures and risk management strategies. Throughout this study, we highlight the complementarity of these methodologies, thus creating a comprehensive framework for addressing the challenges associated with wildfires.
4. Results and Discussion
4.1. Wildfire Atmospheric, Soil, and Vegetation Characteristics
Here, we present the results on atmospheric, soil, and vegetation factors (Figure 5). These findings show significant variations in trends for all assessed variables on wildfire days and in specific affected zones. These variations are most noticeable during the first two seasons of the year (DJF and MAM), which coincide with peak fire occurrence. Solar radiation (Figure 5a,b) peaks during DJF and MAM, especially in areas and on days impacted by wildfires, suggesting a strong link between wildfires and high solar radiation levels (67% of wildfires occur when radiation levels exceed the third quartile compared to non-fire days). Similar patterns are observed during JJA and SON. Factors like cloud cover, seasonality, surface orientation, and slope may contribute to this, with the southern region experiencing longer radiation exposure compared to the northern slope, making it more susceptible to wildfires for a significant portion of the year. In summary, high solar radiation raises air temperatures [68], affecting fuel moisture and temperature, increasing the risk of wildfires [69].
In DJF and MAM, air temperatures reach their highest levels, with median increases of around 2 °C, particularly in zones where wildfires occur (Figure 5c). This temperature surge, evident in mean anomalies (Figure 5d), is most notable in the southern and southwest regions, with positive anomalies of up to 3 °C, where wildfires are common. While the overall mean temperature across the study area remains relatively stable throughout the year (Figure 5c), peaks are closely tied to fire development. Higher temperatures accelerate moisture evaporation from vegetation and surface materials, fueling fire spread [66,67,68,69,70]. Notably, wildfires can occur under both warm and relatively cold conditions, with about 35% of cases happening below the region’s median temperature. Thus, factors linked to low humidity are crucial, as relative humidity responds more significantly to weather conditions [71]. Additionally, JJA and SON also exhibit elevated temperatures during wildfires, though unlike other seasons, wildfires never occur under low-temperature conditions (approximately <20 °C).
Soil temperature mirrors air temperature trends, as shown in Figure 5e. However, notable differences arise in the northern region, where positive anomalies in soil temperature contrast with negative anomalies in air temperature. The increase in soil temperature may be due to several factors, including higher temperatures experienced by mountain slopes during sunlight hours compared to surrounding air masses at the same elevation [72]. This effect is exacerbated by low volumetric soil water content (Figure 6b) [73]. Conversely, air temperature is heavily influenced by its negative correlation with wind in zones with high mean speeds (Figure 6d) [74].
High temperatures, coupled with low precipitation [71] and increased wind speed, can lead to the advection of dry air, resulting in decreased humidity levels [75]. This aligns with the findings in Figure 5i,j, where days/zones with fires consistently show significantly lower relative humidity throughout the year (90% of wildfires occur in conditions below the median of the entire zone), especially during DJF and MAM. The decline in humidity also stems from the greater increase in saturation vapor pressure due to higher temperatures, surpassing the relatively small rise in actual atmospheric moisture content [76]. Low humidity levels heighten wildfire risk by reducing the moisture content of dead fuels. Similarly, soil moisture is affected by the same factors, as evidenced in Figure 6a,b, where volumetric soil water content also markedly decreases on days/zones impacted by wildfires [77]. These decreases may result from insufficient precipitation, as shown in Figure 5j,k.
In DJF, the season with the highest wind speeds, most wildfires occur under conditions with winds faster than the median, as shown in Figure 6c. Notably, wildfires rarely happen in zones or days with the fastest winds (>2.2 m/s), associated with trade winds from December to March. These winds bring moist air from the sea, causing topographic cloudiness on the high elevations of the north flank, which receives the wind directly [78,79]. This pattern promotes precipitation, acting as a wildfire deterrent. However, wind behavior varies in other regions (Figure 5d) where speeds are slower due to mountainous terrain. In areas like the southwest flank (leeward), where most wildfires occur, descending winds lead to heating and drying. On the southeastern side, stronger trade winds displace clouds, resulting in reduced rainfall [72,80,81].
Following this pattern, during MAM, JJA, and SON, the wind behavior differs due to the low influence of trade winds in the northern region. As a result, the distinct trend of higher wind speed emerges more clearly, as depicted in Figure 6c. This is closely associated with the fact that as surface temperatures rise, warm air descends, leading to a decrease in pressure and subsequently an increase in wind speed due to pressure gradients that should follow continuity [82,83]. These wind-related consequences are particularly prominent during the JJA season, coinciding with the concentration of wildfires on the northeast slope in contrast to the rest of the year. This shift in wind behavior is likely due to the diminishing influence of trade winds most notably from June to September and the dominance of generally weaker winds from the southwest [15,27,72].
Despite the anticipated high temperatures and strong winds, which typically increase evaporation rates, the observed evaporation during DJF and MAM (Figure 5g) shows reduced values. This trend is particularly evident in the southern and southwestern regions, where most wildfires occur during these seasons, as depicted in Figure 5h. The decrease in evaporation can be attributed to factors like inefficient evaporation due to soil drying (Figure 6a). In such conditions, the soil’s specific humidity falls significantly below its saturation point [84]. This observation corresponds with the notable decrease in volumetric soil water content (Figure 6a,b) on the western and southern slopes, where most wildfires occur during these seasons. Conversely, patterns during JJA and SON indicate equivalent conditions with and without wildfires, likely because wildfires are mostly located in the northeast, which generally has higher humidity compared to the affected areas during DJF and MAM.
Regarding vegetation, leaf skin reservoir content showed significant variability throughout the year, particularly in tropical dry forests, which experience extreme seasonal fluctuations [85]. This variability, influenced by factors affecting various ecological units, could be linked to vegetation disruptions from previous wildfires or anthropogenic modifications, reducing the ability to regulate transpiration rates [86]. As a result, leaf skin reservoir content levels follow environmental variations, especially during drought periods. This trend was most pronounced during DJF and MAM, with the lowest values observed during days/zones with wildfires, potentially due to leeward locations and limited soil water availability [87]. Similarly, JJA and SON also showed lower levels during days/zones with wildfires. Throughout the year, 83% of wildfires occurred below the median leaf skin reservoir content for the entire zone.
Additionally, other vegetation indicators such as the LAI for both low vegetation (crops, mixed farming, grasslands, etc.) and high vegetation (trees, forests) showed negative anomalies during days/zones with wildfires (Figure 6h–j), indicating stress conditions within the vegetation. However, they exhibited opposite behavior seasonally (Figure 6g–i), suggesting a need for future research using Landsat imagery and land use classification to better understand this dynamic [16], although this is beyond the scope of this paper.
Low vegetation with high LAI showed a minor tendency to be affected by wildfires during DJF and MAM (Figure 6i). However, this trend was more pronounced in JJA and SON when fires occurred only under above-average conditions [88]. Conversely, the LAI of high vegetation remained relatively steady throughout the year on days without wildfires, with a significant upward trend observed only during DJF and MAM (Figure 6g), indicating geographical variations in fire incidence. The trend of wildfires occurring at elevated LAI levels for high vegetation (Figure 6g) suggests that fires are concentrated in areas with dense vegetation, consistent with evidence from other cases [89]. However, further research using higher resolution datasets and official governmental data [16] is necessary to fully understand the role of vegetation in fires.
Despite high LAI values indicating significant rainwater interception by foliage [90], vegetation exhibited the lowest leaf skin reservoir content during DJF and MAM (Figure 6). This inconsistency may be due to higher plant biomass represented by the LAI, resulting in increased fuel availability [91] when vegetation experiences water stress. Additionally, foliage loss, a physiological adaptation to water deficit [92], contributes to increased fuel availability. This situation is further exacerbated by increased biomass during the wet season (SON), leading to elevated fuel availability [69] in the subsequent dry season (DJF).
It is important to mention that all the aforementioned discussion must be complemented with field campaign measurements to reduce the uncertainties as much as possible. Although this type of high-resolution data is important, it is out of the scope of this paper but should be taken into consideration in future research.
4.2. Model Evaluation and Monte Carlo Simulation
To evaluate the forecasting performance of deterministic and probabilistic models obtained from Monte Carlo simulations, we conducted a statistical assessment using 20% of the data. High-temperature events were defined based on the 95th percentile, as described in the method. Overall, both ANN and RF deterministic models demonstrated a satisfactory performance in detecting event occurrences and non-occurrences. However, they showed advantages and disadvantages compared to each other (Figure 7d). RF performed better than the ANN in predicting high-temperature events (HIT = 86.0% for RF and 80.3% for ANN). Conversely, RF had a higher false alarm rate (FAR = 30.4%) compared to ANN (FAR = 23.3%). Regarding the probability of detection (POC), ANN yielded slightly better results with a performance of 96.3%, while the RF model achieved 95.0%.
In the case of the probabilistic model, our focus was primarily on testing temperatures corresponding to high class, since they are the ones related to fires. The results (Figure 7d) revealed that the ANN model achieved an HIT, FAR, and POC of 87.9%, 28.3%, and 95.7%, respectively. The RF model yielded values of 95.6% for HIT, 47.9% for FAR, and 88.3% for POC. Upon evaluation, it became evident that while the RF model excelled in predicting high-class values, the ANN model demonstrated superior performance, particularly in terms of the POC and especially in the FAR parameter. The ANN model exhibited a better ability to recognize trends and accurately identify high-temperature probabilities.
Further analysis of the statistical parameters based on geographic location, as depicted in Figure 7, reveals distinct performance characteristics. The southwestern and southern regions of the SNSM demonstrated better model performance for high-temperature occurrences (HIT) (Figure 7a) and presented the lowest FAR (Figure 7b). This is probably due to the higher frequency of wildfires in these areas, which facilitates the model’s training. Conversely, the northeast slope displays a high HIT but, similar to the northern site, it exhibits a higher number of false alarms. This could be linked to the fact that this area generally presents unfavorable conditions for fires, such as high humidity, and therefore, the anthropogenic factor may be more important compared to other areas [27,72], making the prediction more challenging.
The eastern slope achieves intermediate–high precision, while the highest elevations on the north side, characterized by the lowest wildfire incidence, display a good FAR but a low HIT. This is primarily linked to a significant class distribution imbalance, which, in this context, corresponds to a greater number of non-ignition temperatures in comparison to wildfire temperatures, especially in high-altitude regions with fire-independent ecological units. Such class distribution imbalances have been known to pose challenges in regression, as documented in various studies related to forest fire prediction that use classifier learning algorithms [50,51,93].
In this study, we utilized an ANN to establish a deterministic model. Subsequently, we integrated this model into Monte Carlo simulations to derive probabilistic results, offering insights into the likelihood of different daily temperature classes. Figure 8a illustrates the temperature scenario on a day without wildfires, showcasing the actual temperature, the ANN-generated forecasts, and the corresponding probabilistic outcomes. These results indicate a low probability of the area experiencing high temperatures, with the highest likelihood observed in the southwestern region (approximately 15%) and probabilities ranging from 0% to 6% in other areas. Medium- and low-temperature classes exhibit higher probabilities across the entire region as expected due to the absence of fires that day.
Figure 8b depicts a different situation with two real fire hotspots. Here, the deterministic results also highlight two unusual temperature spikes right next to the real hotspots. The probabilistic outcomes indicate a larger area with a high probability of belonging to the high-temperature class, approximately 80% in the southwestern region and 57% in the northeastern region, where it is observed that these areas include the real fire hotspots, suggesting that even though an ignition occurred at a specific point, nearby zones also exhibit favorable conditions for wildfires. Furthermore, the medium-temperature class shows probabilities primarily ranging from 12% to 30%. Low-temperature class dominance is observed mainly in the high altitudes of the northwest. It is important to mention that selecting other days as examples leads to the same conclusions. Therefore, these results demonstrate that the model is capable of being utilized in the creation of experiments developed from sustainability strategies, contributing primarily to sustainability goals, i.e., SDG 15: Life on Land, SDG 11: Sustainable Cities and Communities, and SDG 13: Climate Action.
4.3. Land Cover Characteristics and Risk
The vulnerability assessment results (Figure 9d) indicate that medium vulnerability predominates across the study area. The highest vulnerability falls between medium and high vulnerability, primarily observed in tropical dry forest ecological units located in lower regions. This heightened vulnerability in the zonobiome is linked to elevated average temperatures and the proliferation of grass and herb vegetation. These types of vegetation are more susceptible to ignition due to their low moisture content, limited leaf area, and high lignin percentages [54]. Their expansion is largely attributed to agricultural and livestock activities. Additionally, areas near urban centers, particularly those within wildland–urban interface (WUI) zones, exhibit notable vulnerability levels.
The Andean, sub-Andean, and humid tropical zonobiomes exhibit vulnerability levels mostly in the medium range. The highest vulnerability values are concentrated in the WUI areas, particularly in the latter two zonobiomes. These higher vulnerability levels are associated with vegetation cover that is more susceptible to fire, largely due to the expansion of crop and pasture lands [94]. These changes in land use are driven by favorable environmental conditions and, in recent years, the increasing water scarcity caused by palm and banana crops [27]. During the dry season, the hydric deficit causes lowland farmers to relocate their animals to higher altitudes in the Sierra to access water resources, which has exerted additional pressure on the highland areas [27].
It is noteworthy that, according to the Red List of Ecosystems [59], a significant portion of these previously mentioned ecological units is classified as vulnerable or in danger due to the ongoing processes of ecosystem transformation. However, in these regions, values slightly below medium vulnerability dominate. The prevalence of non-fire-prone vegetation, represented by trees typical of forest biomes, contributes significantly since these trees exhibit higher interstitial moisture content in their tissues and boast a substantial leaf area [54]. Additionally, lower than average temperatures and higher than average precipitation levels characterize these areas in contrast to ecological units situated in lower thermal zones.
In the aforementioned areas, vulnerability is primarily determined by the prevalence of fire-sensitive ecological units, which naturally inhibit fire ignition and spread. Factors contributing to this natural fire resistance include closed canopies blocking direct solar radiation, low wind speeds within vegetation cover, and high humidity levels from ample rainfall and robust evapotranspiration within dense vegetation [54,95,96]. Fire occurrence in these units is likely due to anthropogenic activities igniting fires or altering the landscape. These units lack adaptations for fire resistance, leading to significant disruptions in natural cycles and extensive damage to flora and fauna. Deforestation and habitat fragmentation further increase fire incidence by drying out forests and increasing fuel load, exacerbating damage [4], particularly during drought conditions.
There are also ecological units in the study area that are influenced by fire to a lesser extent. In these areas, fires often initiate in the most vulnerable vegetation types and then spread to other areas depending on the characteristics of the available fuels, including their quantity, humidity, and spatial distribution [54]. At the spatial scale evaluated in this study, none of the ecological units fall into the fire-dependent category. However, a comprehensive understanding of the role played by each ecological unit requires field campaigns. These campaigns are essential for refining the classification and obtaining a more accurate assessment. This means that fire is not a natural part of their ecological processes, and these ecological units lack adaptive strategies to cope with wildfires [54].
Vulnerability between low and medium ranges is concentrated in the highest part of the SNSM, which corresponds to the paramo orobiome and part of the Andean orobiome, which is explained by the fact that these areas are isolated from urban centers, and this reduces social vulnerability. Moreover, the ecological units located in this area are fire-sensible and fire-independent (not susceptible), having a minimum probability of natural fire occurrence due to physiognomic classification and structural factors as well as extreme climatic conditions with low average temperatures and high humidity. It is essential to acknowledge that for the species inhabiting these ecological units, fire can have catastrophic consequences and may even lead to the local extinction of certain species [54]. Furthermore, it is worth noting that grazing animals pose a significant challenge in the paramo, as their presence contributes to desertification processes [89].
In terms of social vulnerability, the municipalities in the study area exhibit a low response capacity (16% on average) to perform effectively to the management of wildfire risk. They face difficulties primarily in the financial and socio-economic aspects, and they lack the necessary tools and investment for disaster risk management. After obtaining and normalizing both the global vulnerability and wildfire probability, we multiplied these values to calculate the overall risk. An illustrative example of this is presented in Figure 9a–c, which corresponds to 1 March 2021. The map highlights areas with a risk level of up to 61% in the south and southwest, 55% in the northeast, and 47% in the east. This underscores the pressing need for a mosaic of strategies that integrate different SDGs, addressing social vulnerability and enhancing the sustainability of wildfire risk management efforts.
4.4. Machine Learning Risk Management Strategies Evaluation
We create wildfire risk scenarios by adjusting both hazards (four scenarios) and vulnerability (three scenarios), providing a basis for developing sustainable management strategies guided by fire-smart approaches. It is important to note that while some modified variables may be correlated, their behavior depends on various environmental conditions [71,74,97,98]. Therefore, each scenario focuses on modifying a single variable. Additionally, some risk reduction strategies proposed for each situation may generate a specific scenario, while others may combine two or more effectively.
The outcomes of the vulnerability scenarios (Figure 10) show a significant reduction, particularly in the vegetation cover scenario, where the current cover was adjusted based on the native and predominant vegetation of each ecological unit, resulting in a lowered threat level for strategic ecosystems. In this scenario, areas dominated by grasses and herbs within the Sub-Andean, Sub-Andean azonal orobiomes, tropical humid, and tropical alternohygric zone biomes were transformed to feature a predominance of tree cover [94,99]. Similarly, within the Andean biome, areas with grasses and herbs were replaced by trees and shrubs [63,100]. The most notable reductions were seen in the tropical humid zonobiome, Sub-Andean orobiome, and Andean orobiome, followed by the paramo orobiome (Figure 10a). This decline in vulnerability was primarily attributed to the sustainable recovery of native vegetation cover, leading to significant improvements in the status of threatened strategic ecosystems.
In contrast, the scenario involving response capacity, characterized by the implementation of the Municipal Committee for Disaster Risk Management, adoption of the Municipal Disaster Risk Management Plan, and execution of the Emergency Response Management Strategy, coupled with an augmented per capita investment in sustainable risk management (Figure 10b), resulted in relatively consistent decreases throughout the entire study area. This was due to municipalities generally exhibiting similar index values. On the other hand, in the climate modification scenario (Figure 10c), featuring a 1.5 °C temperature increase, the observed changes were uniformly distributed across the study area, impacting all zones equally.
In the context of risk calculated with the three vulnerability scenarios shown in Figure 11, the southern, southeastern, and northeastern regions experienced more significant changes across all scenarios. The most substantial risk reduction, totaling 12.4%, occurred through the vegetation cover scenario (Figure 11a) in the southern and northeastern regions. Additionally, reductions of approximately 7% were observed in the eastern slope (Lat: 10.75 and Lon: 73.27) at medium and high altitudes. These regions are particularly vulnerable due to alterations in vegetation cover compounded by adverse atmospheric conditions, especially during DJF and MAM. The response capacity scenario (Figure 11b) showed the main reductions in the south and west regions, with consistent changes across them. While the climate change scenario resulted in a relatively low increase in risk, it is essential to note that the actual impacts of wildfires involve a range of indirect changes, and our understanding of these complex interactions remains limited [101].
Risk assessments with the four hazard scenarios (Figure 12), showed the most significant reduction in risk occurring on the western slope and the southern region of the SNSM. Additionally, a substantial risk reduction was observed in the northeastern region throughout the year, especially during MAM, JJA, and SON. This pattern is likely due to these areas frequently experiencing wildfires, particularly during these seasons marked by unfavorable dry conditions, potentially exacerbated by human activities leading to ignitions near populated areas. However, further research is needed for a more thorough analysis. The eastern slope also demonstrated significant risk reductions throughout the year, except for the SON season, likely because September and October are the months with the highest precipitation in this region [27,102]. This observation is significant because, despite prevailing easterly winds that should bring humidity from the ocean, the presence of the Serranía de Perijá (Lat: 10.88 and Lon: −72.96), a mountainous formation acting as a barrier, impedes humidity influx (resulting in a rain shadow effect) [80]. Additionally, the region experiences relatively drier atmospheric conditions [72].
In the leaf skin reservoir content, relative humidity, and wind velocity scenarios (Figure 12a–c), risk reduction was notably more prominent across the entire region during DJF and MAM, which coincided with the months witnessing the highest number of wildfires. In contrast, during JJA and SON, these enhancements were more concentrated in specific zones. Within the northern and northwestern sites (Figure 12), the most significant improvements were observed in the risk scenario involving an increase in leaf skin reservoir content (Figure 12a). These improvements were comparatively minor in the other risk scenarios, primarily due to the limited incidence of wildfires in these areas. This is owed to their favorable relief conditions for conducting humid winds, promoting the formation of cumulus clouds that precede precipitation [63,72,100]. Furthermore, these areas generally experience lower temperatures and represent the most humid slopes when compared to the east and west slopes [27], especially during the initial two seasons of the year, DJF and MAM.
The soil temperature decrease scenario (Figure 12c) yielded the most substantial reduction in lower altitudes (<1300 m) of the southern and western regions, followed by the leaf skin reservoir content scenario. In the east, the scenarios of wind velocity and leaf skin reservoir content performed best, while in the central region, particularly at altitudes above 3000 m, leaf skin reservoir content provided the most effective results, especially during DJF and MAM, with noticeable differentiation. RH exhibited its primary risk reductions during DJF and MAM, with more uniform changes across the entire region. However, unlike other scenarios that showed the most significant risk reduction in the south and west during JJA, the RH scenario displayed its highest decreases concentrated in the south and east, where more wildfires occurred during this period.
4.5. Strategies for Managing Risk with Vulnerability Scenarios
Based on our previous results, it is crucial to align actions with broader global sustainability principles [23], addressing multifaceted challenges by integrating environmental, social, and economic considerations. By incorporating Sustainable Development Goals (SDGs) into our approach, we aim not only to protect ecological units from potential wildfires but also to contribute to global efforts to combat climate change, preserve biodiversity, and foster resilient ecosystems (SDGs 13, 15). It is essential to note that strategies must be tailored to the natural wildfire regime of ecological units, and our study area falls into the category of non-fire-prone. Unlike fire-prone ecological units, which may benefit from managed activities like prescribed burns but suffer from fire suppression [2,91], the ecological units in our study area need to be isolated from fire and focused primarily on wildfire prevention [103]. Therefore, restoring their original resistance by addressing their structure and composition is imperative [104]. Various factors, including logging, burning, and natural events, may have rendered certain zones susceptible to fire, with the potential to become fire-prone.
Given this, the first vulnerability scenario (over the type and threat level of the strategic ecosystem) is rooted in the introduction and invasion of non-native grasses, which has resulted in a continuous fuel source. As fires become more frequent and extensive, cover vegetation shifts towards more fire-prone vegetation [105,106]. In this way, reintroducing native vegetation cover might enhance ecosystem resilience [107], contributing to the long-term sustainability of the ecosystem. This aligns with global conservation efforts and Sustainable Development Goal 15, which emphasizes the importance of protecting and restoring terrestrial ecosystems.
The proposed strategy to mitigate vulnerability involves the restoration, preservation, and conservation of low-flammable native plant species. For instance, in some ecosystems, broad-leaved trees can aid in canopy closure, impeding the forest floor from drying out and preventing the growth of flammable grasses and ferns [105,108]. This helps reduce the accumulation of fine fuels on the forest floor. The careful selection of plant species is crucial in this context [108,109]. In addition to native species restoration, a comprehensive sustainability strategy necessitates the active management of invasive species, such as pyrophilous grasses and shrubs. Invasive species, often exacerbated by previous fires, have spread across various areas affected by severe deforestation [12]. For example, the northern site of the park experienced extensive deforestation, with approximately 120,000 hectares cleared during 1979–1985 [27]. This deforestation led to a significant increase in fire-prone vegetation.
Additionally, the prevalence of class VII soils across the entire mountain system indicates suitability for forestry purposes [27,110]. These soils are characterized by steep slopes and have a high potential for severe water erosion due to heavy rainfall combined with inadequate drainage. This suggests the potential for sustainable land use through restoration and conservation efforts, supported by habitat banks. Organizations required to comply with mandatory environmental offsets and investments could establish extensive land for preservation, restoration, and sustainable use activities for biodiversity conservation. Under this approach, the owner of the productive project only pays if the expected environmental mitigation benefits are effectively achieved [111,112]. This strategy can increase financial resources dedicated to conservation and reforestation efforts, aligning with the objectives of SDG 15.
It is crucial to recognize that implementing such measures would require discontinuing activities like agriculture and livestock farming in the Andean and Sub-Andean biomes. These areas overlap with the National Park and indigenous reserves, encompassing both crops and livestock at various altitudes, including paramo ecosystems [27]. Consequently, a special management regime (REM) is in place, necessitating coordinated actions by the environmental authority and the special indigenous public authority. This collaborative effort aligns with global sustainability goals, emphasizing the harmonious coexistence of human societies and ecosystems in Goal 15 [23], ensuring that the SNSM can accommodate social systems, including indigenous communities in the highest altitudes, without compromising ecological systems.
As part of a strategy to provide alternatives for local farmers and indigenous communities, we recommend introducing mosaic agroforestry schemes in the lower regions of the SNSM. This involves planting diverse native tree species, including both timber and fruit trees, to create new economic opportunities for rural and indigenous populations [108]. Given that class VI soils designated for subsistence crops should also incorporate conservation practices or be associated with tree cover [27], adopting such an approach ensures that the land remains productive and ecologically sound. To implement this efficiently, enhancing the transportation of agricultural products through infrastructure development and strengthening business organizations among small producers is essential. This aligns with the principles of the Colombian Green Growth Policy [113] and the integration of ecosystems in poverty reduction and development processes (SDG 15).
In the context of the second vulnerability scenario (respond capacity increase), enhancements to the risk management capacity index were implemented across each municipality. The establishment of Municipal Committees for Disaster Risk Management, the development of Municipal Disaster Risk Management Plans, and the formulation of Emergency Response Management Strategies, combined with increased per capita investment in knowledge and risk reduction, yielded significant reductions in vulnerability throughout the region, within the scope of the respond capacity increase scenario.
The strategies related to the adoption of these measures encompass the establishment of different measures, including mobility corridor signage in environmentally critical areas, the continuous monitoring of potential high-risk zones, the control of pyrogenic species, road maintenance, and public outreach campaigns, with a particular emphasis on human–forest interactions, especially during dry conditions [114]. It is imperative to keep the community informed about the ongoing risk management initiatives and the progress being made by the pertinent institutions. Specific initiatives leveraging advanced technologies, such as ML, have also been integrated into interventions. Examples include the optimization of watchtower locations for forest fire monitoring and the development of an interactive fire-spread simulation tool for fire managers [115].
In the context of the third vulnerability scenario (variation in climatic conditions), where a +1.5 °C increase in average temperature is anticipated [64], there is an urgent need to counteract the impacts of climate change. Shifting the focus towards adaptation efforts is crucial as there has been a disproportionate emphasis on mitigation alone, especially in developing countries with a small percentage of pollution but potentially large impacts. Both approaches play distinct roles in reducing damages [116]. Enhancing ecosystem resilience can be achieved by intensifying the monitoring of stress precursors, promoting further research, and advancing ecological education. These efforts will facilitate institutional investment in critical areas to assess the future contributions of adaptation activities [117]. It is essential that these endeavors complement programs established by administrative institutions aiming to reduce anthropogenic stressors, including those related to people’s lifestyles. Diverse options should be offered, independent of forest resources, to ensure effective climate change adaptation.
4.6. Strategies for Managing Risk with Hazard Scenarios
Regarding hazard scenarios, it is essential to note that while various plant functional traits influence vegetation flammability, the primary determinant is leaf moisture content [86]. Therefore, to reduce the risk, for the first scenario we increased leaf skin reservoir content. This action favors vegetation’s natural tendency to suppress ignition and fire spread, effectively minimizing flammability [105]. To this end, it must be recognized that while soil water regulates root water uptake strategies, leaf skin reservoir content is highly dependent on the intricate morphological and physiological mechanisms of individual plant species [109,118]. This behavior is especially evident during drought periods [86] as drought has proven to be the most critical threat to plants, surpassing other environmental factors [119].
To support acclimatization, the promotion of increased leaf skin reservoir content can be achieved by selecting native vegetation species with strong adaptability to soil water fluctuations, especially in regions with variable climatic and meteorological conditions. This approach may involve the incorporation of deep-rooted plants as their ability to access water from deeper soil layers makes them well suited to thrive during stressful conditions [120,121]. Examples of species might include Aspidosperma polyneuron (tropical dry forest areas) with a positive response to spontaneous precipitation during dry months [122] and Guaiacum officinale [89]. This promotes sustainable practices in afforestation, contributing to the broader goals of preserving and restoring terrestrial ecosystems outlined in SDG 15. Such an approach may be combined with seed banks and nurseries to support restorations, keeping the resources of high genetic variability species since some vegetation mosaics prevent wildfire spread [123,124,125].
It is crucial to note that while specific vegetation types may dominate certain areas, encouraging the coexistence of diverse species and cover types helps prevent soil water deficits caused by competition among plants. Therefore, afforestation efforts should be strategically planned, considering gradual planting and the removal of invasive species to avoid water resource conflicts [121]. Enhancing water retention can also be achieved by utilizing hydrogel material [126] and implementing soil structure management. Although precipitation plays an important role in recharging water sources, it does not directly serve vegetation. Instead, it is converted to soil moisture through the process of infiltration before being absorbed by plant roots [98]. Moreover, the restoration and conservation of aquatic systems are crucial for maintaining a sustainable water source available for vegetation.
The subsequent strategy involves the rigorous management of buffer zones and the strategic placement of forest corridors to establish connectivity among all the ecological units. This approach enhances the efficient flow of water, promotes microclimate restoration, and mitigates the impacts of forest edges resulting from fragmentation [89,94]. These edge effects, which extend 2–3 km deep into the forest, have been shown to influence soil temperature, wind, sub-canopy humidity, and moisture levels, ultimately reducing desiccation risk and minimizing fuel accumulation [106,127]. Given the direct correlation of these effects with the increased occurrence of megafires [128], the implementation of the aforementioned strategies is of paramount importance for mitigating their impacts.
To increase relative humidity, the second scenario, a crucial strategy involves preserving the integrity of water bodies such as rivers and lakes as they naturally contribute to higher humidity levels as a result of continuous water evaporation. This is particularly important in areas with a pronounced hydric deficit, in the warm lands of the western and southeastern sides, mainly caused by extensive agro-industrial monocultures [27]. Moreover, restoring and conserving dense vegetation can enhance relative humidity by facilitating substantial water release through plant transpiration. The canopy layer also retains humidity within the forest by minimizing its exchange with the external atmosphere [120].
To address the third hazard scenario, mitigating soil temperature rise involves employing shade-providing vegetation and reducing direct exposure to solar radiation. This can be coupled with watering practices or controlled supplemental irrigation systems, which help alleviate thermal stress [108]. Enhancing water retention through improvements in soil’s physical and chemical properties can further optimize this approach [98]. Proper land use planning should ensure that areas near restored ecosystems are compatible with conservation and reducing soil temperature. This planning is essential since soil exposure caused by factors like cattle trampling can diminish the soil’s water retention capacity, ultimately favoring fire incidents. These burns, often associated with grazing, significantly influence the composition and structure of ecosystems such as paramo ecosystems in Colombia [12], leading to species mortality and soil exposure. The undertaken measures align with specific SDGs, including SDG 15 (Life on Land) for biodiversity conservation and SDG 13 (Climate Action) for mitigating thermal stress.
To mitigate scenarios involving reduced wind velocity, the fourth scenario, strategic approaches can be employed, including the use of tree belts or a green fire barrier technique [108,128]. These strategies are particularly effective in high-risk areas with strong winds, often associated with drought conditions. The concept involves planting low-flammable broadleaf evergreen trees strategically, creating barriers approximately 20–35 m wide to prevent and obstruct the spread of wildfires. This supports a substantial increase in afforestation efforts aligned with SDG 15 targets. This not only acts as a firebreak but also promotes a moister microclimate. This approach has demonstrated successful outcomes, especially when implemented in areas adjacent to locations where human activities are prevalent as these are typically linked to wildfire incidents.
Our findings deepen our understanding of the intricate dynamics within complex systems, revealing crucial connections that clarify the interplay between various factors. This increased clarity enables a more comprehensive visualization of key policies and interventions, establishing a cohesive framework that strengthens sustainability through synergistic strategies. Specifically, our research sheds light on the genesis of a leverage chain—a scenario where interconnected points of influence mutually reinforce each other [129]. These implications extend to the improvement of strategic initiatives and interventions, promoting a more integrated and harmonized approach to sustainability across diverse domains.
5. Conclusions
In this study, we examined wildfires in a Caribbean region known for its diverse ecology, topography, and weather. The area’s ecosystems lack adequate defenses against increasing wildfires, posing a concern. To tackle this, we created risk scenarios to gauge how changing conditions could lower overall risk.
We found that wildfires are influenced by various factors, with solar radiation, air, and soil temperatures being notably higher during wildfire days throughout the year. Wildfires occur in both high and low air temperature areas but are more common in conditions of low humidity, precipitation, leaf moisture, and soil water, especially during certain seasons. Northeast winds in winter and spring raise humidity in the north, lessening fire risk there but exacerbating it in the southwest and east. Improving spatial data resolution through regional modeling or downscaling is essential to reduce uncertainty, though in situ data are crucial for validation.
We evaluated two machine learning models and found artificial neural networks (ANNs) to be the most effective, especially when combined with Monte Carlo simulations, for predicting wildfire occurrences. We assessed global vulnerability, finding medium vulnerability across the region, varying with altitude. Lower altitudes are most vulnerable due to combustible fuels and wildland–urban interface (WUI) areas. Vulnerability decreases with altitude, indicating human interventions and past fires may have heightened vulnerability. Integrating wildfire probability and global vulnerability, we developed risk scenarios to identify influential variables in fire regimes across different zones and seasons. Managing leaf moisture may mitigate risk at higher altitudes, while soil temperature and wind management are crucial at lower altitudes.
Our strategies align with Sustainable Development Goals, emphasizing reintroducing native vegetation and agroforestry at lower altitudes and institutional interventions for vigilant monitoring and management. For hazard scenarios, restoring adaptable vegetation, conserving water bodies, and establishing green fire barriers are recommended. Adapting policies and interventions requires a holistic approach, focusing on data collection in high-altitude environments and habitat preservation. Comprehensive data acquisition is crucial for predicting and analyzing wildfires in the face of growing human and climate pressures, supporting landscape protection efforts.
Author Contributions
A.C. (Ailin Cabrera), conceptualization, data curation, methodology, software, validation, formal analysis, investigation, visualization, and writing—original draft. C.F., conceptualization, data curation, methodology, software, validation, formal analysis, and investigation. A.C. (Alejandro Casallas), conceptualization, data curation, methodology, software, validation, formal analysis, investigation, and writing—original draft. E.A.L.-B., conceptualization, methodology, validation, formal analysis, investigation, and writing—original draft. All authors have read and agreed to the published version of the manuscript.
Funding
This work was partly supported by Sergio Arboleda University (No. EI.BG.086.21.001) and CYTED-RED PREMIA through the project “RED DE PREVENCIÓN, MITIGACIÓN Y REHABILITACIÓN DE ÁREAS AFECTADAS POR INCENDIOS FORESTALES (REDPREMIA)” with the identifier: 921PTE0124. The funder played no role in the study design, data collection, the analysis and interpretation of the data, or the writing of this manuscript.
Institutional Review Board Statement
Not applicable.
Informed Consent Statement
Not applicable.
Data Availability Statement
All the scripts used in this research can be found at https://github.com/AilinCabrera/Wildfire-Scenarios-for-Assessing-Risk-of-Cover-Loss/tree/9ea988d3d996c5308f2f15967fe1ac9824056d60/CODS_MDPI (accessed on 15 April 2024). All the data utilized in this research are publicly available, and direct links to each dataset are provided in the corresponding references.
Acknowledgments
This paper is based on the Bachelor thesis of Ailin Cabrera. We thank Camila Jiménez, Víctor Lizcano, and Carlos Julián Moreno for their preliminary comments on the first stages of this manuscript. Special thanks to the NumPy, Matplotlib, Xarray, Seaborn, GDAL, and Pandas developers’ teams. We thank two anonymous reviewers and the academic editor for their constructive comments.
Conflicts of Interest
Authors Ailin Cabrera and Camilo Ferro were employed by Aqualogs SAS. The remaining authors declare that the research was conducted in the absence of any commercial or financial relationships that could be construed as a potential conflict of interest.
Appendix A

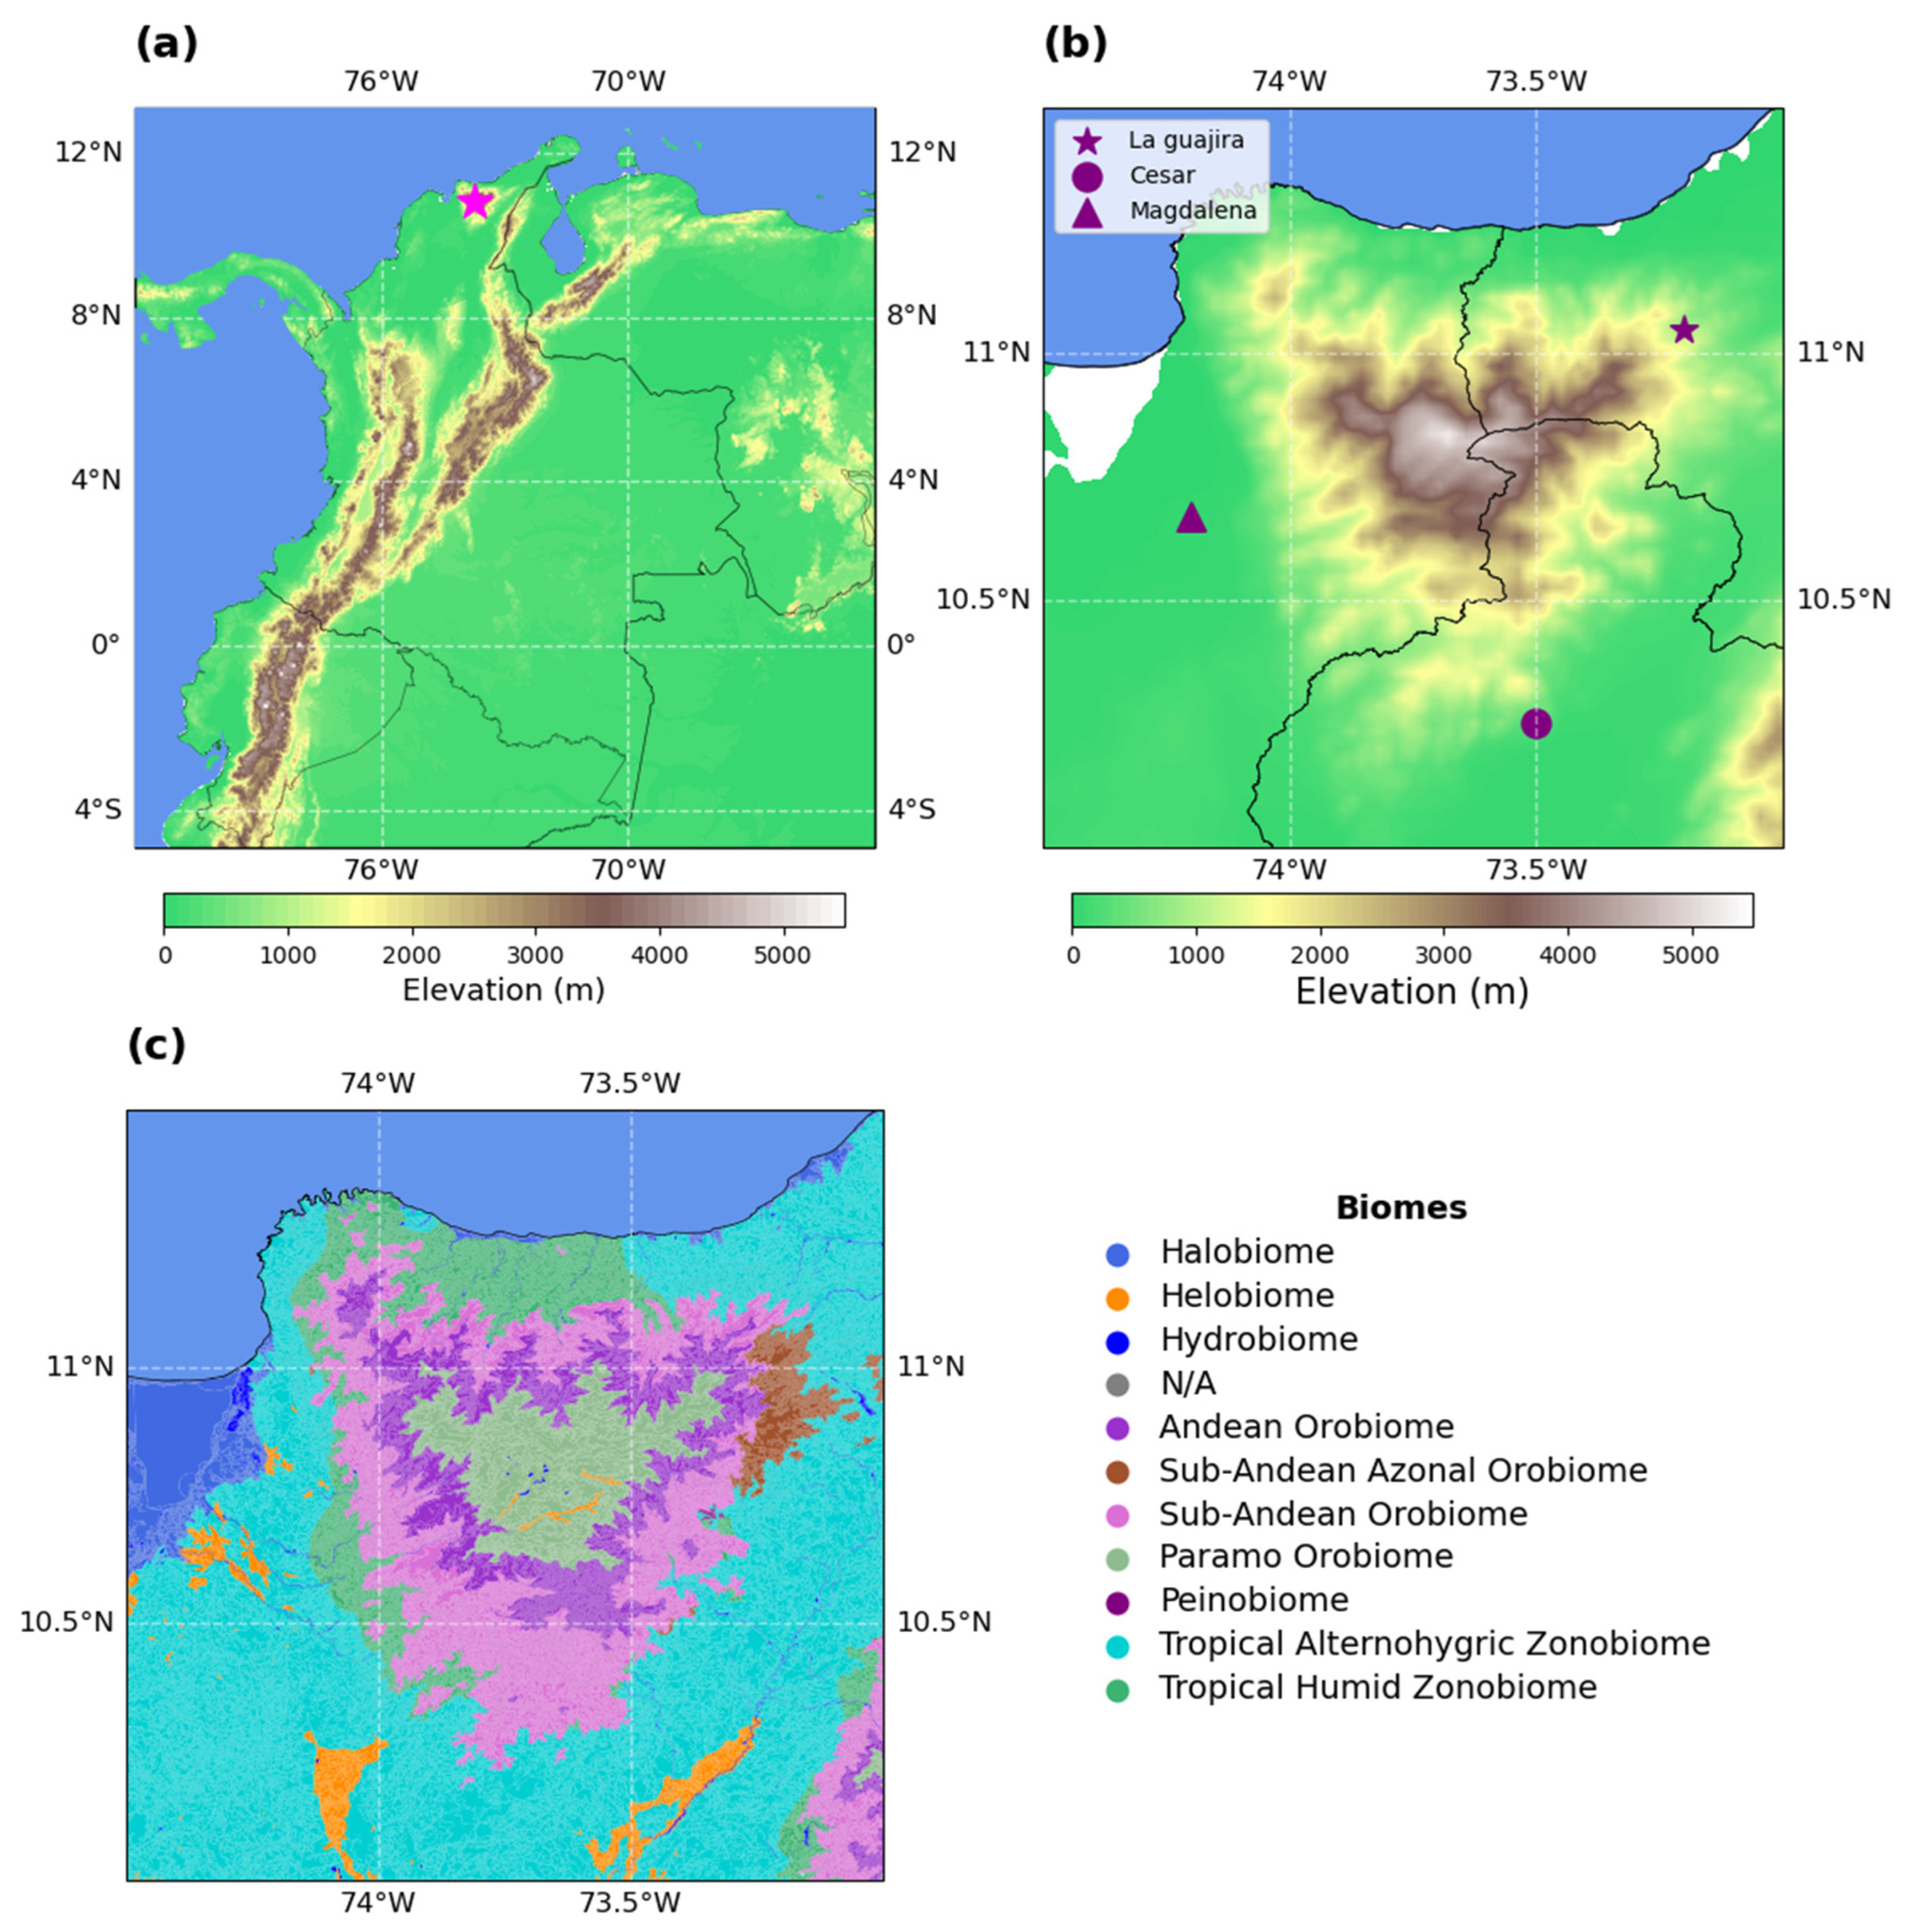
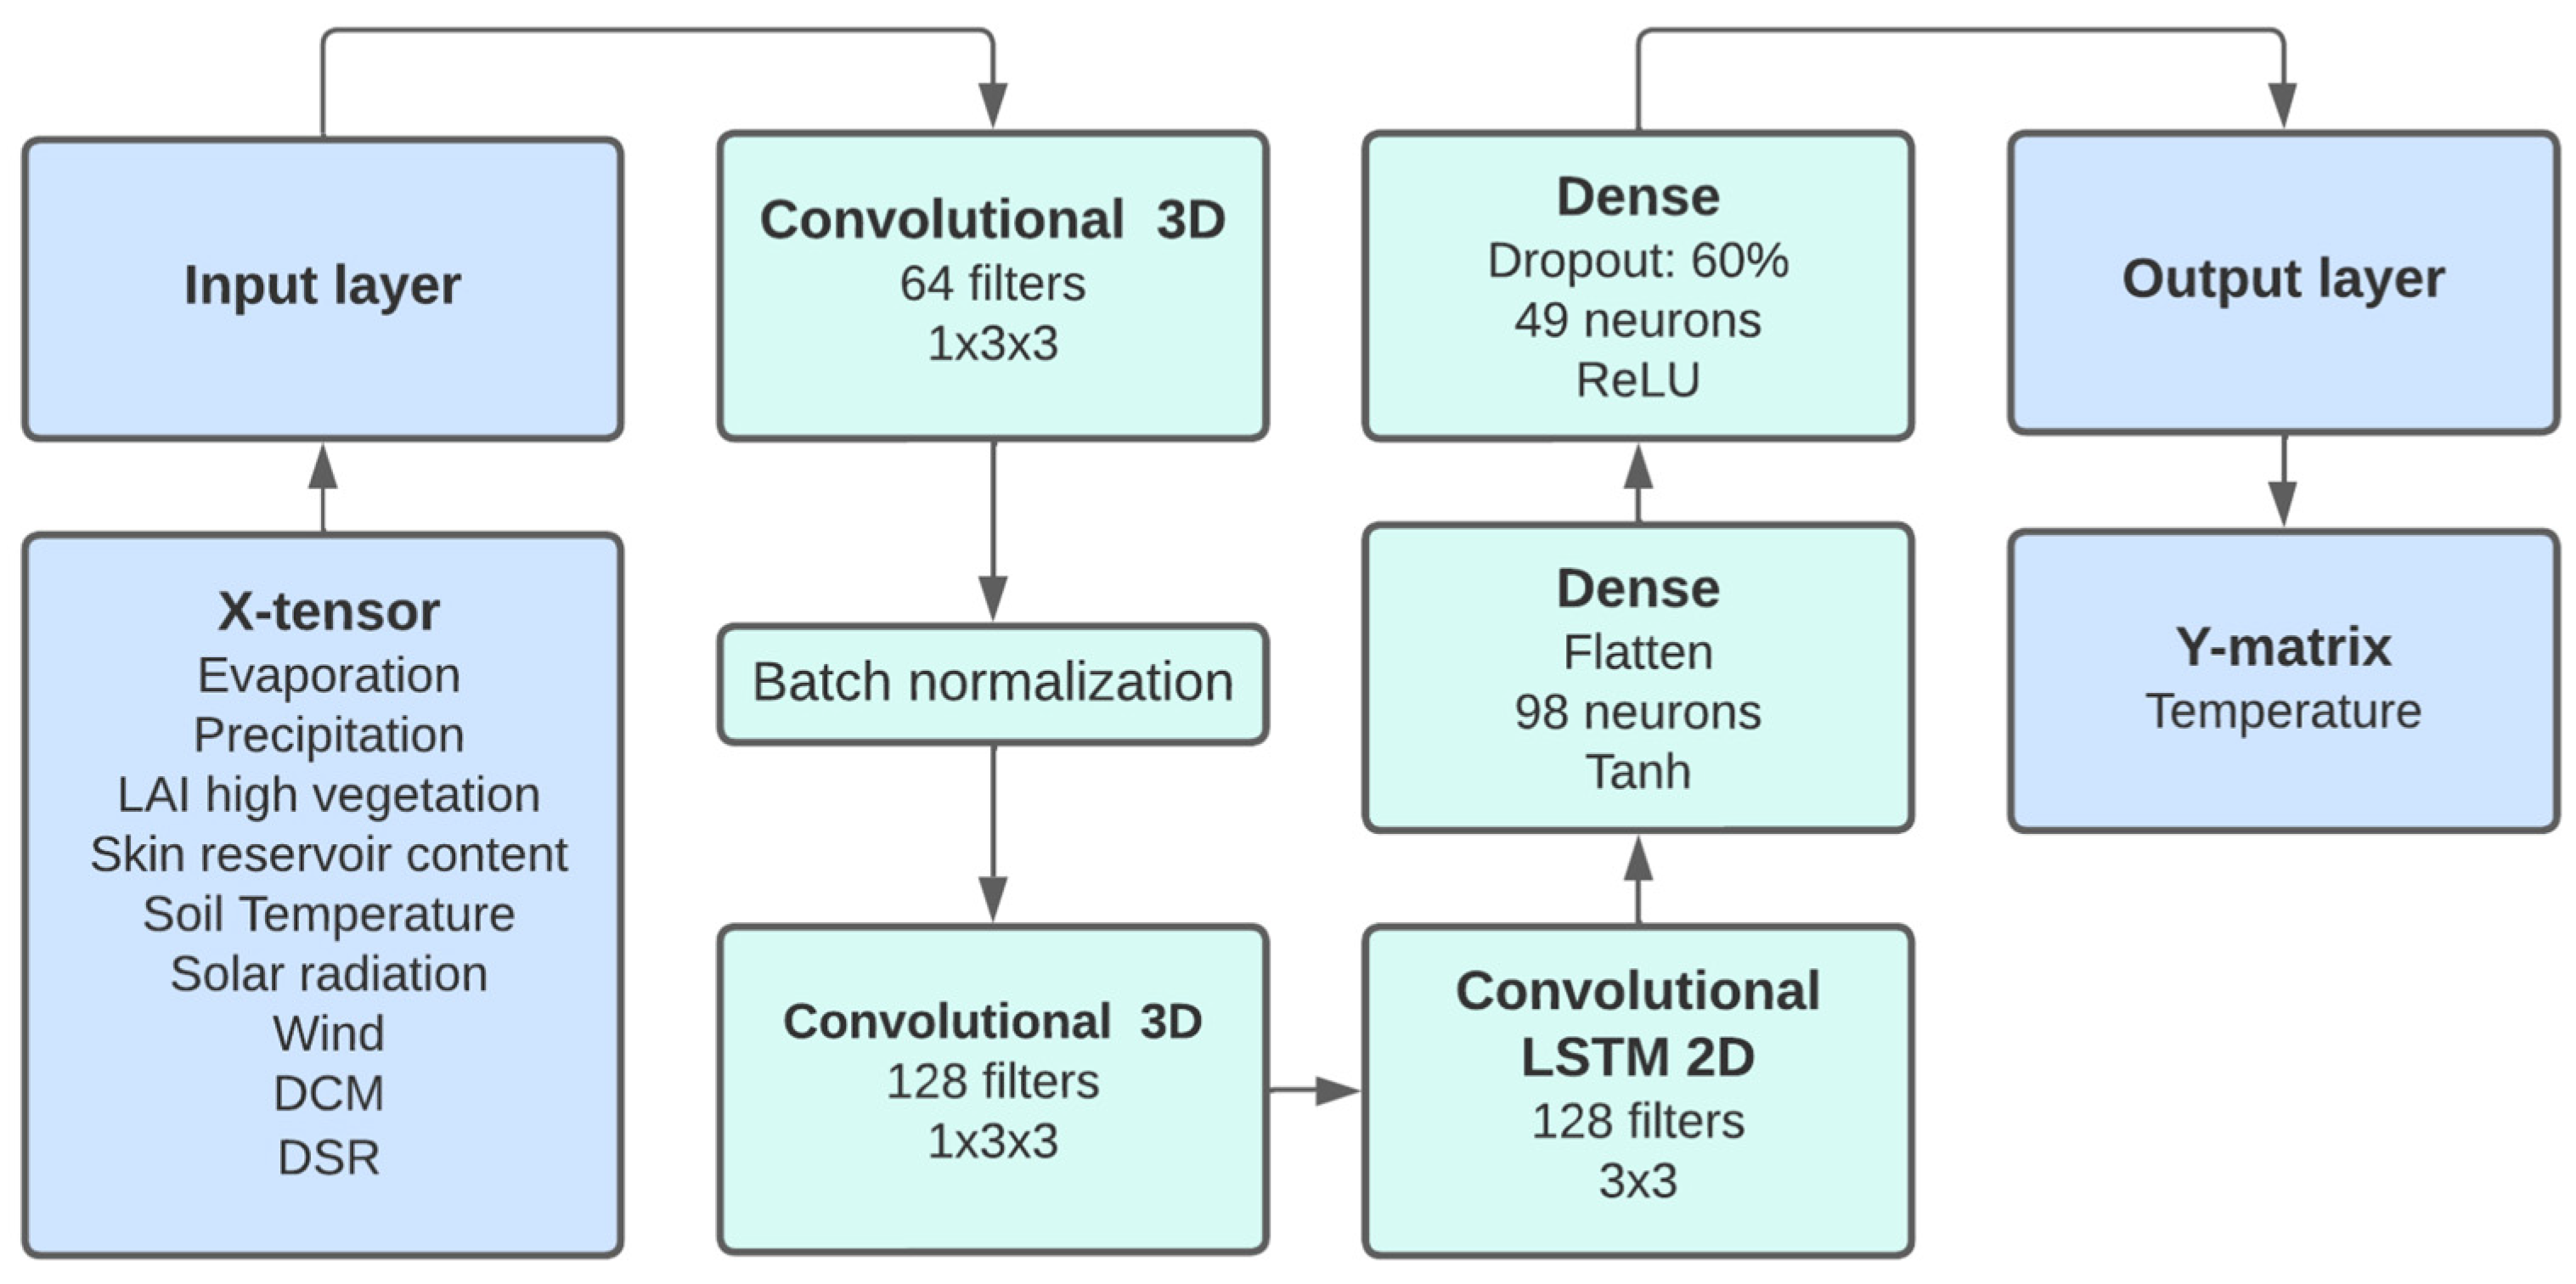
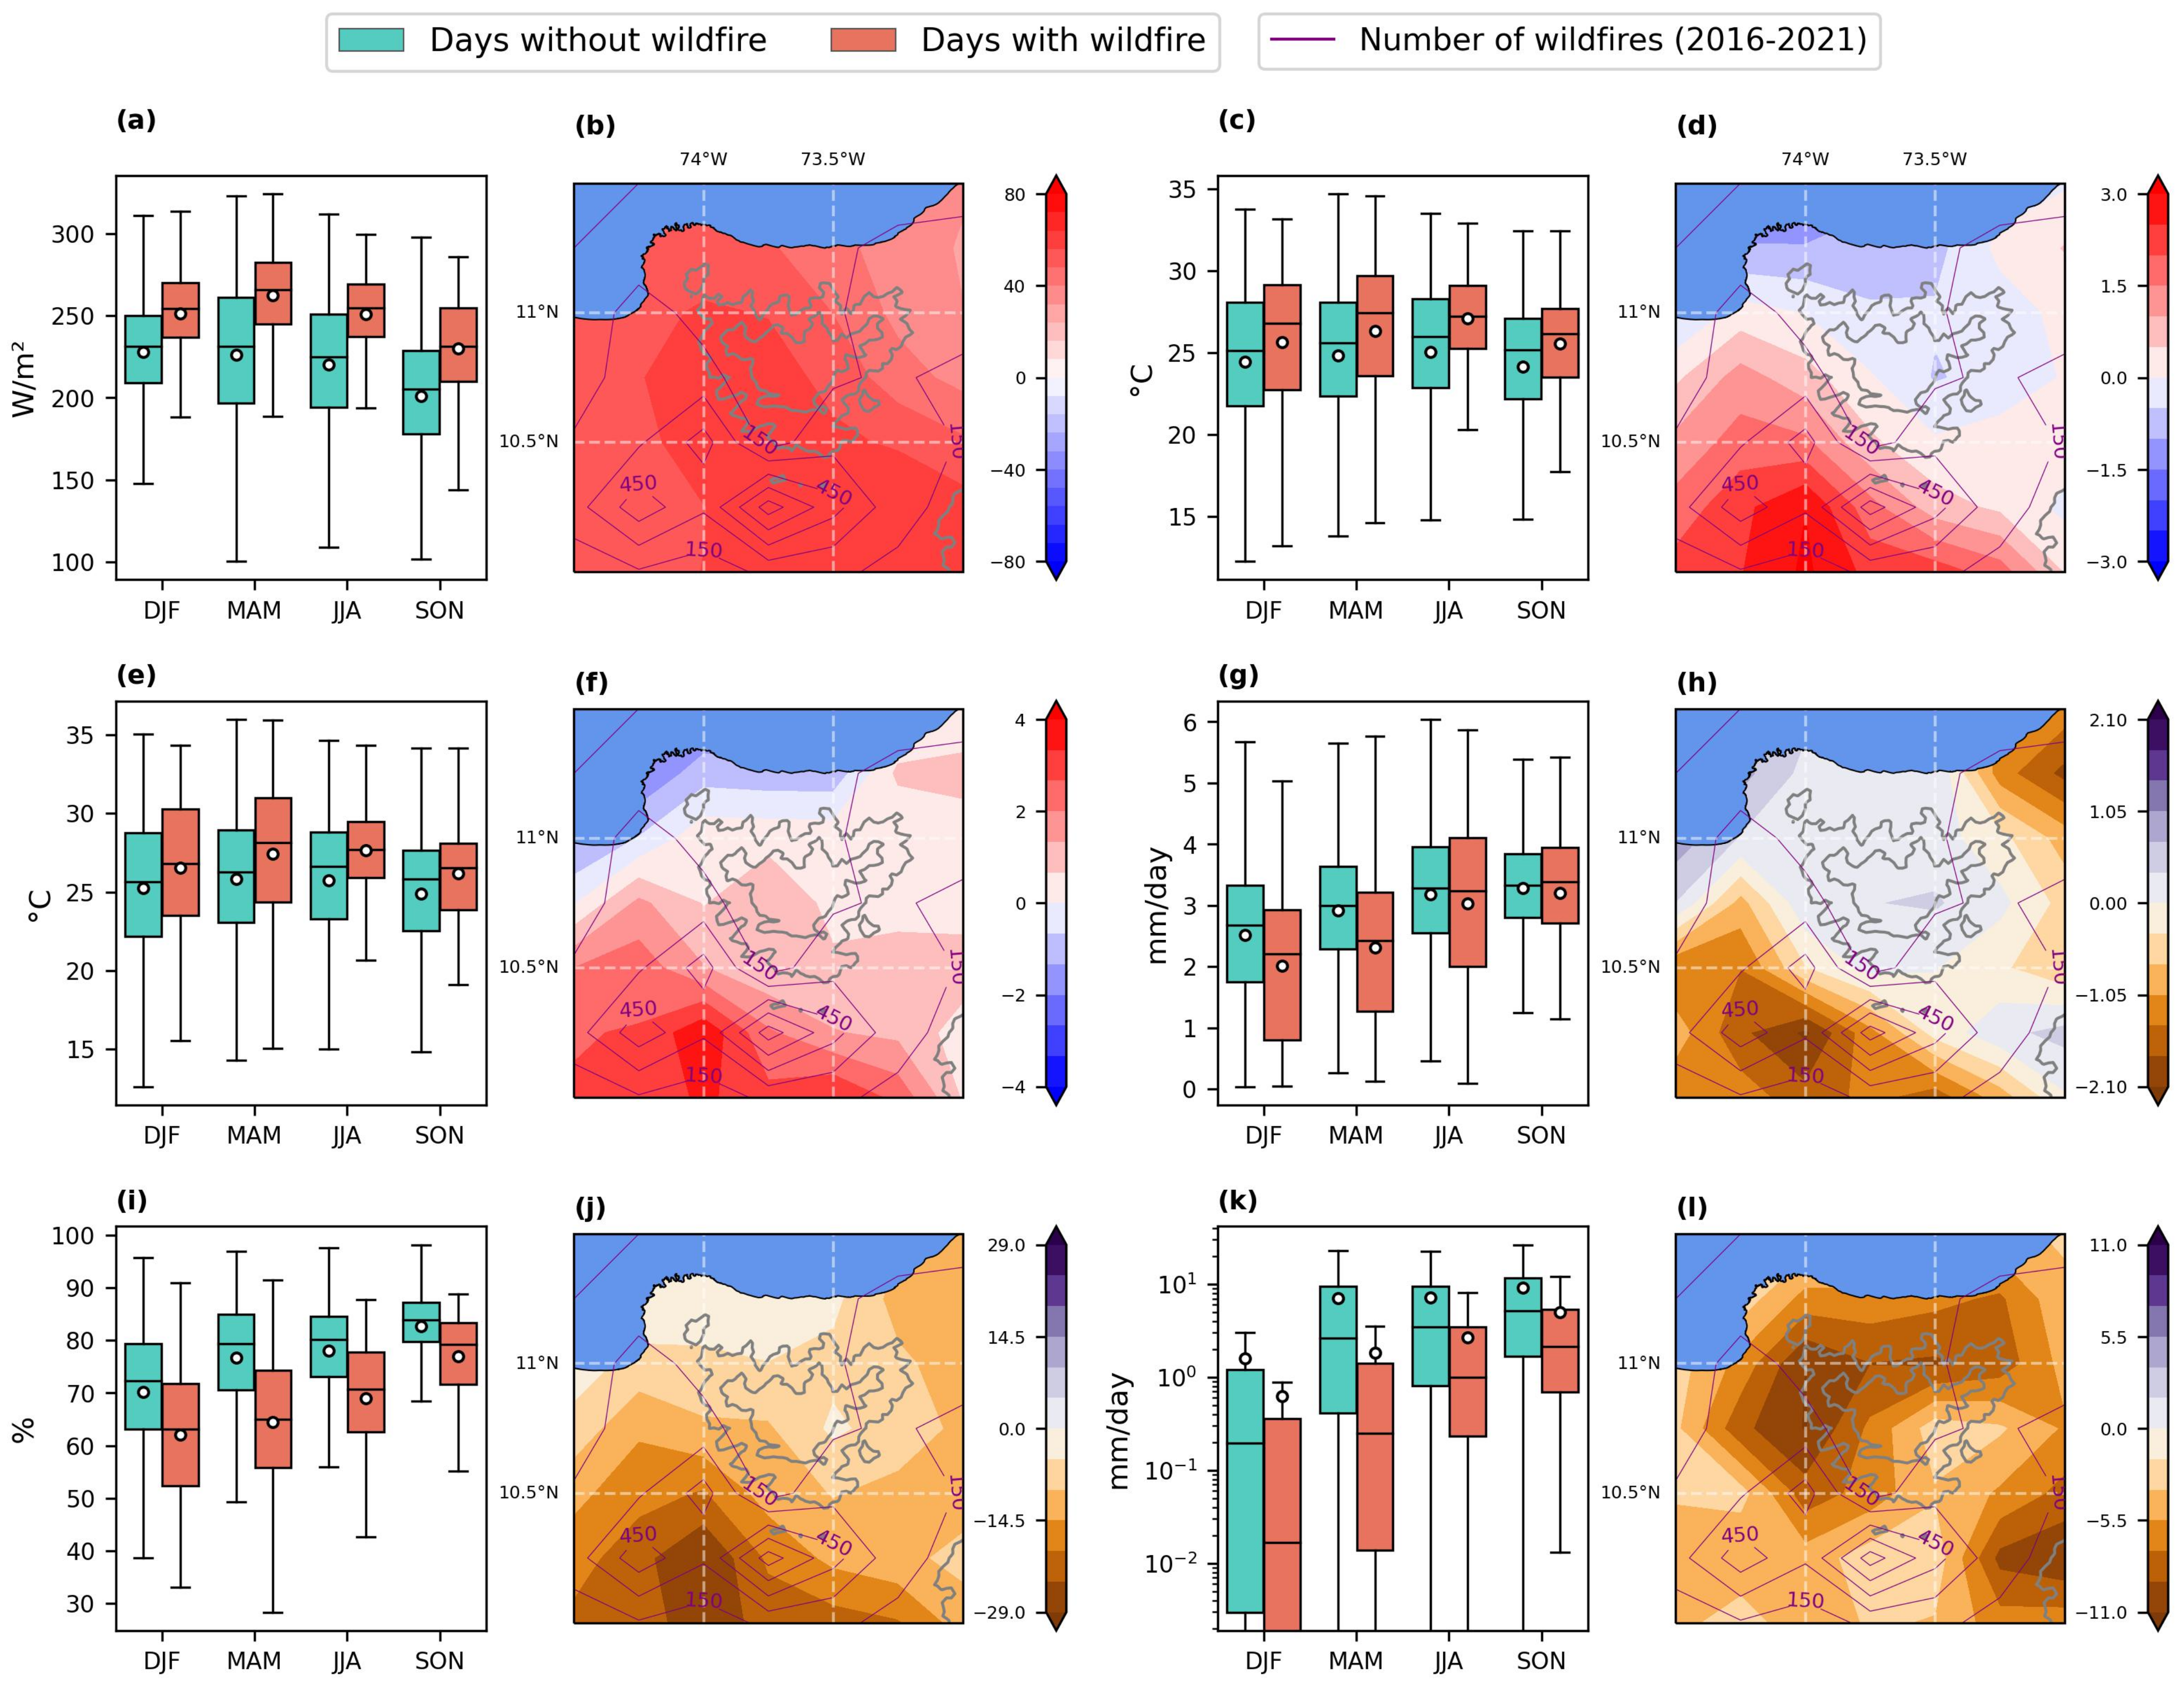
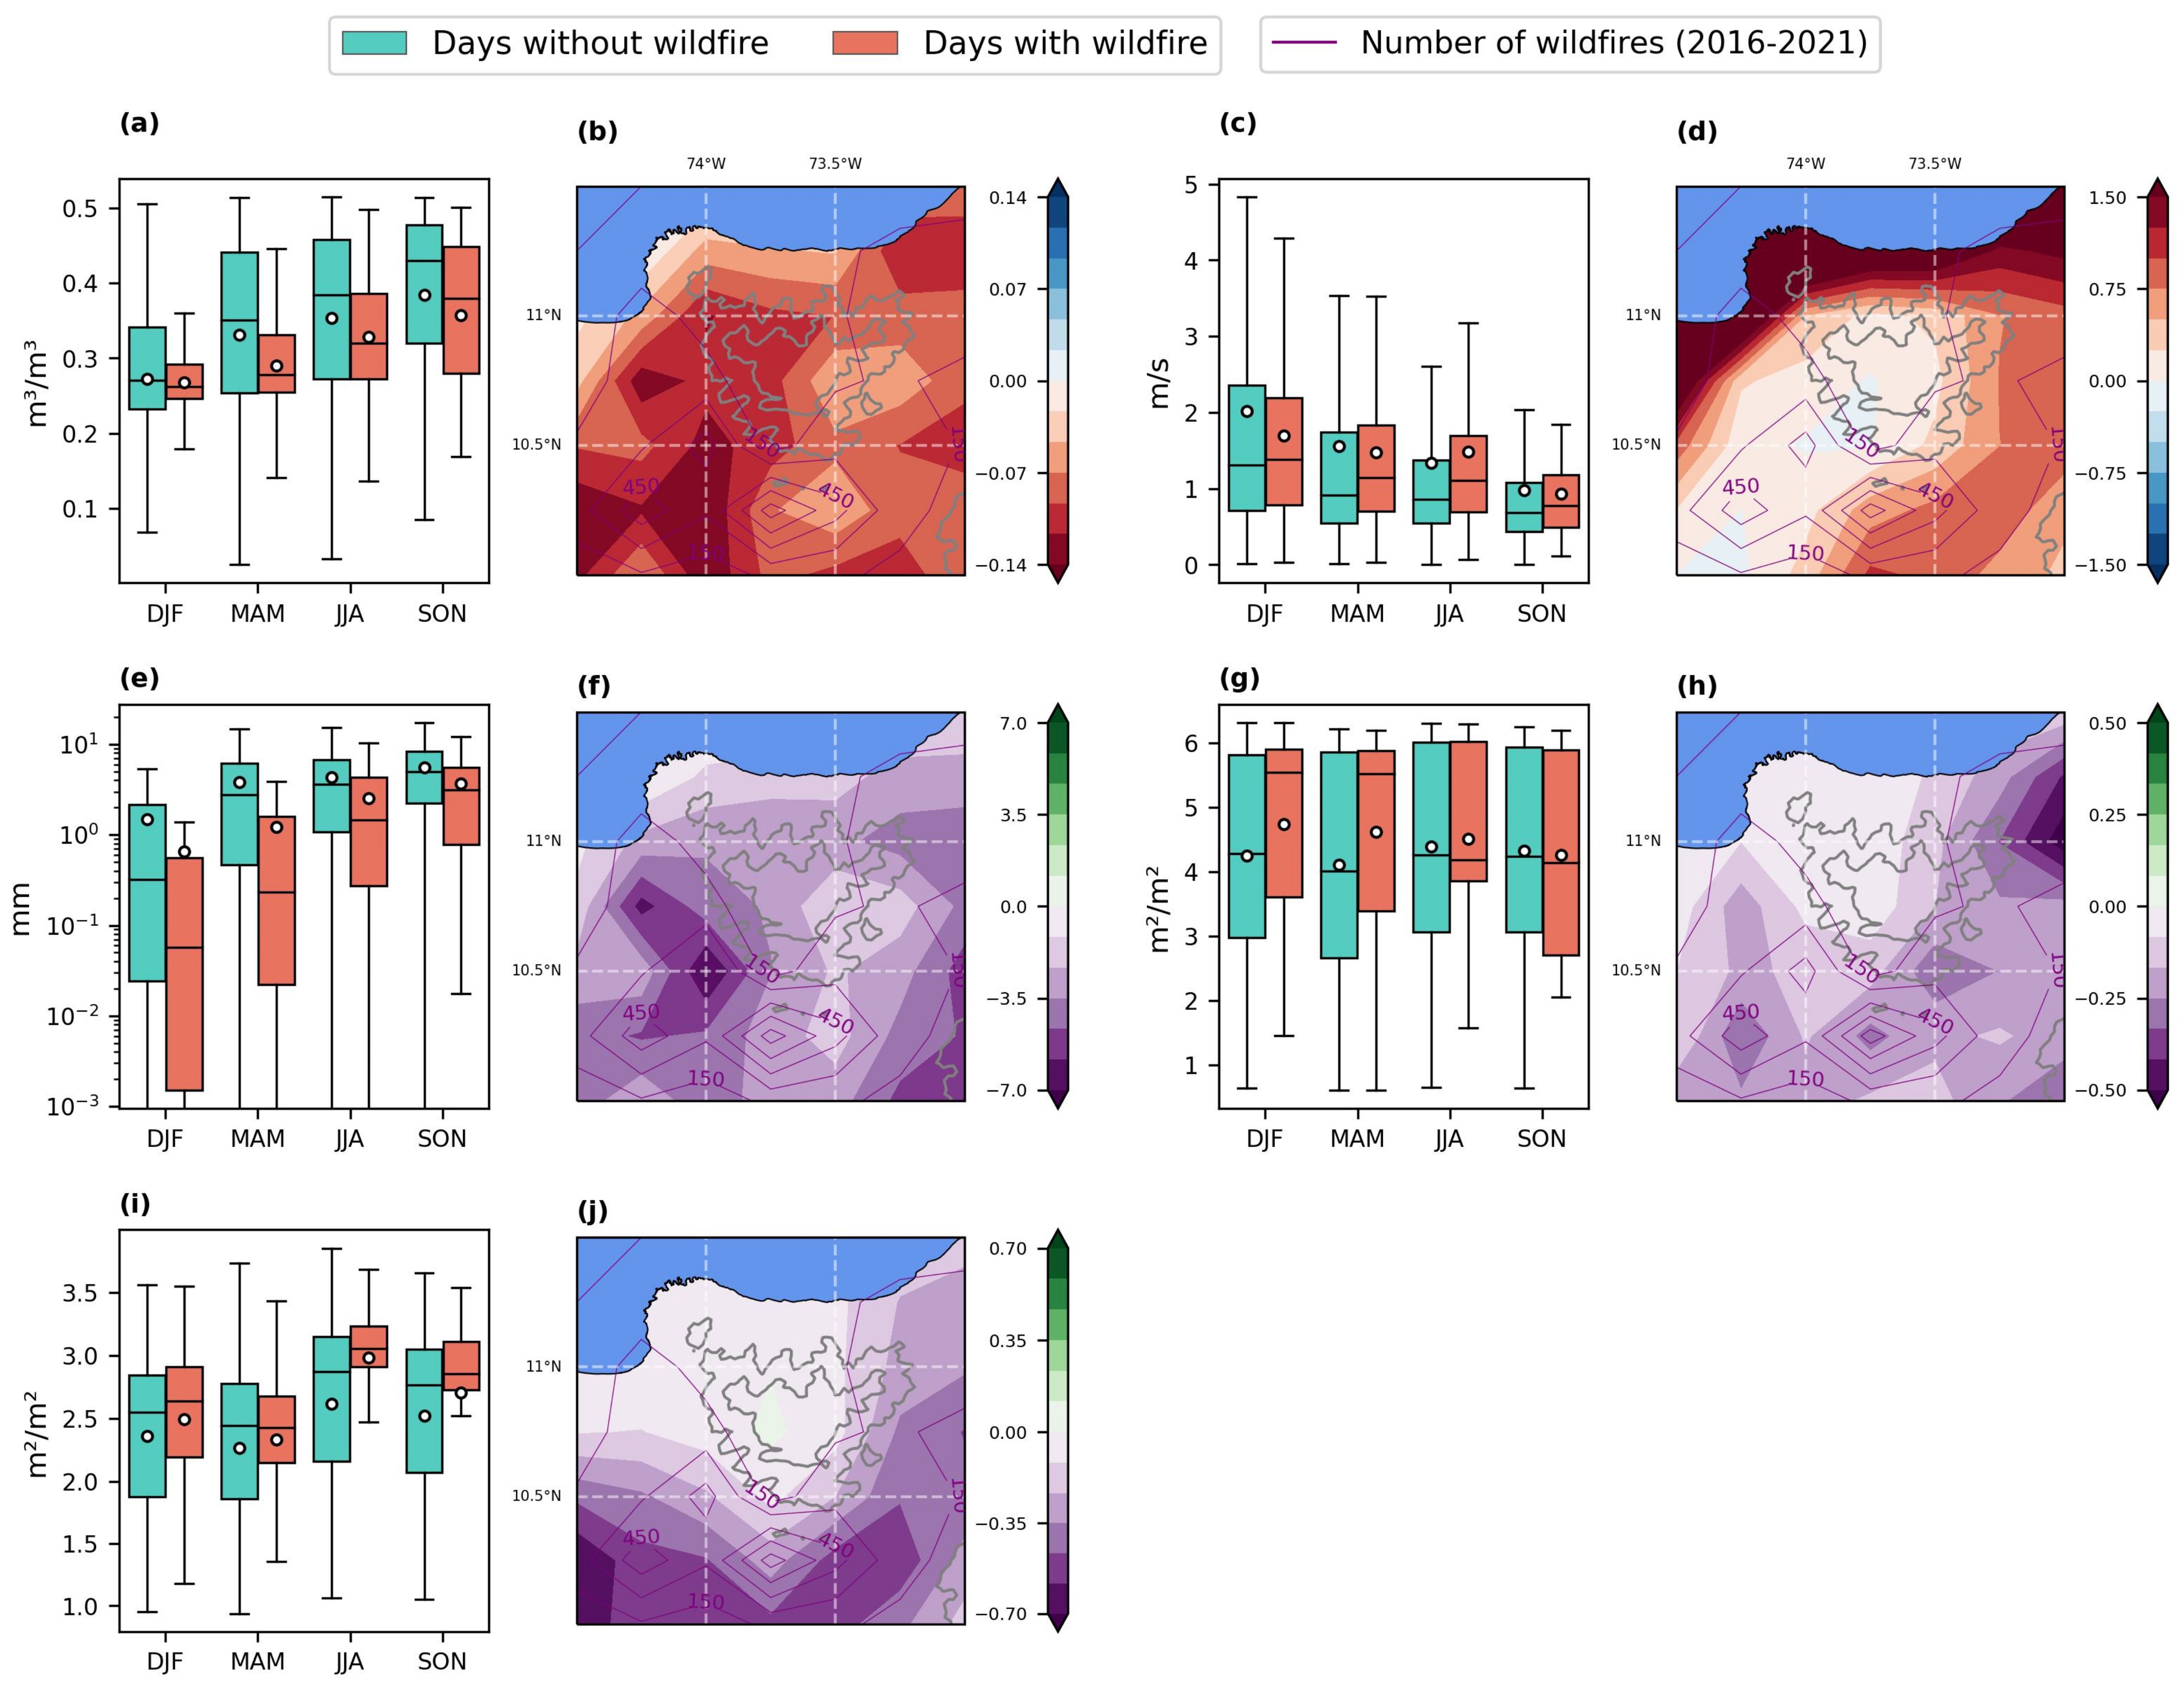
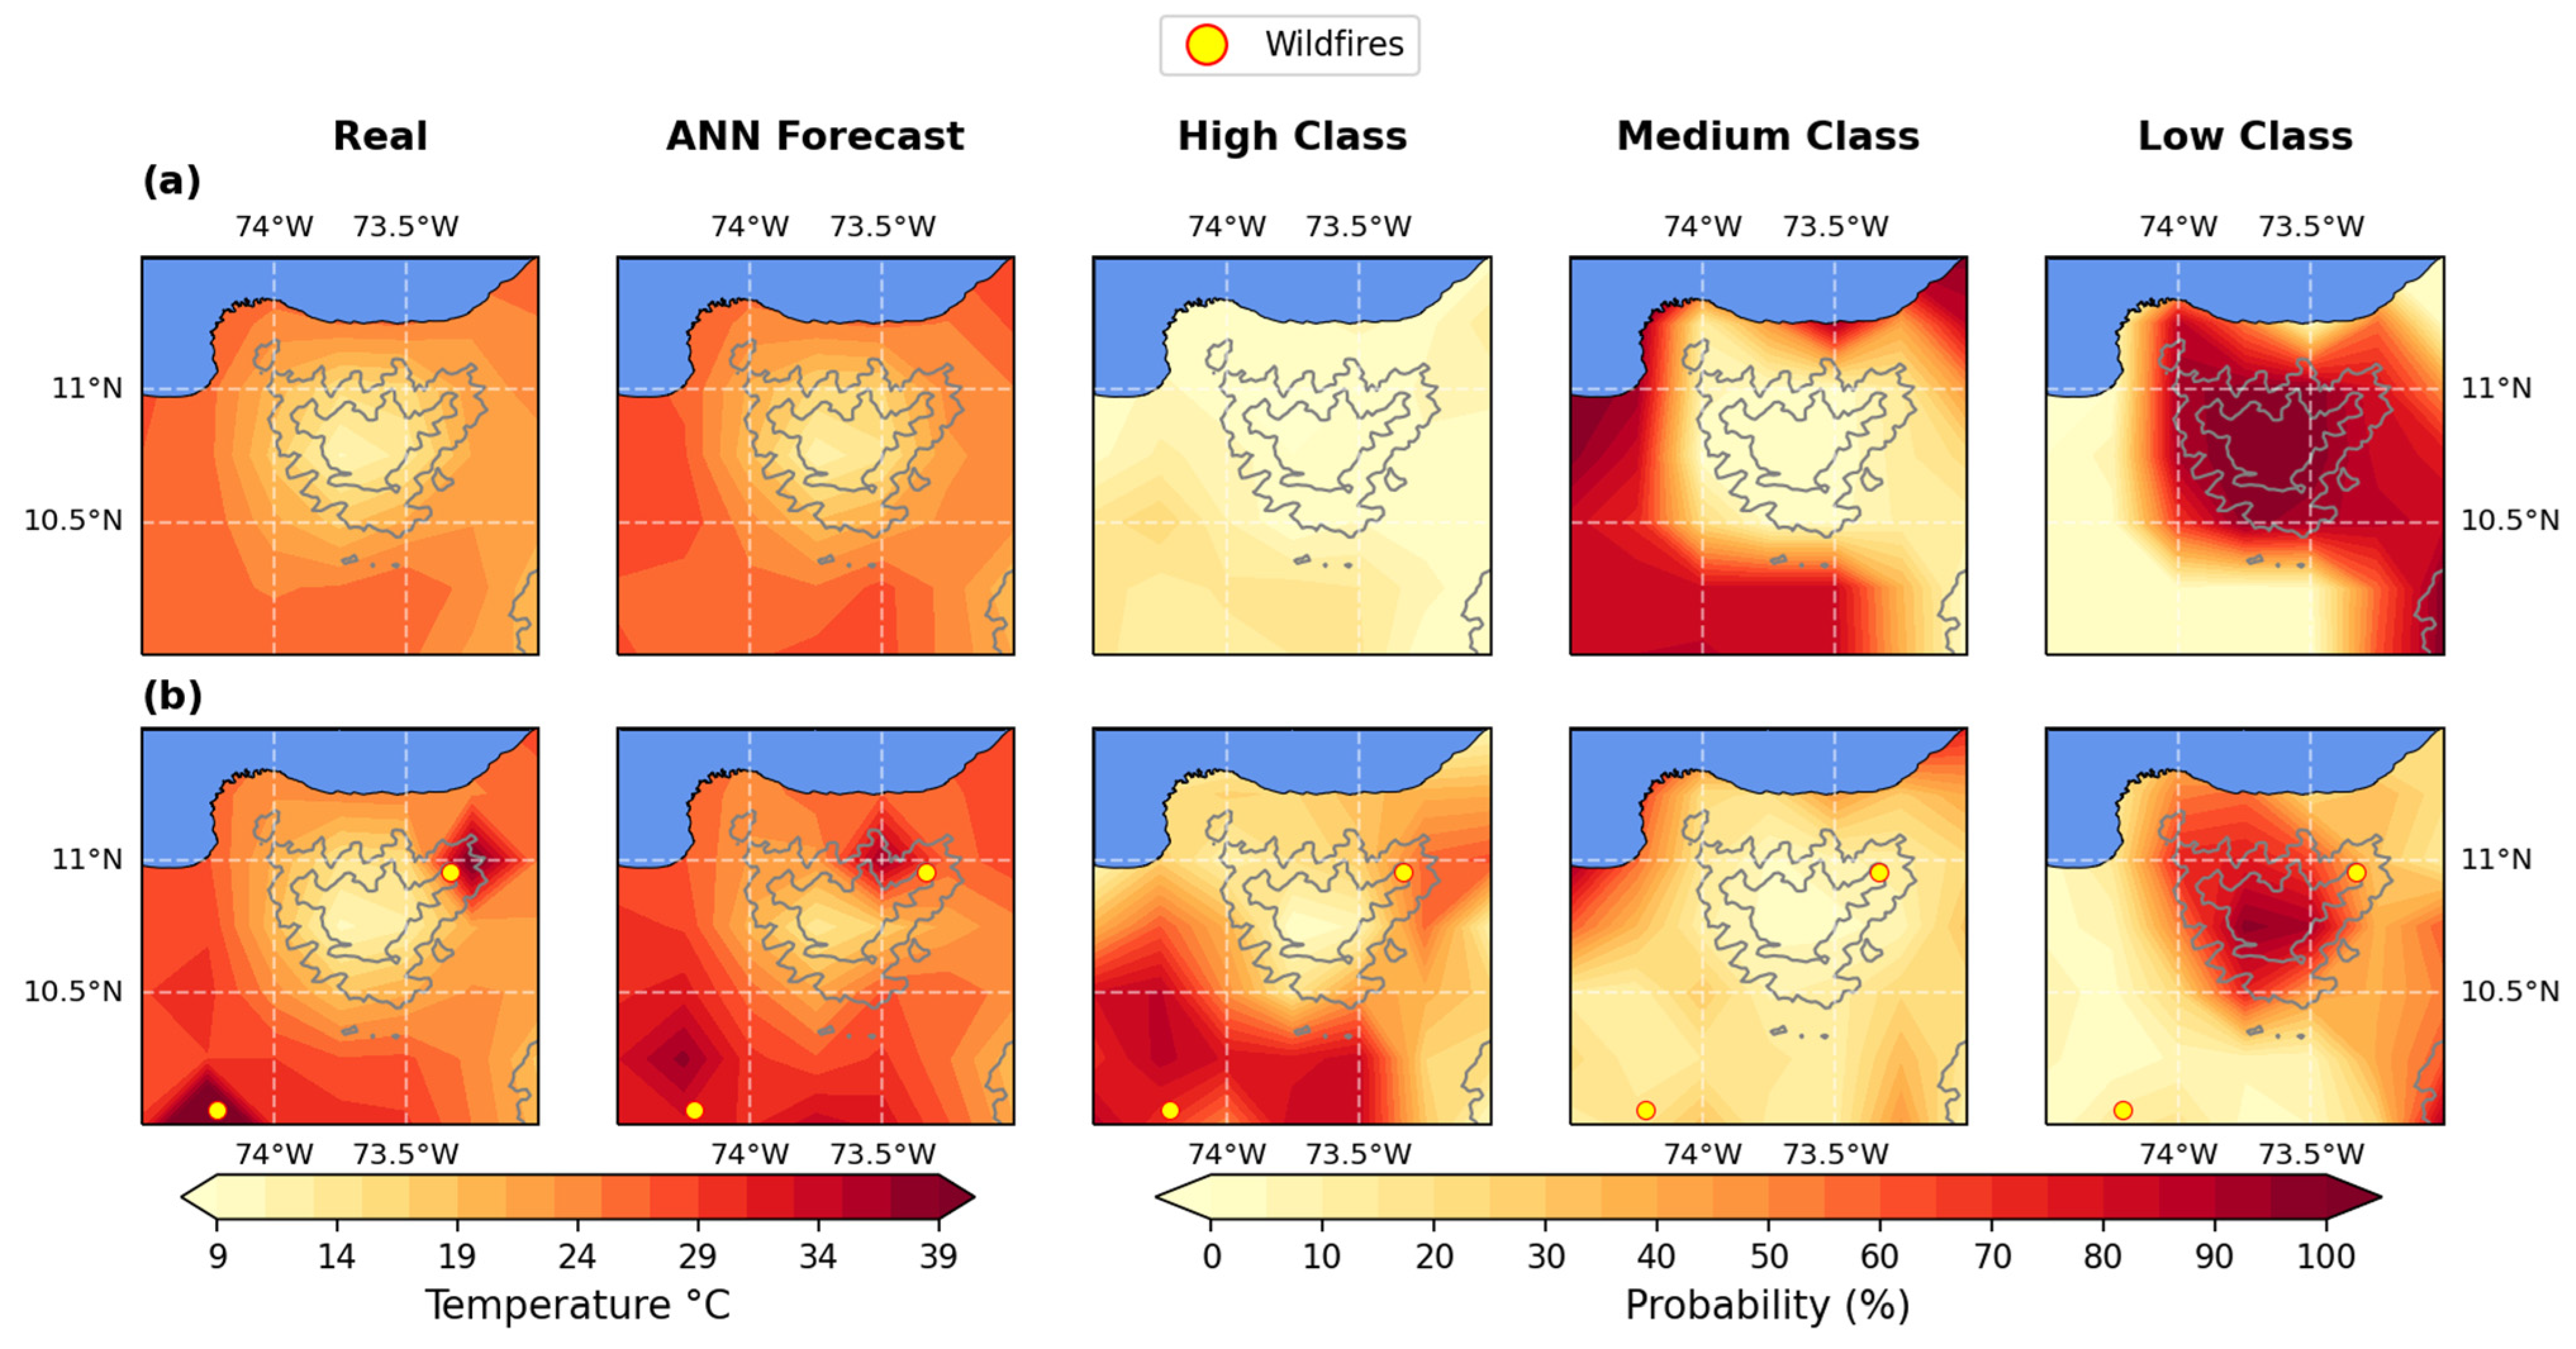
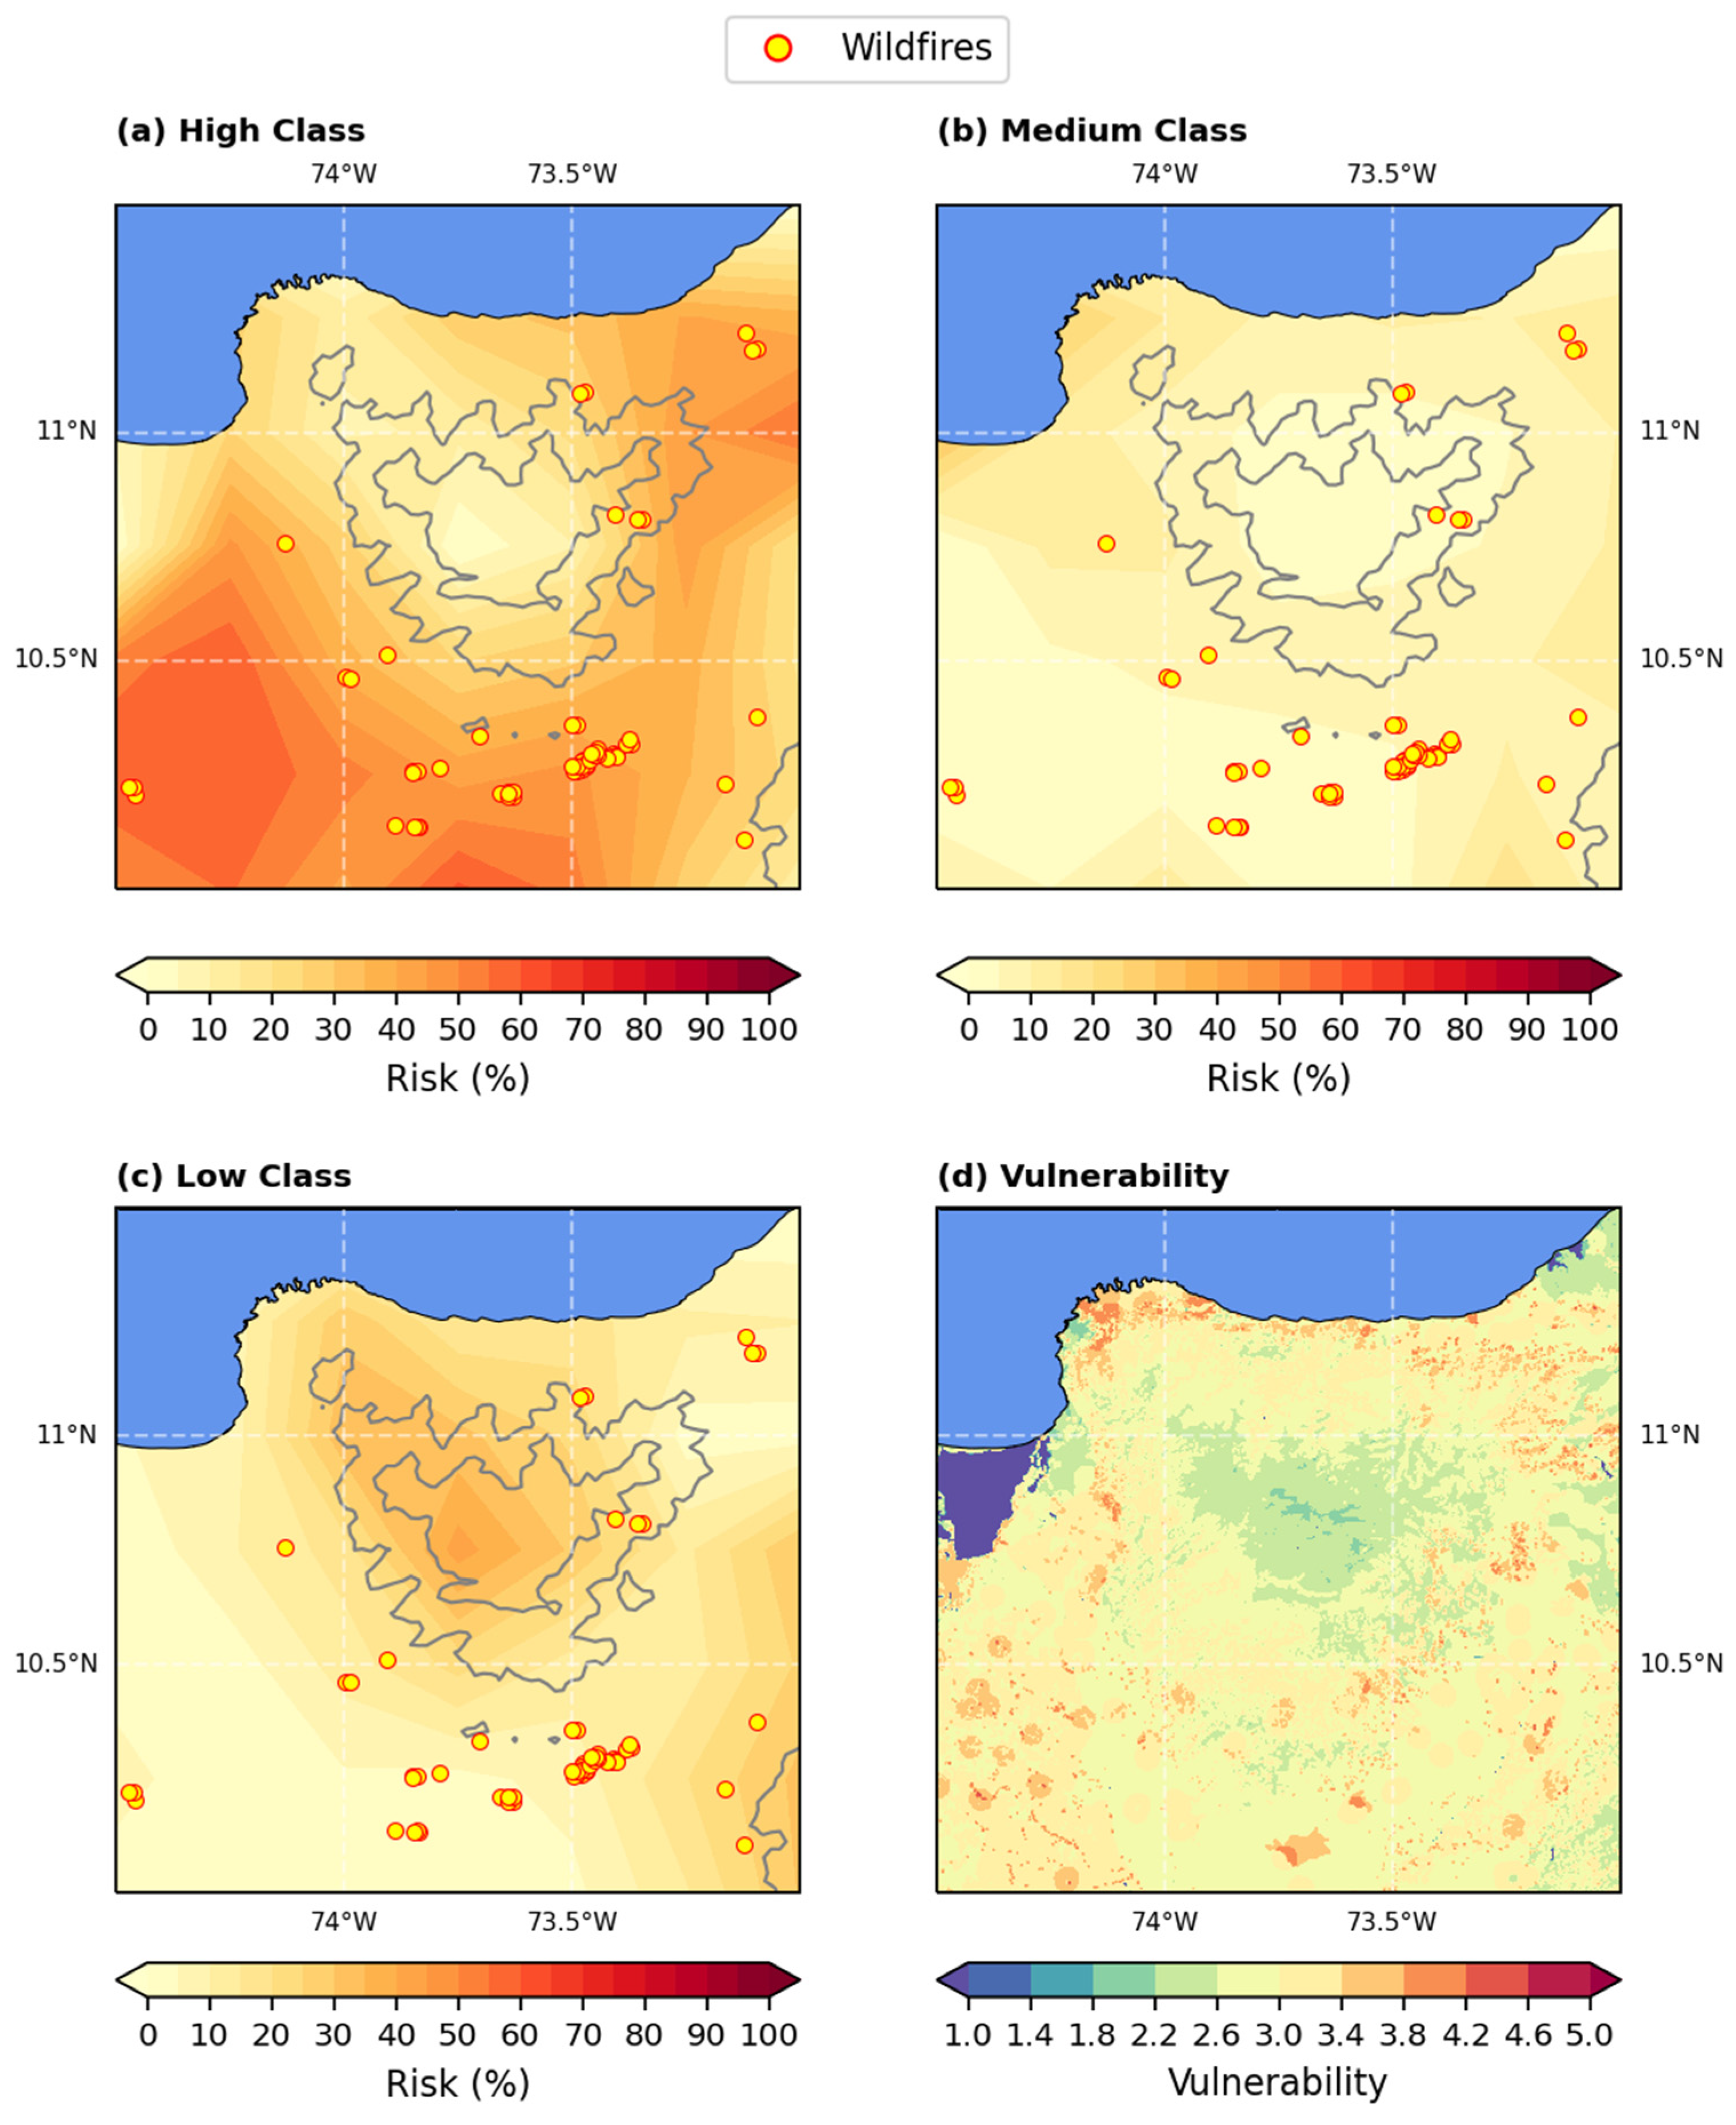
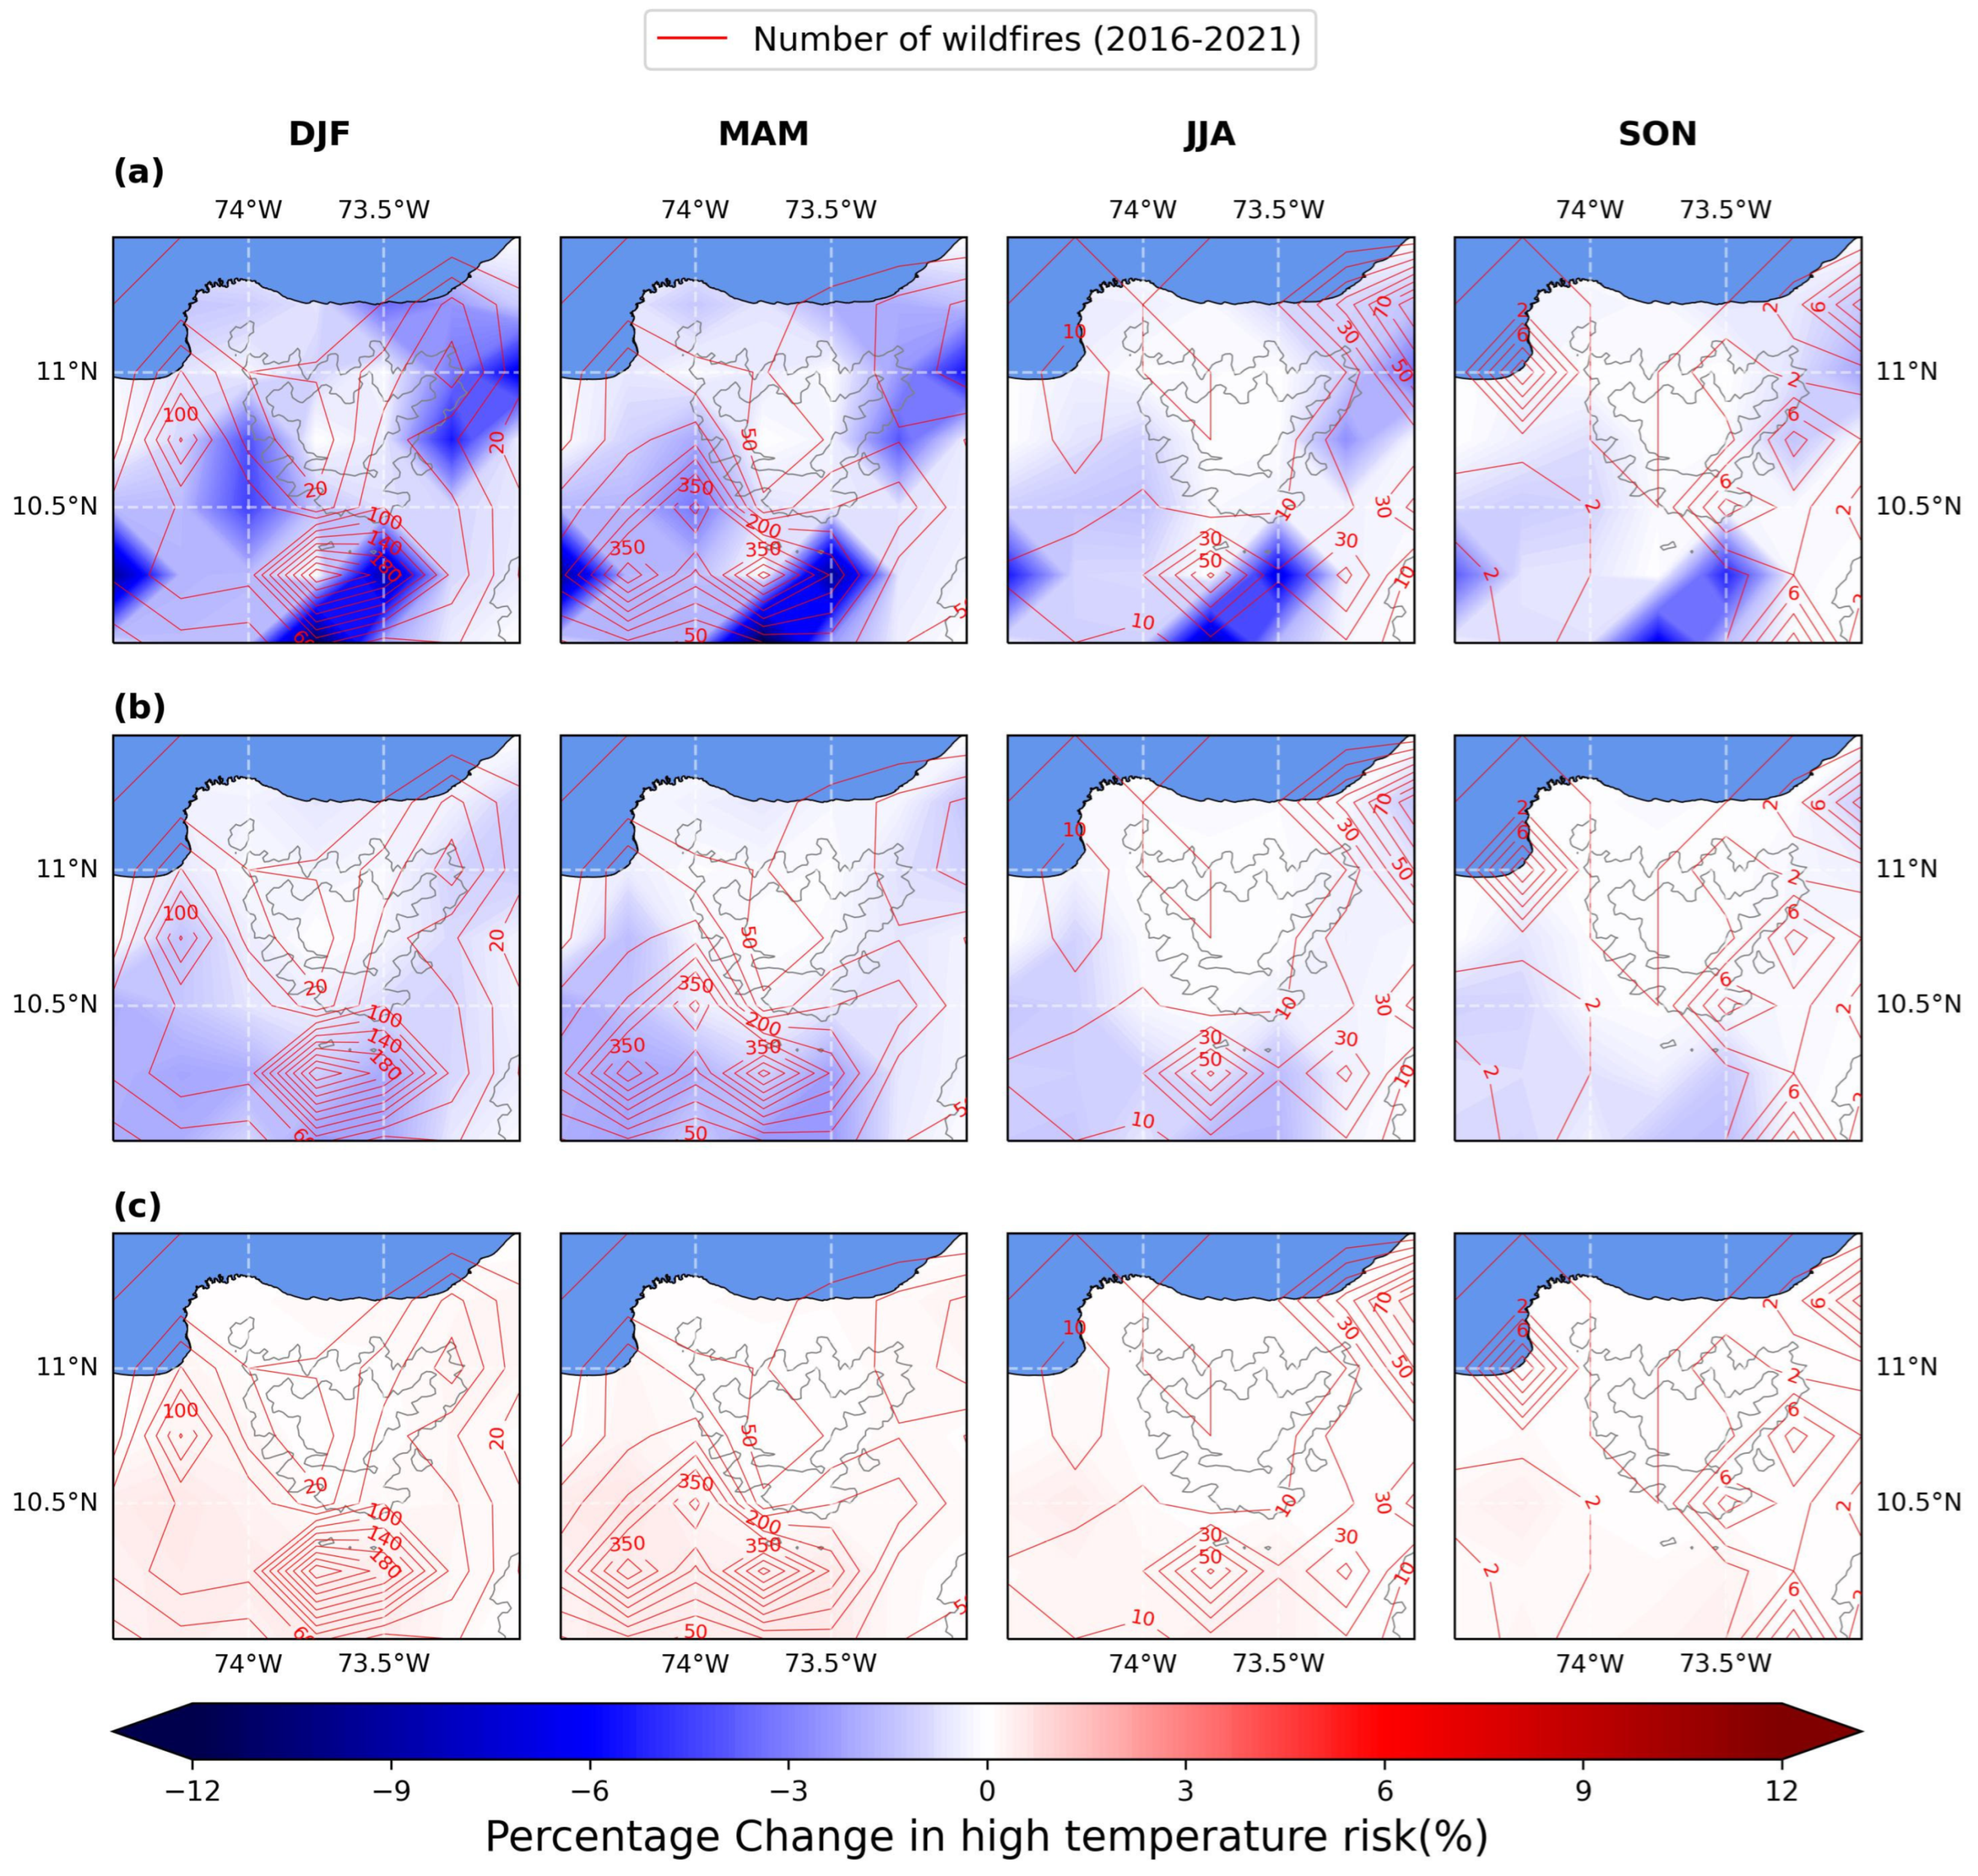
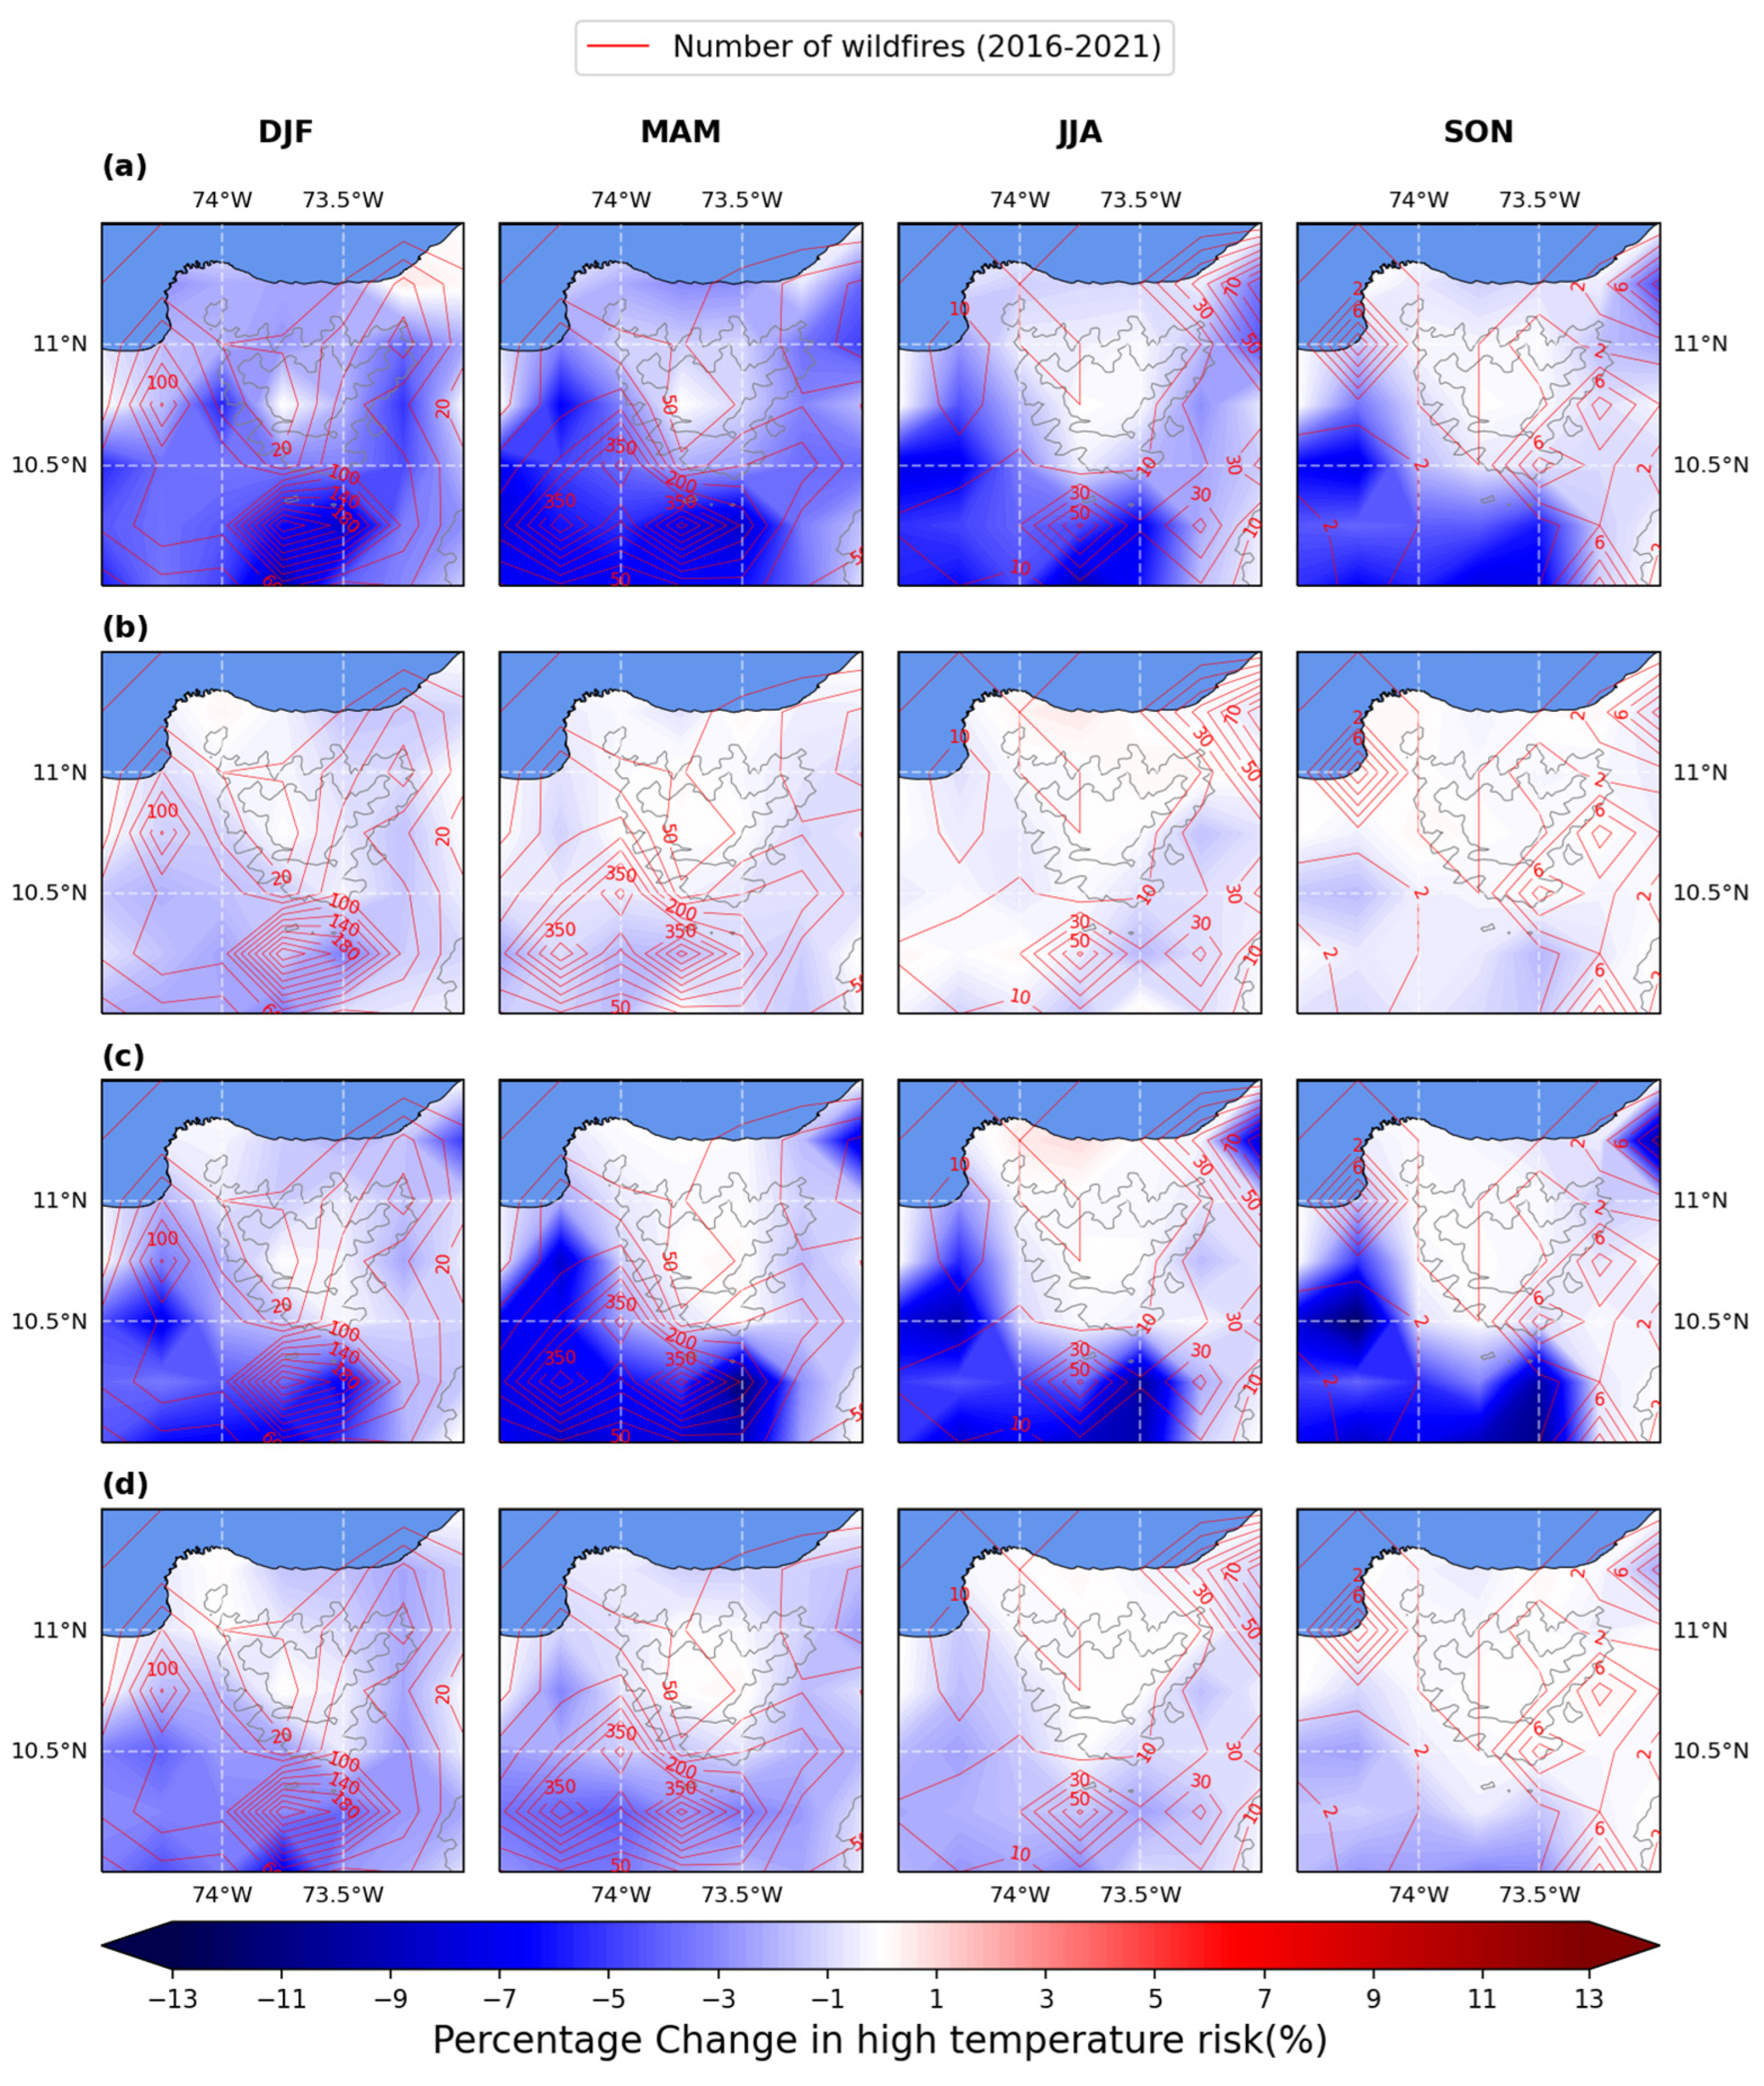
Table A1.
Results of the variance inflation factor (VIF) for the selected variables.
| Variable | Variance Inflation Factor |
|---|---|
| Evaporation | 2.14 |
| Precipitation | 3.58 |
| Leaf area index high vegetation | 1.55 |
| Leaf skin reservoir content | 6.38 |
| Solar radiation | 4.04 |
| WIND | 2.95 |
| DMC | 4.63 |
| DSR | 3.37 |
Appendix B
Table A2.
Probability distribution of the selected ERA5 variables.
| Variable | Probability Distribution |
|---|---|
| Evaporation | Burr |
| U component of wind | Norm |
| V component of wind | Norm |
| Precipitation | Expon |
| Soil temperature | Norm |
| Leaf area index high vegetation | Norm |
| Dew point (used in FWI index) | Burr |
| Air temperature (used in FWI index) | Burr |
| Skin reservoir content | Norm |
| Solar radiation | Burr |
Appendix C
Table A3.
Reclassification of the cover type according to the dominant fuel type.
| Type of Cover (Corine Land Cover Lever 3) | Dominant Fuel Type |
|---|---|
| 3.3.2. Stone outcrops | Non-combustible |
| 3.1.1. Dense forest | Trees |
| 3.1.3. Fragmented forest | Trees |
| 3.1.4. Gallery and riparian forest | Trees |
| 3.2.2. Shrubland | Shrubbery |
| 5.1.2. Natural ponds, lakes, and marshes | Non-combustible |
| 2.4.3. Mosaic of crops, pastures, and natural areas | Grass/herbs |
| 2.4.4. Mosaic of pastures with natural spaces | Grass/herbs |
| 2.4.2. Mosaic of pastures and crops | Grass/herbs |
| 2.4.1. Crop mosaic | Herbs |
| 2.3.3. Grassland with weeds | Grass |
| 2.3.1. Clean pastures | Grass |
| 3.2.1. Herbage | Herbs |
| 3.3.5. Glacial and snow zones | Non-combustible |
Table A4.
Categories and rating of intrinsic variables of susceptibility obtained from the fuels model.
Table A4.
Categories and rating of intrinsic variables of susceptibility obtained from the fuels model.
| Vegetal Fuel Type | Duration | Fuel Load | Fire Influence on Ecosystems | |
|---|---|---|---|---|
| 1 | Non-combustible | Non-combustible | Very low | Not influenced |
| 2 | Trees | >100 h | Low | Independent |
| 3 | Trees/shrubbery | 10–100 h | Medium | Sensible |
| 4 | Shrubbery, herbs | 1–10 h | High | Influenced |
| 5 | Grass/herbs | 1 h | Very high | Dependent |
Table A5.
Multicriteria matrix to evaluate the importance of the criteria according to multiple articles.
Table A5.
Multicriteria matrix to evaluate the importance of the criteria according to multiple articles.
| Ecological Vulnerability | Socio-Economic Vulnerability | |||
|---|---|---|---|---|
| Reference | Net Susceptibility of Vegetation | Threatened Ecosystems | Wildland–Urban Interface | Response Capacity |
| [130] | 1 | 0 | 0 | 0 |
| [131] | 1 | 1 | 1 | 1 |
| [132] | 1 | 0 | 1 | 0 |
| [133] | 1 | 1 | 0 | 0 |
| [134] | 1 | 0 | 0 | 1 |
| [58] | 1 | 0 | 0 | 0 |
| [135] | 1 | 0 | 1 | 0 |
| [136] | 1 | 1 | 0 | 0 |
| [137] | 1 | 0 | 0 | 1 |
| [138] | 1 | 0 | 1 | 1 |
| [139] | 1 | 1 | 0 | 1 |
| [140] | 0 | 0 | 1 | 1 |
| [141] | 1 | 0 | 0 | 1 |
| Total | 12 | 4 | 5 | 7 |
References
- Su, Z.; Zheng, L.; Luo, S.; Tigabu, M.; Guo, F. Modeling wildfire drivers in Chinese tropical forest ecosystems using global logistic regression and geographically weighted logistic regression. Nat. Hazards 2021, 108, 1317–1345. [Google Scholar] [CrossRef]
- Devisscher, T.; Malhi, Y.; Rojas Landívar, V.D.; Oliveras, I. Understanding ecological transitions under recurrent wildfire: A case study in the seasonally dry tropical forests of the Chiquitania, Bolivia. For. Ecol. Manag. 2016, 360, 273–286. [Google Scholar] [CrossRef]
- Arrogante-Funes, F.; Aguado, I.; Chuvieco, E. Global assessment and mapping of ecological vulnerability to wildfires. Nat. Hazards Earth Syst. Sci. 2022, 22, 2981–3003. [Google Scholar] [CrossRef]
- Cochrane, M.A.; Laurance, W.F. Synergisms among Fire, Land Use, and Climate Change in the Amazon. AMBIO J. Hum. Environ. 2008, 37, 522–527. [Google Scholar] [CrossRef] [PubMed]
- Aguilar-Garavito, M.; Isaacs-Cubides, P.; Ruiz-Santacruz, J.S.; Cortina-Segarra, J. Wildfire dynamics and impacts on a tropical Andean oak forest. Int. J. Wildland Fire 2020, 30, 112–124. [Google Scholar] [CrossRef]
- Chuvieco, E.; Opazo, S.; Sione, W.; Valle, H.; del Anaya, J.; Bella, C.D.; Cruz, I.; Manzo, L.; López, G.; Mari, N.; et al. Global burned-land estimation in Latin America using MODIS composite data. Ecol. Appl. 2008, 18, 64–79. [Google Scholar] [CrossRef] [PubMed]
- Martins, P.I.; Belém, L.B.C.; Szabo, J.K.; Libonati, R.; Garcia, L.C. Prioritising areas for wildfire prevention and post-fire restoration in the Brazilian Pantanal. Ecol. Eng. 2022, 176, 106517. [Google Scholar] [CrossRef]
- Trang, P.T.; Andrew, M.E.; Enright, N.J. Burn severity and proximity to undisturbed forest drive post-fire recovery in the tropical montane forests of northern Vietnam. Fire Ecol. 2023, 19, 47. [Google Scholar] [CrossRef]
- Duran-Izquierdo, M.; Olivero-Verbel, J. Vulnerability assessment of Sierra Nevada de Santa Marta, Colombia: World’s most irreplaceable nature reserve. Glob. Ecol. Conserv. 2021, 28, e01592. [Google Scholar] [CrossRef]
- Romero-Ruiz, M.; Etter, A.; Sarmiento, A.; Tansey, K. Spatial and temporal variability of fires in relation to ecosystems, land tenure and rainfall in savannas of northern South America. Glob. Chang. Biol. 2010, 16, 2013–2023. [Google Scholar] [CrossRef]
- Borrelli, P.; Armenteras, D.; Panagos, P.; Modugno, S.; Schütt, B. The Implications of Fire Management in the Andean Paramo: A Preliminary Assessment Using Satellite Remote Sensing. Remote Sens. 2015, 7, 11061–11082. [Google Scholar] [CrossRef]
- Armenteras, D.; González, T.M.; Vargas Ríos, O.; Meza Elizalde, M.C.; Oliveras, I. Incendios en ecosistemas del norte de Suramérica: Avances en la ecología del fuego tropical en Colombia, Ecuador y Perú. Caldasia 2020, 42, 1–16. [Google Scholar] [CrossRef]
- Armenteras, D.; Romero, M.; Galindo, G. Vegetation fire in the savannas of the Llanos Orientales of Colombia. World Resour. Rev. 2005, 17, 531–543. [Google Scholar]
- Armenteras-Pascual, D.; Retana-Alumbreros, J.; Molowny-Horas, R.; Roman-Cuesta, R.M.; Gonzalez-Alonso, F.; Morales-Rivas, M. Characterizing fire spatial pattern interactions with climate and vegetation in Colombia. Agric. Forest Meteorol. 2011, 151, 279–289. [Google Scholar] [CrossRef]
- Hoyos, N.; Correa-Metrio, A.; Sisa, A.; Ramos-Fabiel, M.A.; Espinosa, J.M.; Restrepo, J.C.; Escobar, J. The environmental envelope of fires in the Colombian Caribbean. Appl. Geogr. 2017, 84, 42–54. [Google Scholar] [CrossRef]
- Celis, N.; Casallas, A.; López-Barrera, E.A.; Felician, M.; De Marchi, M.; Pappalardo, S. Climate Change, Forest Fires, and territorial dynamics in Amazon Rainforest: An integrated analysis for mitigation strategies. ISPRS Int. J. Geoinf. 2023, 12, 436. [Google Scholar] [CrossRef]
- Rezaie, F.; Panahi, M.; Bateni, S.M.; Lee, S.; Jun, C.; Trauernicht, C.; Neale, C.M. Development of novel optimized deep learning algorithms for wildfire modeling: A case study of Maui, Hawaii. Eng. Appl. Artif. Intell. 2023, 125, 106699. [Google Scholar] [CrossRef]
- Young, B.E.; Young, K.; Josse, C. Vulnerability of tropical andean ecosystems to climate change. In Climate Change and Biodiversity in the Tropical Andes; Herzog, S.K., Martínez, R., Jørgensen, P.M., Tiessen, H., Eds.; Inter-American Institute for Global Change Research and Scientific Committee on Problems of the Environment: São José dos Campos, Brazil, 2011; pp. 170–181. [Google Scholar]
- Le, H.V.; Hoang, D.A.; Tran, C.T.; Nguyen, P.Q.; Tran, V.H.T.; Hoang, N.D.; Amiri, M.; Ngo, T.P.T.; Nhu, H.V.; Van Hoang, T.; et al. A new approach of deep neural computing for spatial prediction of wildfire danger at tropical climate areas. Ecol. Inform. 2021, 63, 101300. [Google Scholar] [CrossRef]
- Celis, N.; Casallas, A.; Lopez-Barrera, E.A.; Martínez, H.; Peña-Rincón, C.A.; Arenas, R.; Ferro, C. Design of an Early Alert System for PM2.5 through a stochastic method and machine learning models. Environ. Sci. Pol. 2022, 127, 241–252. [Google Scholar] [CrossRef]
- Casallas, A.; Castillo-Camacho, M.P.; Sanchez, E.R.; González, Y.; Celis, N.; Mendez-Espinosa, J.F.; Belalcazar, L.C.; Ferro, C. Surface, satellite ozone variations in Northern South America during low anthropogenic emission conditions: A machine learning approach. Air Qual. Atmos. Health 2023, 16, 745–764. [Google Scholar] [CrossRef]
- Agudelo-Hz, W.J.; Castillo-Barrera, N.C.; Uriel, M.G. Scenarios of land use and land over change in the Colombian Amazon to evaluate alternative post-conflict pathways. Sci. Rep. 2023, 13, 2152. [Google Scholar] [CrossRef] [PubMed]
- Refworld. UN General Assembly, Transforming Our World: The 2030 Agenda for Sustainable Development, 21 October 2015, A/RES/70/1. Available online: https://www.refworld.org/docid/57b6e3e44.html (accessed on 15 November 2023).
- Martin, D.A. Linking fire and the United Nations Sustainable Development Goals. Sci. Total Environ. 2018, 662, 547–558. [Google Scholar] [CrossRef] [PubMed]
- Alvear, M.; Ocampo, G.; Parra, O.C.; Carbonó, E.; Almeda, F. Melastomataceae of the Sierra Nevada de Santa Marta (Colombia): Floristic affinities and annotated catalogue. Phytotaxa 2015, 195, 1–30. [Google Scholar] [CrossRef]
- Armenteras, D.; Gonzalez-Alonso, F.; Franco, C. Geographic and temporal distribution of fire in Colombia using thermal anomalies data. Caldasia. 2009, 31, 303–318. [Google Scholar]
- UAESPNN. Plan de Manejo de los Parques Nacionales Naturales Sierra Nevada de Santa Marta y Tayrona Hacia una Política Pública Ambiental del Territorio Ancestral de la Línea Negra de los Pueblos Iku, Kággaba, Wiwa y Kankuamo de la Sierra Nevada de Santa Marta en la Construcción Conjunta con Parques Nacionales Naturales. 2020. Available online: https://old.parquesnacionales.gov.co/portal/wp-content/uploads/2020/10/plan-de-manejo-del-pnn-sierra-nevada-de-santa-marta-y-tayrona.pdf (accessed on 20 September 2023).
- EarthData Open Access for Open Science. MODIS Collection Hotspot/Active Fire Detections MCD14ML Distributed from NASA FIRMS. Available online: https://earthdata.nasa.gov/firms (accessed on 2 March 2022).
- Tanpipat, V.; Honda, K.; Nuchaiya, P. MODIS Hotspot Validation over Thailand. Remote Sens. 2009, 1, 1043–1054. [Google Scholar] [CrossRef]
- Levin, N.; Heimowitz, A. Mapping spatial and temporal patterns of Mediterranean wildfires from MODIS. Remote Sens. Environ. 2012, 126, 12–26. [Google Scholar] [CrossRef]
- Casallas, A.; Hernandez-Deckers, D.; Mora-Paez, H. Understanding convective storms in a tropical, high-altitude location with in-situ meteorological observations and GPS-derived water vapor. Atmósfera 2023, 36, 225–238. [Google Scholar] [CrossRef]
- Hersbach, H.; Bell, B.; Berrisford, P.; Biavati, G.; Horányi, A.; Muñoz-Sabater, J.; Nicolas, J.; Peubey, C.; Radu, R.; Rozum, I.; et al. ERA5 Hourly Data on Pressure Levels from 1979 to Present; Copernicus Climate Change Service (C3S) Climate Data Store (CDS): Brussels, Belgium, 2018. [Google Scholar]
- Mateus, P.; Catalão, J.; Mendes, V.B.; Nico, G. An ERA5-Based Hourly Global Pressure and Temperature (HGPT) Model. Remote Sens. 2020, 12, 1098. [Google Scholar] [CrossRef]
- Vitolo, C.; Di Giuseppe, F.; Barnard, C.; Coughlan, R.; San-Miguel-Ayanz, J.; Libertá, G.; Krzeminski, B. ERA5-based global meteorological wildfire danger maps. Sci. Data 2020, 7, 216. [Google Scholar] [CrossRef]
- Cartopy. A Cartographic Python Library with Matplotlib Interface; Met Office: Exeter, UK; Available online: http://scitools.org.uk/cartopy/docs/latest (accessed on 5 January 2024).
- Van Wagner, C.E.; Pickett, T.L. Equations and FORTRAN Program for the Canadian Forest Fire Weather Index System. In Canadian Forestry Service; Forestry Technical Report; Petawawa National Forestry Institute: Chalk River, ON, Canada, 1985; p. 25. [Google Scholar]
- Tian, X.; McRae, D.J.; Jin, J.; Shu, L.; Zhao, F.; Wang, M. Wildfires and the Canadian Forest Fire Weather Index system for the Daxing’anling region of China. Int. J. Wildland Fire 2011, 20, 963–973. [Google Scholar] [CrossRef]
- Kalantar, B.; Ueda, N.; Idrees, M.O.; Janizadeh, S.; Ahmadi, K.; Shabani, F. Forest Fire Susceptibility Prediction Based on Machine Learning Models with Resampling Algorithms on Remote Sensing Data. Remote Sens. 2020, 12, 3682. [Google Scholar] [CrossRef]
- Ghahremanloo, M.; Lops, Y.; Choi, Y.; Jung, J.; Mousavinezhad, S.; Hammond, D. A comprehensive study of the COVID-19 impact on PM2. 5 levels over the contiguous United States: A deep learning approach. Atmos. Environ. 2022, 272, 118944. [Google Scholar] [CrossRef] [PubMed]
- Kline, R.B. Principles and Practice of Structural Equation Modeling, 4th ed.; Guilford Publications: New York, NY, USA; London, UK, 2015; p. 534. [Google Scholar]
- Gettelman, A.; Geer, A.J.; Forbes, R.M.; Carmichael, G.R.; Feingold, G.; Posselt, D.J.; Stephens, G.L.; van den Heever, S.C.; Varble, A.C.; Zuidema, P. The Future of Earth System Prediction: Advances in model-data Fusion. Sci. Adv. 2022, 8, eban3488. [Google Scholar] [CrossRef] [PubMed]
- Cheng, S.; Jin, Y.; Harrison, S.P.; Quilodrán-Casas, C.; Prentice, I.C.; Guo, Y.-K.; Arcucci, R. Parameter Flexible Wildfire Prediction Using Machine Learning Techniques: Forward and Inverse Modelling. Remote Sens. 2022, 14, 3228. [Google Scholar] [CrossRef]
- Ghorbanzadeh, O.; Valizadeh Kamran, K.; Blaschke, T.; Aryal, J.; Naboureh, A.; Einali, J.; Bian, J. Spatial Prediction of Wildfire Susceptibility Using Field Survey GPS Data and Machine Learning Approaches. Fire 2019, 2, 43. [Google Scholar] [CrossRef]
- Ndiaye, E.; Le, T.; Fercoq, O.; Salmon, J.; Takeuchi, I. Safe Grid Search with Optimal Complexity. In Proceedings of the 36th International Conference on Machine Learning, Long Beach, CA, USA, 9–15 June 2019; Volume 97, pp. 4771–4780. [Google Scholar]
- Abadi, M.; Agarwal, A.; Barham, P.; Brevdo, E.; Chen, Z.; Citro, C.; Corrado, G.S.; Davis, A.; Dean, J.; Devin, M.; et al. TensorFlow: Large-Scale Machine Learning on Heterogeneous Systems. 2015. Available online: https://www.tensorflow.org/ (accessed on 7 January 2024).
- Keras. Available online: https://keras.io (accessed on 12 October 2023).
- Kingma, D.P.; Ba, J. Adam: A Method for Stochastic Optimization. In Proceedings of the International Conference on Learning Representations, San Diego, CA, USA, 7–9 May 2015. [Google Scholar]
- Fukushima, K. Cognitron: A self-organizing multilayered neural network. Biol. Cybern. 1975, 20, 121–136. [Google Scholar] [CrossRef] [PubMed]
- Prechelt, L. Early stopping–but when? In Neural Networks: Tricks of the Trade; Orr, G.B., Müller, K.R., Eds.; Springer: Berlin/Heidelberg, Germany, 2002; Volume 1524, pp. 1–5. [Google Scholar] [CrossRef]
- Cao, Y.; Wang, M.; Liu, K. Wildfire Susceptibility Assessment in Southern China: A Comparison of Multiple Methods. Int. J. Disaster Risk Sci. 2017, 8, 164–181. [Google Scholar] [CrossRef]
- Zhang, G.; Wang, M.; Liu, K. Forest Fire Susceptibility Modeling Using a Convolutional Neural Network for Yunnan Province of China. Int. J. Disaster Risk Sci. 2019, 10, 386–403. [Google Scholar] [CrossRef]
- Pham, B.T.; Nguyen-Thoi, T.; Ly, H.-B.; Nguyen, M.D.; Al-Ansari, N.; Tran, V.-Q.; Le, T.-T. Extreme Learning Machine Based Prediction of Soil Shear Strength: A Sensitivity Analysis Using Monte Carlo Simulations and Feature Backward Elimination. Sustainability 2020, 12, 2339. [Google Scholar] [CrossRef]
- McPhillips, L.E.; Chang, H.; Chester, M.V.; Depietri, Y.; Friedman, E.; Grimm, N.B.; Kominoski, J.S.; McPhearson, T.; Méndez-Lázaro, P.; Rosi, E.J.; et al. Defining Extreme Events: A Cross-Disciplinary Review. Earth’s Future 2018, 6, 441–455. [Google Scholar] [CrossRef]
- Paramo-Rocha, G. Susceptibilidad de las coberturas vegetales de Colombia al fuego. In Incendios de la Cobertura Vegetal en Colombia; Universidad Autónoma de Occidente: Cali, Colombia, 2011; pp. 73–142. [Google Scholar]
- Sistema de Información Ambiental de Colombia–SIAC. Available online: http://www.siac.gov.co/catalogo-de-mapas (accessed on 2 December 2022).
- IDIGER. Estudios Básicos Amenaza por Incendios Forestales. Proyecto Actualización de Componente de Gestión del Riesgo para la Revisión Ordinaria y Actualización del Plan de Ordenamiento Territorial. 2019; Volume 7, pp. 18–32. Available online: https://www.sdp.gov.co/sites/default/files/generales/anexo_11_incendios_forestales.pdf (accessed on 4 October 2023).
- IDEAM. Protocolo para la Realización de Mapas de Zonificación de Riesgos a Incendios de la Cobertura Vegetal–Escala 1:100.000 Bogotá, D.C. 2011. Available online: http://www.ideam.gov.co/documents/11769/68985506/PROTOCOLO+AJUSTADO_MAPAS+DE+ZRICV+copia.pdf/77d37bb7-3e62-44b1-b8a8-dcd5079b6883 (accessed on 2 March 2023).
- Moreno, A.; Montealegre, F.; Vargas, Y. Propuesta Metodológica para la Evaluación de la Susceptibilidad de la Cobertura Vegetal a la Ocurrencia de Incendios Forestales Usando Imágenes SENTINEL-2B. Master’s Thesis, Universidad Sergio Arboleda, Bogotá, Colombia, 2021. Master in Information Management and Geospatial Technologies. [Google Scholar]
- Etter, A.; Andrade, Á.; Saavedra, K.; Amaya, P.; Arevalo, P. Risk Assessment of Colombian Continental Ecosystems: An Application of the Red List of Ecosystems Methodology (v2.0). Final Report; Pontificia Universidad Javeriana: Bogotá, Colombia, 2017; p. 138. [Google Scholar]
- Casallas, A.; Jiménez-Saenz, C.; Torres, V.; Quirama-Aguilar, M.; Lizcano, A.; Lopez-Barrera, E.A.; Ferro, C.; Celis, N.; Arenas, R. Design of a Forest Fire Early Alert System through a Deep 3D-CNN Structure and a WRF-CNN Bias Correction. Sensors 2022, 22, 8790. [Google Scholar] [CrossRef] [PubMed]
- Gestión del Riesgo. Índice Municipal de Riesgo de Desastres Ajustado por Capacidades. Available online: https://repositorio.gestiondelriesgo.gov.co/bitstream/handle/20.500.11762/26622/Indice_Mpal_Riesgo_Ajustado_Capacidades.xlsx?sequence=2isAllowed=y (accessed on 30 July 2023).
- ProSierra. Fundación Pro-Sierra Nevada de Santa Marta, Ministerio del Medio Ambiente. Flora–Sierra Nevada de Santa Marta, Colombia. Available online: https://www.prosierra.org/index.php/la-sierra-nevada/la-sierra-parte-2/biodiversidad/flora (accessed on 14 November 2023).
- Morales, M.; Otero, J.; Van der Hammen, T.; Torres, A.; Cadena, C.; Pedraza, C.; Rodríguez, N.; Franco, C.; Betancourth, J.C.; Olaya, E.; et al. Atlas de Páramos de Colombia, 1st ed.; Instituto de Investigación de Recursos Biológicos Alexander von Humboldt: Bogotá, Colombia, 2007; pp. 184–190. [Google Scholar]
- IPCC. Global Warming of 1.5 °C. An IPCC Special Report on the Impacts of Global Warming of 1.5 °C above Pre-Industrial Levels and Related Global Greenhouse Gas Emission Pathways, in the Context of Strengthening the Global Response to the Threat of Climate Change, Sustainable Development, and Efforts to Eradicate Poverty. 2018, p. 255. Available online: https://www.ipcc.ch/site/assets/uploads/sites/2/2019/06/SR15_Full_Report_High_Res.pdf (accessed on 11 October 2023).
- Bot, K.; Borges, J.G. A Systematic Review of Applications of Machine Learning Techniques for Wildfire Management Decision Support. Inventions 2022, 7, 15. [Google Scholar] [CrossRef]
- Marsden-Smedley, J. Tasmanian Wildfires January–February 2013: Forcett-Dunalley, Repulse, Bicheno, Giblin River, Montumana, Molesworth and Gretna; Bushfire Cooperative Research Centre: East Melbourne, VIC, Australia, 2014; p. 7. Available online: https://www.bushfirecrc.com/sites/default/files/managed/resource/taswildfires2013_final_reduced_sizel.pdf (accessed on 20 September 2023).
- Pinto-Zárate, J.H.; Rangel-Churio, J. La vegetación de los páramos del norte de Colombia (Sierra Nevada de Santa Marta, Serranía de Perijá). In Colombia Diversidad Biótica X: Cambio Global (Natural) y Climático (Antrópico) en el Páramo Colombiano; Rangel, O., Ed.; Universidad Nacional de Colombia: Bogotá, Colombia, 2010; pp. 289–410. ISBN 978-958-719-499-9. [Google Scholar]
- Wild, M.; Ohmura, A.; Makowski, K. Impact of global dimming and brightening on global warming. Geophys. Res. Lett. 2007, 34, L04702. [Google Scholar] [CrossRef]
- Macias Fauria, M.; Michaletz, S.T.; Johnson, E.A. Predicting climate change effects on wildfires requires linking processes across scales. Wiley Interdiscip. Rev. Clim. Chang. 2011, 2, 99–112. [Google Scholar] [CrossRef]
- Cardil, A.; Eastaugh, C.S.; Molina, D.M. Extreme temperature conditions and wildland fires in Spain. Theor. Appl. Climatol. 2014, 122, 219–228. [Google Scholar] [CrossRef]
- Chen, D.; Liu, W.; Huang, F.; Li, Q.; Uchenna-Ochege, F.; Li, L. Spatial-temporal characteristics and influencing factors of relative humidity in arid region of Northwest China during 1966–2017. J. Arid. Land 2020, 12, 397–412. [Google Scholar] [CrossRef]
- Ingeominas, Ecopetrol ICP, Invemar. Evolución Geohistórica de la Sierra Nevada de Santa Marta. Caracterización Climática de la SNSM y su Efecto Regulador en el Clima Regional. 2009; pp. 8–44. Available online: https://recordcenter.sgc.gov.co/B13/23008010024382/Documento/PDF/2105243821101000.pdf (accessed on 1 September 2023).
- Kang, S.; Kim, S.; Oh, S.; Lee, D. Predicting spatial and temporal patterns of soil temperature based on topography, surface cover and air temperature. For. Ecol. Manag. 2000, 136, 173–184. [Google Scholar] [CrossRef]
- Fujibe, F. Relation between long-term temperature and wind speed trends at surface observation stations in Japan. SOLA 2009, 5, 81–84. [Google Scholar] [CrossRef]
- Astitha, M.; Nikolopoulos, E. Overview of Extreme Weather Events, Impacts and Forecasting Techniques. In Extreme Weather Forecasting; Elsevier: Amsterdam, The Netherlands, 2023; pp. 1–86. [Google Scholar] [CrossRef]
- Dai, A. Recent Climatology, Variability, and Trends in Global Surface Humidity. J. Clim. 2006, 19, 3589–3606. [Google Scholar] [CrossRef]
- Krueger, E.S.; Ochsner, T.E.; Carlson, J.D.; Engle, D.M.; Twidwell, D.; Fuhlendorf, S.D. Concurrent and antecedent soil moisture relate positively or negatively to probability of large wildfires depending on season. Int. J. Wildland Fire 2016, 25, 657. [Google Scholar] [CrossRef]
- Lonin, S.A.; Hernández, J.L.; Palacios, D.M. Atmospheric events disrupting coastal upwelling in the southwestern Caribbean. J. Geophys. Res. Space Phys. 2010, 115, 1–4. [Google Scholar] [CrossRef]
- Yacomelo, M.J.; Abaunza, C.A. Modelo Productivo de Mango de Azúcar (Mangifera indica L.) Para el Departamento del Magdalena, Corporación Colombiana de Investigación Agropecuaria–AGROSAVIA; Corporación Colombiana de Investigación Agropecuaria: Magdalena, Colombia, 2022; pp. 30–44. Available online: http://hdl.handle.net/20.500.12324/37157 (accessed on 10 October 2023).
- Guzmán, D.; Ruiz, J.F.; Cadena, M. Regionalización de Colombia Según la Estacionalidad de la Precipitación Media Mensual, a Través Análisis de Componentes Principales (ACP); Technical Report; Grupo de Modelamiento de Tiempo, Clima y Escenarios de Cambio Climático, IDEAM: Bogotá, Colombia, 2014; pp. 12–35. Available online: http://www.ideam.gov.co/documents/21021/21141/Regionalizacion+de+la+Precipitacion+Media+Mensual/1239c8b3-299d-4099-bf52-55a414557119 (accessed on 5 November 2023).
- Casallas, A. Estudio del Desarrollo de Eventos de Convección Profunda Asociados a Vientos del Oeste en Superficie en la Sabana de Bogotá. Master’s Thesis, Universidad Nacional de Colombia, Bogotá, Colombia, 2020. [Google Scholar]
- Holton, J. An Introduction to Dynamic Meteorology, 4th ed.; Elsevier Science: Amsterdam, The Netherlands, 2004; Available online: https://www.perlego.com/book/1841735/an-introduction-to-dynamic-meteorology-pdf (accessed on 15 October 2022).
- Reid, A.M.; Fuhlendorf, S.D.; Weir, J.R. Weather Variables Affecting Oklahoma Wildfires. Rangel. Ecol. Manag. 2010, 63, 599–603. [Google Scholar] [CrossRef]
- Yamanaka, T.; Yonetani, T. Dynamics of the evaporation zone in dry sandy soils. J. Hydrol. 1999, 217, 135–148. [Google Scholar] [CrossRef]
- GEMA. El Bosque Seco Tropical (Bs-T). In Programa de Inventario de la Biodiversidad; GEMA: Bogota, Colombia, 1998; pp. 1–15. Available online: https://media.utp.edu.co/ciebreg/archivos/bosque-seco-tropical/el-bosque-seco-tropical-en-colombia.pdf (accessed on 7 October 2023).
- Castro, F.; Tudela, A.; Sebastià, M. Modeling moisture content in shrubs to predict fire risk in Catalonia (Spain). Agric. For. Meteorol. 2003, 116, 49–59. [Google Scholar] [CrossRef]
- Nolan, R.H.; Foster, B.; Griebel, A.; Choat, B.; Medlyn, B.E.; Yebra, M.; Younes, N.; Boer, M.M. Drought-related leaf functional traits control spatial and temporal dynamics of live fuel moisture content. Agric. For. Meteorol. 2022, 319, 108941. [Google Scholar] [CrossRef]
- Parker, G.G. Tamm review: Leaf Area Index (LAI) is both a determinant and a consequence of important processes in vegetation canopies. For. Ecol. Manag. 2020, 477, 118496. [Google Scholar] [CrossRef]
- UAESPNN. Plan de Manejo Básico 2005–2009 Parque Nacional Natural Tayrona; UAESPNN: Santa Marta Magdalena, Colombia, 2006; pp. 53–201. Available online: https://old.parquesnacionales.gov.co/portal/wp-content/uploads/2018/07/PMPNNTayrona.pdf (accessed on 13 November 2023).
- Hersbach, H.; Bell, B.; Berrisford, P.; Biavati, G.; Horányi, A.; Muñoz Sabater, J.; Nicolas, J.; Peubey, C.; Radu, R.; Rozum, I.; et al. ERA5 Hourly Data on Single Levels from 1940 to Present; Copernicus Climate Change Service (C3S) Climate Data Store (CDS): Brussels, Belgium, 2023. [Google Scholar] [CrossRef]
- Noss, R.F.; Franklin, J.F.; Baker, W.L.; Schoennagel, T.; Moyle, P.B. Managing fire-prone forests in the western United States. Front. Ecol. Environ. 2006, 4, 481–487. [Google Scholar] [CrossRef]
- Pizano, C.; González, M.R.; González, M.; Castro-Lima, F.; López, R.; Rodríguez, N.; Idárraga-Piedrahíta, A.; Vargas, W.; Vergara-Varela, H.; Castaño-Naranjo, A.; et al. Las plantas de los bosques secos de Colombia. In El Bosque Seco Tropical en Colombia; Pizano, C., García, H., Eds.; Instituto de Investigación de Recursos Biológicos Alexander von Humboldt (IAvH): Bogotá, Colombia, 2014; ISBN 978-958-8889-01-6. [Google Scholar]
- Lin, X.; Li, Z.; Chen, W.; Sun, X.; Gao, D. Forest Fire Prediction Based on Long- and Short-Term Time-Series Network. Forests 2023, 14, 778. [Google Scholar] [CrossRef]
- Maya-Girón, A.M.; Becoche-Mosquera, J.M.; Gómez-Bernal, L.G. Monitoring of a sub-Andean Forest in restoration process in the Munchique National Natural Park. Biota Colomb. 2023, 24, 2. [Google Scholar] [CrossRef]
- Kraus, P.D.; Goldammer, J.G. Fire regimes and ecosystems: An overview of fire ecology in tropical ecosystems. In Proceedings of the Forest Fires in India, Madurai, India, 19–23 February 2007; pp. 9–13. [Google Scholar]
- McWethy, D.B.; Higuera, P.E.; Whitlock, C.; Veblen, T.T.; Bowman, D.M.J.S.; Cary, G.J.; Haberle, S.G.; Keane, R.E.; Maxwell, B.D.; McGlone, M.S.; et al. A conceptual framework for predicting temperate ecosystem sensitivity to human impacts on fire regimes. Glob. Ecol. Biogeogr. 2013, 22, 900–912. [Google Scholar] [CrossRef]
- Oliveras, I.; Gracia, M.; Moré, G.; Retana, J. Factors influencing the pattern of fire severities in a large wildfire under extreme meteorological conditions in the Mediterranean basin. Int. J. Wildland Fire 2009, 18, 755. [Google Scholar] [CrossRef]
- Ding, H.; Yuan, Z.; Shi, X.; Yin, J.; Chen, F.; Shi, M.; Zhang, F. Soil moisture content-based analysis of terrestrial ecosystems in China: Water use efficiency of vegetation systems. Ecol. Indic. 2023, 150, 110271. [Google Scholar] [CrossRef]
- Rubiano, J.L.; Ortiz, R.; Dueñas, H. Caracterización fisionómica, estructural y florística de un área selvática en la Sierra Nevada de Santa Marta, Colombia. Rev. Biol. Trop. 1994, 42, 89–105. [Google Scholar]
- Otero, J. Planificación Ecorregional para la Definición de Áreas Prioritarias para la Conservación de la Biodiversidad en el Área de Jurisdicción de la Mesa SIRAP Caribe: Informe Final; Ramírez, D., Galindo, G., Cabrera, E., Eds.; Instituto de Recursos Biológicos Alexander von Humboldt: Bogotá, Colombia, 2008; pp. 16–101. Available online: http://hdl.handle.net/20.500.11761/31226 (accessed on 10 November 2023).
- Tovar, C.; Arnillas, C.A.; Cuesta, F.; Buytaert, W. Diverging Responses of Tropical Andean Biomes under Future Climate Conditions. PLoS ONE 2013, 8, e63634. [Google Scholar] [CrossRef] [PubMed]
- Andrade, M.; Aponte, A.; Ardila, M.; Arellano, P.H.; Campos, M.; Calvo, N.; Carreño, E.; Carvajal, J.; Casallas, D.; Cuervo, A.; et al. Clima Integrado de la Serranía de Perijá. Colombia Diversidad Biótica XVIII: Biodiversidad y Territorio de la Serranía del Perijá, (Cesar–Colombia), 1st ed.; Rangel, O., Gonzalo, M., Eds.; Universidad Nacional de Colombia: Bogotá, Colombia, 2019; pp. 93–192. ISBN 978-958-794-112-8. [Google Scholar]
- Kennedy, A.; Jamieson, D. Ecological fire management in north east Victoria. In Proceedings of the Joint AFAC/Bushfire CRC Conference, Hobart, TAS, Australia, 18–20 July 2007; pp. 18–20. [Google Scholar]
- Aponte, C.; de Groot, W.J.; Wotton, B.M. Forest fires and climate change: Causes, consequences and management options. Int. J. Wildland Fire 2016, 25, 1–2. [Google Scholar] [CrossRef]
- Myers, R.L. Convivir con el fuego–Manteniendo los ecosistemas y los medios de subsistencia mediante el Manejo Integral del Fuego. Nat. Conserv. 2006, 1, 1–16. [Google Scholar]
- Armenteras, D.; Rodríguez, N.; Retana, J. Landscape Dynamics in Northwestern Amazonia: An Assessment of Pastures, Fire and Illicit Crops as Drivers of Tropical Deforestation. PLoS ONE 2013, 8, e54310. [Google Scholar] [CrossRef] [PubMed]
- Vallejo, V.R.; Alloza, J.A. Post-fire management in the Mediterranean Basin. Isr. J. Ecol. Evol. 2012, 58, 251–264. [Google Scholar]
- Wang, H.-H.; Finney, M.A.; Song, Z.-L.; Wang, Z.-S.; Li, X.-C. Ecological techniques for wildfire mitigation: Two distinct fuelbreak approaches and their fusion. For. Ecol. Manag. 2021, 495, 119376. [Google Scholar] [CrossRef]
- Boving, I.; Celebrezze, J.; Salladay, R.; Ramirez, A.; Anderegg, L.D.; Moritz, M. Live fuel moisture and water potential exhibit differing relationships with leaf-level flammability thresholds. Funct. Ecol. 2023, 37, 2770–2785. [Google Scholar] [CrossRef]
- Everest, T.; Sungur, A.; Özcan, H. Determination of agricultural land suitability with a multiple-criteria decision-making method in Northwestern Turkey. Int. J. Environ. Sci. Technol. 2021, 18, 1073–1088. [Google Scholar] [CrossRef] [PubMed]
- MinAmbiente. Bancos de Hábitat–Mecanismo para la Implementación de Compensaciones Bióticas. 2022; pp. 8–14. Available online: https://www.minambiente.gov.co/wp-content/uploads/2021/10/Compensaciones-Gui%CC%81a-Bancos-de-Ha%CC%81bitat.pdf (accessed on 15 November 2023).
- Echeverri, J.A.P.; Ruiz, G.A.G. Los bancos de hábitat en Colombia. Una apuesta novedosa. Rev. Aragonesa Adm. Pública 2022, 23, 481–501. [Google Scholar]
- Departamento Nacional de Planeación. CONPES 3934: Política de Crecimiento Verde; Departamento Nacional de Planeación: Bogotá, Colombia, 2018; pp. 66–92. [Google Scholar]
- Vargas, R. Programa de Reducción de la Vulnerabilidad Fiscal del Estado Frente a Desastres Naturales; Banco Mundial: Bogotá, Colombia, 2010. [Google Scholar]
- Jain, P.; Coogan, S.C.P.; Subramanian, S.G.; Crowley, M.; Taylor, S.W.; Flannigan, M.D. A review of machine learning applications in wildfire science and management. Environ. Rev. 2020, 28, 478–505. [Google Scholar] [CrossRef]
- Guariguata, M.R.; Cornelius, J.P.; Locatelli, B.; Forner, C.; Sánchez-Azofeifa, G.A. Mitigation needs adaptation: Tropical forestry and climate change. Mitig. Adapt. Strateg. Glob. Chang. 2008, 13, 793–808. [Google Scholar] [CrossRef]
- Callaway, J.M. Adaptation benefits and costs: Are they important in the global policy picture and how can we estimate them? Glob. Environ. Chang. 2004, 14, 273–282. [Google Scholar] [CrossRef]
- Ahkami, A.H.; Allen White, R.; Handakumbura, P.P.; Jansson, C. Rhizosphere engineering: Enhancing sustainable plant ecosystem productivity. Rhizosphere 2017, 3, 233–243. [Google Scholar] [CrossRef]
- Chen, G.; Meng, T.; Wu, W.; Zhang, J.N.; Tao, Z.; Wang, N.; Si, B.; Li, M.; Feng, H.; Siddique, K.H. Responses of root water uptake to soil water dynamics for three revegetation species on the Loess Plateau of China. Land. Degrad. Dev. 2023, 34, 2228–2240. [Google Scholar] [CrossRef]
- Fries, A.; Rollenbeck, R.; Nauß, T.; Peters, T.; Bendix, J. Near surface air humidity in a megadiverse Andean mountain ecosystem of southern Ecuador and its regionalization. Agric. For. Meteorol. 2012, 152, 17–30. [Google Scholar] [CrossRef]
- Mei, X.; Ma, L. Effect of afforestation on soil water dynamics and water uptake under different rainfall types on the Loess hillslope. Catena 2022, 213, 106216. [Google Scholar] [CrossRef]
- Briceño, A.M.; Rangel-Ch, J.O. Series de clima en anillos de Aspidosperma polyneuron Müll.Arg. y Anacardium excelsum (Bertero ex Kunth) Skeels. Colomb. For. 2021, 24, 52–64. [Google Scholar] [CrossRef]
- Kelly, R.; Boston, E.; Montgomery, W.I.; Reid, N. The role of the seed bank in recovery of temperate heath and blanket bog following wildfires. Appl. Veg. Sci. 2016, 19, 620–633. [Google Scholar] [CrossRef]
- Molina, J.R.; Lora, A.; Prades, C.; Rodríguez y Silva, F. Roadside vegetation planning and conservation: New approach to prevent and mitigate wildfires based on fire ignition potential. For. Ecol. Manag. 2019, 444, 163–173. [Google Scholar] [CrossRef]
- Bergmeier, E.; Capelo, J.; Di Pietro, R.; Guarino, R.; Kavgacı, A.; Loidi, J.; Tsiripidis, I.; Xystrakis, F. ‘Back to the Future’—Oak wood-pasture for wildfire prevention in the Mediterranean. Plant Sociol. 2021, 58, 41–48. [Google Scholar] [CrossRef]
- Nabipour, H.; Shi, H.; Wang, X.; Hu, X.; Song, L.; Hu, Y. Flame Retardant Cellulose-Based Hybrid Hydrogels for Firefighting and Fire Prevention. Fire Technol. 2022, 58, 2077–2091. [Google Scholar] [CrossRef]
- Armenteras, D.; González, T.M.; Retana, J. Forest fragmentation and edge influence on fire occurrence and intensity under different management types in Amazon forests. Biol. Conserv. 2013, 159, 73–79. [Google Scholar] [CrossRef]
- Armenteras, D.; de la Barrera, F. Landscape management is urgently needed to address the rise of megafires in South America. Commun. Earth Environ. 2023, 4, 305. [Google Scholar] [CrossRef]
- Rosengren, L.M.; Schinko, T.; Sendzimir, J.; Mohammed, A.R.; Buwah, R.; Vihinen, H.; Raymond, C.M. Interlinkages between leverage points for strengthening adaptive capacity to climate change. Sustain. Sci. 2023, 18, 2199–2218. [Google Scholar] [CrossRef]
- Hysa, A.; Teqja, Z.; Bani, A.; Libohova, Z.; Cerda, A. Assessing wildfire vulnerability of vegetated serpentine soils in the Balkan peninsula. J. Nat. Conserv. 2022, 68, 126217. [Google Scholar] [CrossRef]
- Chuvieco, E.; Martínez, S.; Román, M.V.; Hantson, S.; Pettinari, M.L. Integration of ecological and socio-economic factors to assess global vulnerability to wildfire. Glob. Ecol. Biogeogr. 2014, 23, 245–258. [Google Scholar] [CrossRef]
- Costa, H.; de Rigo, D.; Libertà, G.; Houston Durrant, T.; San-Miguel-Ayanz, J. European Wildfire Danger and Vulnerability in a Changing Climate: Towards Integrating Risk Dimensions; Publications Office of the European Union: Luxembourg, 2020; ISBN 978-92-76-16898-0. [Google Scholar]
- Aretano, R.; Semeraro, T.; Petrosillo, I.; De Marco, A.; Pasimeni, M.R.; Zurlini, G. Mapping ecological vulnerability to fire for effective conservation management of natural protected areas. Ecol. Model. 2015, 295, 163–175. [Google Scholar] [CrossRef]
- Román, M.V.; Azqueta, D.; Rodrígues, M. Methodological approach to assess the socio-economic vulnerability to wildfires in Spain. For. Ecol. Manag. 2013, 294, 158–165. [Google Scholar] [CrossRef]
- Mimbrero, M.R. Review and New Methodological Approaches in Human-Caused Wildfire Modeling and Ecological Vulnerability: Risk Modeling at Mainland Spain. Doctoral Thesis, University of Zaragoza, Zaragoza, Spain, 2015. [Google Scholar]
- Villers, M.L.; López, J. Comportamiento del fuego y evaluación del riesgo por incendios en las áreas forestales de México: Un estudio en el volcán de La Malinche. In Incendios Forestales en México: Métodos de Evaluación; Villers, M.L., López, J., Eds.; Universidad Nacional Autónoma de México, Centro de Ciencias de la Atmósfera: Mexico City, México, 2004; pp. 57–78. [Google Scholar]
- Martelo-Jiménez, N.; Ríos, O.V. Evaluación del riesgo a incendios de la cobertura vegetal del Santuario de Fauna y Flora Iguaque (Boyacá, Colombia). Caldasia 2022, 44, 380–393. [Google Scholar] [CrossRef]
- Lampin-Maillet, C.; Jappiot, M.; Long, M.; Bouillon, C.; Morge, D.; Ferrier, J.P. Mapping wildland-urban interfaces at large scales integrating housing density and vegetation aggregation for fire prevention in the South of France. J. Environ. Manag. 2010, 91, 732–741. [Google Scholar] [CrossRef] [PubMed]
- Darabi, H.; Islami Farsani, S.; Irani Behbahani, H. Evaluation of ecological vulnerability in Chelgard mountainous landscape. Pollution 2019, 5, 597–610. [Google Scholar] [CrossRef]
- Pellouchoud, K. Social-Environmental Vulnerability: The Social and Environmental Intersection of Land Fire Risk within the Roosevelt National Forest Wildland-Urban Interface. Doctoral Thesis, University of Colorado, Boulder, CO, USA, 2016. [Google Scholar]
- Romshoo, S.A.; Amin, M.; Sastry, K.L.N.; Parmar, M. Integration of social, economic and environmental factors in GIS for land degradation vulnerability assessment in the Pir Panjal Himalaya, Kashmir, India. Appl. Geogr. 2020, 125, 102307. [Google Scholar] [CrossRef]
Figure 1.
(a) Location of Colombia. The star indicates the location of the study area in the northern part of Colombia; (b) close-up of the study area (northern Colombia); (c) biomes in the study area.
Figure 1.
(a) Location of Colombia. The star indicates the location of the study area in the northern part of Colombia; (b) close-up of the study area (northern Colombia); (c) biomes in the study area.

Figure 2.
Number of hotspots illustrated with colors and contours for the period between January 2016 and December 2021 for four seasons of the year: (a) DJF (December, January, and February); (b) MAM (March, April, and May); (c) JJA (June, July, and August); (d) SON (September, October, and November). The maps were constructed using the Cartopy library of Python [35].
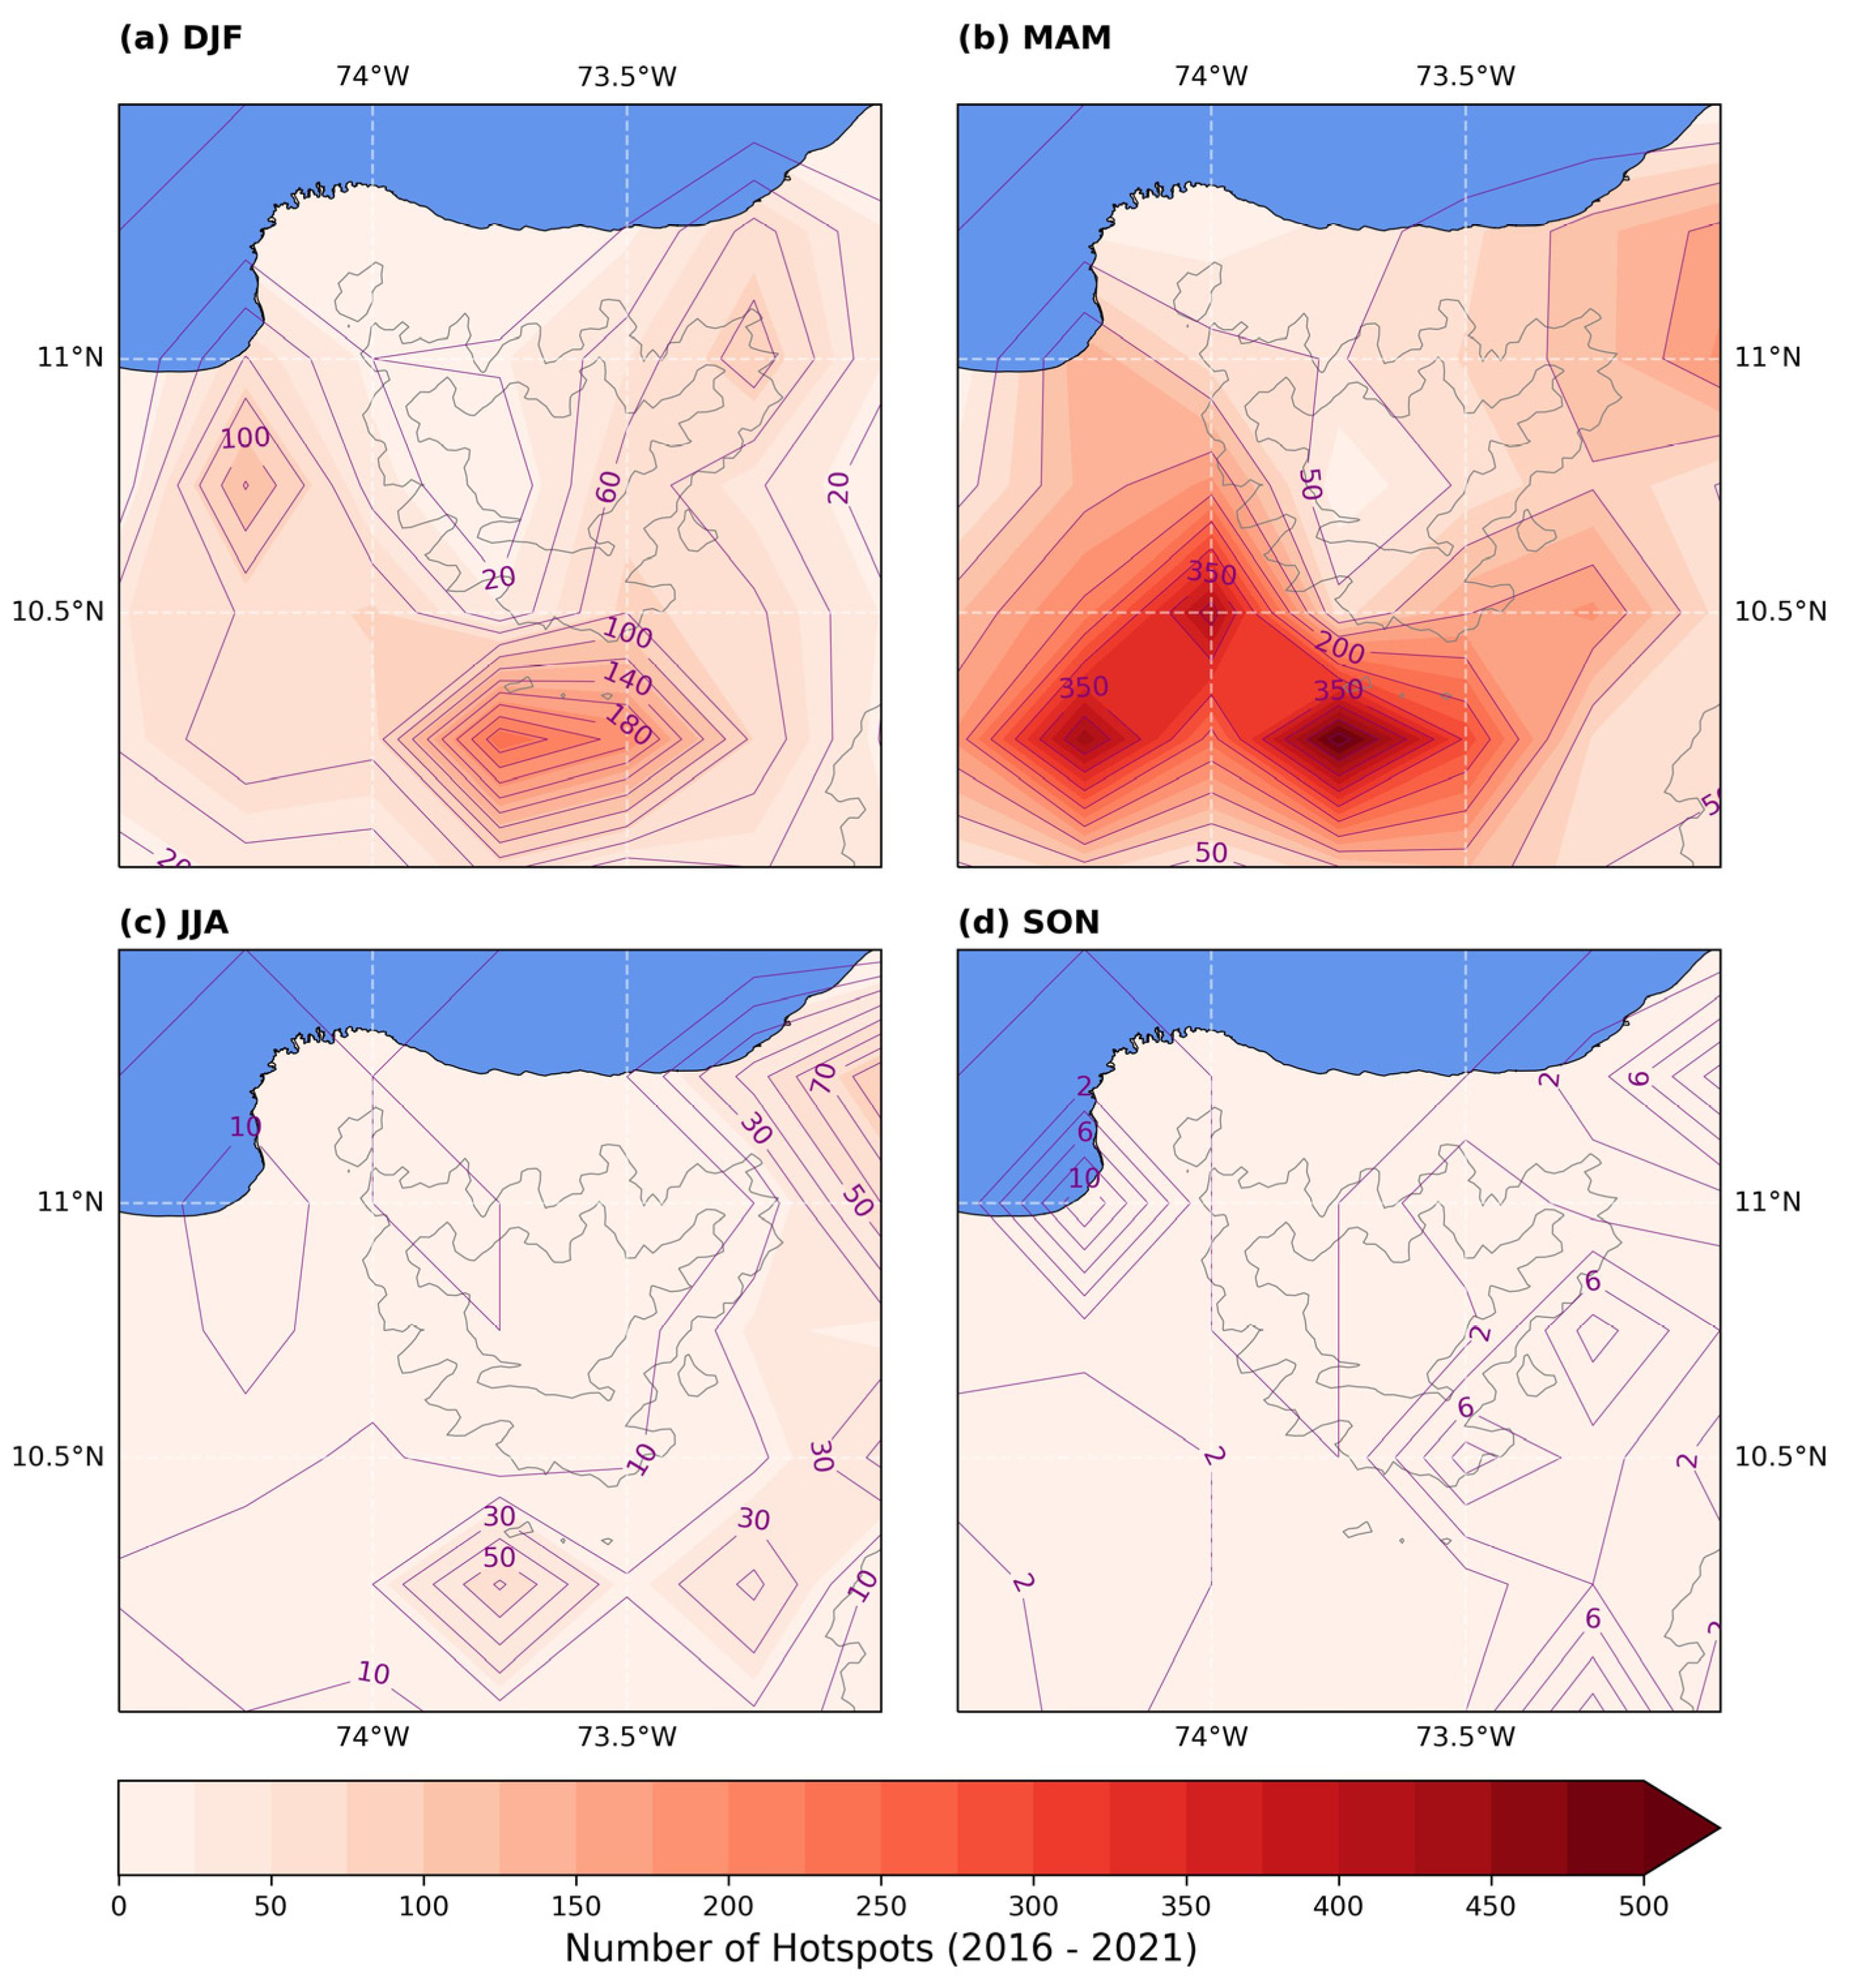
Figure 3.
Neural network structure. Notice that the number of filters, neurons, and activation of each layer are also depicted.
Figure 3.
Neural network structure. Notice that the number of filters, neurons, and activation of each layer are also depicted.

Figure 4.
Comparison of modified temperature and air temperature (ERA5) in a single pixel in a period between November of 2020 and December of 2022 from daily values. Notice that the y-axis has a log scale to better represent the air temperature (ERA5) variability.
Figure 4.
Comparison of modified temperature and air temperature (ERA5) in a single pixel in a period between November of 2020 and December of 2022 from daily values. Notice that the y-axis has a log scale to better represent the air temperature (ERA5) variability.
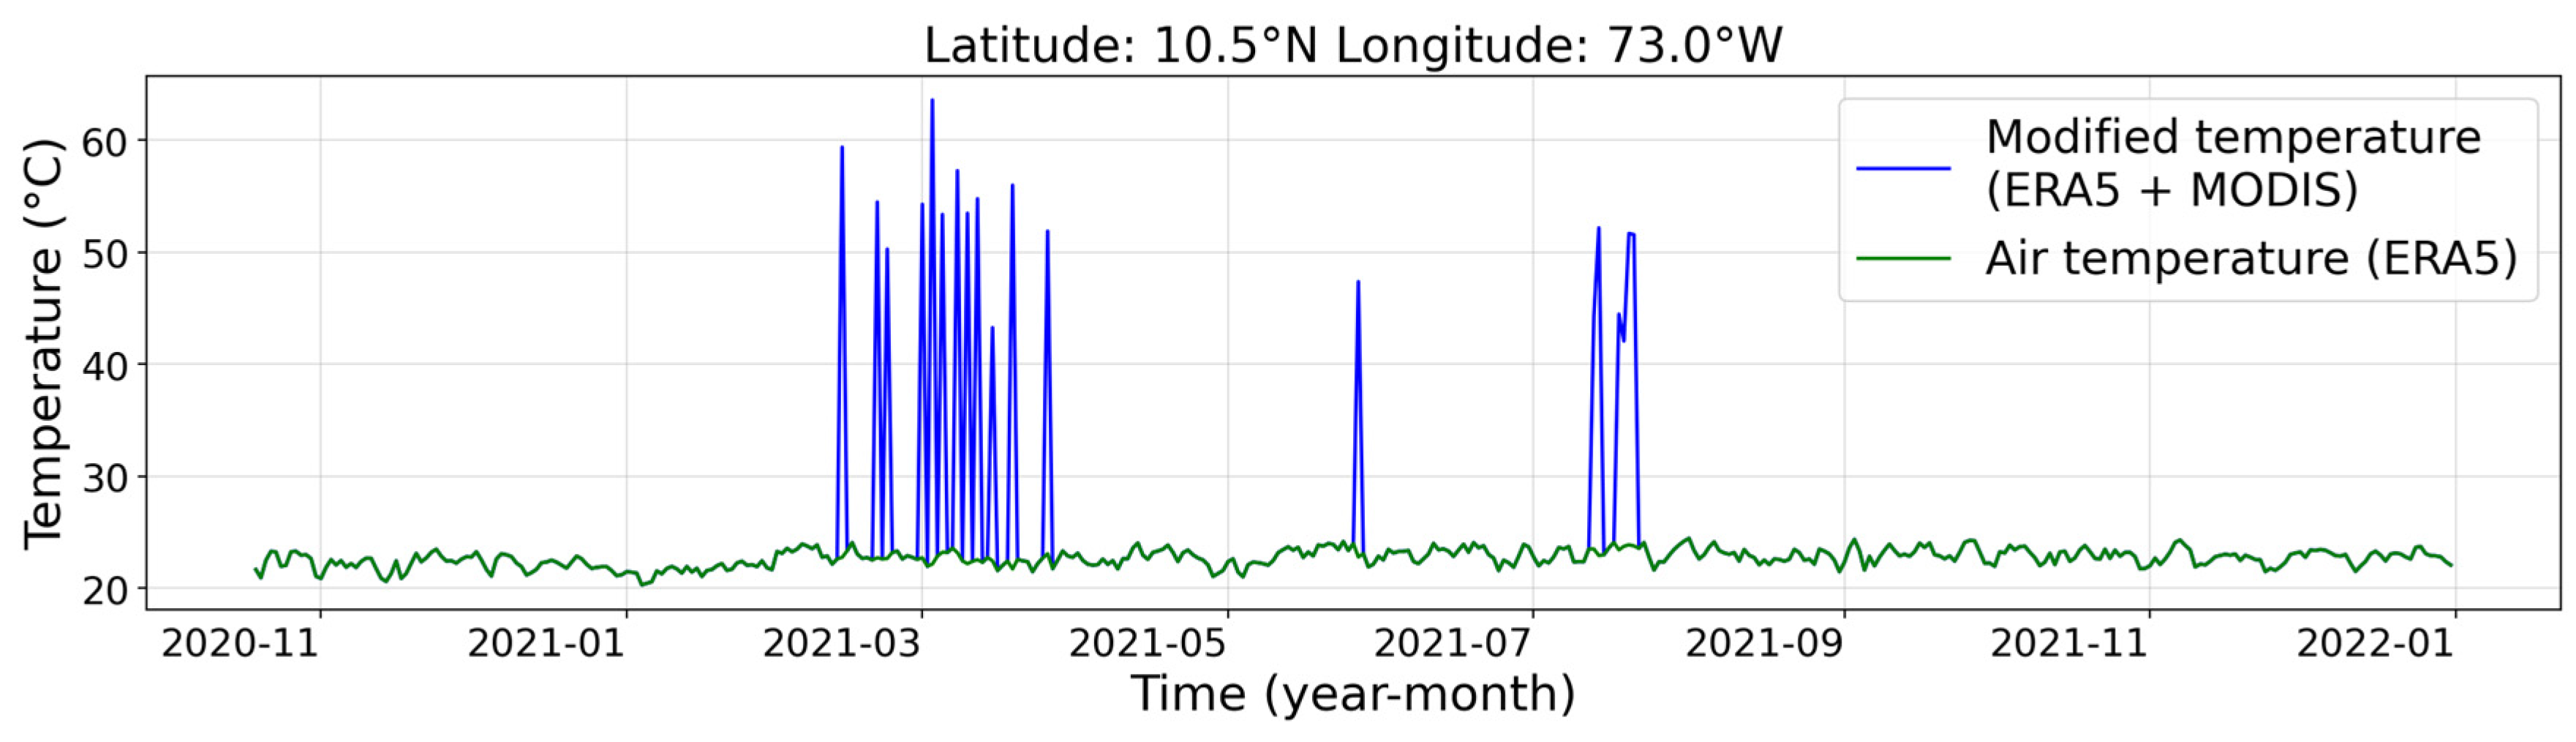
Figure 5.
Boxplots depicting the behavior of atmospheric, edaphic, and vegetation variables during days with wildfire absence (blue) and wildfire occurrence (red) in the respective zones. These are complemented by maps illustrating anomalies on wildfire days and by contours that depict the number and location of the fires. Specifically, we present the following: (a) solar radiation boxplot and (b) its anomalies; (c) air temperature boxplot and (d) its anomalies; (e) soil temperature boxplot and (f) its anomalies; (g) evaporation boxplot and (h) its anomalies; (i) relative humidity boxplot and (j) its anomalies; and (k) precipitation boxplot and (l) its anomalies. The white point in the boxplots denotes the mean. The maps were constructed using the Cartopy library of Python [35].

Figure 6.
Boxplots depicting the behavior of atmospheric, edaphic, and vegetation variables during days with wildfire absence (blue) and wildfire occurrence (red) in the respective zones. These are complemented by maps illustrating anomalies on wildfire days and by contours that depict the number and location of the fires. Specifically, we present the following: (a) volumetric soil water boxplot and (b) its anomalies; (c) wind speed boxplot and (d) its anomalies; (e) leaf skin reservoir content boxplot and (f) its anomalies; (g) LAI of high vegetation boxplot and (h) its anomalies; and (i) LAI of low vegetation boxplot and (j) its anomalies. The white point in the boxplots denotes the mean. The maps were constructed using the Cartopy library of Python [35].

Figure 7.
Statistical parameters. Spatial (a) HIT; (b) FAR; (c) POC of the probabilistic model from Monte Carlo simulations using the ANN architecture; (d) general HIT, FAR and POC of ANN (blue) and RF (green) for the deterministic and probabilistic models, respectively. The maps were constructed using the Cartopy library of Python [35].
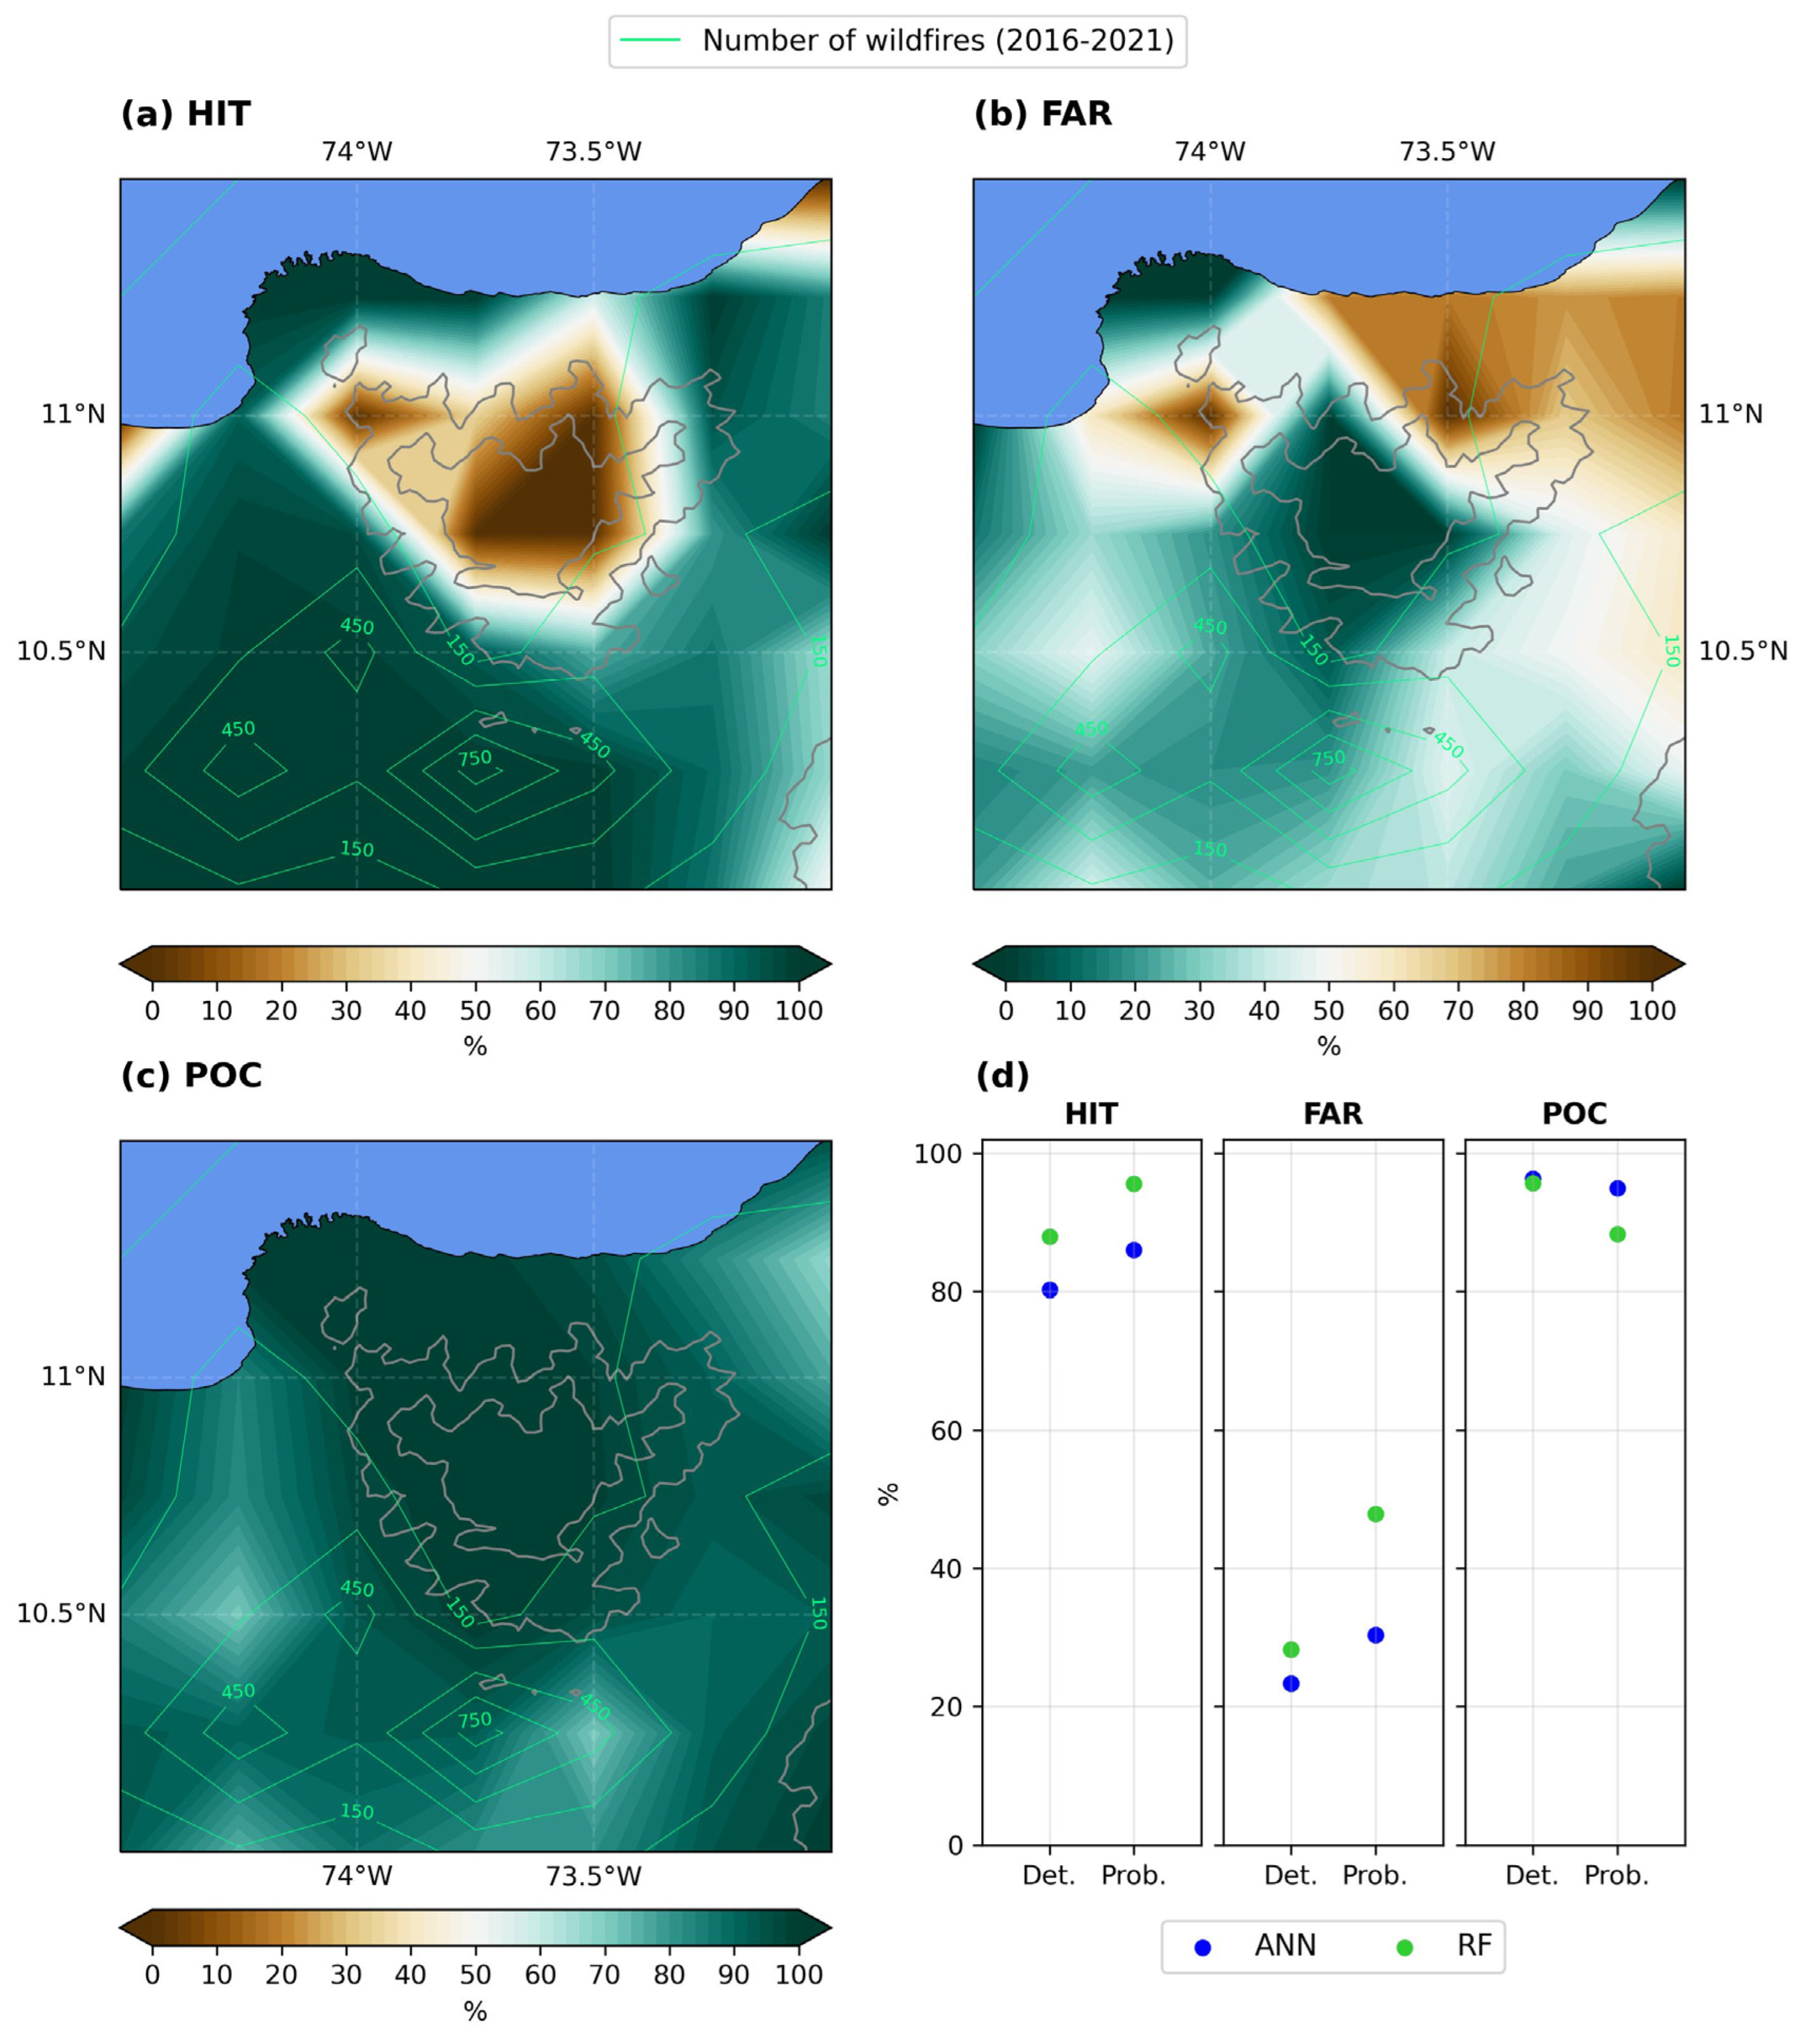
Figure 8.
(a) Example of a day without wildfires which corresponds to 19 October 2020; (b) example of a day with wildfires which corresponds to 17 February 2021. The yellow dots represent the location of wildfires during the example day, which was randomly selected. Using other days leads to the same results, which show the robustness of the ML technique. The maps were constructed using the Cartopy library of Python [35].

Figure 9.
Risk on 1 March 2021. (a) Probability of high-temperature class; (b) probability of medium-temperature class; (c) probability of low-temperature class; (d) global vulnerability. The yellow dots represent the location of wildfires during the example day, which was randomly selected. The maps were constructed using the Cartopy library of Python [35].

Figure 10.
Change in vulnerability scenarios with the administrative division. It is important to emphasize that vulnerability was assessed on a scale from 1 to 5. (a) Scenario 1: change in land cover type and threat level of strategic ecosystem; (b) Scenario 2: respond capacity increase; (c) Scenario 3: variation in climatic conditions (+1.5 °C). The maps were constructed using the Cartopy library of Python [35].
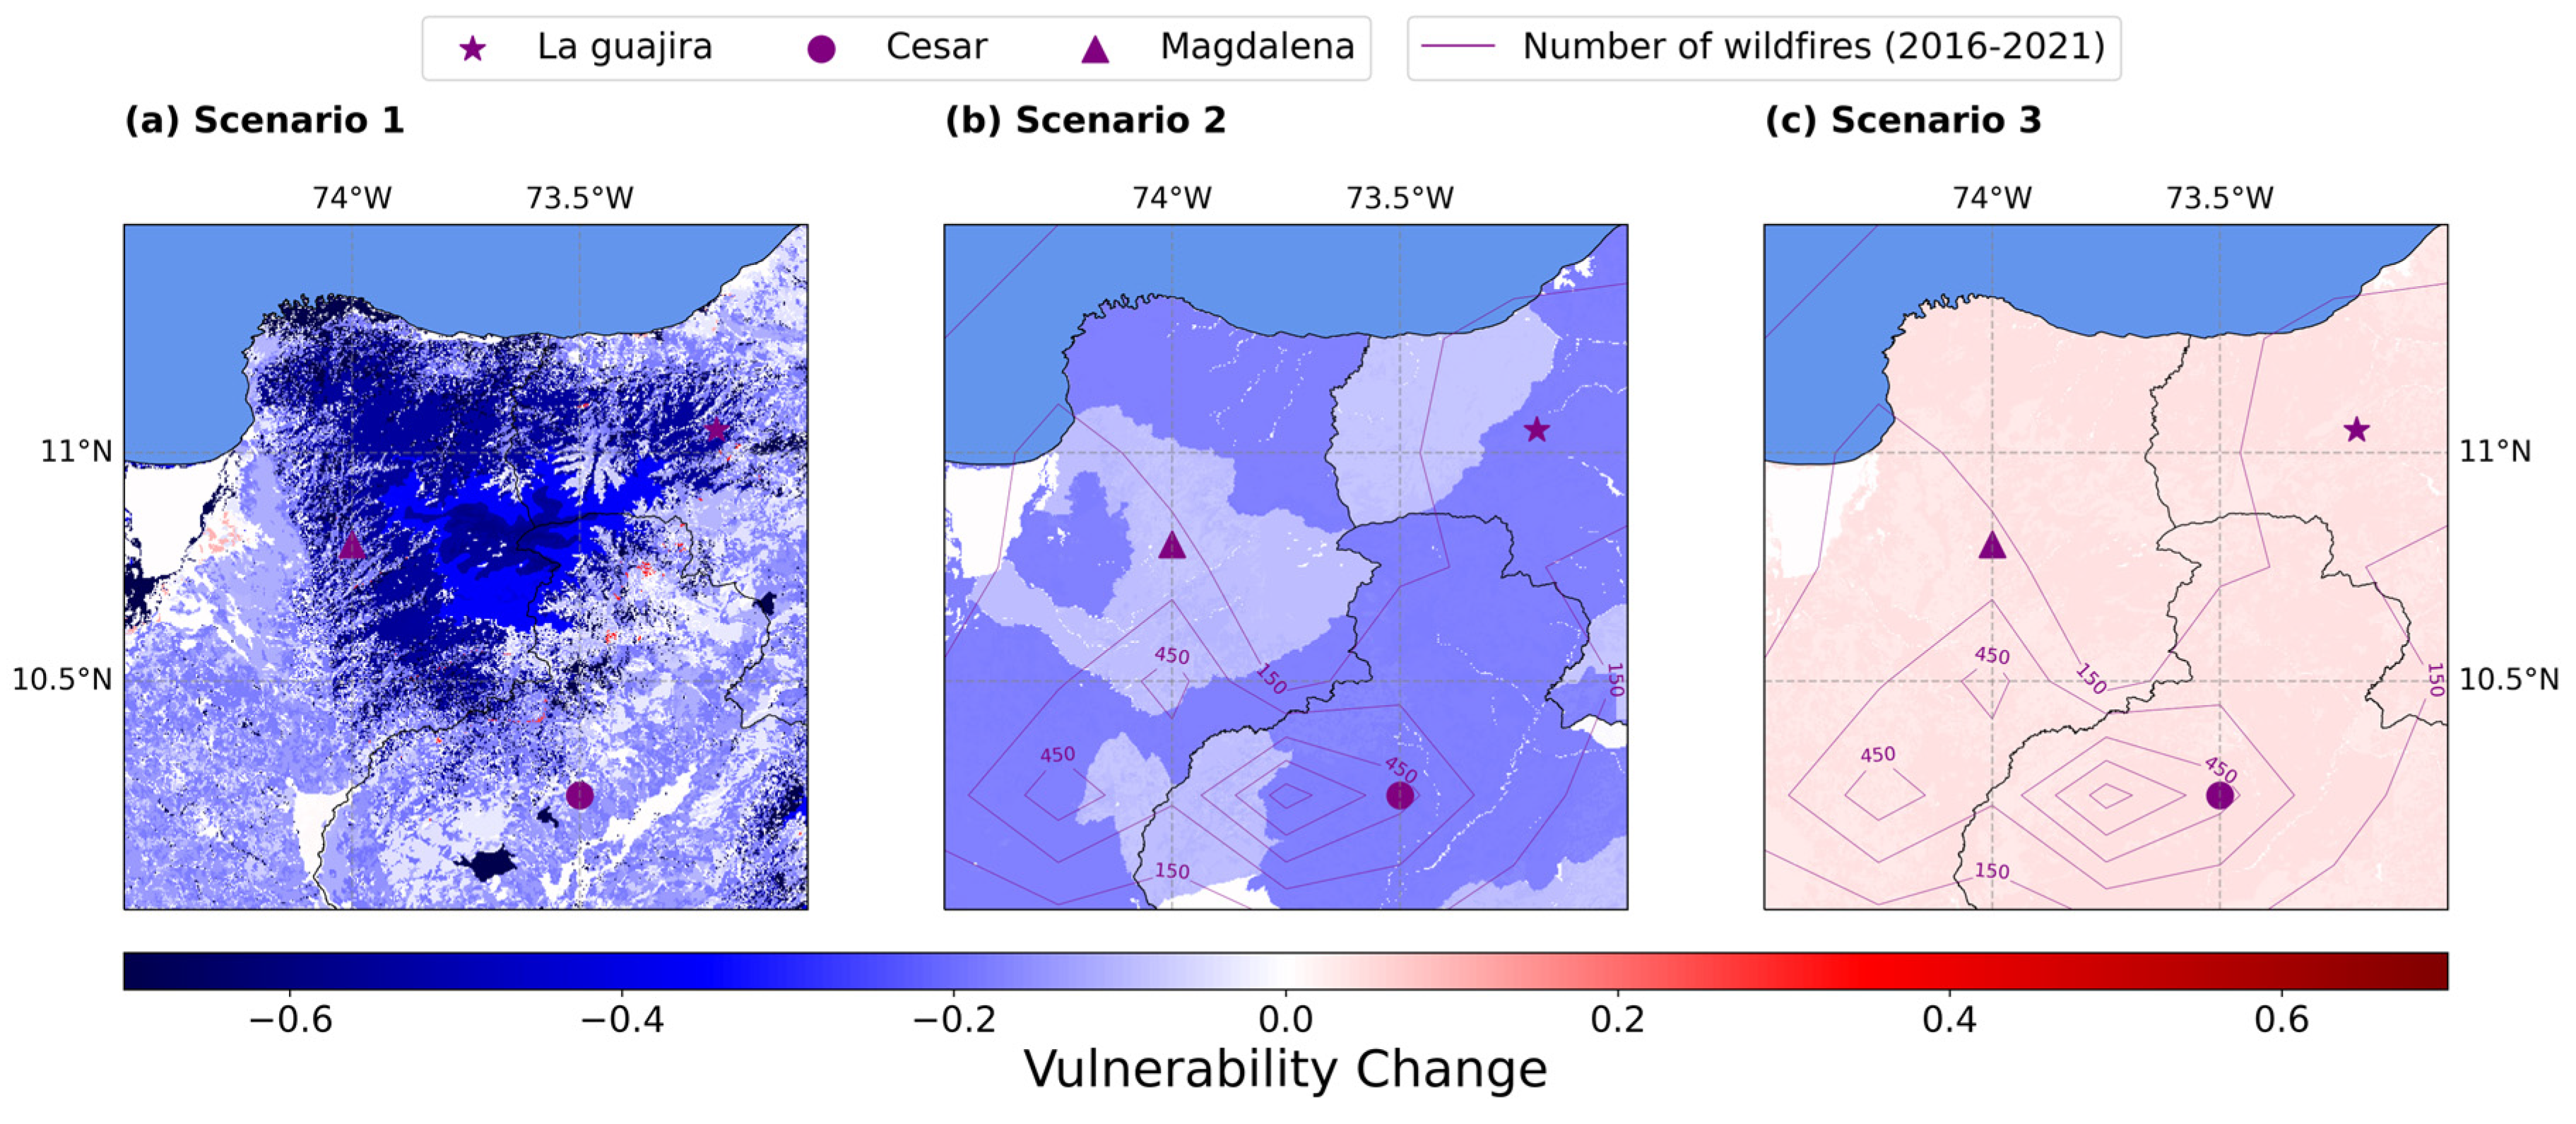
Figure 11.
Change in risk scenarios of high temperatures by modifying vulnerability. (a) Scenario 1: cover type and strategic threatened ecosystems’ qualification; (b) scenario 2: respond capacity increase; (c) scenario 3: variation in climatic conditions (+1.5 °C). The maps were constructed using the Cartopy library of Python [35].

Figure 12.
Risk scenarios of high temperature by modifying hazard in values corresponding to 0.2 of the normalization of each pixel for each variable for (a) leaf skin reservoir content; (b) relative humidity; (c) soil temperature; (d) wind velocity. Red contours depict the number and location of the hotspots per season. The maps were constructed using the Cartopy library of Python [35].

Disclaimer/Publisher’s Note: The statements, opinions and data contained in all publications are solely those of the individual author(s) and contributor(s) and not of MDPI and/or the editor(s). MDPI and/or the editor(s) disclaim responsibility for any injury to people or property resulting from any ideas, methods, instructions or products referred to in the content. |
© 2024 by the authors. Licensee MDPI, Basel, Switzerland. This article is an open access article distributed under the terms and conditions of the Creative Commons Attribution (CC BY) license (https://creativecommons.org/licenses/by/4.0/).
Share and Cite
MDPI and ACS Style
Cabrera, A.; Ferro, C.; Casallas, A.; López-Barrera, E.A. Wildfire Scenarios for Assessing Risk of Cover Loss in a Megadiverse Zone within the Colombian Caribbean. Sustainability 2024, 16, 3410. https://doi.org/10.3390/su16083410
AMA Style
Cabrera A, Ferro C, Casallas A, López-Barrera EA. Wildfire Scenarios for Assessing Risk of Cover Loss in a Megadiverse Zone within the Colombian Caribbean. Sustainability. 2024; 16(8):3410. https://doi.org/10.3390/su16083410
Chicago/Turabian StyleCabrera, Ailin, Camilo Ferro, Alejandro Casallas, and Ellie Anne López-Barrera. 2024. "Wildfire Scenarios for Assessing Risk of Cover Loss in a Megadiverse Zone within the Colombian Caribbean" Sustainability 16, no. 8: 3410. https://doi.org/10.3390/su16083410
Note that from the first issue of 2016, this journal uses article numbers instead of page numbers. See further details here.