Article

Assessing Tornado Impacts in the State of Kentucky with a Focus on Demographics and Roadways Using a GIS-Based Approach

1
Department of Civil and Environmental Engineering, FAMU–FSU College of Engineering, Tallahassee, FL 32310, USA
2
Iteris, Inc., Tallahassee, FL 32304, USA
*
Author to whom correspondence should be addressed.
Sustainability 2024, 16(3), 1180; https://doi.org/10.3390/su16031180
Submission received: 2 December 2023 / Revised: 20 January 2024 / Accepted: 23 January 2024 / Published: 31 January 2024
(This article belongs to the Special Issue Sustainable Resilience Planning for Natural Hazard Events)

Abstract

:
Although the literature provides valuable insight into tornado vulnerability and resilience, there are still research gaps in assessing tornadoes’ impact on communities and transportation infrastructure, especially in the wake of the rapidly changing frequency and strength of tornadoes due to climate change. In this study, we first investigated the relationship between tornado exposure and demographic-, socioeconomic-, and transportation-related factors in our study area, the state of Kentucky. Tornado exposures for each U.S. census block group (CBG) were calculated by utilizing spatial analysis methods such as kernel density estimation and zonal statistics. Tornadoes between 1950 and 2022 were utilized to calculate tornado density values as a surrogate variable for tornado exposure. Since tornado density varies over space, a multiscale geographically weighted regression model was employed to consider spatial heterogeneity over the study region rather than using global regression such as ordinary least squares (OLS). The findings indicated that tornado density varied over the study area. The southwest portion of Kentucky and Jefferson County, which has low residential density, showed high levels of tornado exposure. In addition, relationships between the selected factors and tornado exposure also changed over space. For example, transportation costs as a percentage of income for the regional typical household was found to be strongly associated with tornado exposure in southwest Kentucky, whereas areas close to Jefferson County indicated an opposite association. The second part of this study involves the quantification of the tornado impact on roadways by using two different methods, and results were mapped. Although in both methods the same regions were found to be impacted, the second method highlighted the central CBGs rather than the peripheries. Information gathered by such an investigation can assist authorities in identifying vulnerable regions from both transportation network and community perspectives. From tornado debris handling to community preparedness, this type of work has the potential to inform sustainability-focused plans and policies in the state of Kentucky.

1. Introduction

Over the last century, many tornadoes have hit the continental U.S., causing significant economic losses. For example, between 1949 and 2006, 793 tornadoes caused more than USD 1 million in losses for each tornado [1]. In addition to the monetary damage, the catastrophes were also to blame for 71 fatalities annually between 1993 and 2022 [2]. While being subjected to a tornado can result in death, injuries, and property damage, it can also have a lasting impact on the psychological well-being of the public [3]. Making this problem even more challenging, tornado risk is expected to increase due to higher exposure and climate-change-driven factors [4]. When all these issues are considered, it is essential to develop methodologies that can help mitigate the impact of these disasters and alleviate associated problems.
Like any disaster, it is critical to investigate tornado victims’ experiences to understand individual risk perception, preparedness, response, protective action, and recovery techniques. Wang et al. [5] conducted qualitative analyses related to the community resilience of the EF3 Jacksonville tornado survivors. The oral history approach was used to analyze the experience of 25 residents who experienced this EF3 tornado in Jacksonville, AL on 19 March 2018. Analyzed data gave insight into different recovery paths and challenges. It has also been discovered that persistent trauma and recovery issues were common in rural areas due to extensive damage and housing shortages. Similarly, Falcon et al. inspected systemic vulnerabilities created by informal warning systems for U.S. Hispanic and Latinx immigrants during the 2021 quad-state tornado outbreak by conducting semi-structured interviews [6]. Twenty-five participants who contributed to the research with the most valuable information were chosen by critical sampling strategy. The interviews revealed that language barriers and complex English jargon hindered critical information access. Another study by Senkbeil et al. aimed to find out the effect of ethnic and racial differences in tornado hazard perception, preparedness, and shelter lead time for the 27 April 2011 EF4 Tuscaloosa, AL tornado [7]. In a hybrid survey and interview conducted in the following two weeks, it was found that there were significant differences between hazard perception, preparedness, and shelter lead time among three ethnic and racial groups.
In the literature, several factors have been found to cause some demographic groups of people to be more vulnerable [8]. One of those groups is mobile homeowners. Strader and Ashley [9] assessed the tornado impact probability of that susceptible population. They performed a comparative analysis between Alabama and Kansas to highlight tornado risk, exposure, and vulnerability of mobile home residents. The Monte Carlo simulation tool was employed to simulate physical exposure of mobile home vulnerability using historical tornado paths and land parcel-level mobile home (MH) data across Alabama and Kansas, and a socioeconomic and demographic vulnerability index was created (SEDVI). They suggested that tornado impact potential on mobile homes was 4.5 times (350%) greater in Alabama than in Kansas, attributed to the greater sprawling mobile-home distribution and higher mobile home numbers in Alabama. In addition, Strader et al. [10] investigated evacuation vulnerability of mobile home residents and emergency medical service access during tornado events for the state of Alabama by employing geospatial network analysis techniques. Using these techniques, they tried to understand possible reasons for problematic sheltering rates of mobile homeowners by comparing the accessibility of mobile and permanent homes to potential sheltering locations. Furthermore, an assessment of emergency medical service response times for both mobile and permanent homes was conducted using a network analysis methodology. While doing network analysis, it was assumed that people traveled at posted speed limits and that the roadway network was free of any obstacles (downed electric lines and trees, road closures, accidents, etc.). The results indicate that the distances and travel times from mobile homes to shelters are significantly greater than those from permanent homes to shelters. This observation is linked to the predominant rural locations of mobile homes, particularly notable in Southern Alabama.
To decrease disaster-induced vulnerability, the first step is to quantify community resilience. Like tornadoes, hurricanes also cause disruptions like power outages and debris formation. Therefore, the literature regarding hurricanes can also provide insights into quantifying the disruption caused by tornadoes. For example, Ulak et al. investigated Hurricane Hermine-induced power outages in the community and infrastructure of Tallahassee, FL through spatial and statistical analyses [11]. The spatial analysis was employed to detect highly impacted regions based on the ‘percentage of the affected customers’ criteria, while the Bayesian spatial autoregressive model was utilized to associate those customers with their demographics, socioeconomic status, access to transportation infrastructure, and hurricane-related features. Karaer et al. proposed a data fusion framework to identify critical factors in debris formation to detect post-hurricane vegetative debris in Tallahassee, FL after Hurricane Michael [12]. The paper achieved this by combining spectral and vector datasets from four major domains: vegetation, storm surge, land use, and socioeconomics. It was found that Hurricane Michael caused a larger volume of debris in the study area block groups where there was a higher proportion of elderly people and/or higher-income households.
In addition to measuring disruption after disasters, evaluating variables related to tornado exposure can help the authorities to pinpoint problematic locations related to tornadoes. In their study, Dixon and Moore used tornado incidences between 1950 and 2008 and several sociodemographic variables of Texas counties to rate county-level tornado vulnerability and assess the spatial distribution of tornadoes [13]. They used Pielke and Pielke’s (1997) technique, where the susceptibility of an area to a specific hazard is influenced by societal exposure to the area and the incidence of that hazard [14]. Three different assessment methods were used to map the vulnerability. Even though spatial distribution varied diversely based on the method used, some counties were classified as highly vulnerable in all three methods. Differing from the technique proposed by Pielke and Pielke, Leon-Cruz and Castillo-Aja conceptualized tornado risk in an area as a composite of hazard, vulnerability, and exposure [15]. In their investigation, they examined tornado hazard, vulnerability, and exposure at the municipality level in Mexico, employing a GIS-based approach. For tornado hazard assessment, they integrated historical tornado reports with potentially severe convective environments. Tornado vulnerability was addressed by the construction of socioeconomic indicators and multivariate statistics employed to reduce the potential number of variables. The resulting values were weighted based on their explanatory power to create a vulnerability index. Tornado exposure was measured using the population density of municipalities. Subsequently, the tornado risk index was computed by multiplying the vulnerability, hazard, and exposure indices. The spatial distribution of these risk components and the tornado risk index was presented separately, classified from very low to very high using the natural classification method. Finally, the study showcased the percentage of municipalities categorized by state, with varying computed risk levels ranging from very low to very high.
Vulnerable locations can also be determined by spatial analysis methods. Blinn (2012) estimated the density of tornado days in the commonwealth of Kentucky for tornadoes between 1950 and 2010 [16]. Tornado incidence data within the state of Kentucky were included in the spatial analysis. Using kernel density estimation, tornado impact density was calculated for the state of Kentucky. Afterwards, tornado risk zones for the study area were categorized into three classes using −1 and 1 standard deviation as break values, and the exposure zones were then mapped. It was found that southwest Kentucky was more vulnerable to tornadoes in terms of tornado days, while the southeast portion experienced fewer tornadoes than average. Hwang and Meier [17] examined past tornadoes that occurred in the US in the period 1950–2015. The tornado database from the Storm Prediction Center (SPC) was used to carry out raster-based spatial analysis. In the analysis, techniques like point density map analysis and map algebra were utilized to detect areas with a high risk of tornadoes. It was found that regions affected by tornadoes varied over time, stretching from the traditional ‘Tornado Alley’ to the other eastern states, including Kentucky.
While detecting vulnerable locations due to tornadoes, population bias should be taken into consideration as it can affect the reporting of tornadoes. As discussed by Schaefer and Galway [18], due to the population bias in the western plains from Oklahoma to the Dakotas, when a tornado impacts an urban location, it is more likely to have a higher rating than those in a rural area. In addition to lower F-scale ratings, the density of tornado reports is also affected by population bias. A study that tried to estimate tornado reporting rates and expected tornado counts over central United States between 1975 and 2016 [19] found that the frequency of tornado reporting showed a noticeable decline as one moved farther from densely populated areas. To illustrate, over 90% of tornadoes were reported to have occurred within 5 km of a city with a population exceeding 100,000. On the other hand, this reporting rate diminished to less than 70% at farther distances ranging from 20 to 25 km. Similarly, Elsner [20] found that, starting in 1950, tornado reports in cities within the 5.5° latitude × 5.5° longitude region centered on Russell, Kansas, with a minimum population of 1000, consistently exceeded their rural counterparts by an average of 70%.
As Blinn [16] depicted, some regions may be particularly vulnerable to tornadoes. In addition to that, social vulnerability also changes spatially. To consider these multiple spatial variations, spatial statistics techniques like geographically weighted regression (GWR) can be employed. In a study by Wang et al. (2017), GWR was employed to investigate the spatially explicit relationship between inundation frequency and spatial explanatory variables [21]. They indicated that the GWR model was useful for investigating spatially varied causes of floods. Similarly, Chun et al. [22] used GWR to measure the heterogeneity of local indicators of flooding risk for flood-prone areas in the city of Seoul. This study employed GWR to develop an assessment model for social resilience. Similar to the previous study, the local GWR model showed better results than the global ordinary least squares (OLS) model. This can be attributed to GWR’s ability to consider spatial heterogeneities. On the other hand, global models like OLS assume that the observations are independent and identically distributed and neglect spatial autocorrelation and non-stationarity [23].
As described above, GWR can be more successful than a global model in explaining spatial relations. However, it has some limitations, such as assuming each explanatory variable to have the same spatial variability. To relax this assumption, multiscale geographically weighted regression (MGWR) can be employed instead of GWR. MGWR yields more accurate results as each variable is evaluated by different levels of spatial heterogeneity. In addition, changing spatial scales of each variable provides valuable information to better understand a given spatial phenomenon [24].
Although the literature provides valuable insights into community vulnerability and resilience against tornadoes, there is still a gap in providing risk assessment using advanced GIS models. As such, this paper provides a meaningful contribution to the research literature by introducing several key innovations in the realm of GIS-based tornado risk assessment. Firstly, a finer spatial unit is employed compared with the other studies [13,15], offering higher spatial resolution to understand the relation of selected variables with the tornado impact. Secondly, this research particularly focuses on the vulnerability of the region by focusing on each of these variables contrary to existing work [13,15] that created composite indices while quantifying the vulnerability using various variables. As a result, any associated impact and exposure can be analyzed in a more comprehensive manner. Thirdly, employing multiscale GWR combined with this multi-variable focus enables us to provide a sensitivity analysis between selected variables and tornado impact, which provides a better understanding of the impact over the study region. During this analysis, spatial heterogeneities and spatial nonstationary are also considered. Finally, there is a notable gap in the existing literature regarding quantifying roadway disruption that can be caused by tornado debris. Although several studies have a particular focus on transportation vulnerability, they are mostly based on critical infrastructure, and roadway closures during disasters are not considered [25,26,27]. In this paper, a scoring method is utilized to quantify tornado impact on roadways to detect vulnerable census block groups with regards to roadway accessibility. From tornado debris handling to community preparedness, this type of work has the potential to inform sustainability-focused plans and policies in the state of Kentucky. Furthermore, this scoring method can be integrated into research that is intended to estimate travel times more accurately in the aftermath of tornadoes.

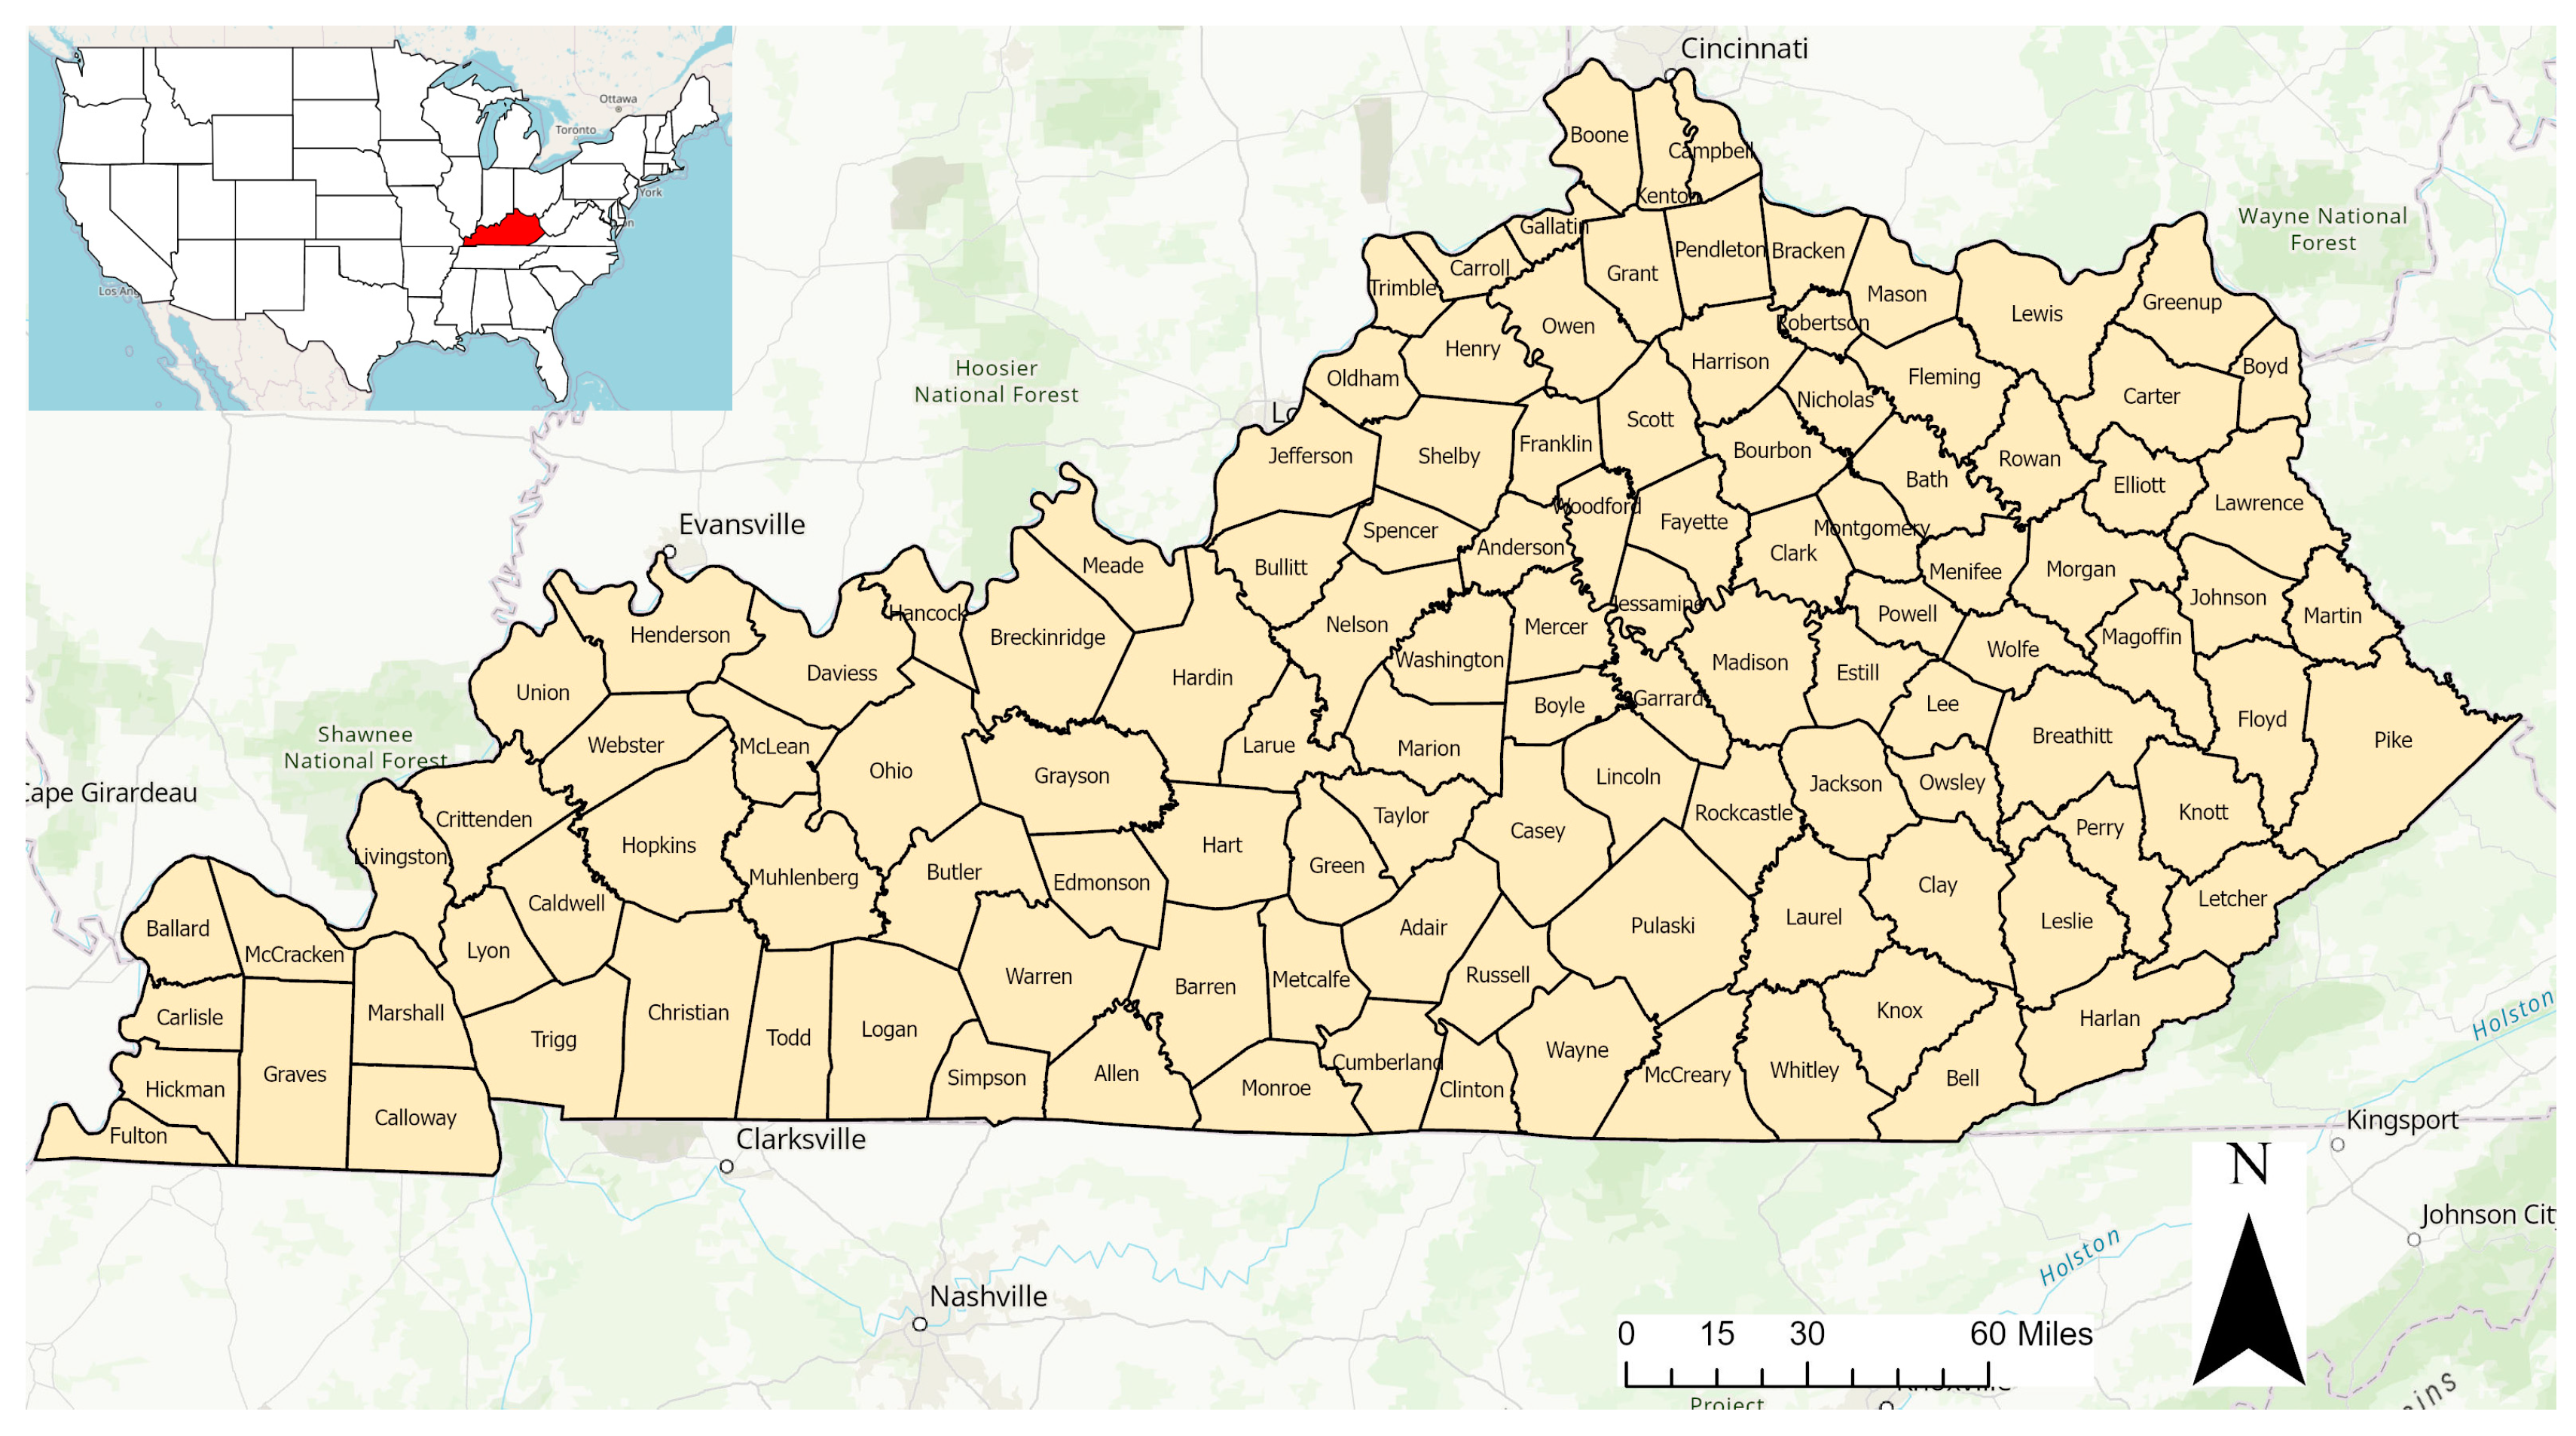
2. Study Area and Data Collection

The state of Kentucky was chosen as the study area for several reasons. First, there are limited studies in the literature that focus on the impact of tornadoes in Kentucky (see Figure 1 to see the state and its counties). Second, the literature suggests that there has been an upward trend in tornado occurrences in some states, including Kentucky [28]. Therefore, this region should be investigated more, with a focus on tornado-induced damage. Finally, Kentucky has been found to have the seventh-worst economy out of the 50 states with a poverty rate of 14.9% [29]. Out of 120 counties, 54 of them in eastern Kentucky are located within the largest economically distressed region, with most classified as economically distressed [30].
In this paper, vector-based tornado incidence data, as well as socioeconomic, demographic, and transportation-related data, were collected from several sources. ArcGIS Pro v3.0 was utilized to process these datasets. These datasets (i.e., American Community Surveys, Smart Location Database, and Center for Neighborhood Technology’s Housing and Transportation Affordability Index) are shown in Table 1, including variable names with explanations for all the variables. They will be explained in the next subsections.

2.1. TIGER and ACS Dataset

The state border GIS database for each census block group in Kentucky was created using the U.S. cartographic border file from the Topologically Integrated Geographic Encoding and Referencing (TIGER) geographic database created by the U.S. Census Bureau. In addition, the American Community Surveys (ACS) 2019 dataset was used to obtain demographic and socioeconomic data. Variables of ACS are typical socioeconomic and demographic indicators that can be used to assess the vulnerability of the region. Therefore, similar variables have been used in other studies such as total population [31,32], population density [32,33], white population [32], median household income [32,34], vulnerable age groups (e.g., under 18 and over 65) [32,35], and number of housing units [32].

2.2. Smart Location Calculator Dataset

The Smart Location Database is a freely accessible data service that was produced by the Environmental Protection Agency under the Smart Growth Program [36]. The dataset has been used to utilize socioeconomic and transportation-related data for each census block group in Kentucky.

2.3. H + T Index

The Center for Neighborhood Technology’s Housing and Transportation Affordability (H + T) Index was used to gather additional information based on transportation characteristics, transport affordability, and housing. It is a novel tool that calculates the transportation costs connected with a household location [37].

2.4. Tornado Incident Dataset
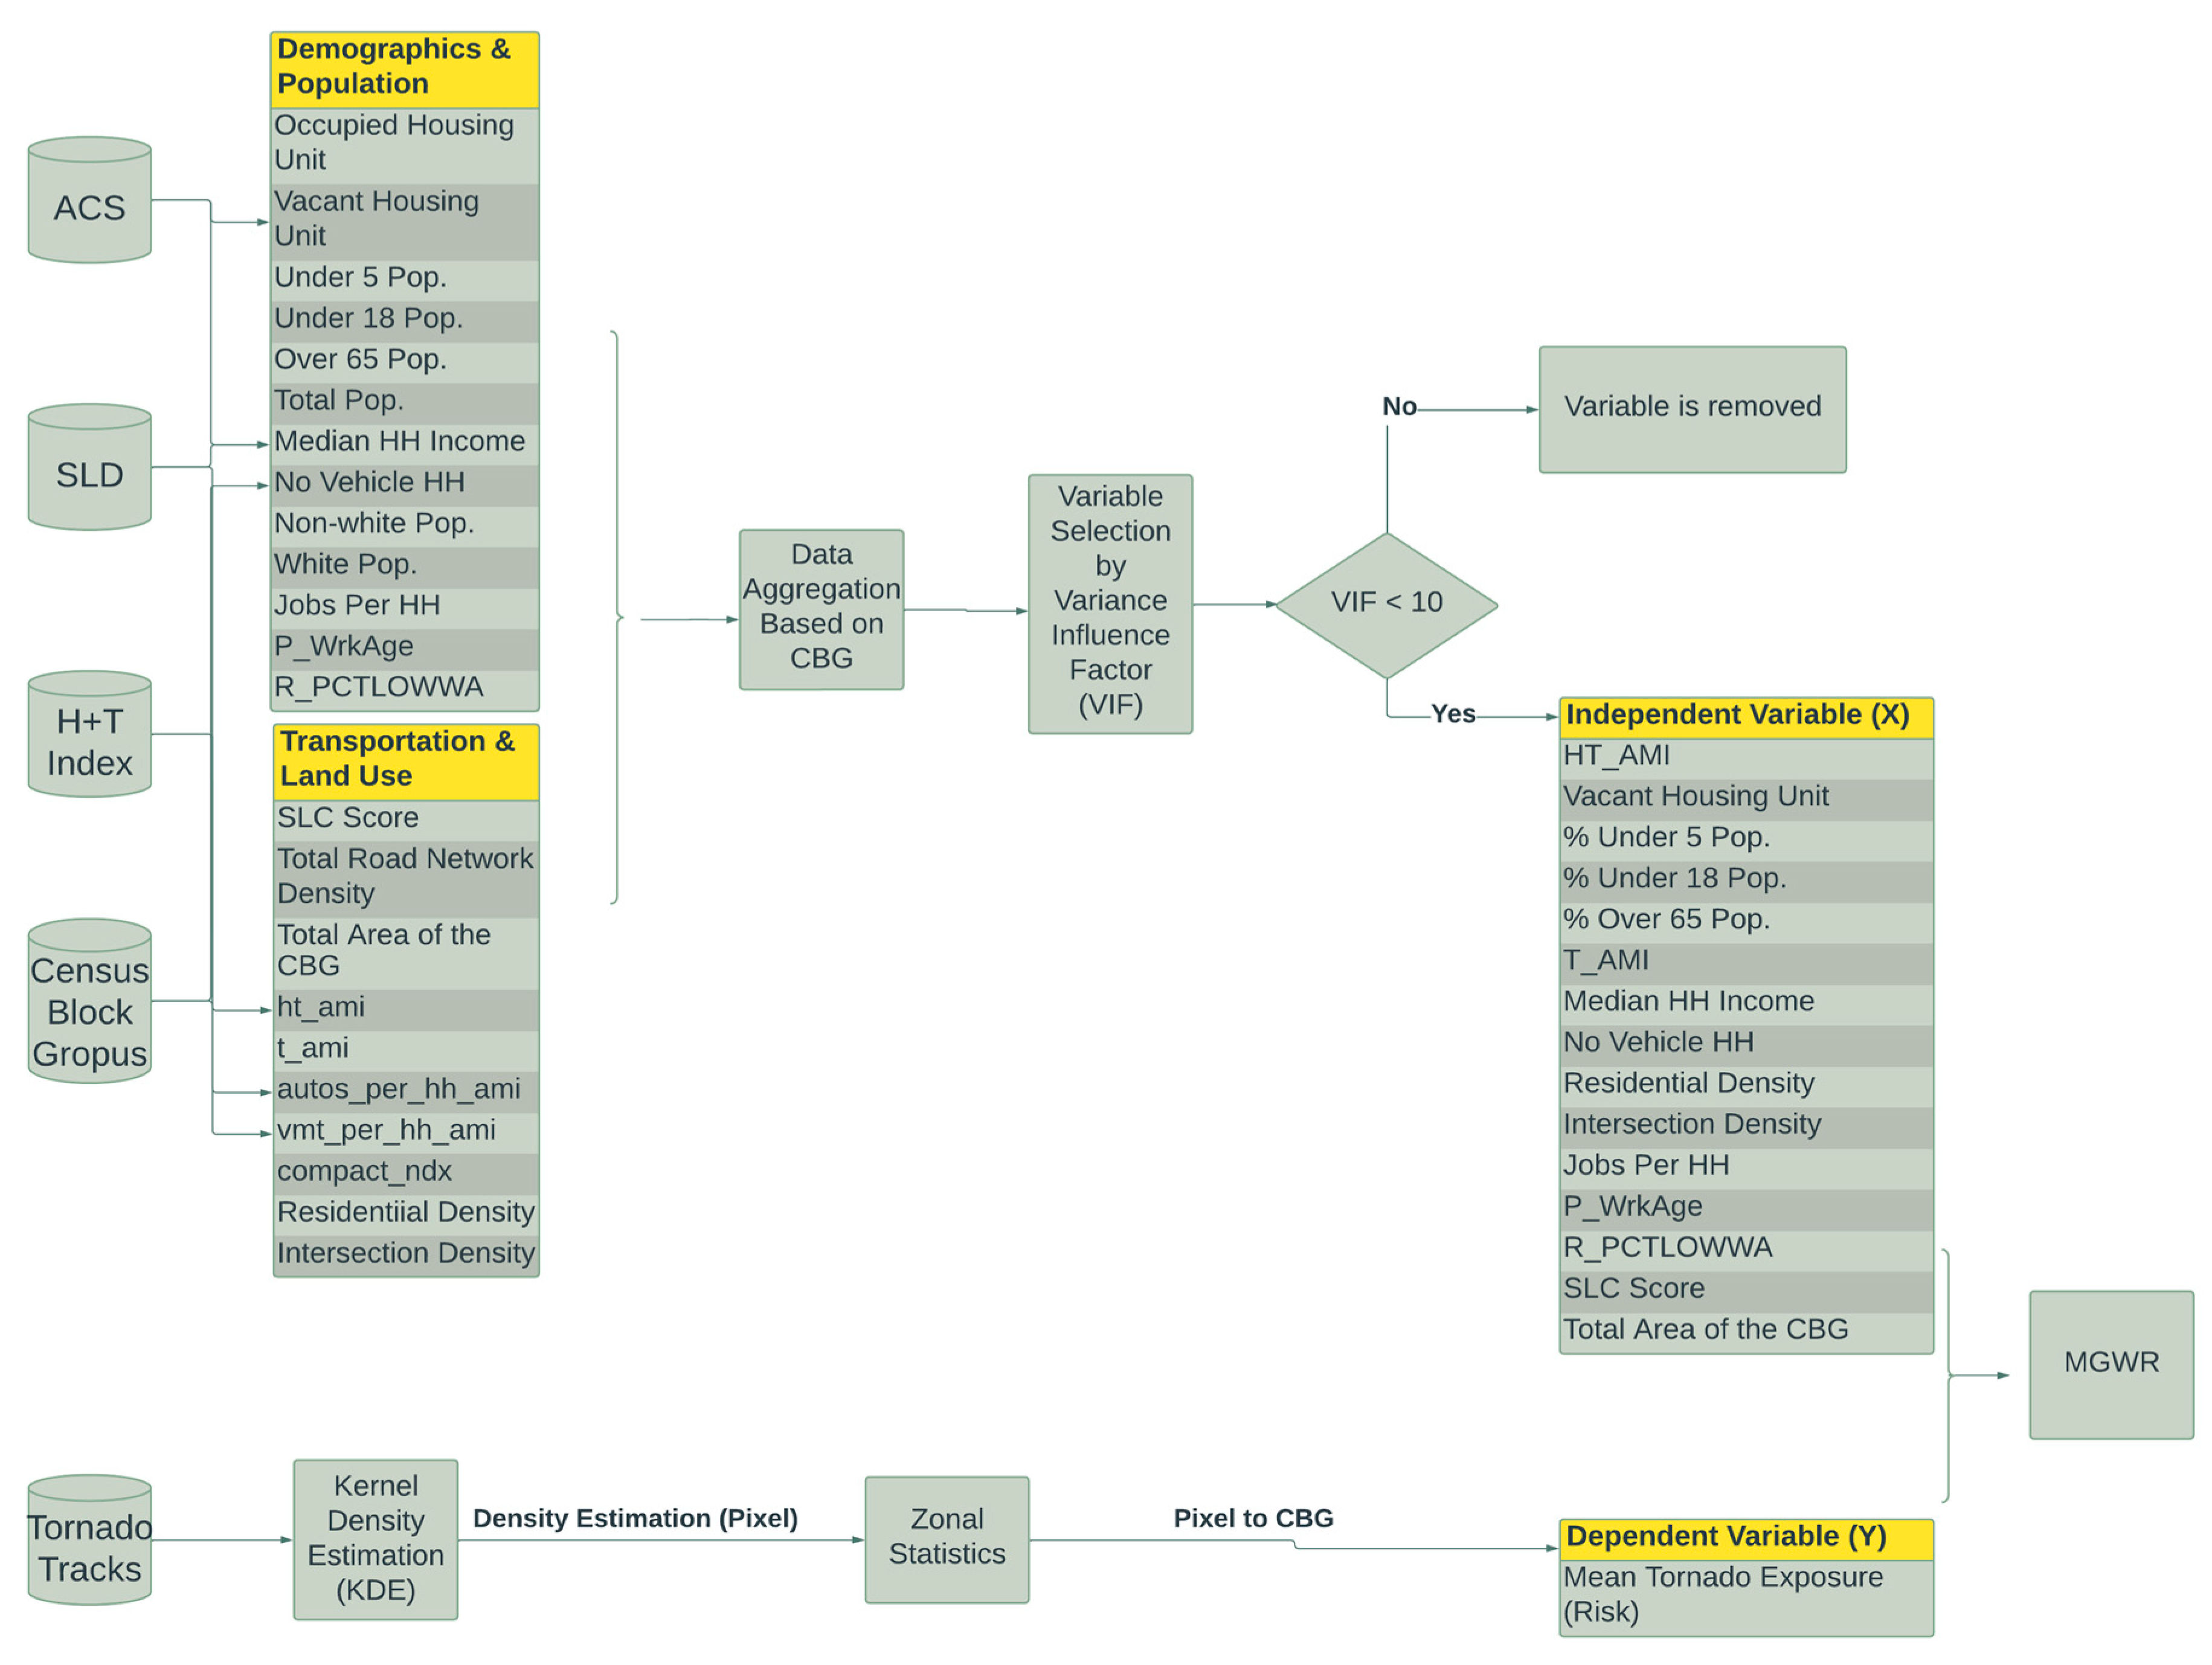
The Storm Prediction Center (SPC) tornado incident dataset between the years 1950 and 2022 was used in this study. The dataset contains line-approximated tornado paths, casualty/fatality figures, and times of tornadoes. In this research, tornadoes that occurred between 1950 and 2022 in Kentucky were selected. In addition, similar to Blinn [16], to prevent the edge effect near boundary regions, tornadoes that occurred within a 25-mile buffer of Kentucky were also added to this study.

3. Methodology

This study investigates the relationships between tornado exposure, and several selected demographics, socioeconomics, and transportation-related indicators. Tornadoes between 1950 and 2022 were utilized to calculate tornado density, which has been used as a surrogate variable for tornado exposure. In addition, to quantify the impact of tornados on the roadway infrastructure, a scoring method was used. The following section describes the steps of the proposed methodology, as shown in Figure 2.

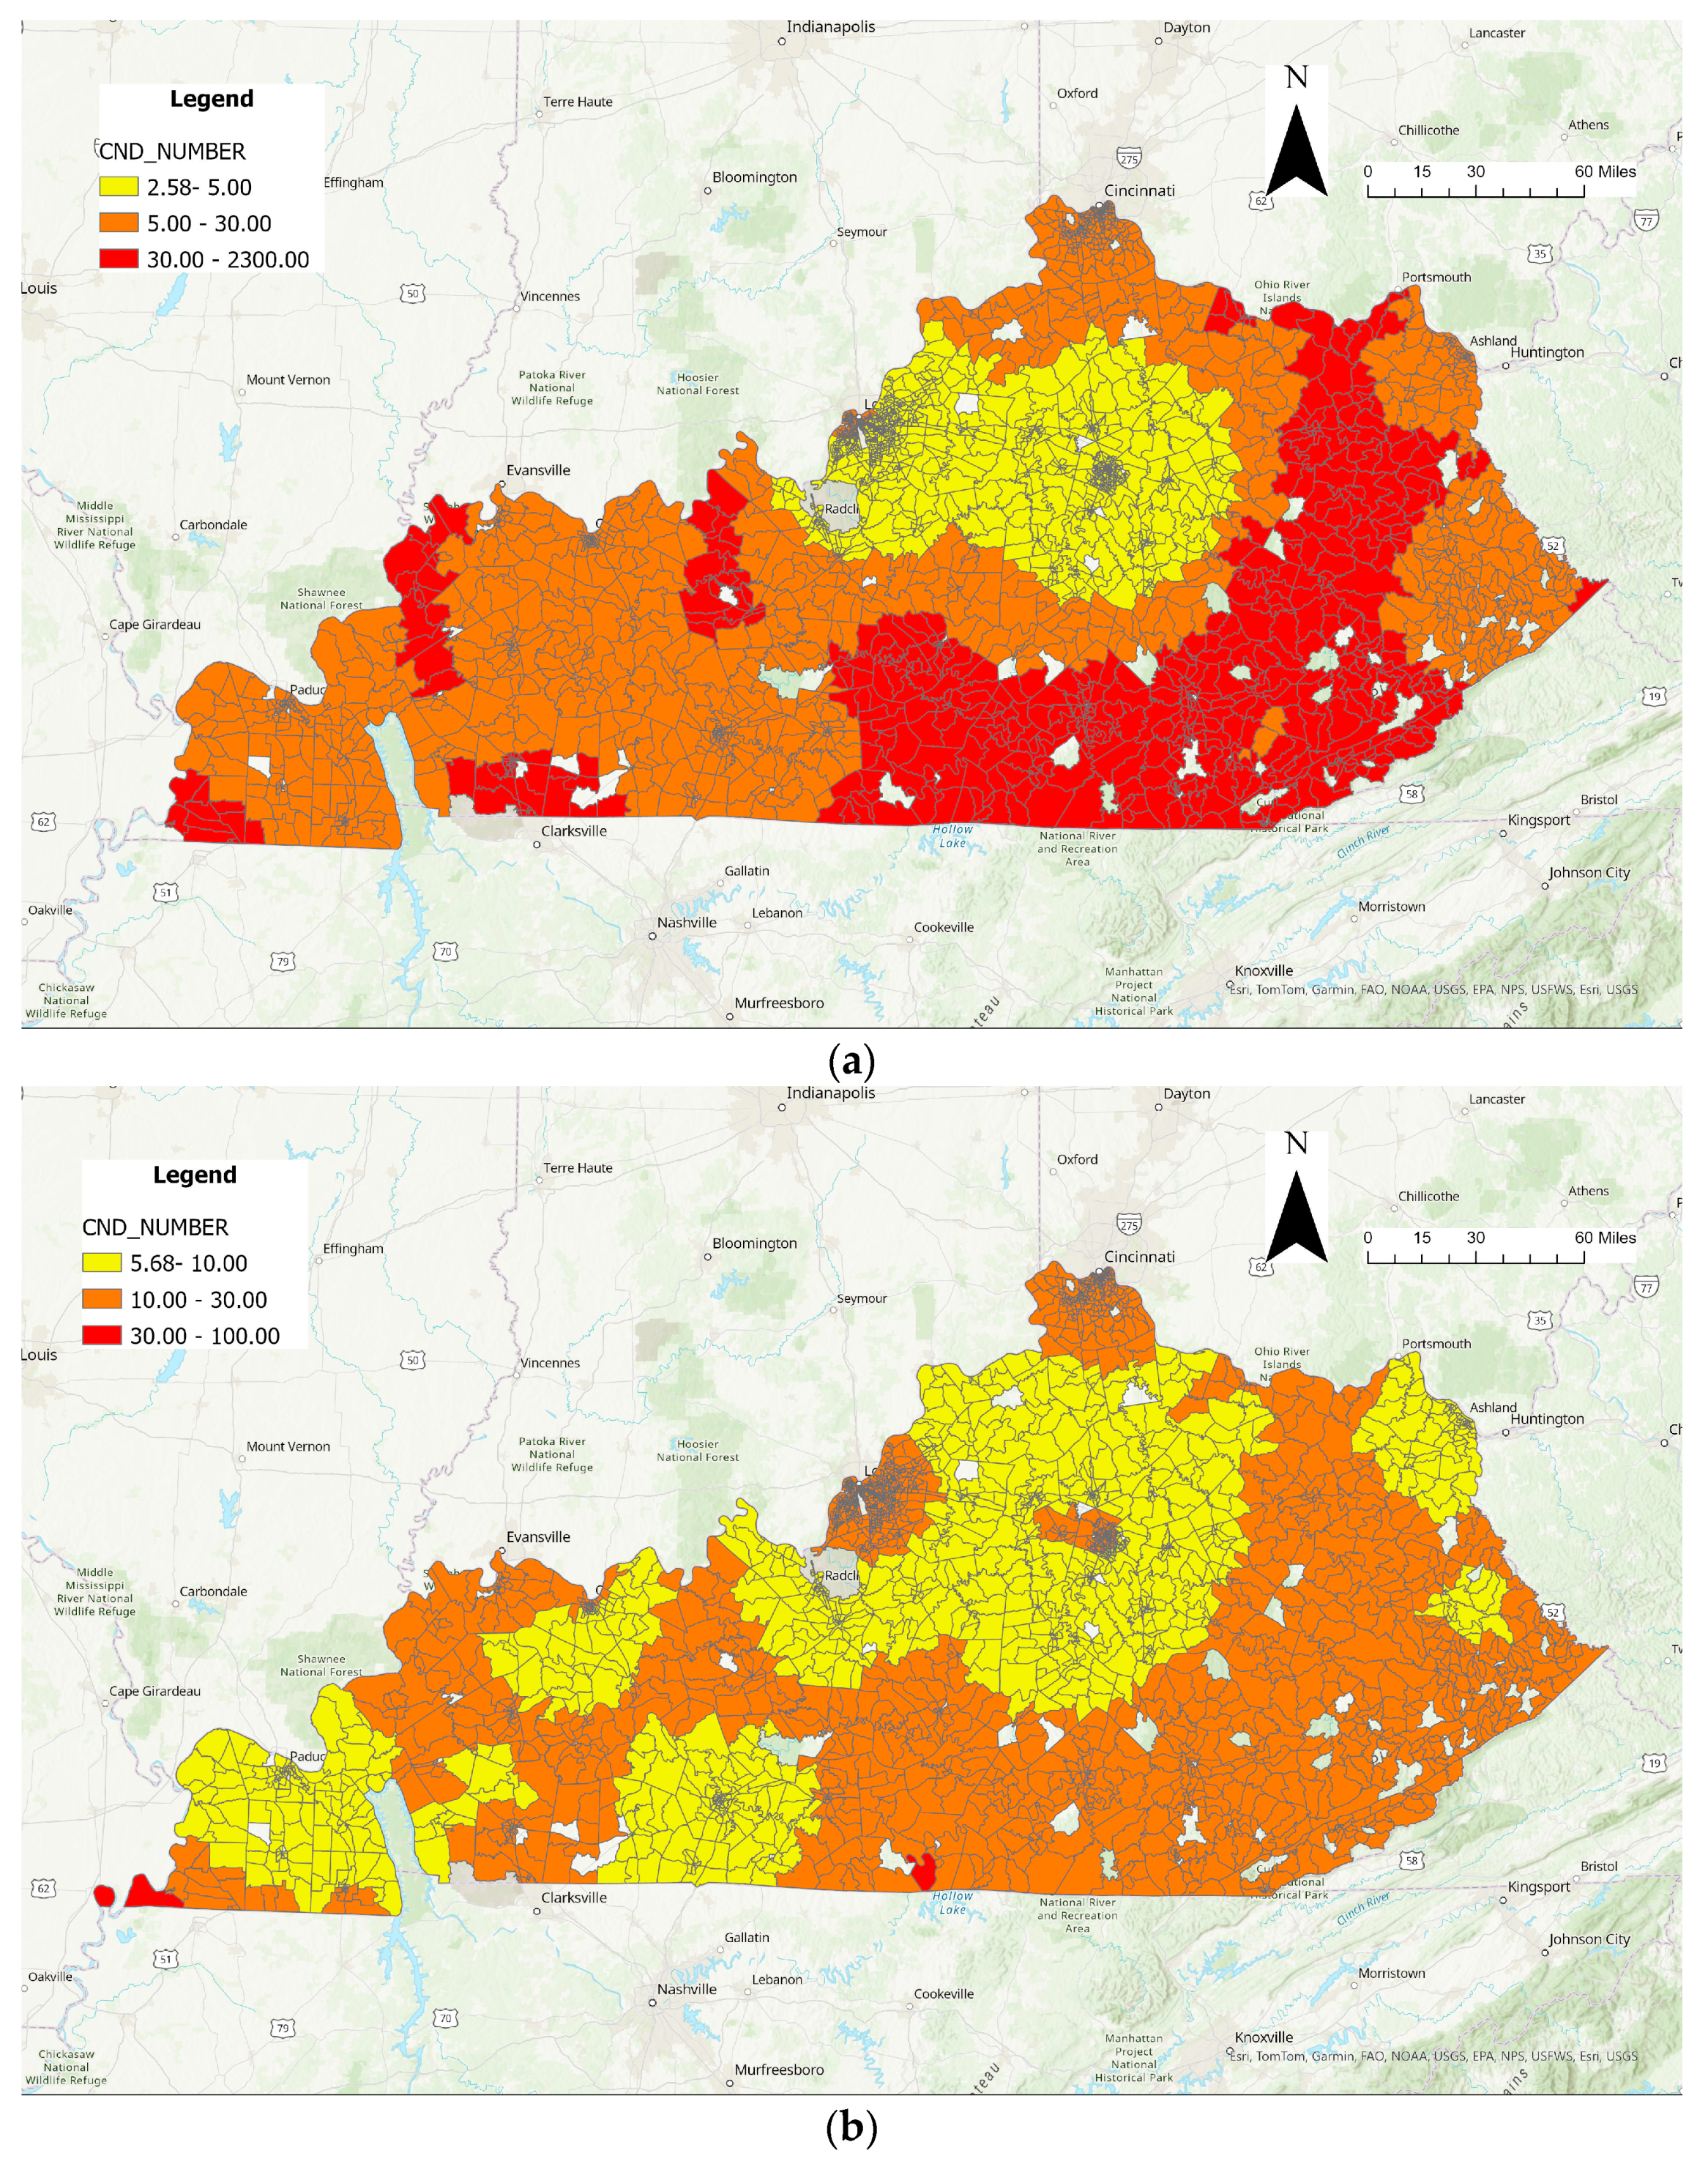
3.1. Density Estimation

To calculate the spatial densities of tornado incidences, kernel density estimation (KDE) was utilized. Kernel density estimation is a technique that calculates the density of features using a distance decaying function, calculated by the following function in Equation (1):
D e n s i t y = 1 h 2 i = 1 n 3 π 1 d i s t i h 2 2   0   o t h e r w i s e   i f   d i s t i < h
In this equation, h denotes bandwidth and d i s t i denotes the distance between the center of a given cell and the tornado event. In terms of concept, a curved surface is applied to each tornado line, which exhibits its maximum value directly on the line and gradually decreases as one moves away, ultimately reaching zero at the designated bandwidth distance from the line.
KDE has been widely employed to analyze tornado exposure and likelihood in previous works [16,38,39,40]. The analysis can be applied to our case of tornadoes since it implies that geographic trends have magnitudes at each point in the study area instead of just the places directly affected. Also, the kernel density radius was selected as 25 miles, similar to other studies focusing on disasters [16,38]. After mapping the tornado densities of the study area, the zonal statistics tool in ArcGIS was employed to quantify tornado occurrences of each U.S. census block group (CBG). This quantification was performed by taking the averages of the output cell size values in the boundary of the given census block group. This procedure was carried out for each CBG in the study area.
In addition to calculating tornado densities for each CBG, the impact of tornadoes on roadways was quantified. When determining this roadway impact, the second and third methods from Dixon et al. [13] were adapted to detect vulnerable CBGs in terms of the roadway impact of tornadoes. It should be noted that Dixon et al. used these methods to evaluate the vulnerability of the population, and their unit of analysis was country. We, on the other hand, aimed to detect the vulnerability of the roadway infrastructure for every CBG. What we conducted can be regarded as adapting the previous scoring methods into a roadway vulnerability assessment at a smaller spatial level, which is an improvement over Dixon et al.’s work [13].
To assess vulnerable CBGs in terms of roadway impact, a combination of occurrence and exposure values was utilized. Tornado density values, representing occurrences, were calculated for each CBG. Both occurrence and exposure values for each CBG were normalized. To measure exposure, network densities of CBGs were employed as surrogates, reflecting the vulnerability of roadways where a higher network density implies a higher likelihood of significant roadway disruption during tornado events. Two scoring methods were used. In the first scoring method, cumulative scores of occurrences and exposures were mapped to detect vulnerable regions. As both the exposure and tornado occurrence score ranges between 0 and 1, the maximum score of the roadway impact cannot be more than 2. As this method is based on the addition of occurrence and exposure values, highlighted counties may still have low overall scores compared with one variable score. For example, a county with a low exposure score may still be highlighted if it has a high occurrence score. To be able to highlight those counties that have both high exposure and occurrence values, the second method was applied. In this method, the final score was found by multiplying exposure and occurrence scores.

3.2. Variable Selection

As discussed earlier, different data sources were used to obtain sociodemographic and traffic-related variables for the region at the CBG level. After the creation of the datasets, variables should be evaluated in terms of their correlation since multicollinearity.
When fitting and analyzing a GWR model, it is crucial to check these multicollinearity effects in global models [41]. Therefore, as a first step to deal with multicollinearity, variable selection was performed by using the ordinary least squares tool in ArcGIS. All the pre-selected variables were used in the OLS model. As conducted by Chun et al., coefficients with a variance inflation factor (VIF) value lower than 10 were considered as they did not have significant multicollinearity problems [22]. Therefore, after running the model, the variables that had VIF values greater than or equal to 10 were eliminated in the developed regression models. Upon removing those variables, the OLS tool was used again to check the new model in terms of multicollinearity. Obtained VIF values in that procedure can be seen in Table 2. As a result of this selection, 15 variables were selected, where 13 of them had VIF values less than 3.5, and the maximum value was 6.71.

3.3. Multiscale Geographically Weighted Regression (MGWR)

Geographically weighted regression (GWR) is a spatial regression technique proposed by Brunsdon et al. [42] to deal with spatial heterogeneities where a single ‘global’ model cannot explain the relationship between the set of variables. GWR achieves this goal by calibrating a multiple regression model that enables different spatial points to have different relationships. These various models are created by choosing sample points near each observation point and regressing them. A weight matrix W, which is determined based on the distance between elements, is used in the selection processes. Since tornado occurrences and their impacts rely heavily on location-specific parameters, GWR is utilized in this study. The following Equations (2) and (3) are a description of the developed regression model:
y i = β 0 i + β 1 i x 1 i + β 2 i x 2 i + + β n i x n i + ε i
β   ^ i = X T W i X 1 X T W i Y
where i signifies the location of the points in space (a CBG in our case) and W(i) is a matrix of weights assigned to location i. Y is a vector of observations on the dependent variable, while X is a matrix of independent variables. Finally, β is the vector of global parameters to be predicted.
Weighting matrix W is an n-by-n diagonal matrix in which each observation is weighted based on the distance between two locations. This weighting between any two locations, namely diagonal elements ( w i j ) , is calculated using a weighting scheme that includes a kernel function and a bandwidth parameter. In this study, we selected a bi-square weighting function, as given in Equation (4) below:
w i j = 1 d i j 2 d 2 2 i f   d i j < d 0   o t h e r w i s e  
In this equation, bandwidth is d, while d i j is the distance between location i and j. In this weighting scheme, points that are more distant than the bandwidth are given zero weight. When the distance between observations is smaller than the bandwidth, this kernel gives more weight as the points become closer to each other. It should be noted that bandwidth plays an important role in GWR coefficients; this is because, for each observation point, it affects the selection of sample points and their weights on the regression model. Therefore, increasing bandwidth leads to a more global model as the selection pool for sample is larger. On the contrary, a smaller bandwidth results in more abruptly changing coefficients over space since the estimates are based on a model that only uses close observations as sample points [43].
The GWR model is an effective algorithm to explain locally changing relationships over the study region, but it has some limitations. Firstly, the model assumes that each variable has the same spatial variability; however, this assumption does not have to be true. Thus, when GWR is applied to variables with multiple distinct spatial scales, one or more scales may be wrongly specified, leading to biased parameter estimations [44]. Secondly, GWR has a multicollinearity problem. As suggested by Wheeler et al., even though the variables used to generate the data are uncorrelated, local regression coefficients may be collinear [41]. Because of these limitations, multiscale geographically weighted regression (MGWR) modeling was employed to assess the spatial variation of tornado incidences. Multiscale geographically weighted regression is a specialized form of GWR modeling. The main difference is that MGWR enables each explanatory variable to have a distinct bandwidth so that independent variables can function at various spatial scales [45]. First, data were standardized to compare the estimated bandwidth for each variable [24]. The golden search was selected to determine optimal bandwidth size and a distance-based neighborhood was chosen as the neighborhood selection method. This indicated that the bandwidth size would be determined by distance rather than the number of neighborhoods. To detect optimal bandwidth size and measure model fitness, corrected Akaike information criterion (AICc) was used in the modeling [46].

4. Results and Discussions

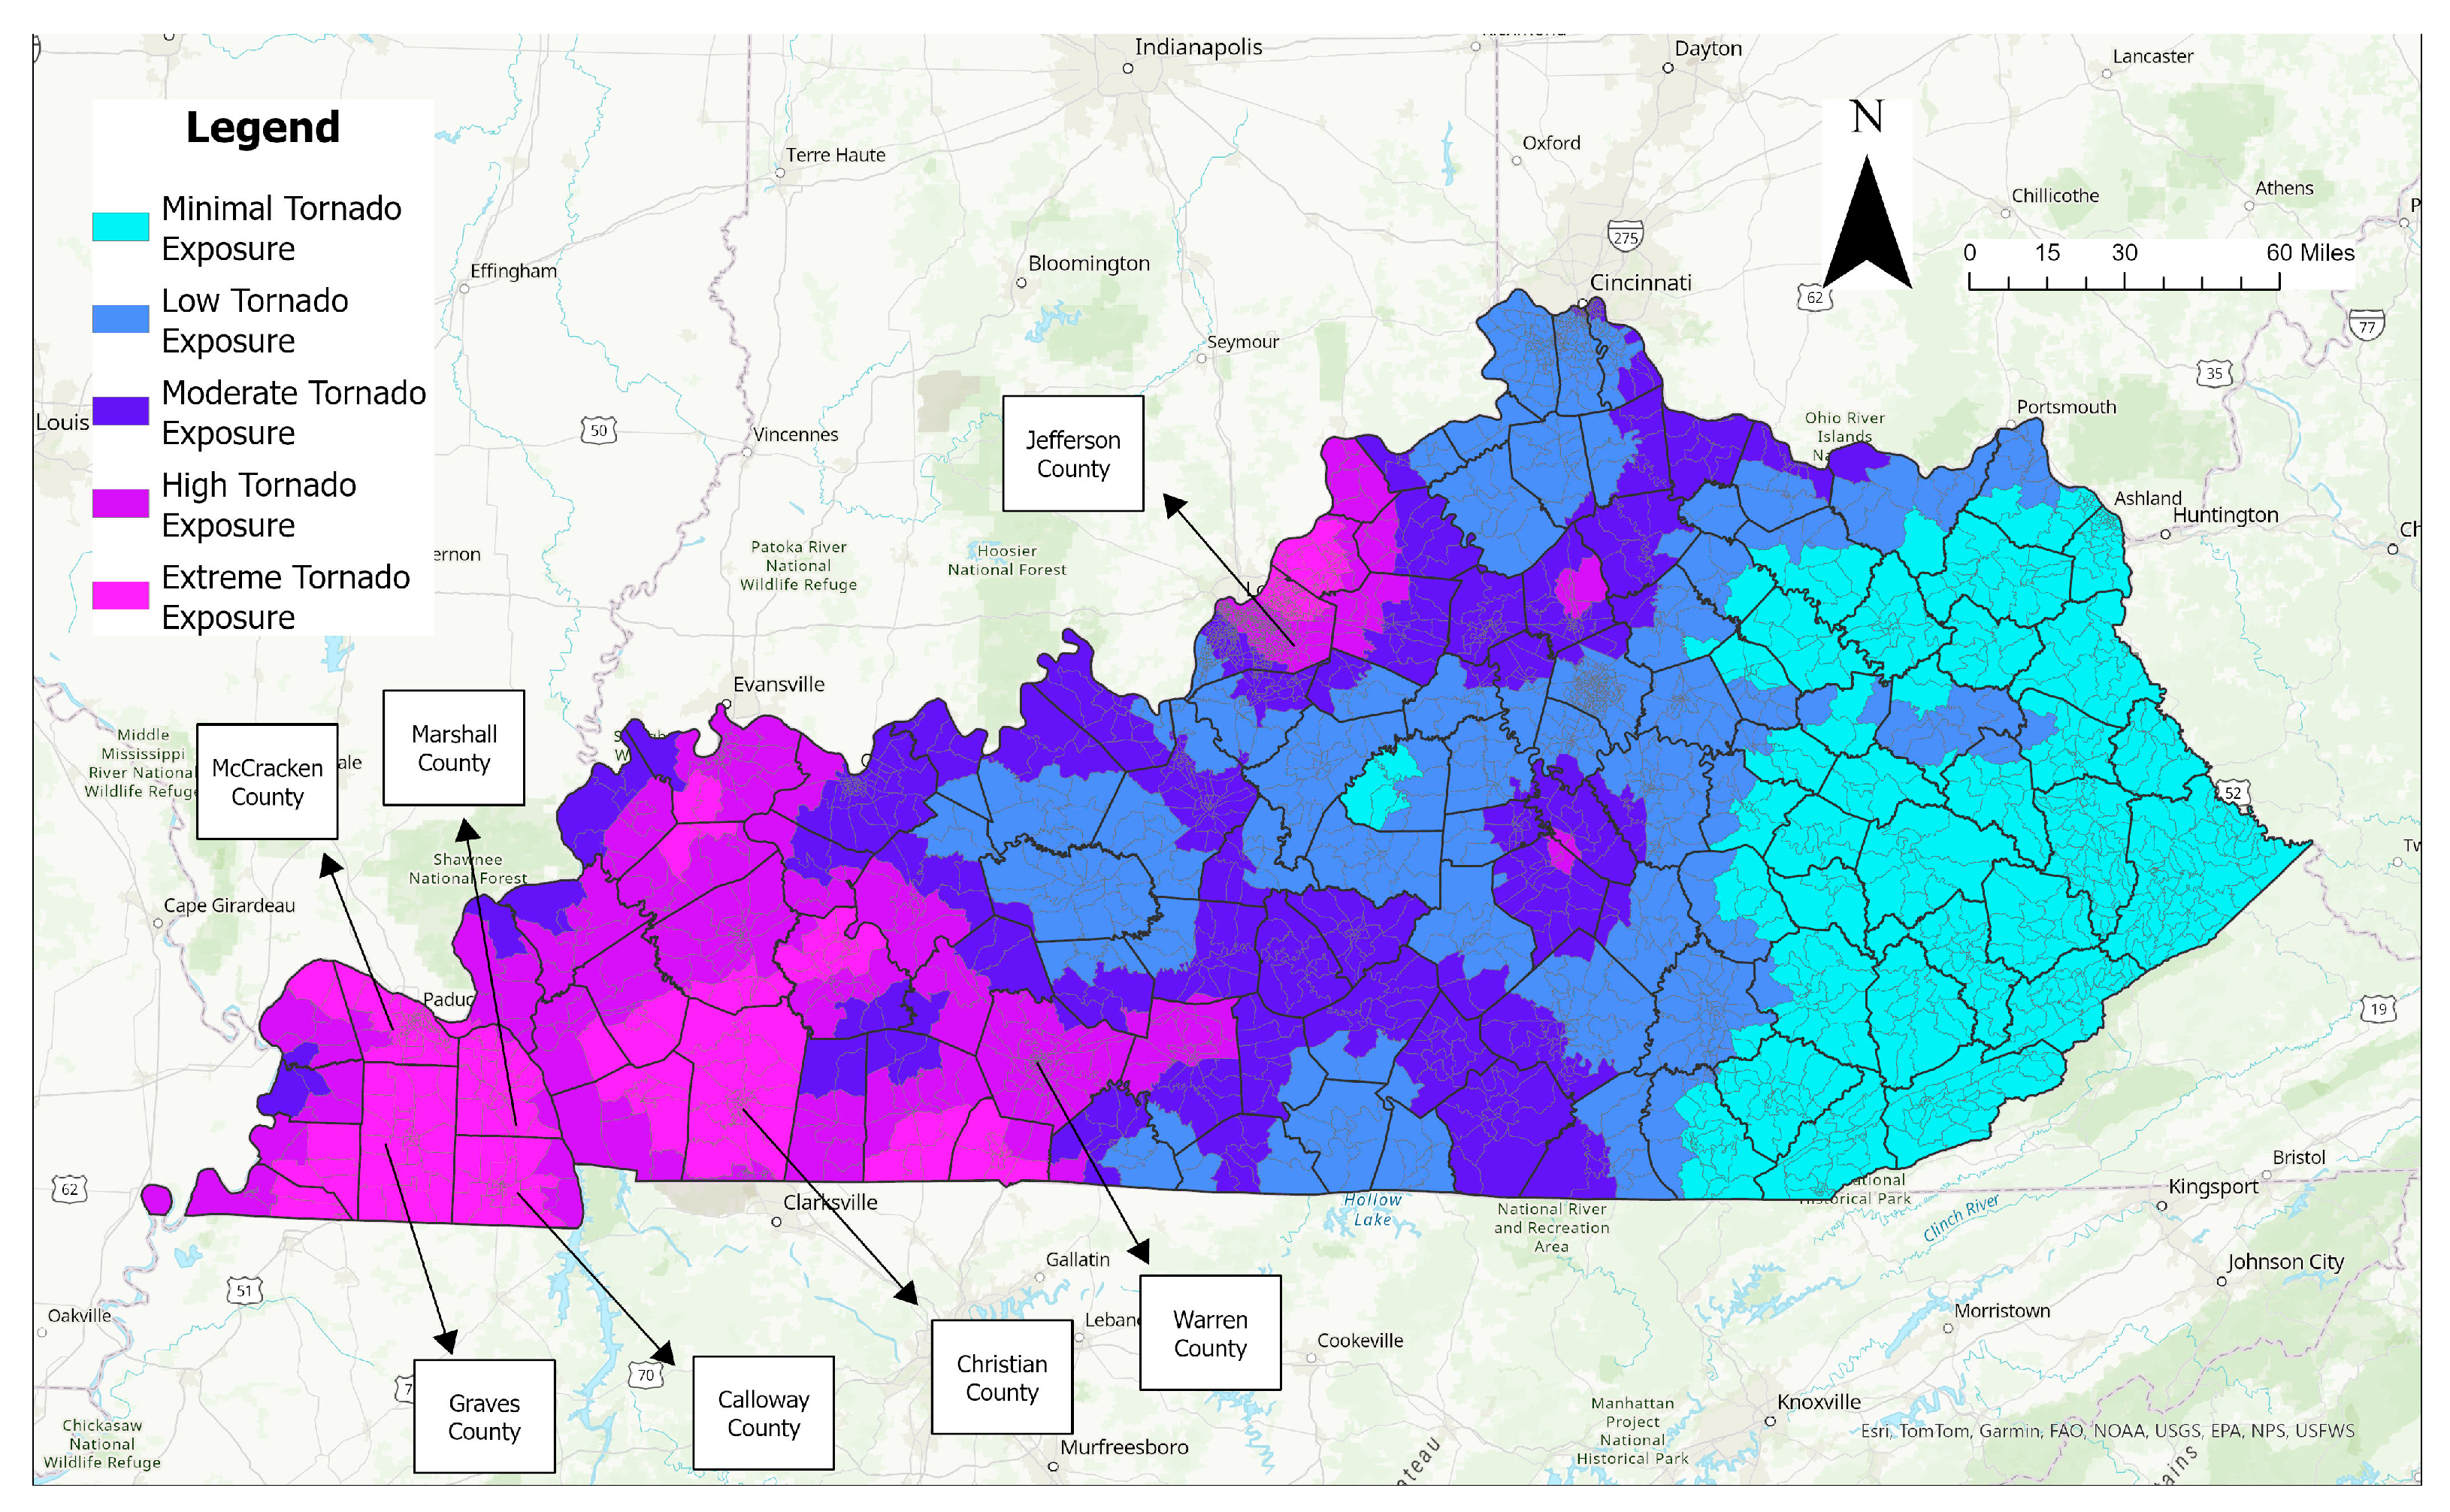
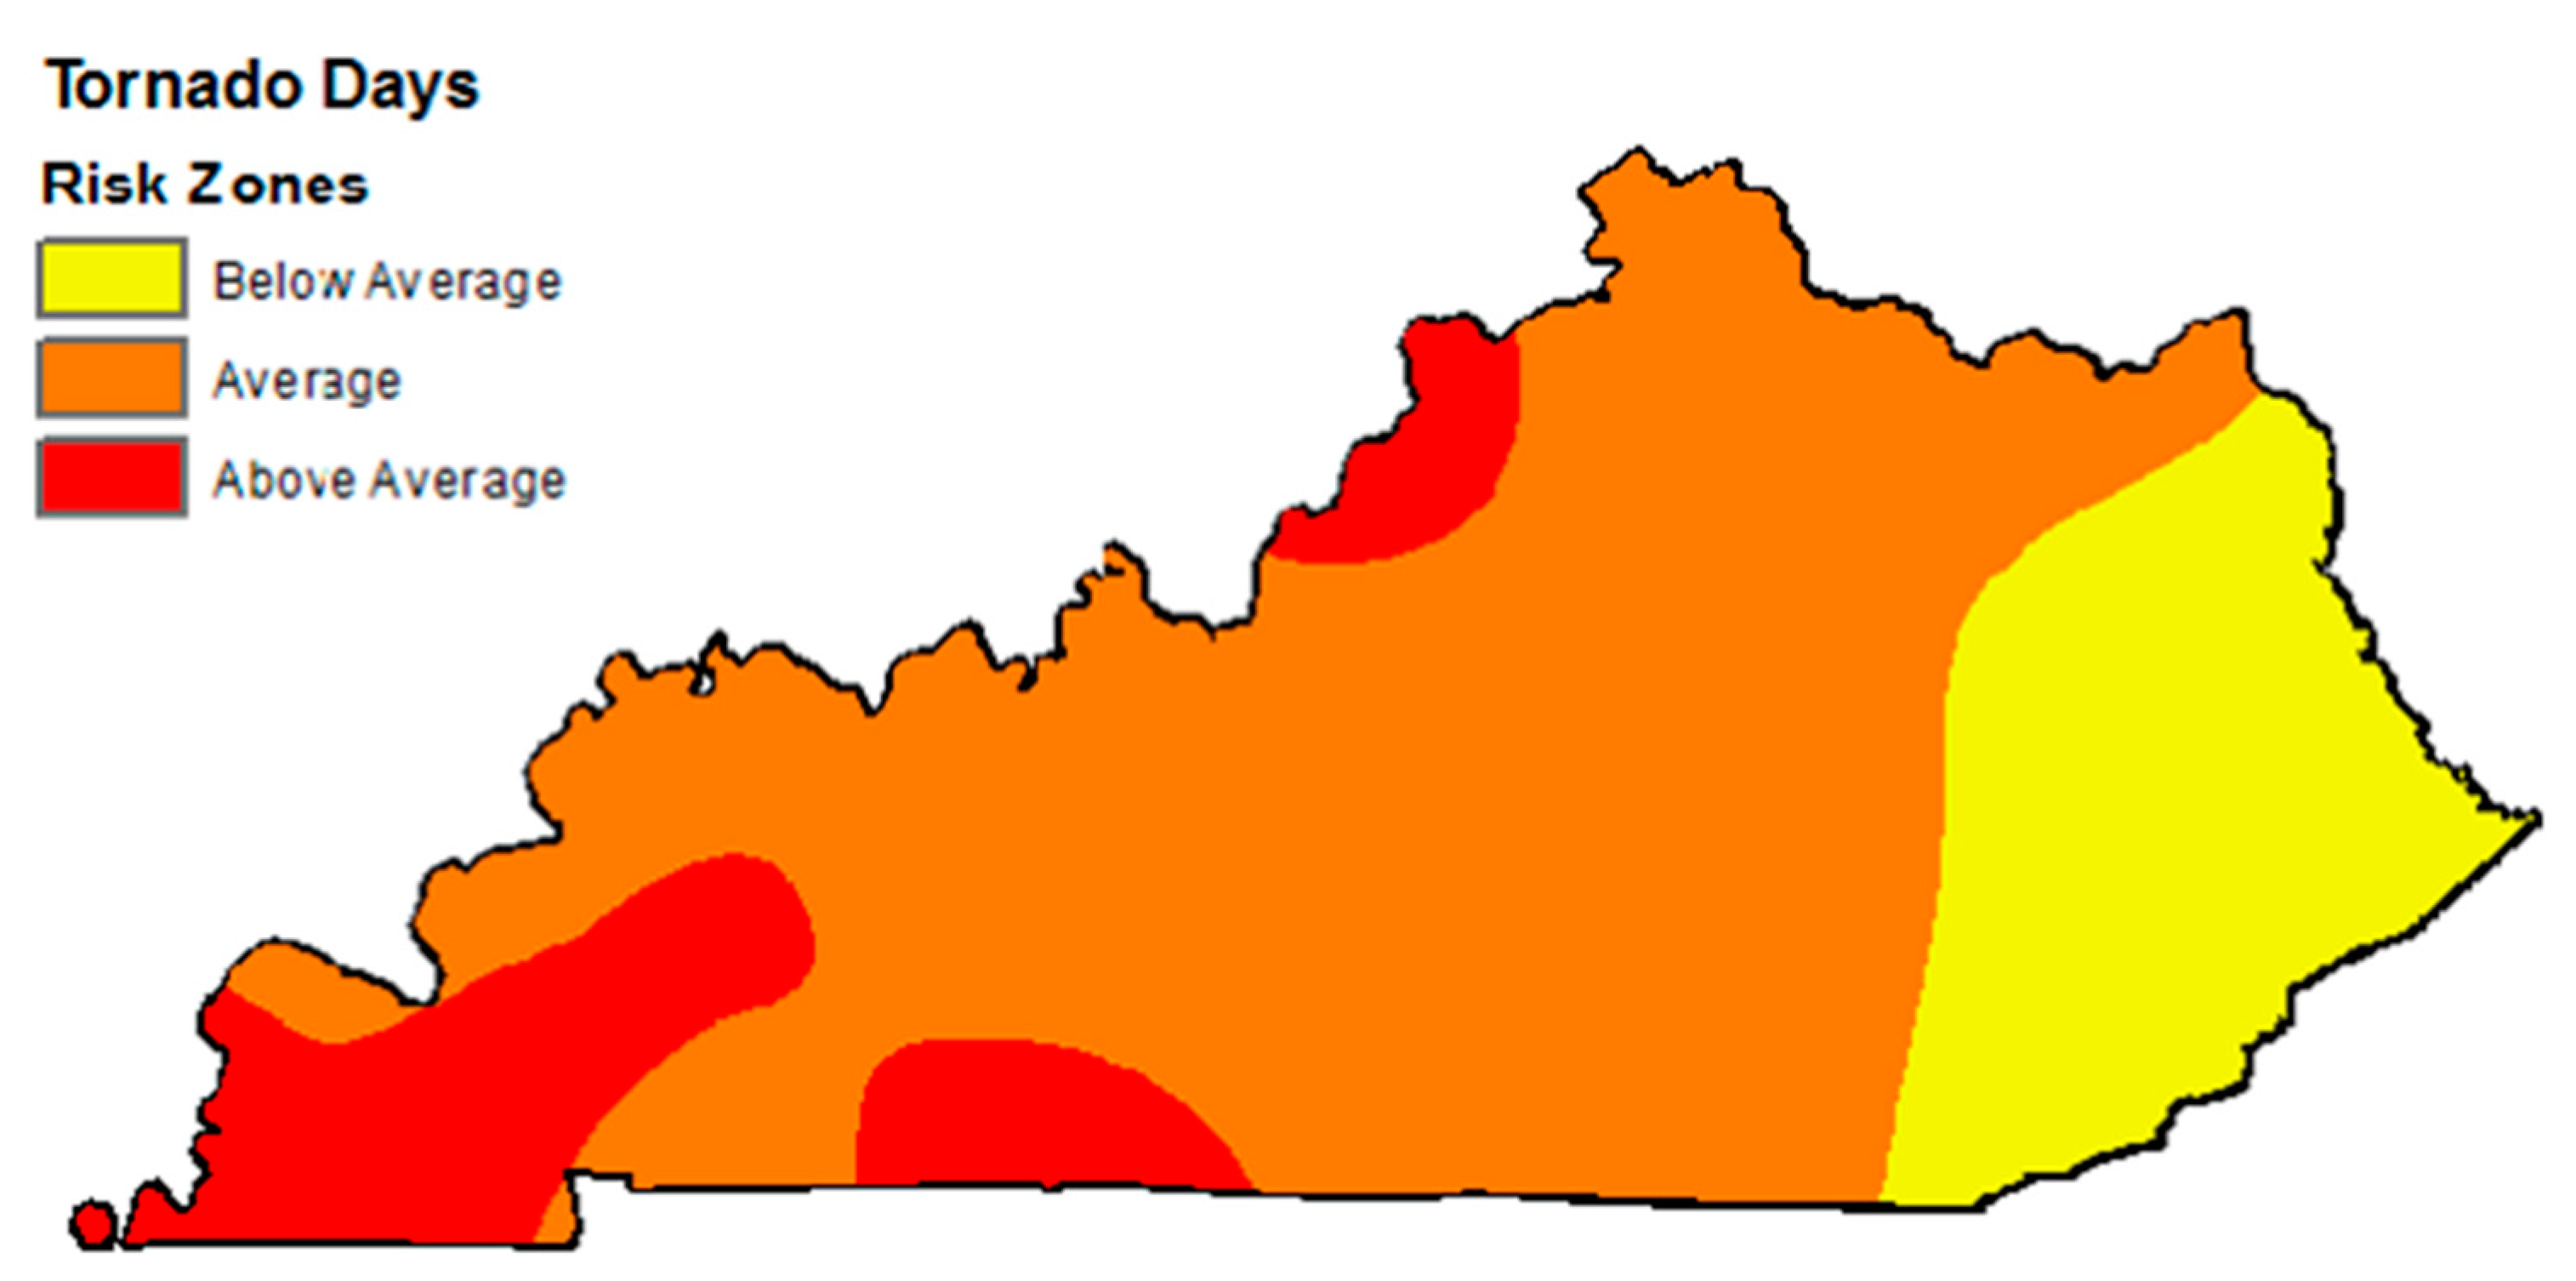
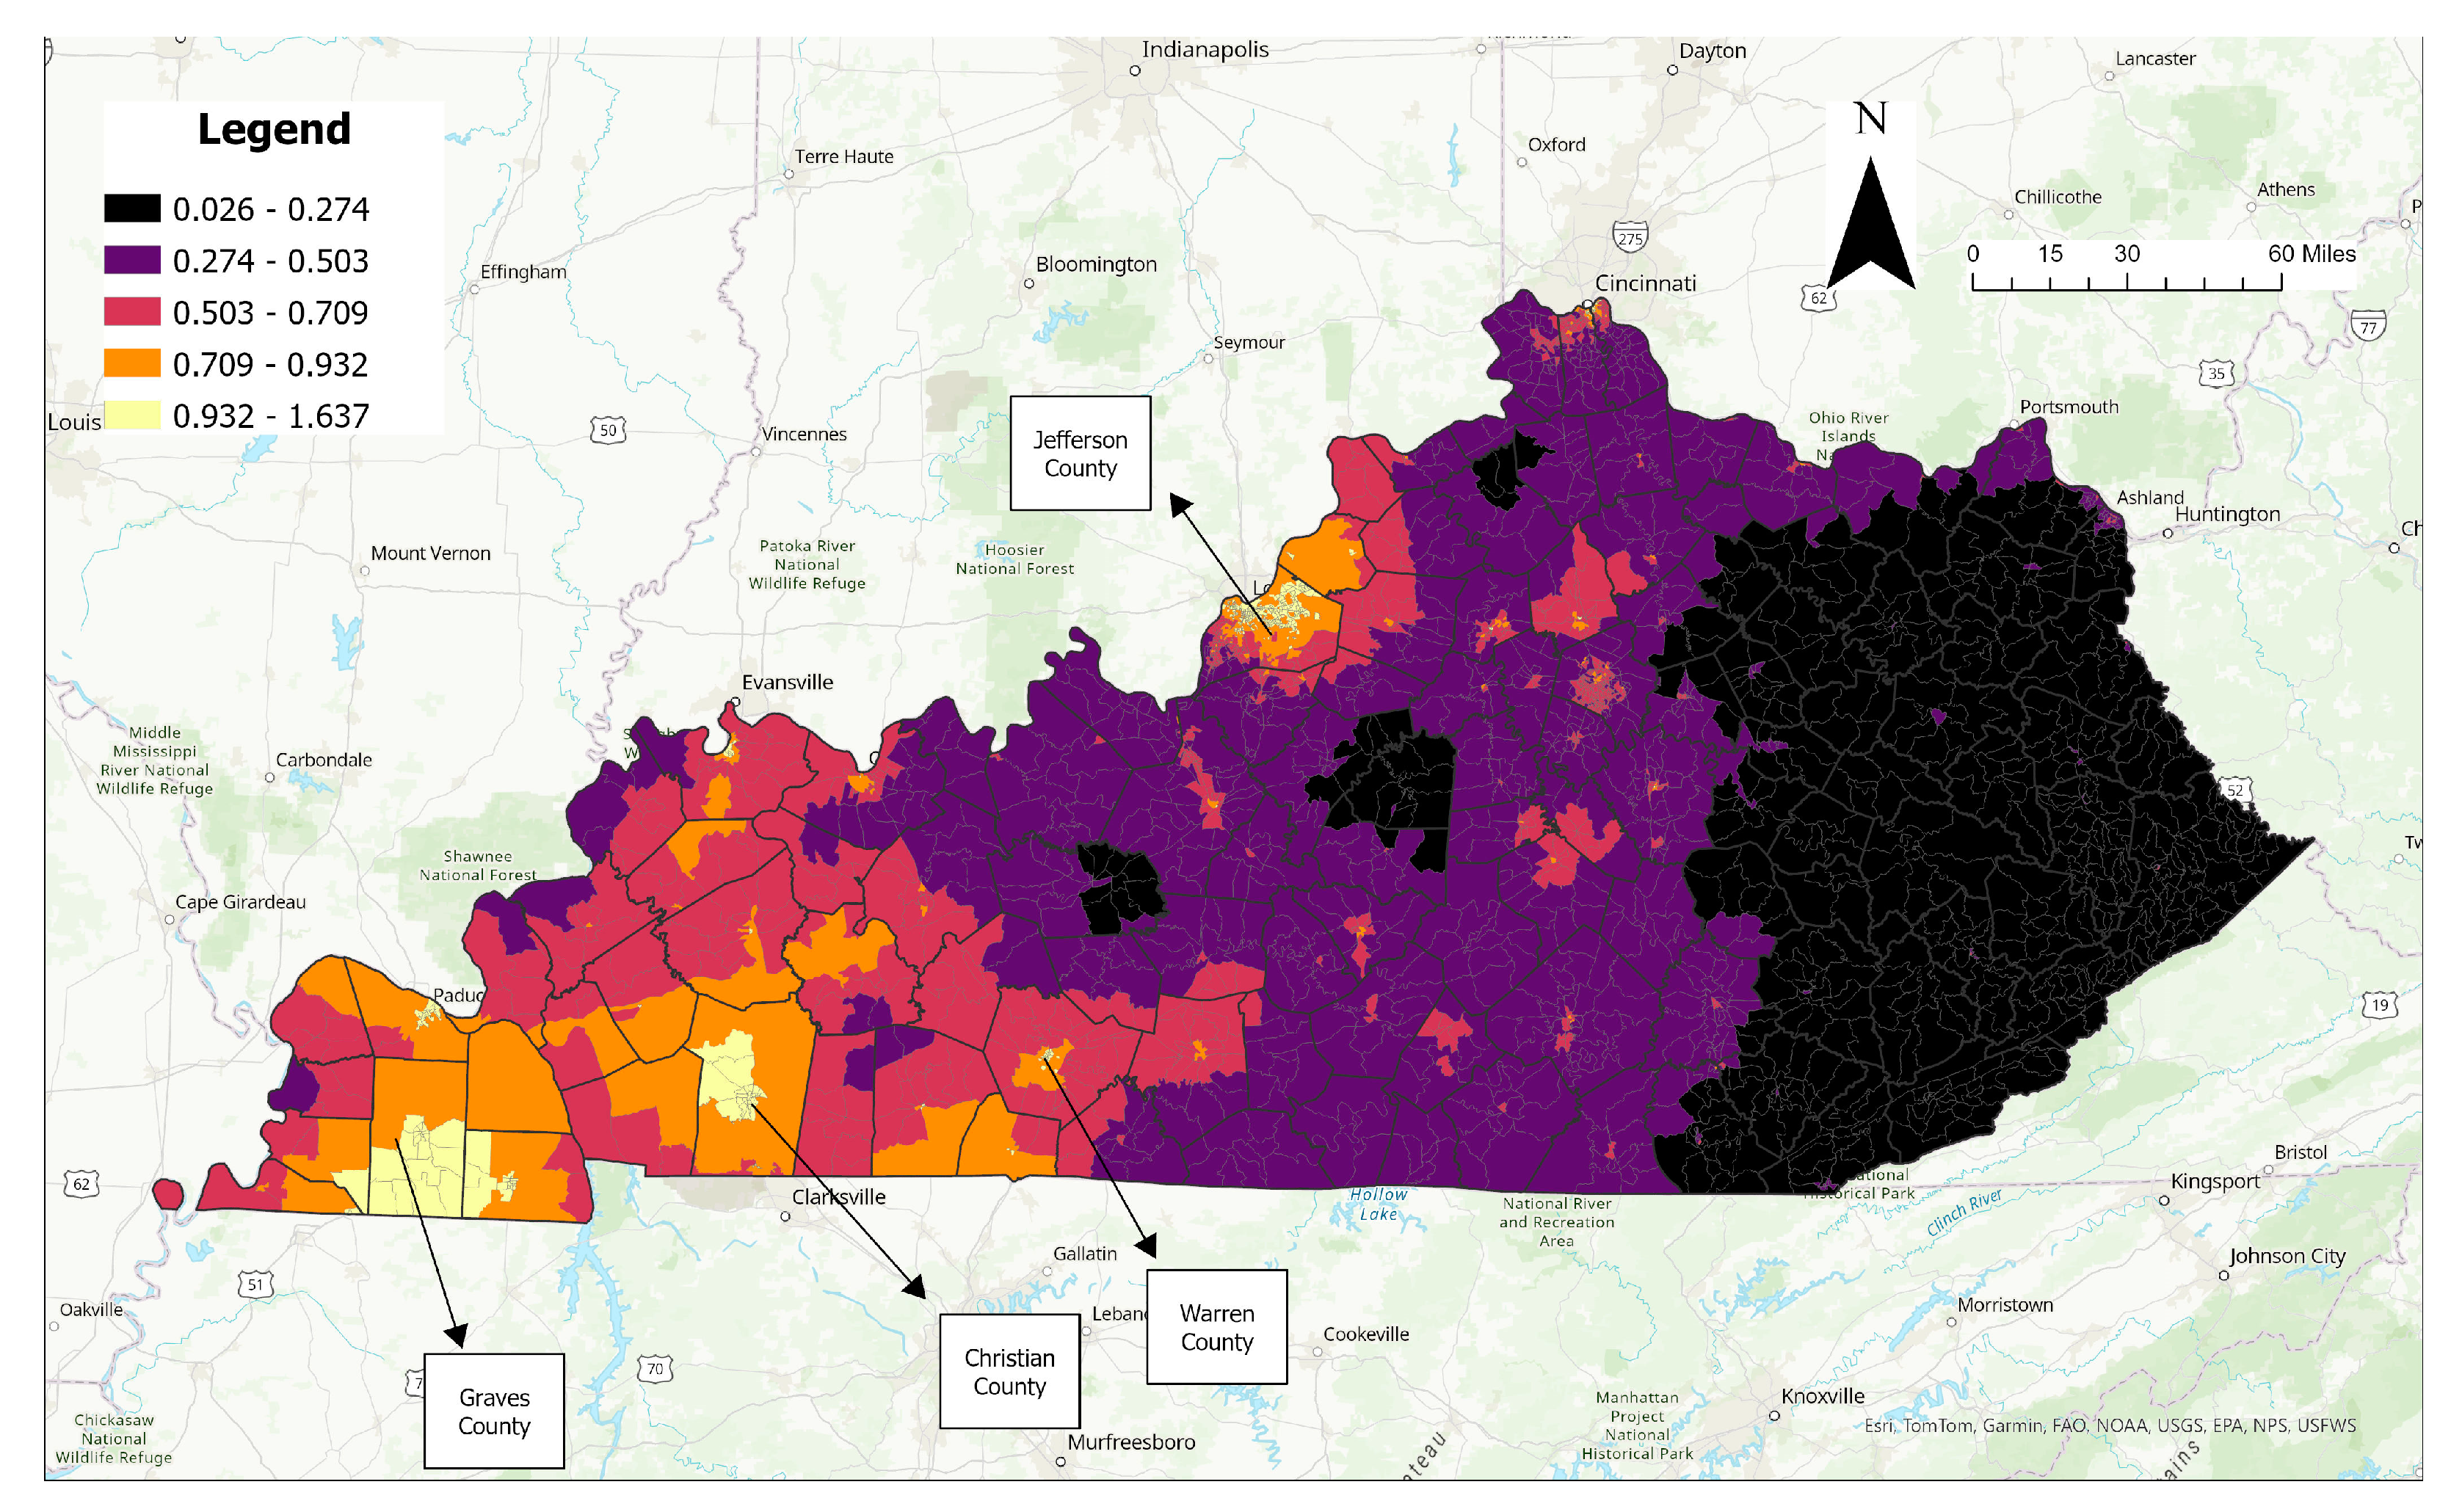
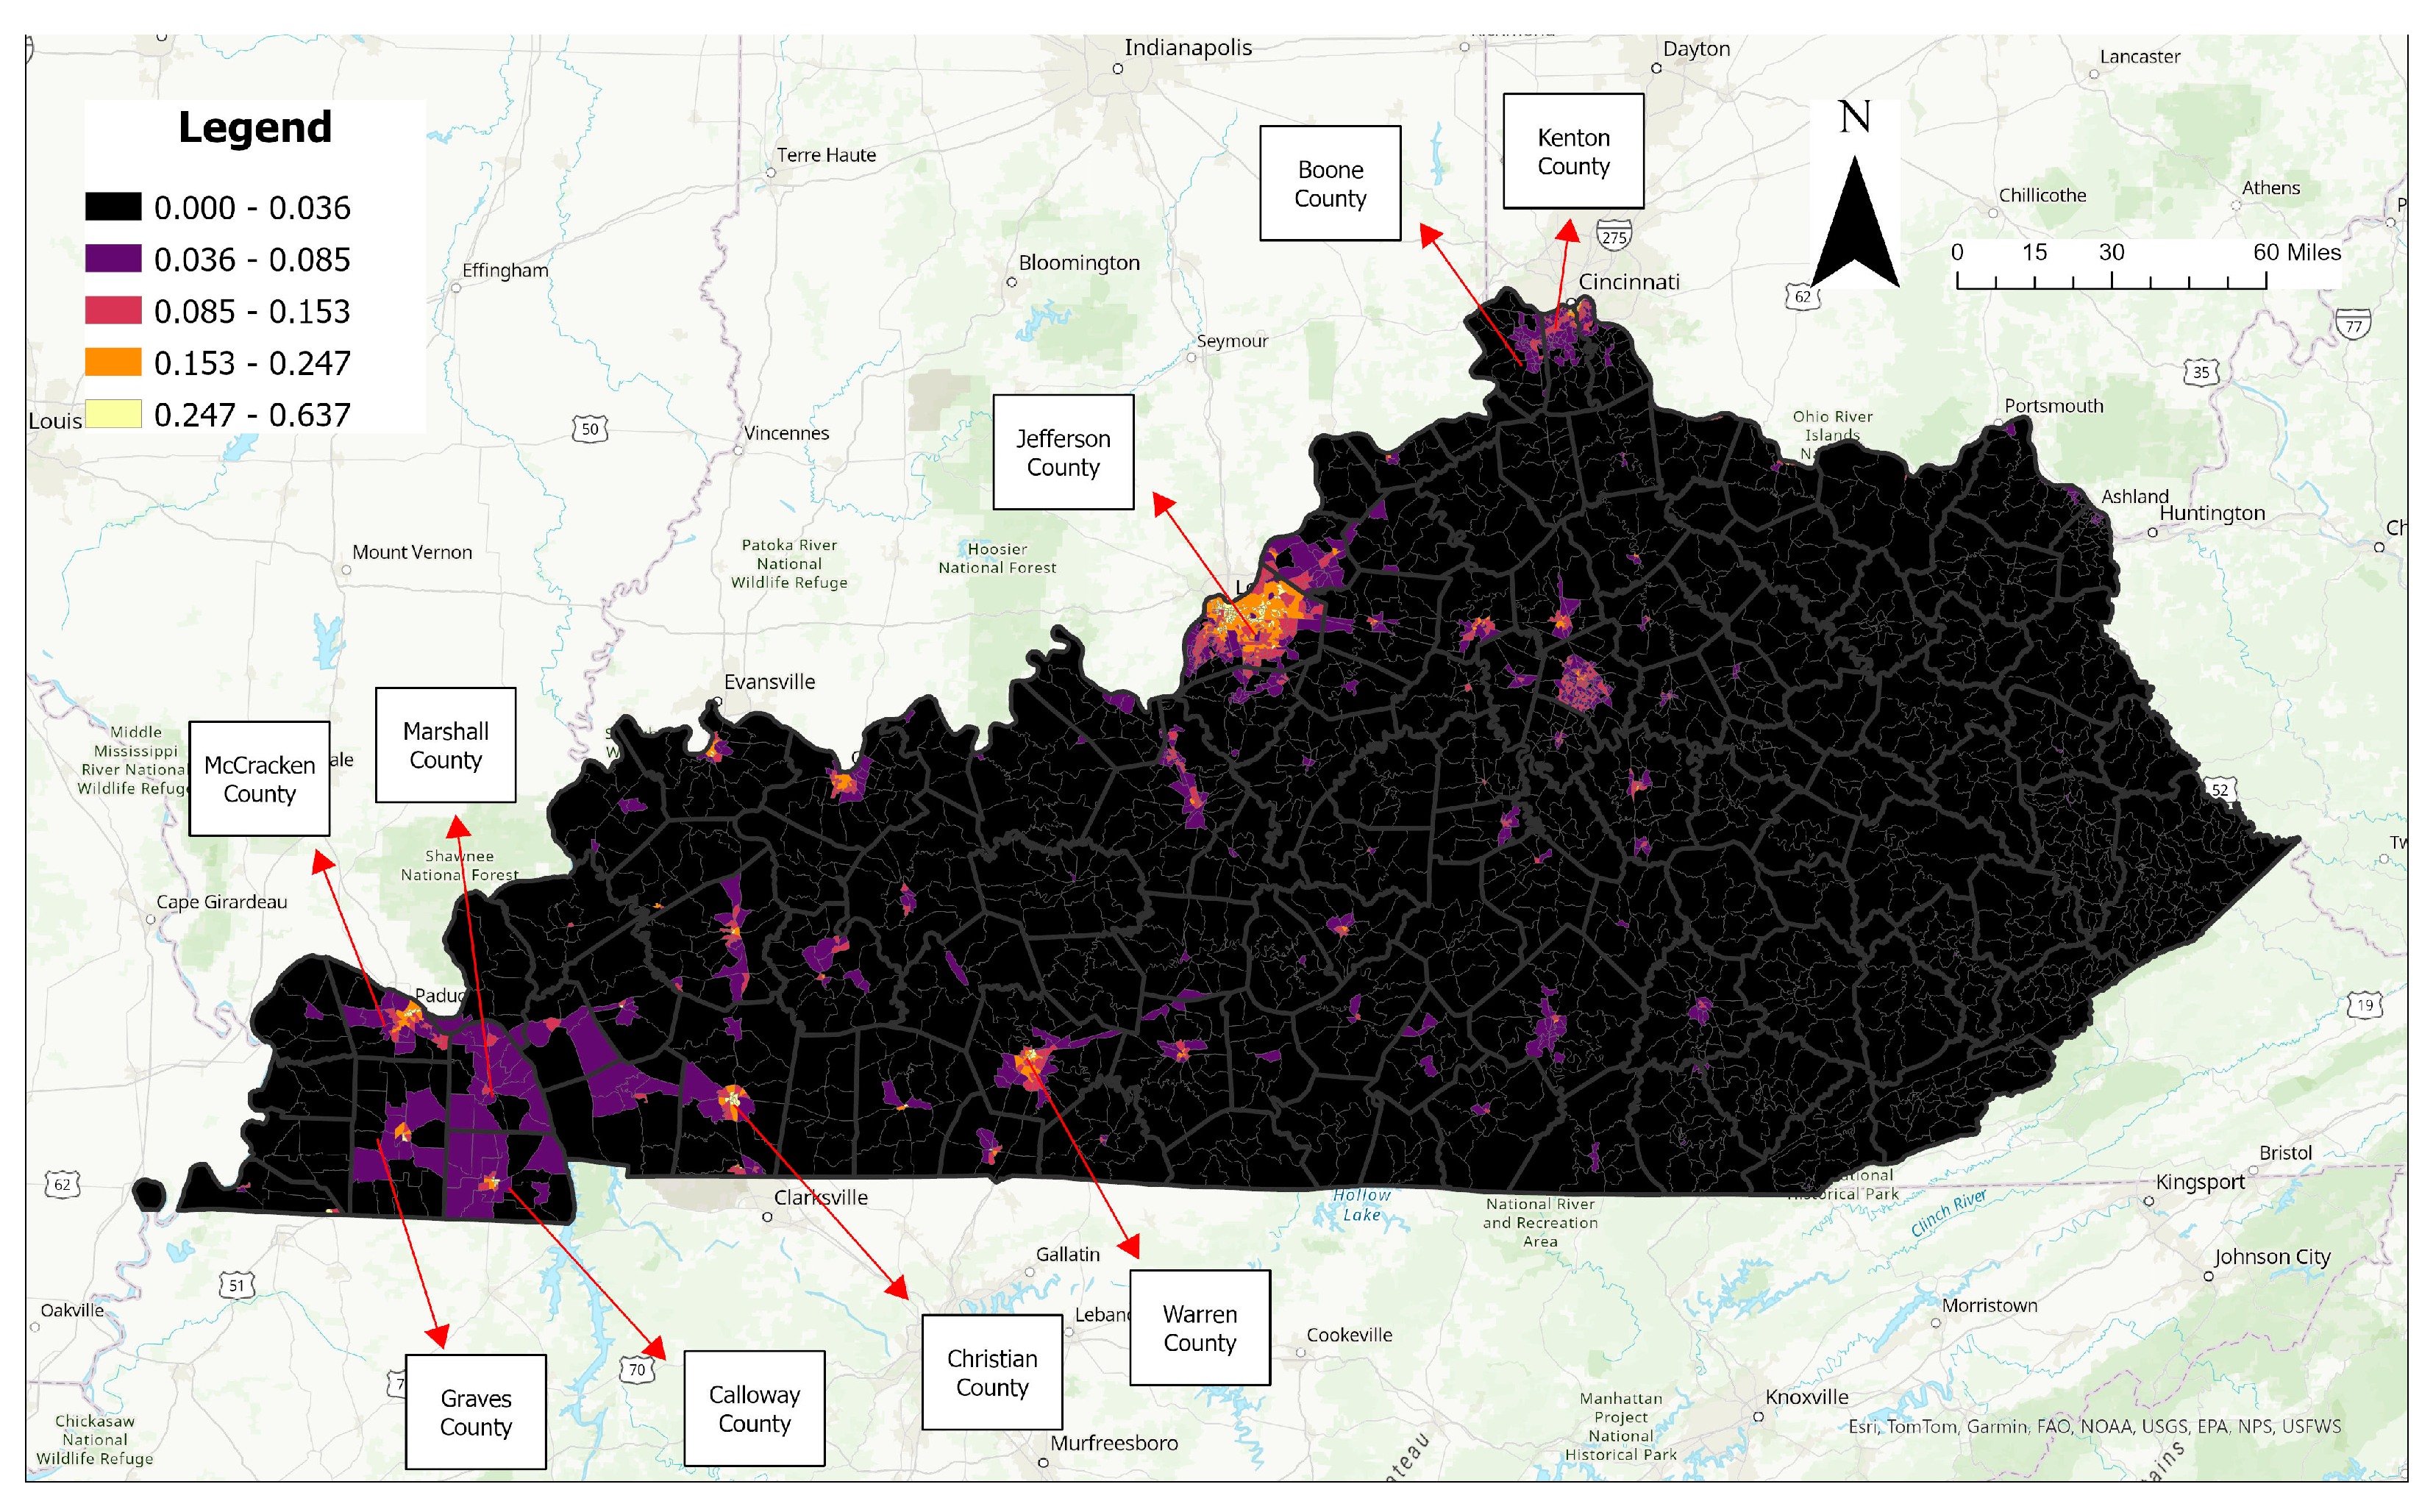
4.1. Spatial Analysis Results

Tornado density distributions are shown in Figure 3, obtained by using five exposure zones and natural breaks (i.e., Jenks). This type of clustering is applicable for events with non-uniform distributions like tornadoes. Figure 3 shows tornado exposure between 1950 and 2022 for Kentucky. As seen in Figure 4, the findings of our study (Figure 3) show some similarities with respect to the risk zone classes of tornado day occurrences between 1950 and 2010, as depicted by Blinn in his study [16]. Similar to the study by Blinn [16], the west and southwest regions of Kentucky, namely Graves, McCracken, Marshall, Calloway, and Christian counties, experienced high tornado activity. In addition, it should be noted that in the northern parts of Jefferson County and all parts of Warren County, respectively, several highly populated counties, including the city of Louisville, had relatively high tornado exposure over the study period. On the other hand, tornado density was the lowest in the eastern parts of Kentucky (which are relatively less populated than other areas).
Similarly, the roadway impact of tornadoes is visualized in Figure 5 and Figure 6. In Figure 5, the cumulative scoring approach was utilized, with the maximum score being 2. As Figure 5 indicates, roadway vulnerability due to tornadoes was highly observed in Jefferson County, the south of Graves County, and the central areas of Christian County and Warren County. Also, high scores were observed in the neighboring counties to those three counties. Focusing on the entire state, tornado vulnerability of roadways decreased from west to east, except Jefferson County, where Louisville is located.
Figure 6, on the other hand, depicts vulnerable regions where both exposure and occurrences had high values. This was performed by multiplying normalized variables with a max score of 1. Figure 6 shows that CBGs in Jefferson County had the highest roadway vulnerability. In other comparatively highly populated counties like Kenton, Boone, and Warren, there was a relatively high roadway impact, even though there was comparatively less tornado impact in Kenton and Boone counties. On the other hand, in the southwest portion of the state, in counties like Graves, McCracken, Marshall, Calloway, and Christian, high roadway impact was observed more in central areas. This association can be explained by increased roadway network density in central connector areas.

4.2. Statistical Analysis Results

4.2.1. MGWR Model and Its Performance

Summary statistics of the selected coefficients in the final regression model are shown in Table 3A, while model diagnostics and comparison are depicted in Table 3B. As seen in Table 3B, the MGWR model gives more accurate results with respect to a comparison performed based on the following statistics: r-squared, adjusted r-squared, and AICc. This is an expected result due to the multiscale nature of MGWR and it is natural to expect each explanatory variable to have a distinct spatial scale. Based on this capability, better results are obtained by MGWR than the GWR model, where residuals have a normal distribution indicating a good fit of the model.
Table 4 provides a summary of chosen bandwidths and their significance for each explanatory variable. In the bandwidth column, the selected bandwidths in miles are given. In the parenthesis of that column, the scale of the selected bandwidth is shown by percentage in terms of geographical context. In that section, values close to 0 describe a perfectly local variable, while values near 100 show that the given variable is almost a global one. For example, in this study, the D2a_JpHH (jobs per household) variable has the highest bandwidth by 285.97 miles. Similarly, the no_veh_hhs (households that have zero vehicles) and P_18 (percentage of people who are younger than 18) variables have bandwidths of 141.50 miles and 213.73 miles, respectively. This indicates that those variables are more global and there is less spatial heterogeneity for them in the study area. It should also be noted that the rest of the variables are more local and have bandwidths of 38.41 miles. In the significance column, the number of CBGs is given so that those variables are significant, with their percentage given in parenthesis. The D2a_JpHH (jobs per household) variable has no significance all around the county, indicated by the highest bandwidth. t_ami (transportation costs % income for the regional typical household), ht_ami (housing + transportation costs % income for the regional typical household), median_household_income (median household income), no_veh_hhs (no vehicle households), and SLC_score are noticeable variables in terms of significance in the study area.
While determining whether a variable is significant for a location, the following logic is used: if the variable’s absolute pseudo-t statistic is higher than a determined value, it is considered significant. In contrast to regular t statistics, where a typical α = 0.05 value is generally equivalent to a 95% confidence interval, an alternative method is utilized in this study by considering the effect of the GWR model [44]. Based on Table 4, a new value is obtained by dividing the alpha by the effective number of parameters (ENP), where this parameter is calculated by tracing the MGWR hat matrix [47].
As mentioned before, using MGWR decreases multicollinearity. To show that difference, condition numbers with GWR and MGWR can be seen in Figure 7, respectively. The condition number is a good indicator of multicollinearity, and it is suggested that explanatory variables are highly correlated when it is greater than 30 [48]. According to this indication, a great proportion of the observation points are highly correlated with each other, as shown in Figure 7. On the other hand, when MGWR is utilized, there are only two observations where the condition number is greater than 30.

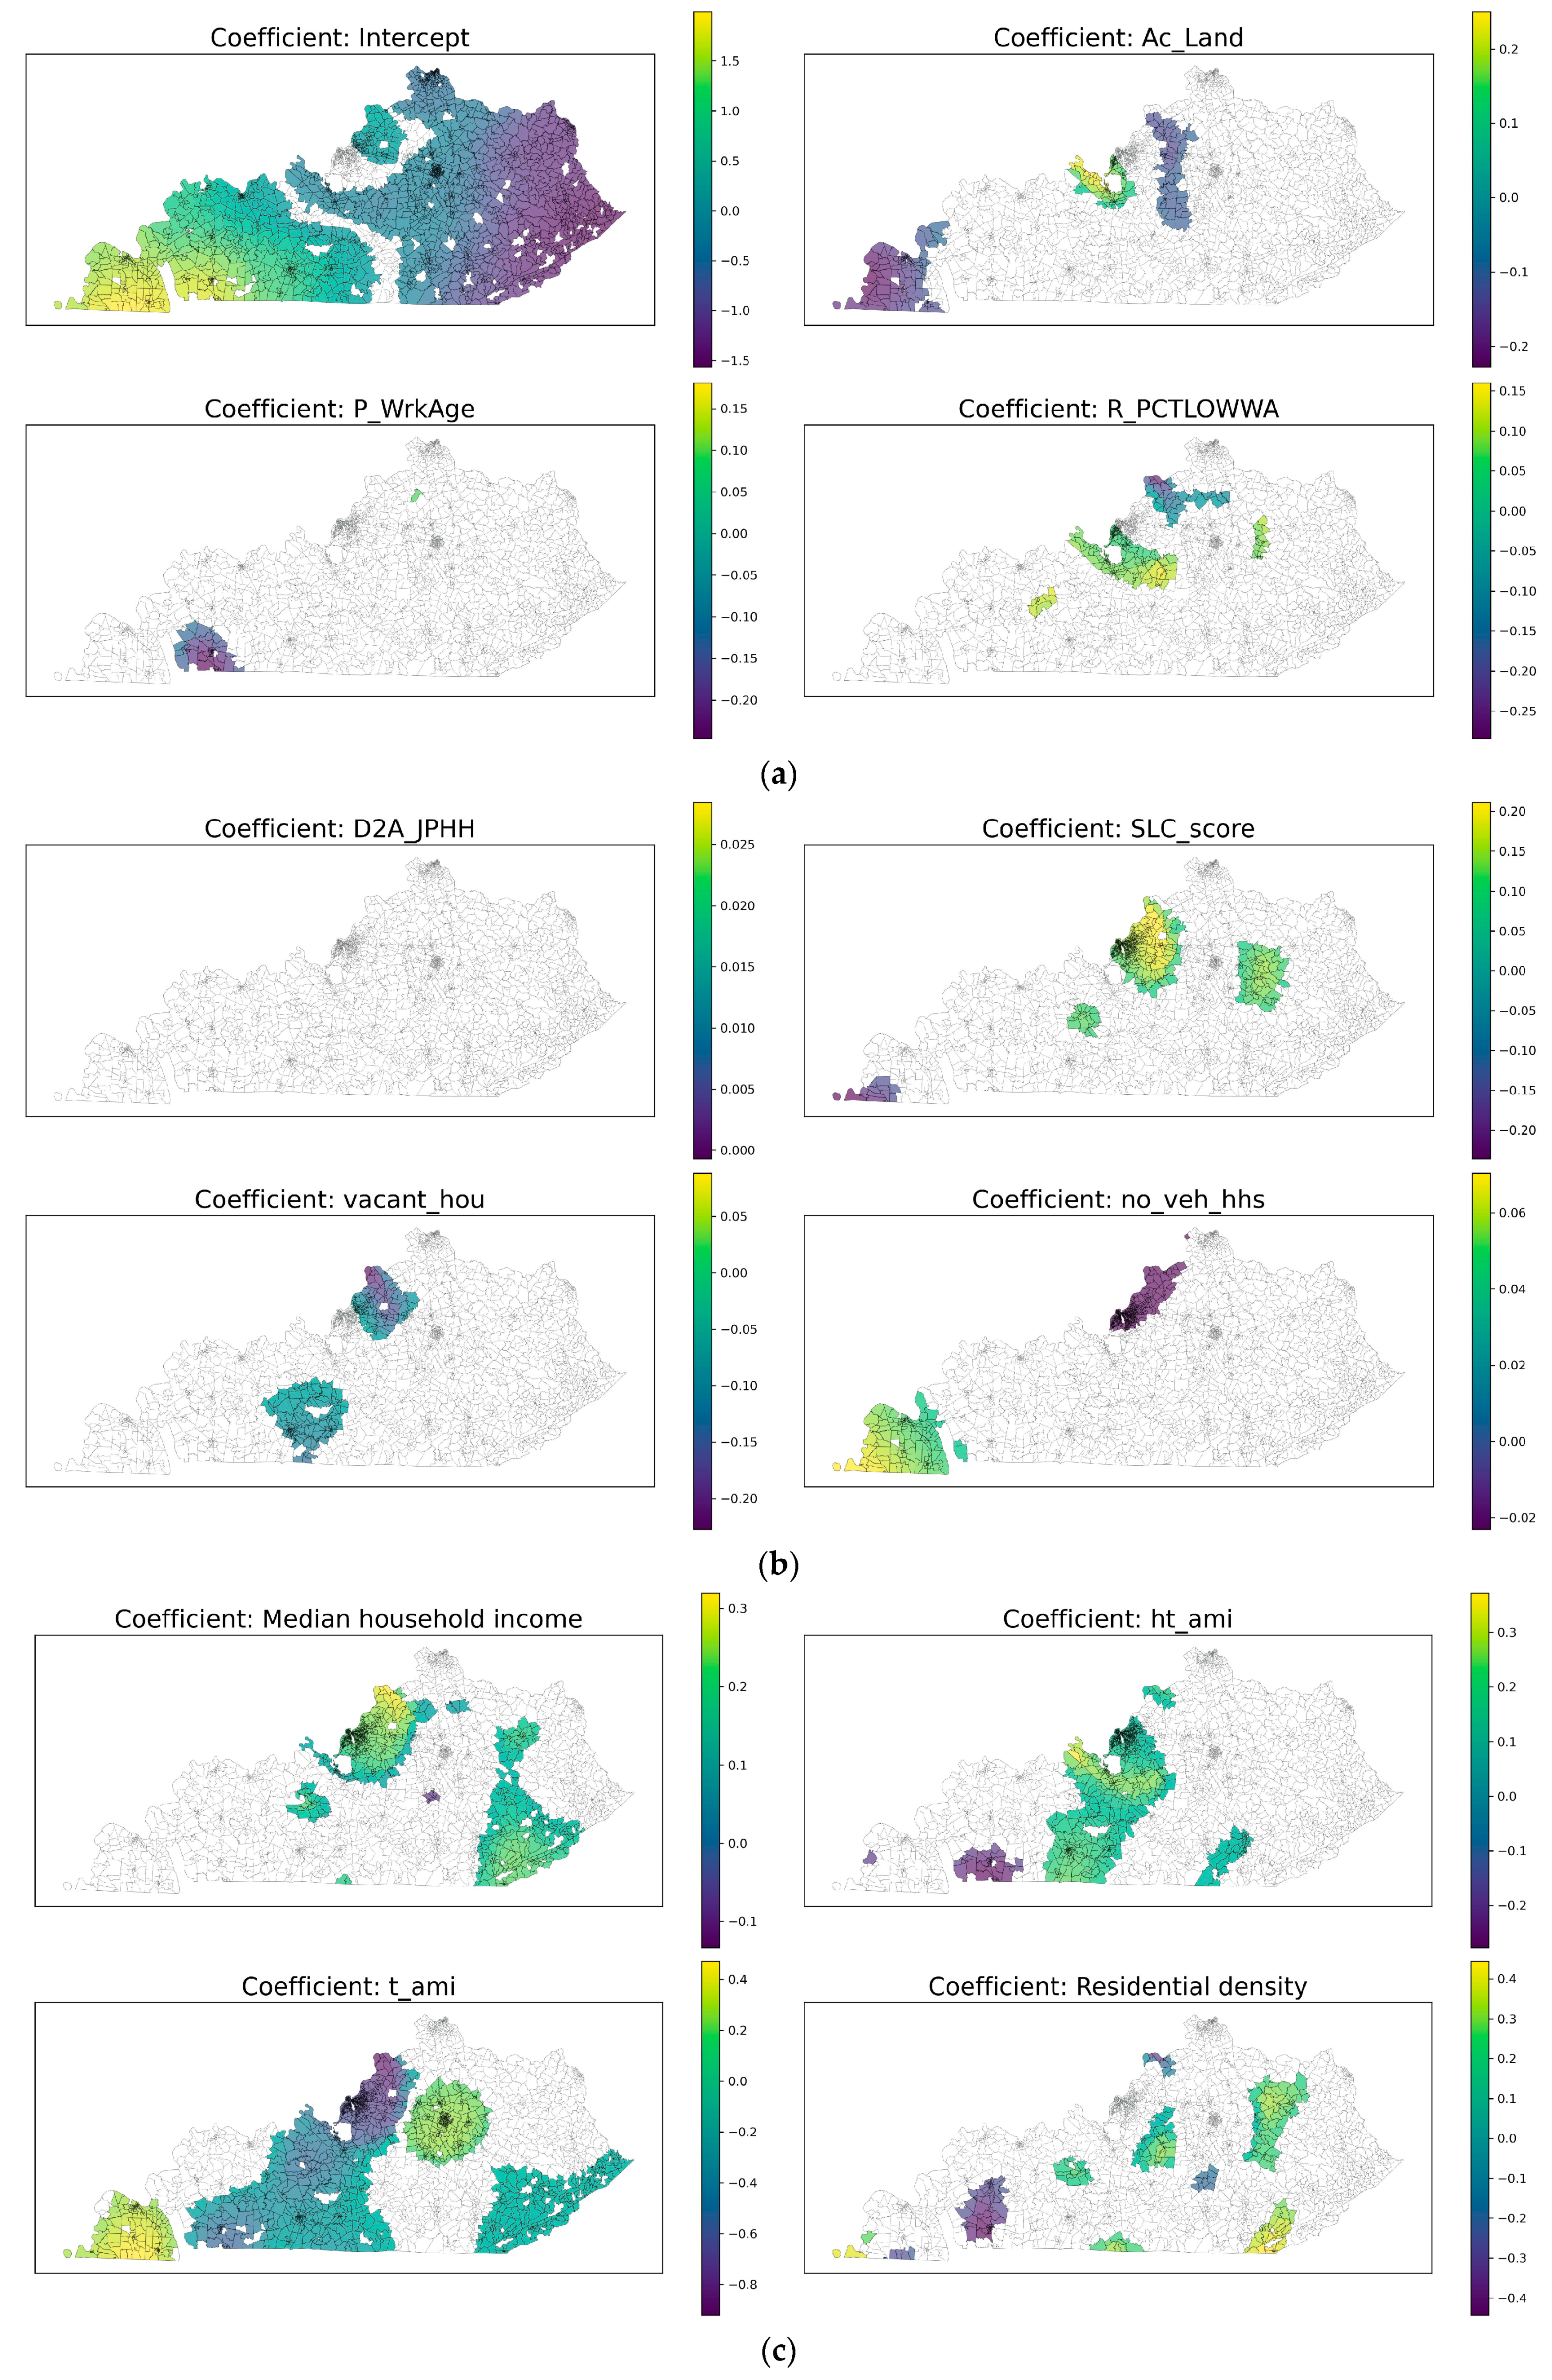
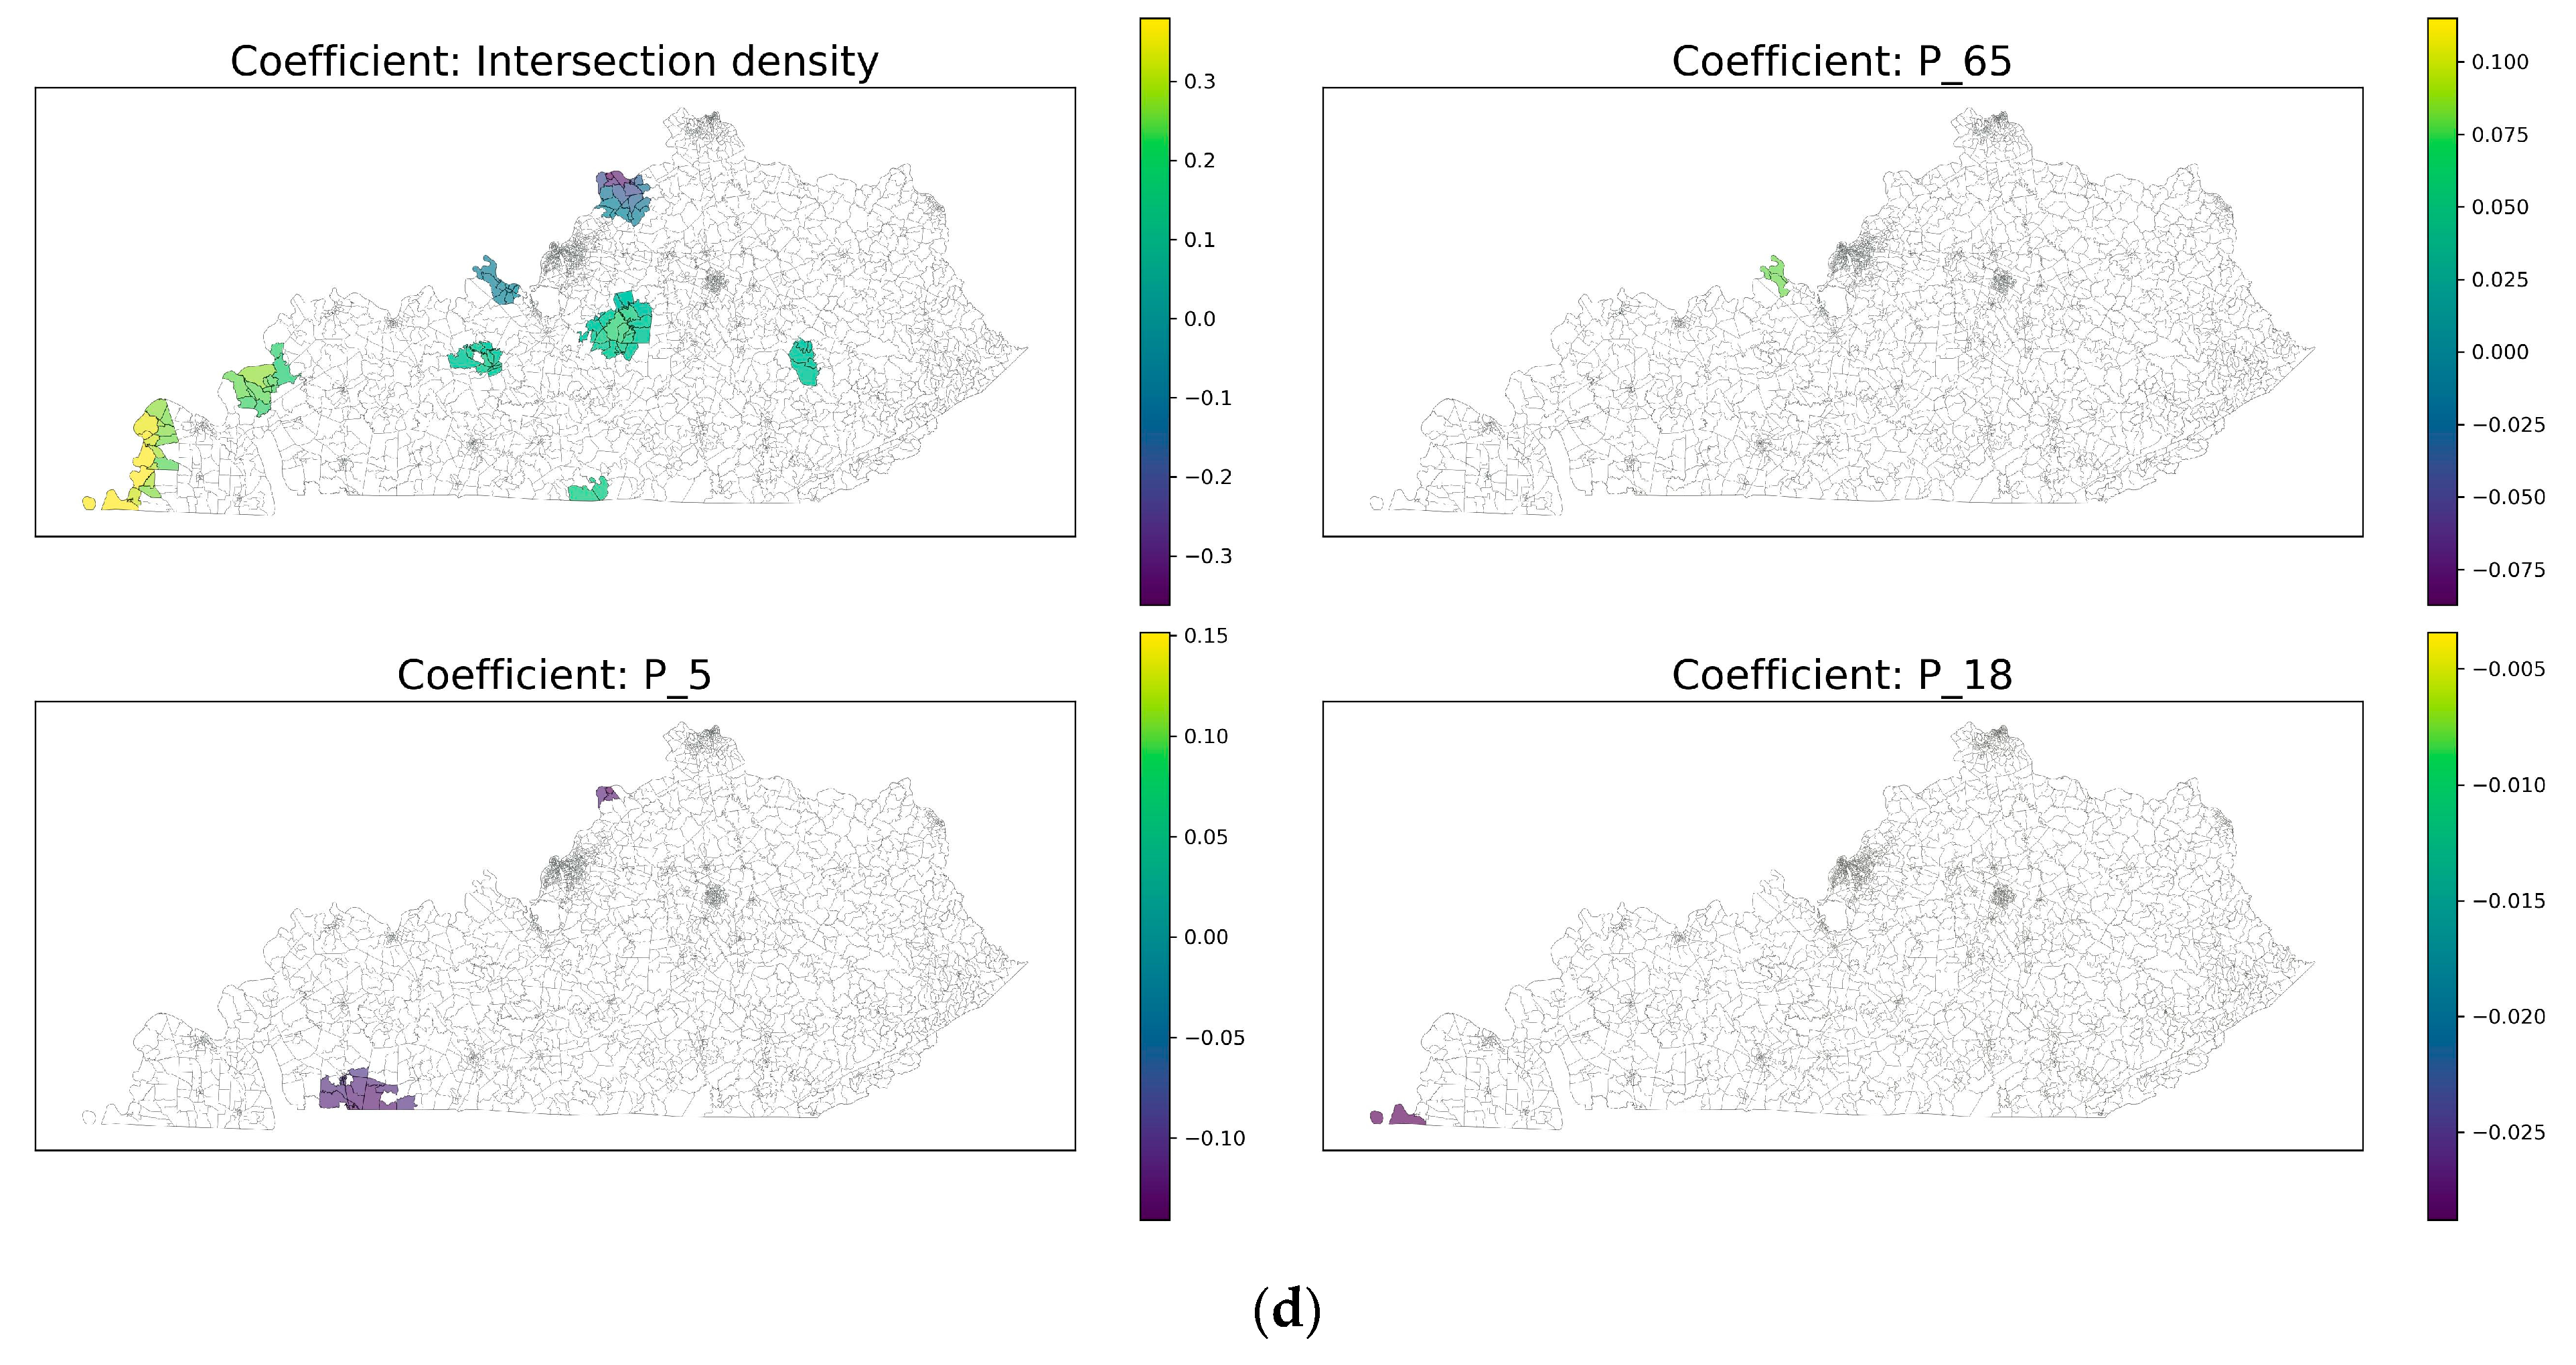
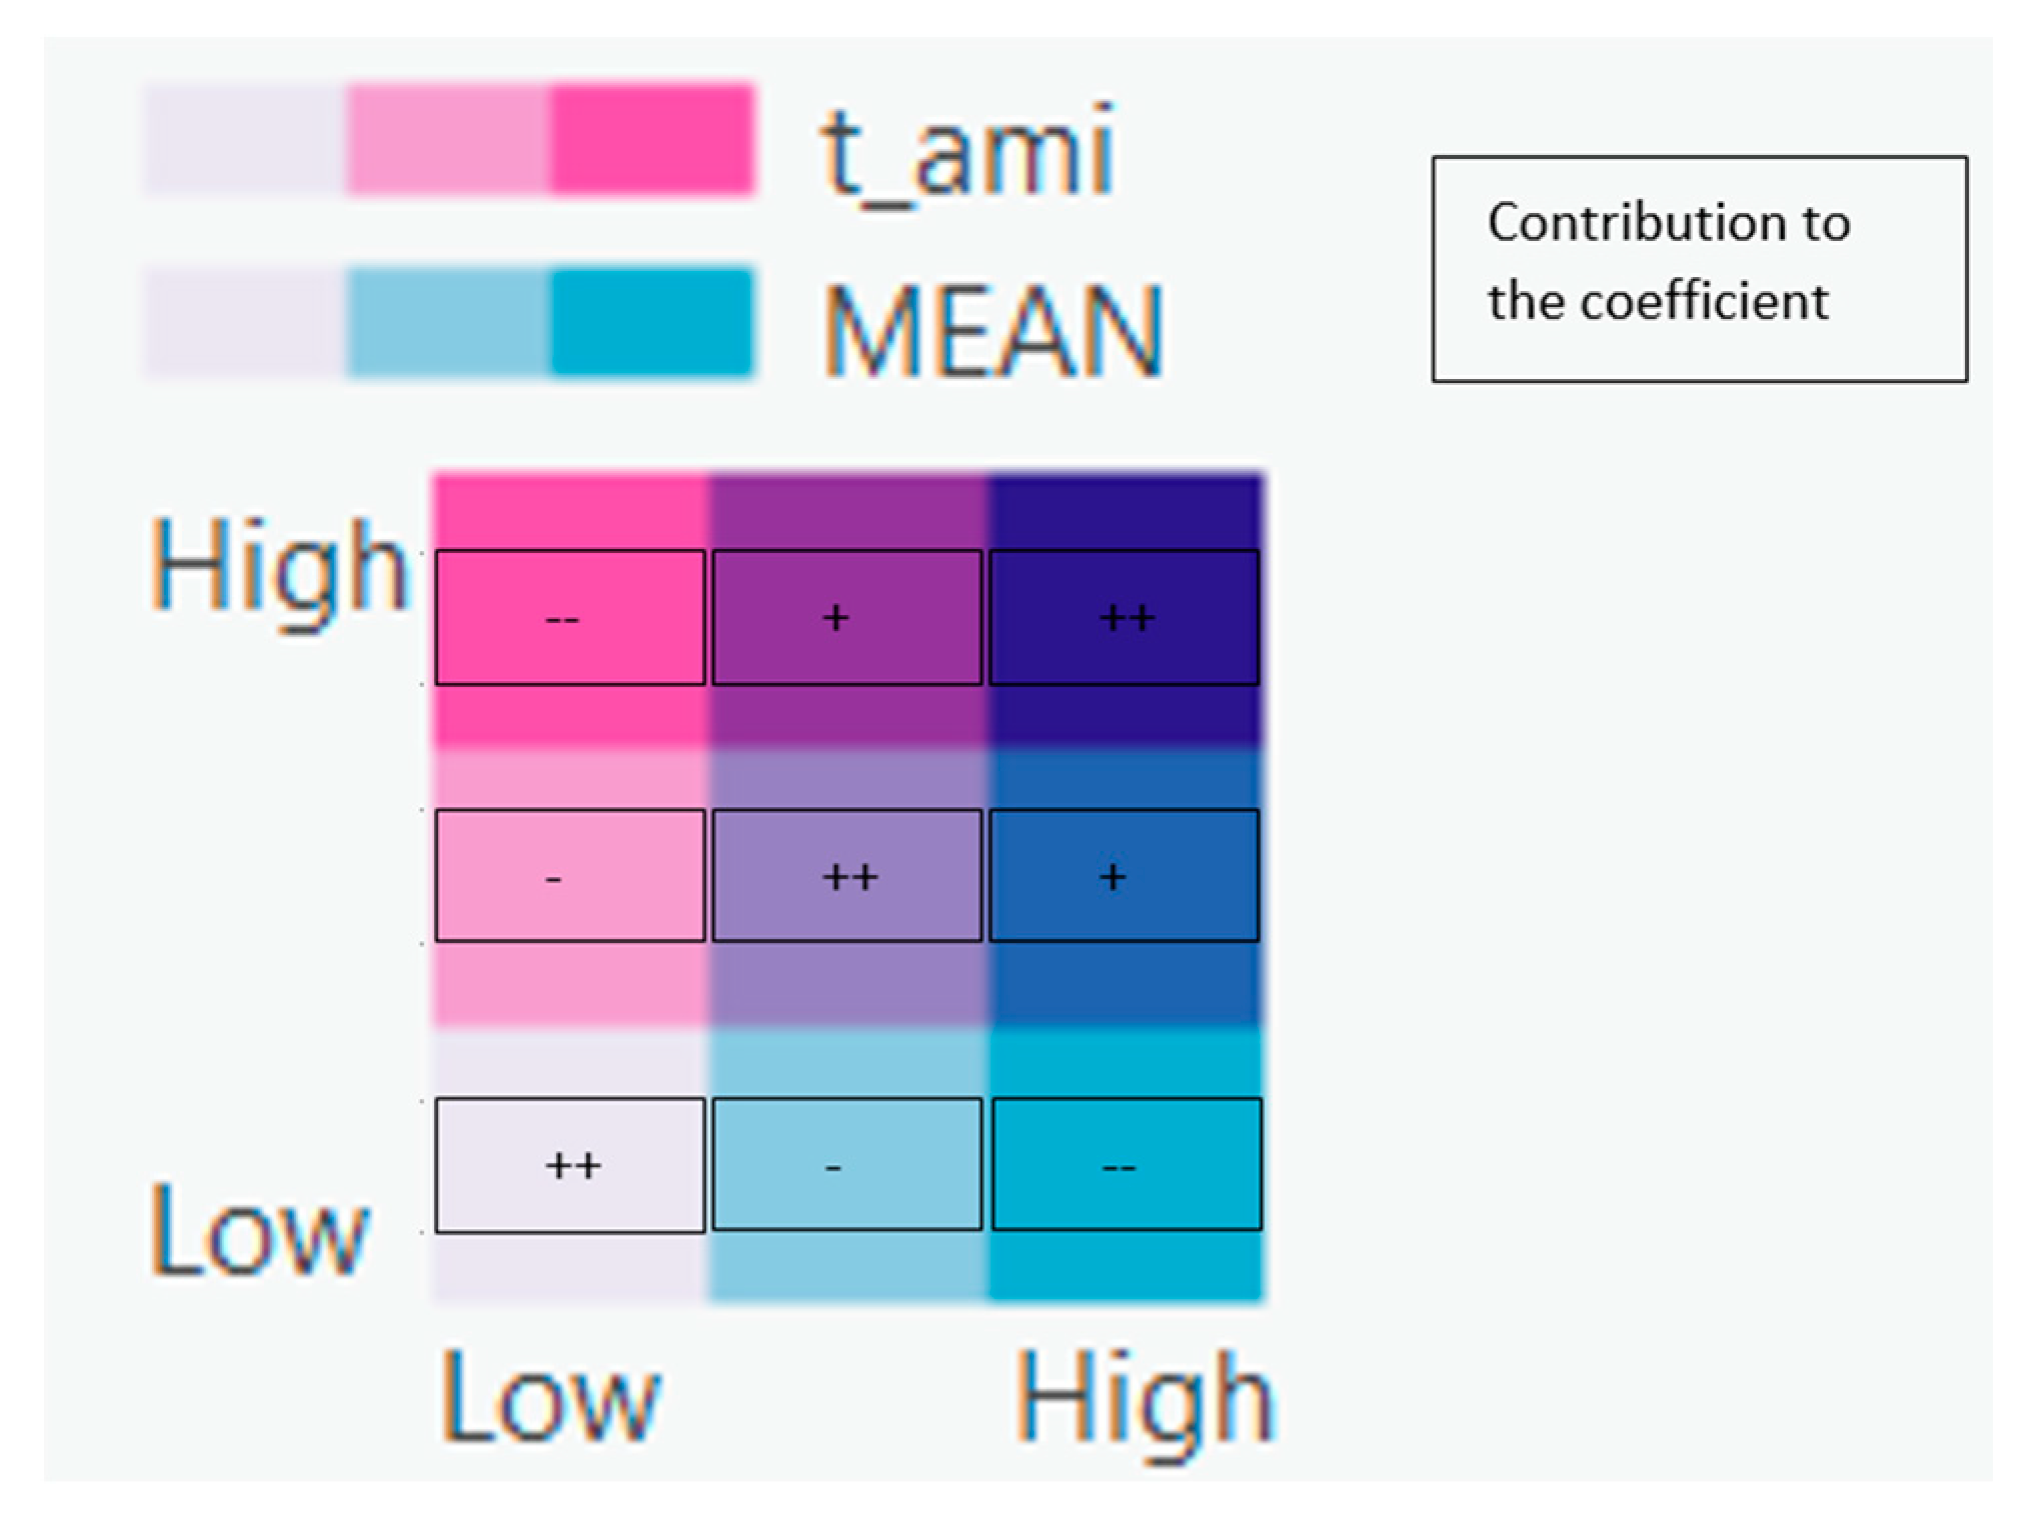
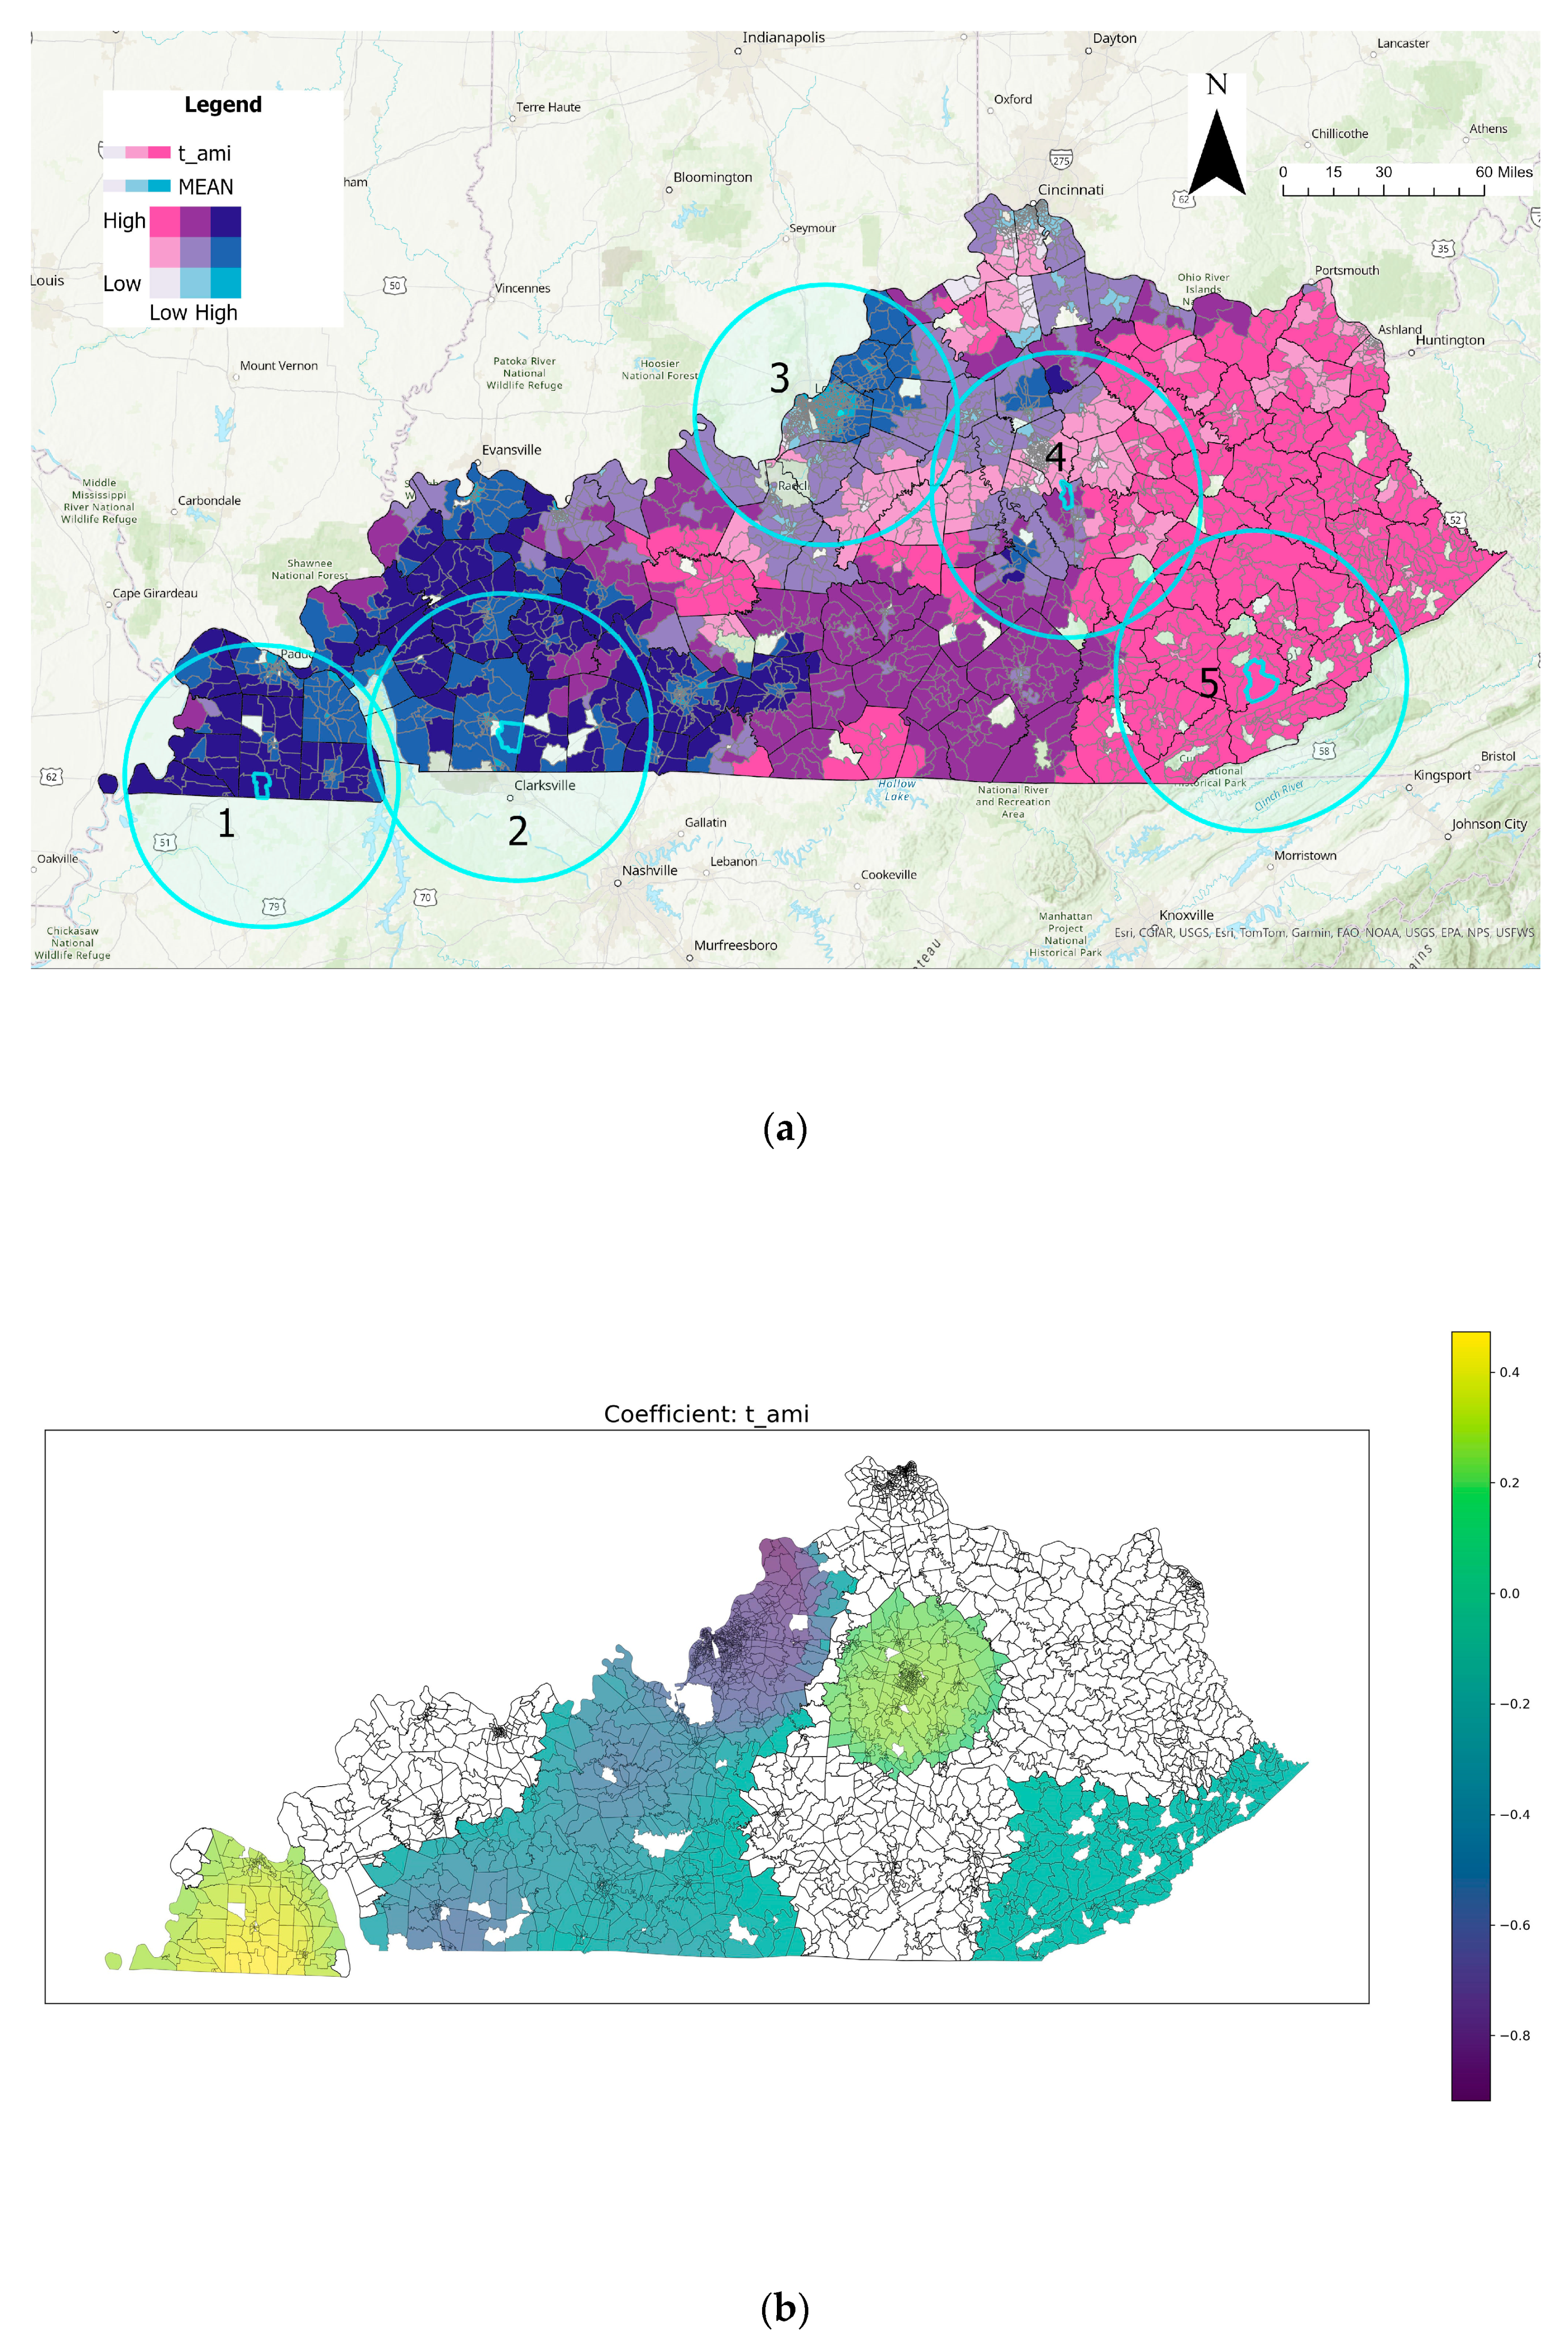
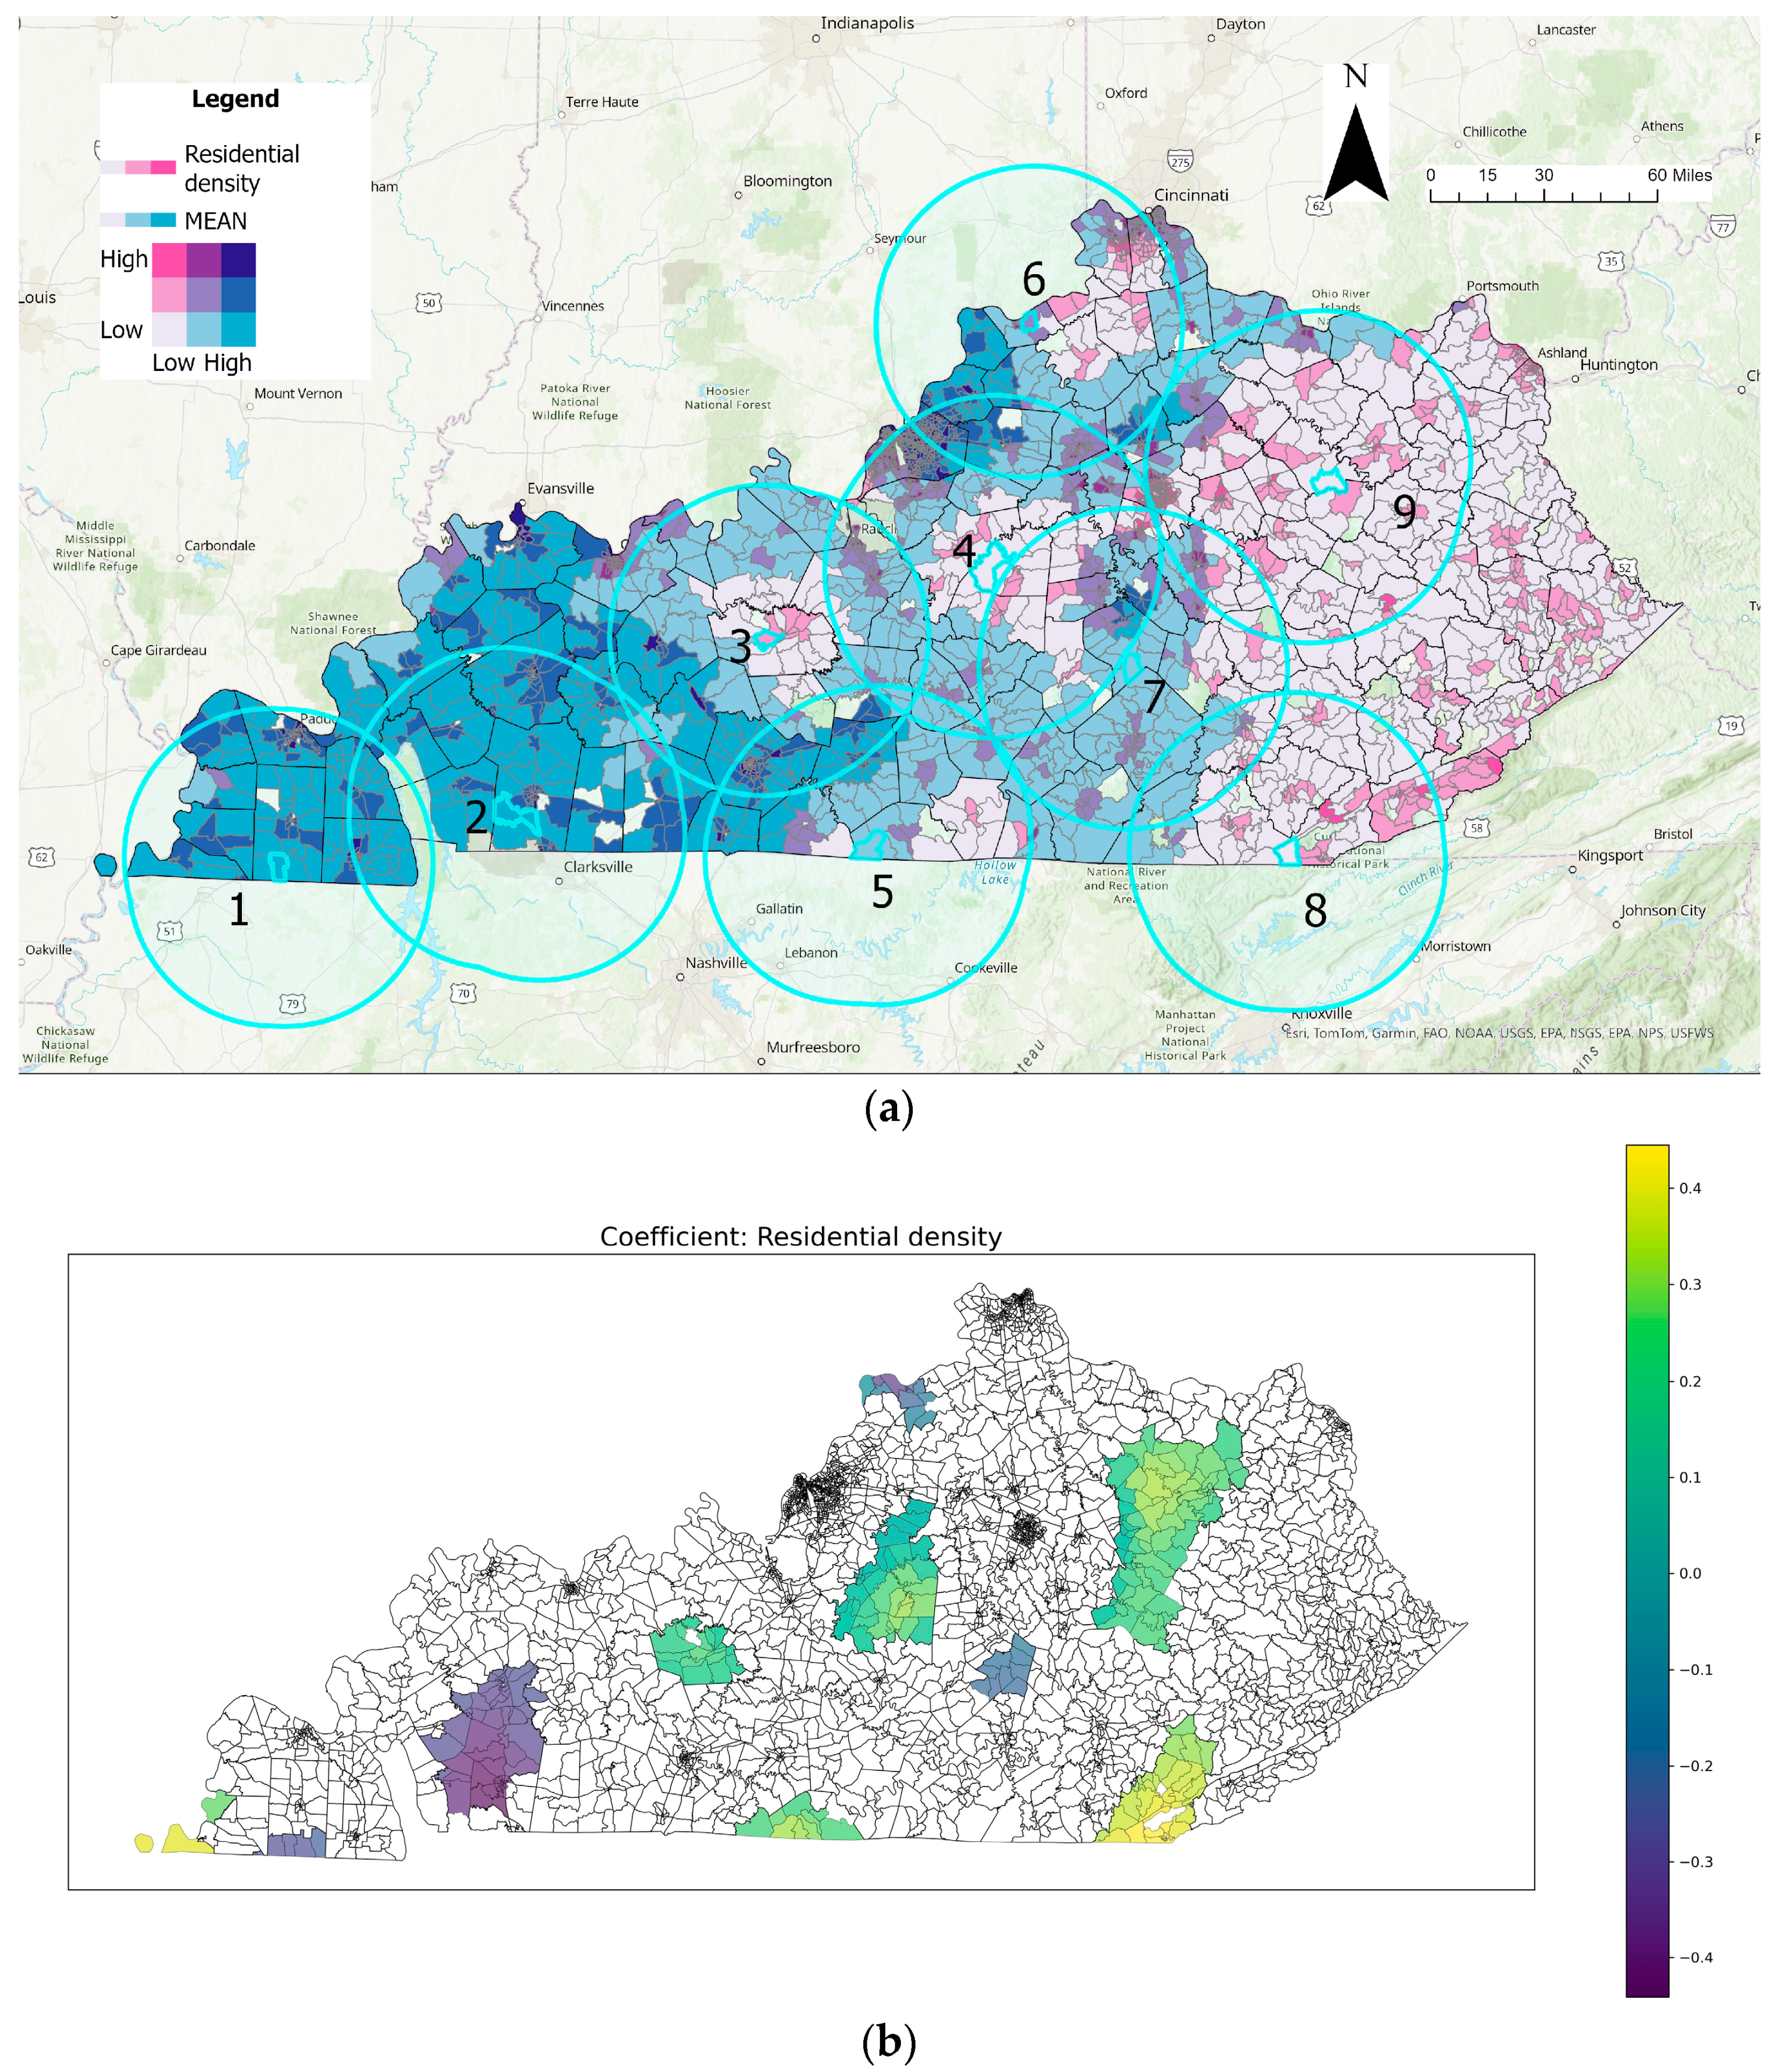
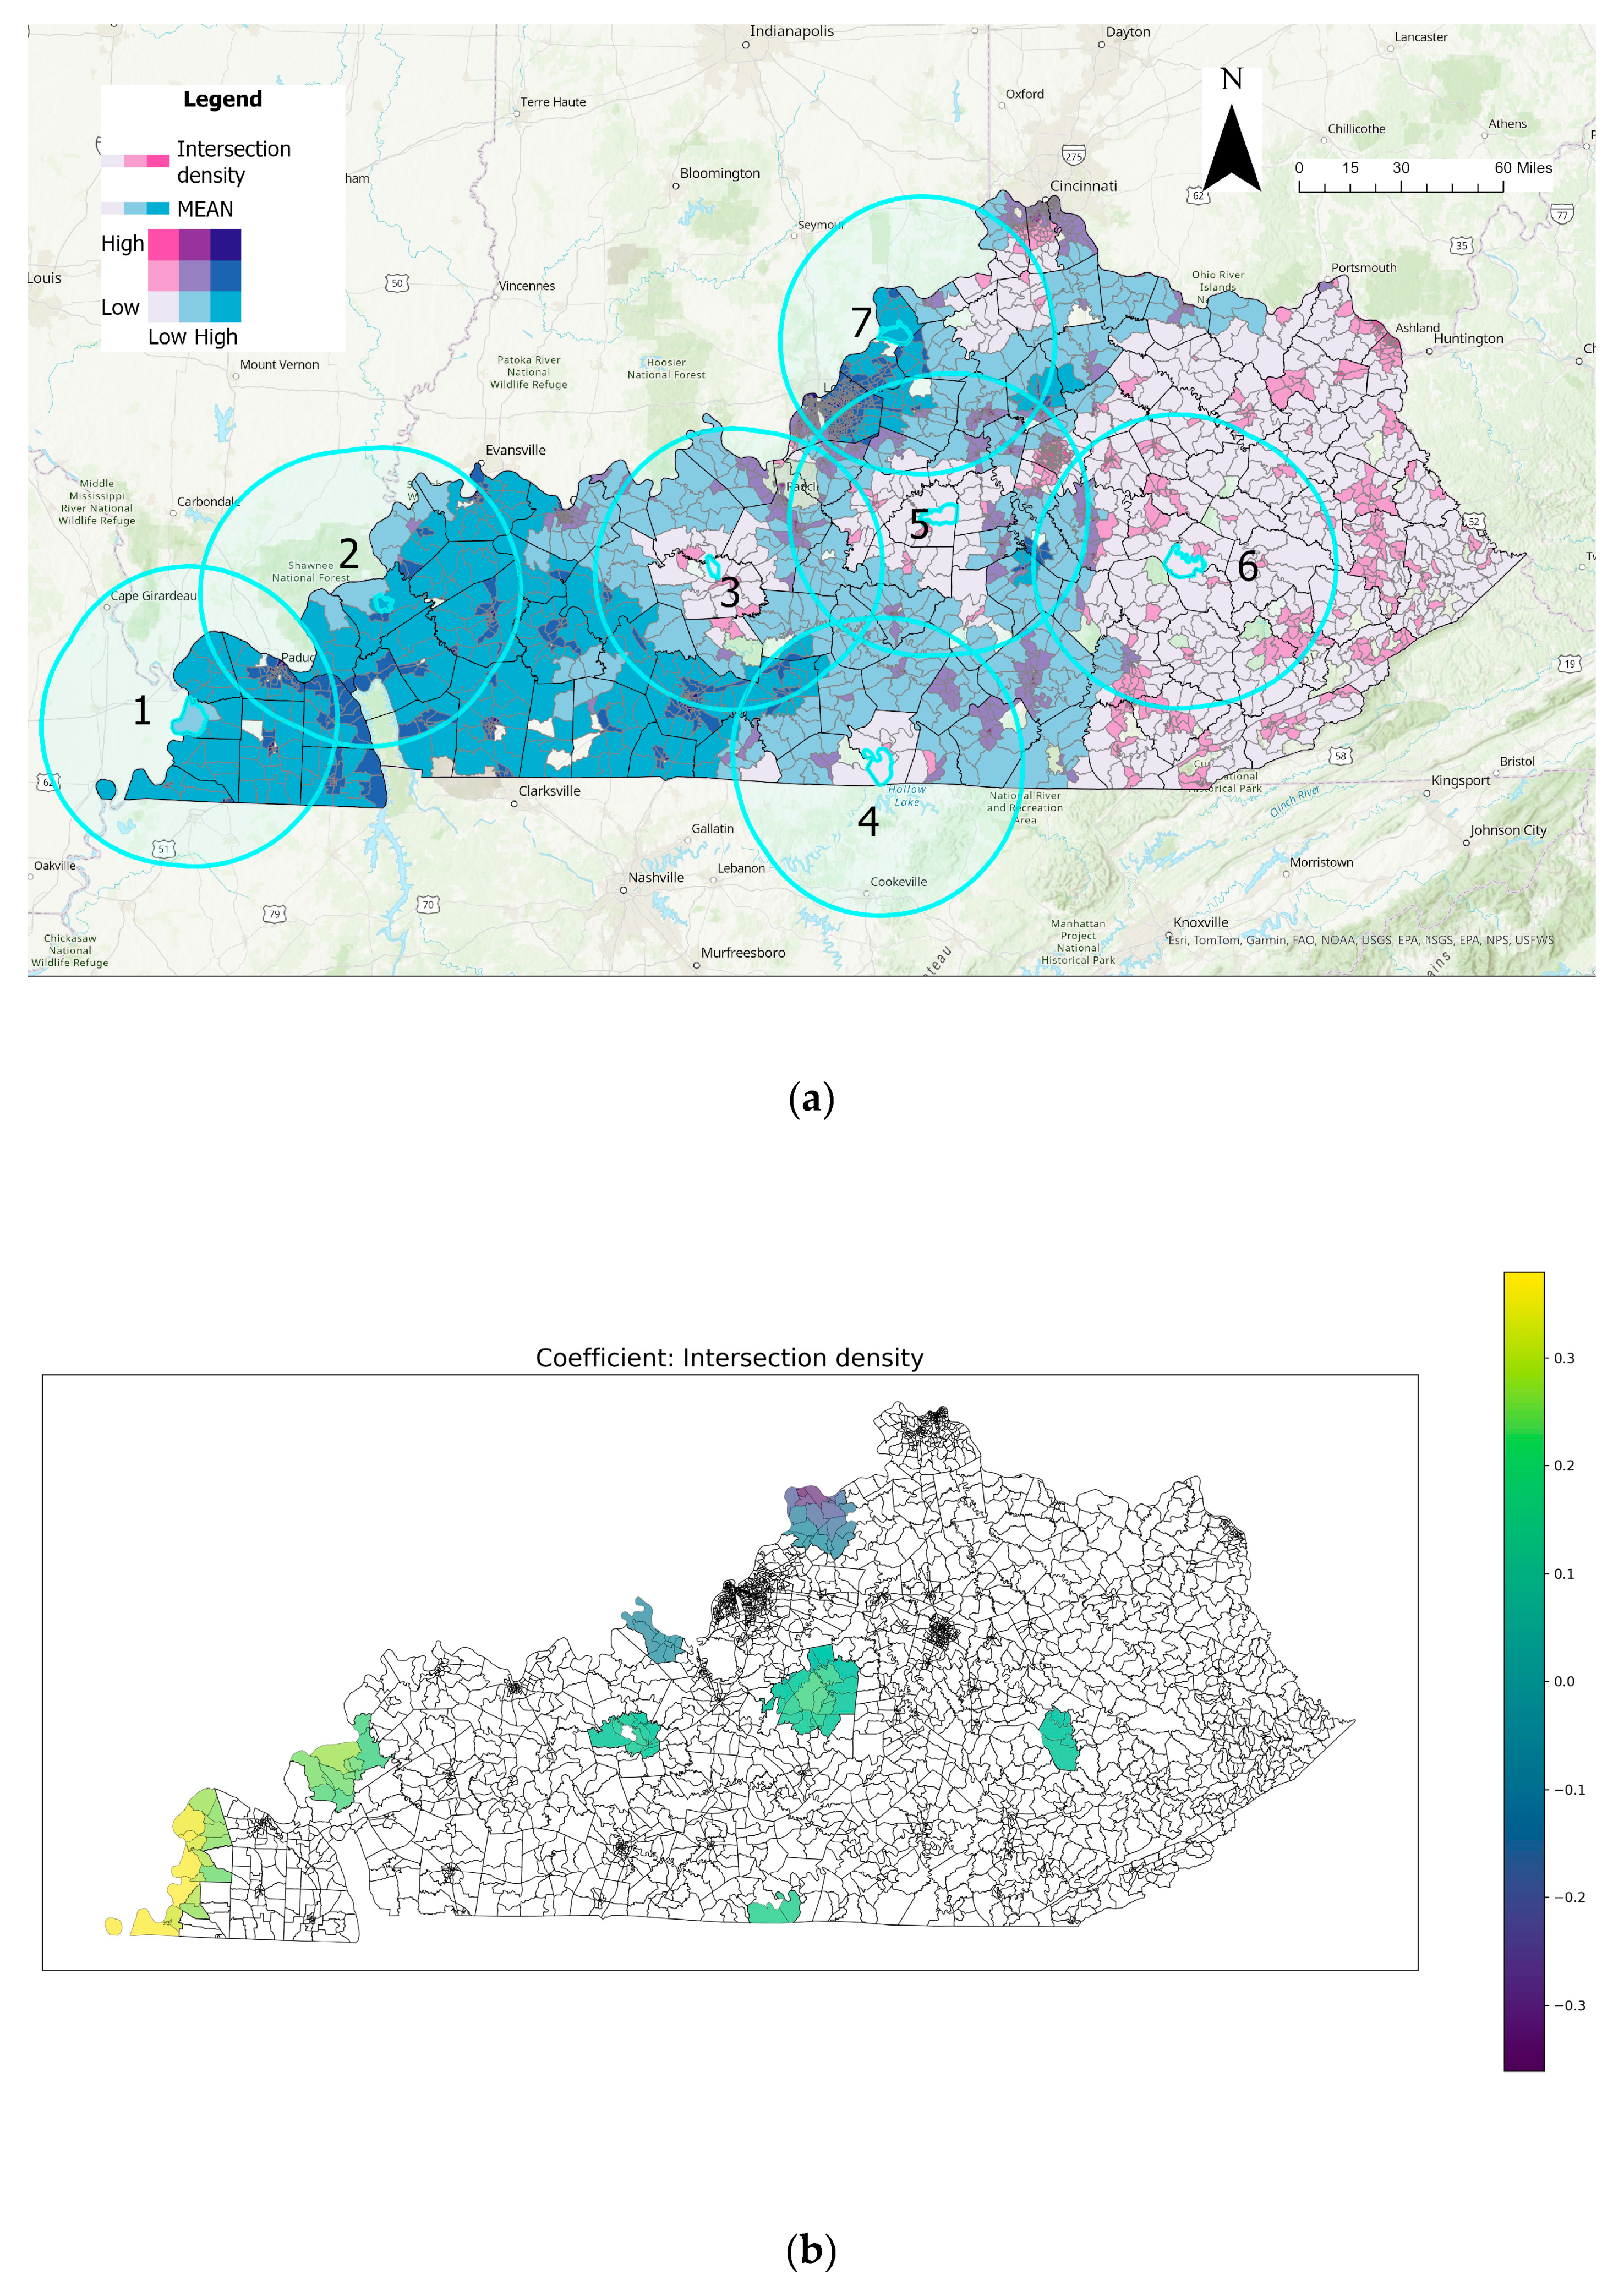
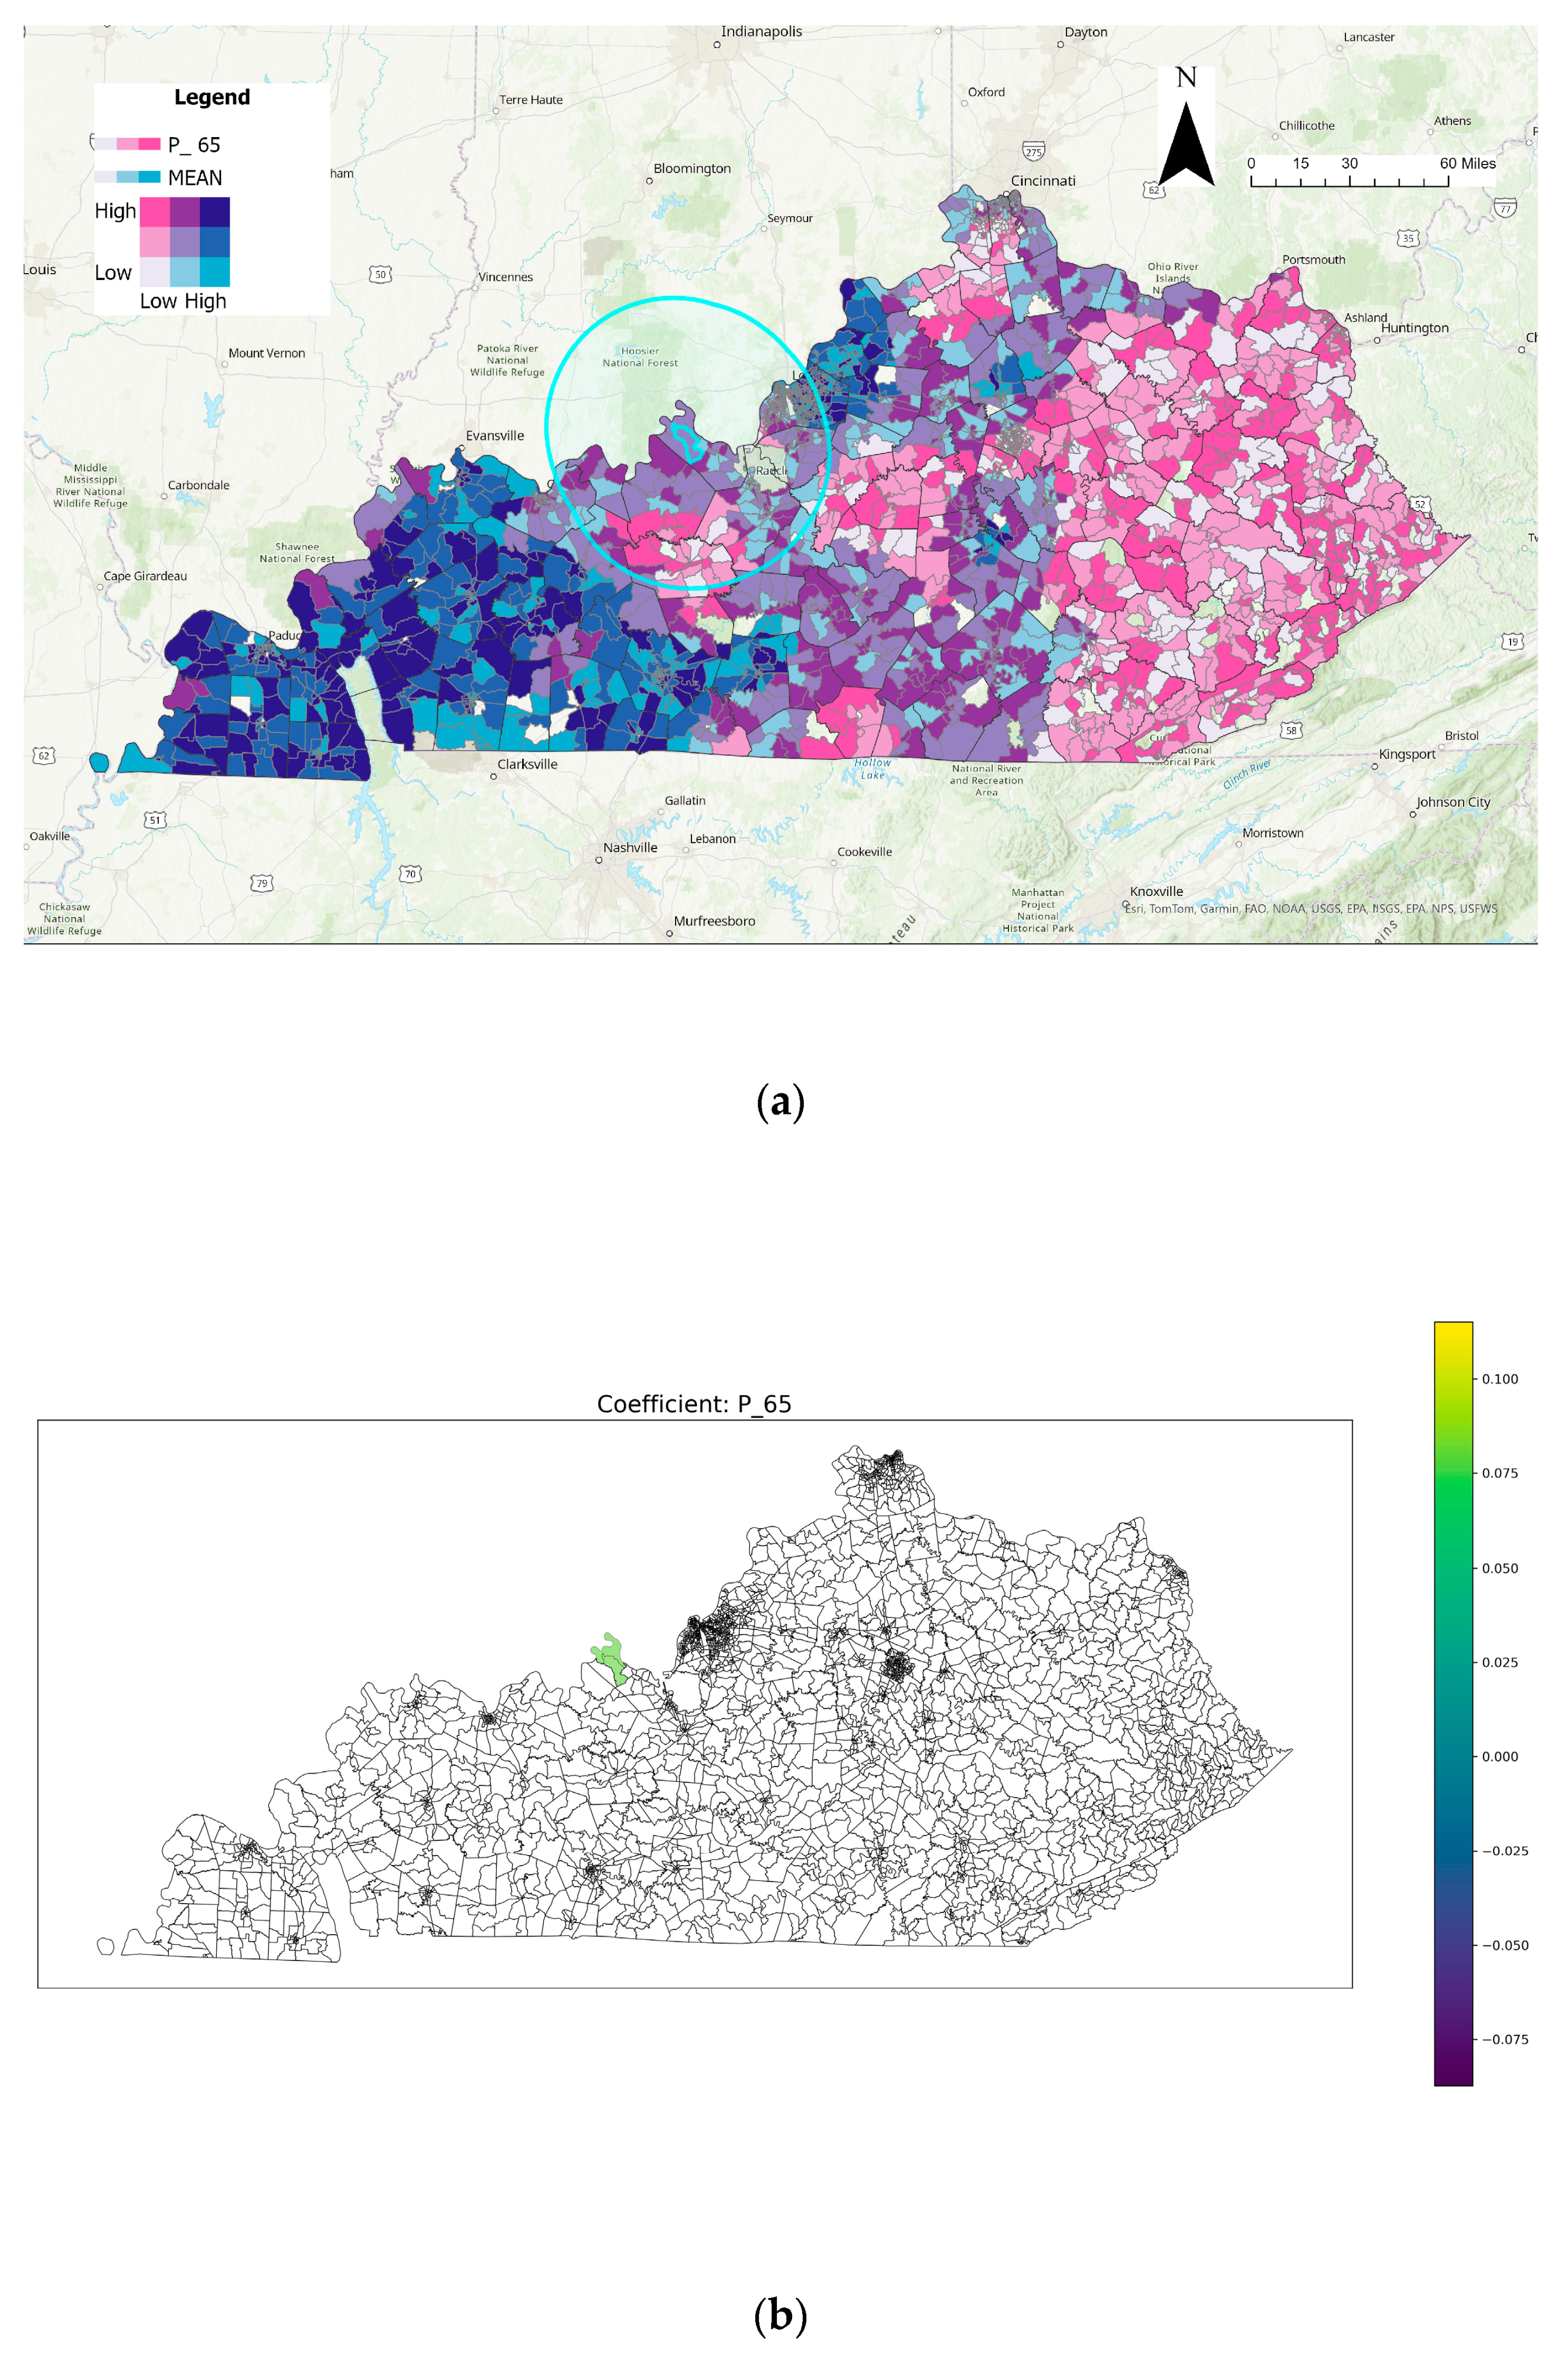
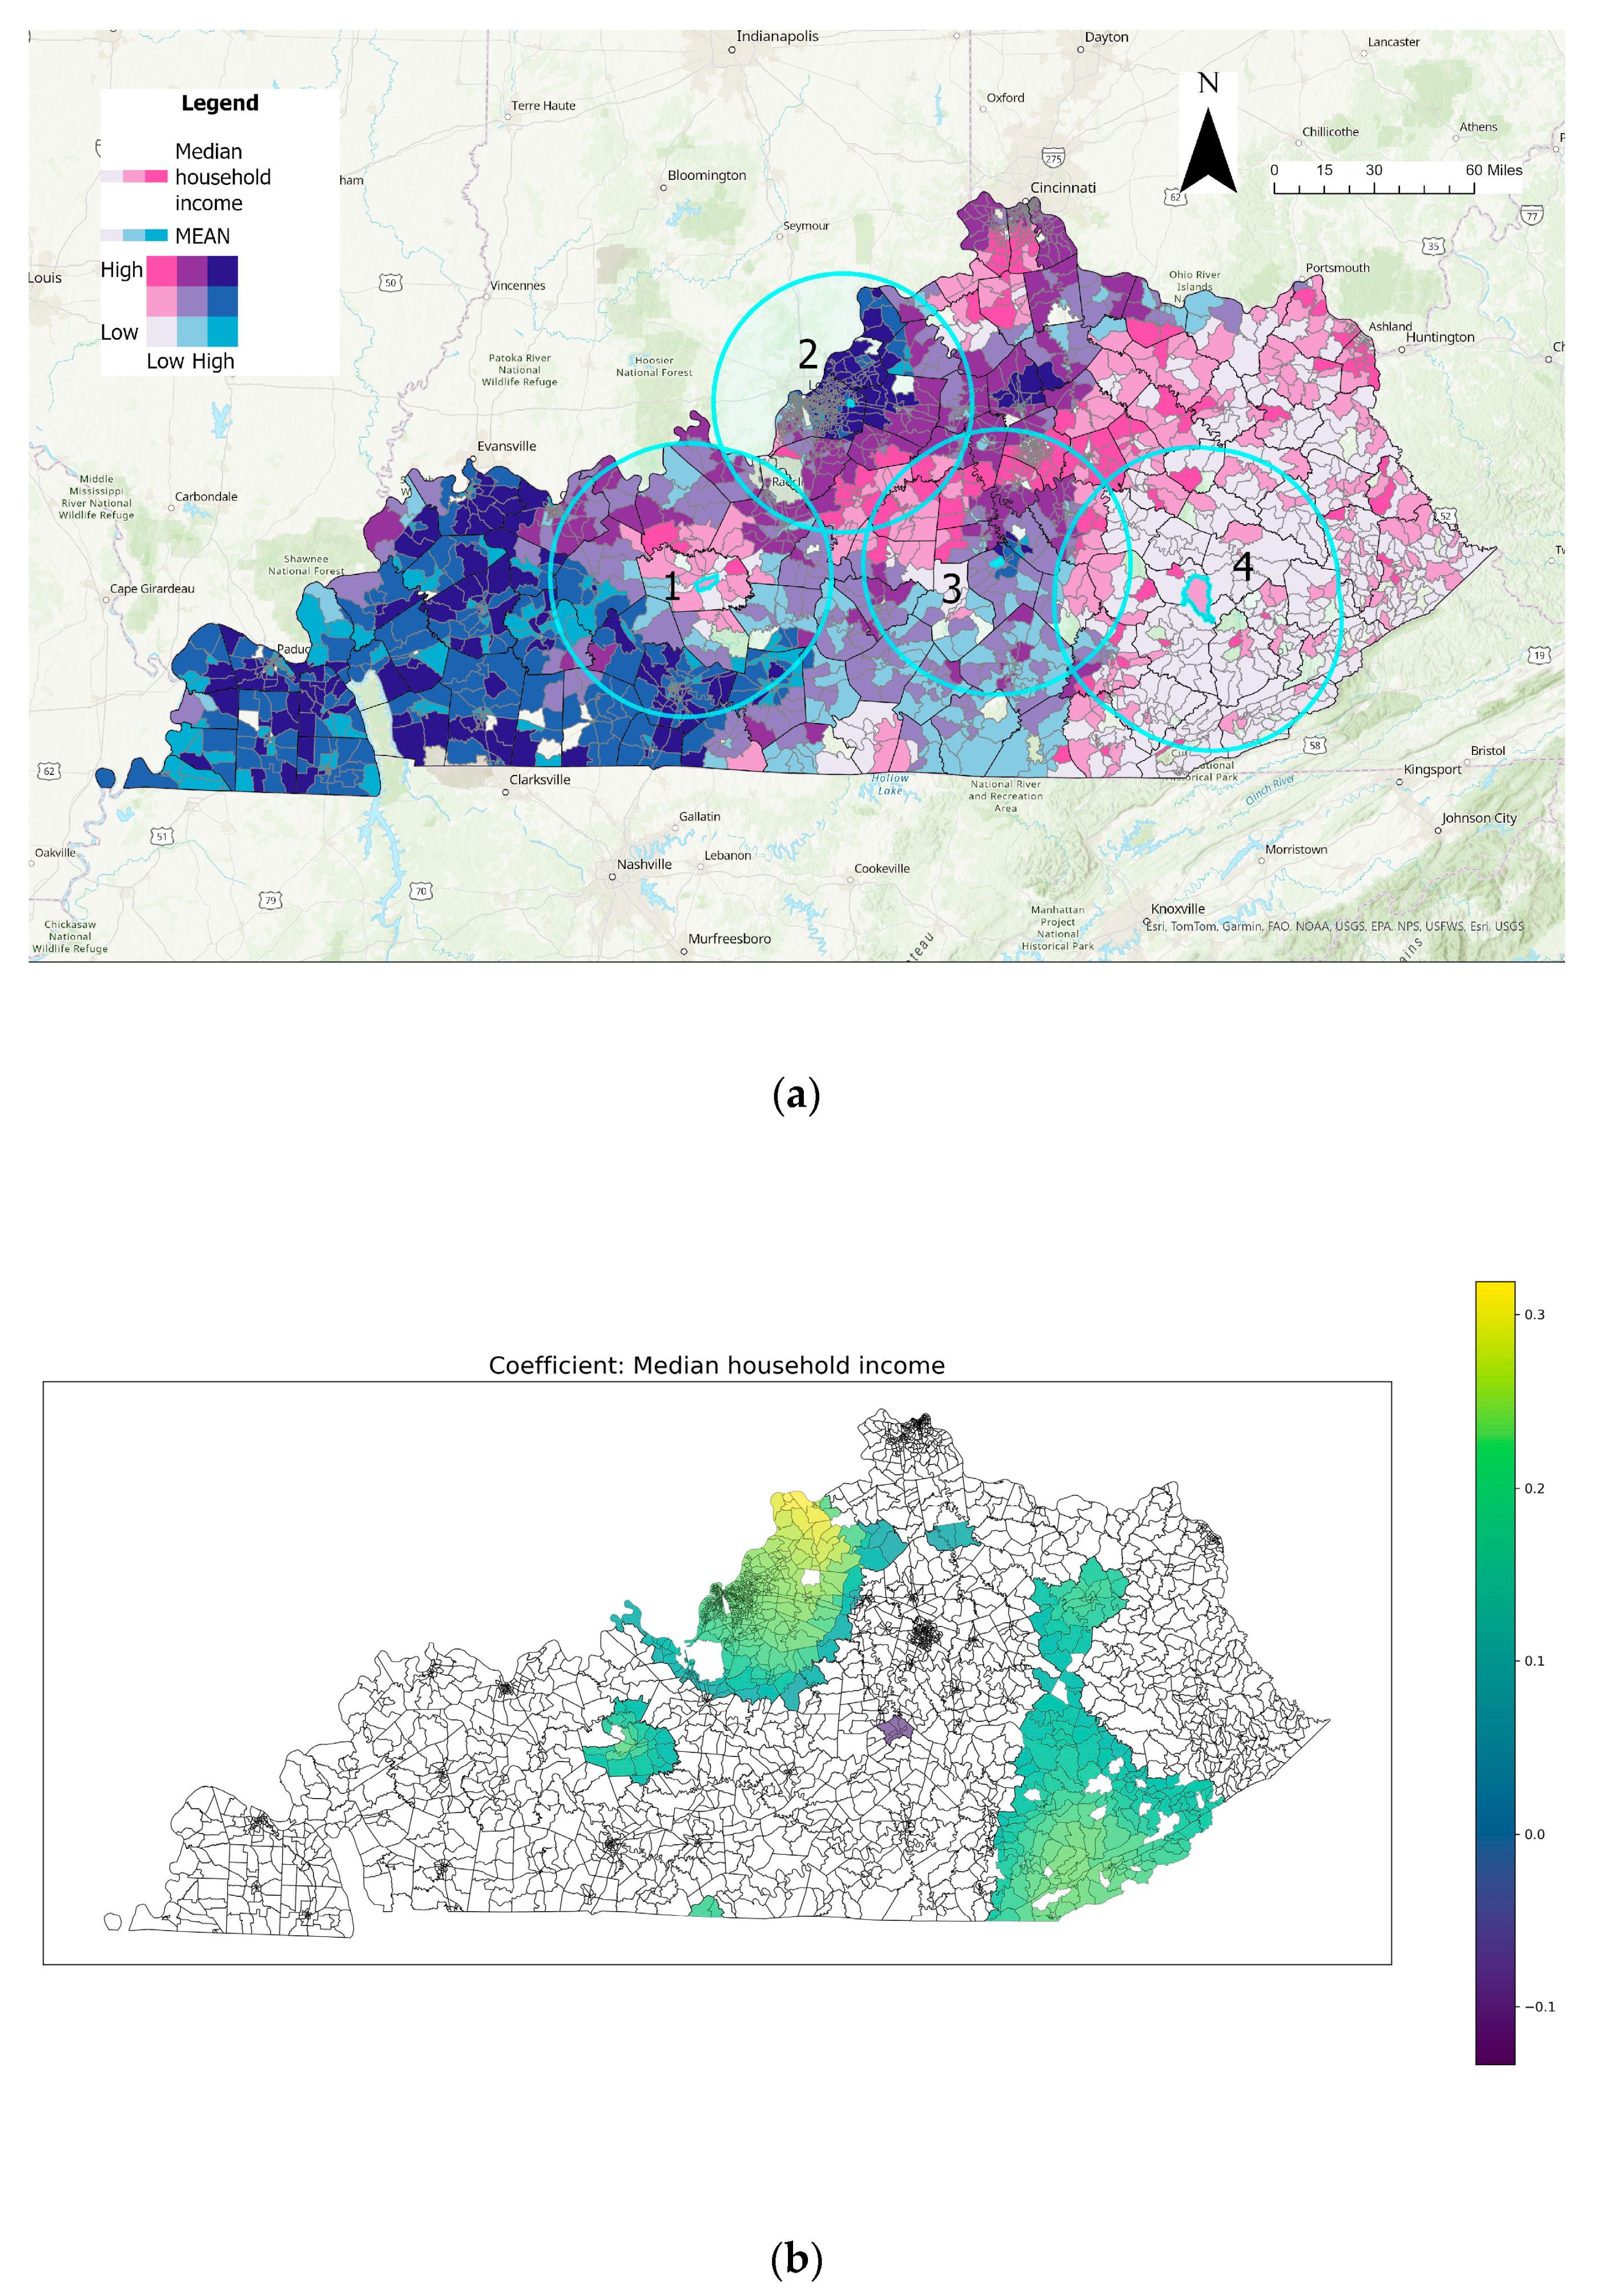
4.2.2. Spatial Distribution of Each Variable

The spatial distribution of each significant variable is portrayed in Figure 8. These variables can be utilized as local variables for statistically significant regions while assessing tornado exposure. This section assesses the positive and negative coefficient values for selected variables. While selecting variables in this respect, we considered covering major aspects related to demographics-, socioeconomic-, and transportation-related characteristics of the state. We chose median_household_income and P_65 as demographics-based indicators of vulnerability (older people and population that have low median_household_income). In addition, to relate socioeconomics and transportation with tornado occurrence, we selected t_ami (transportation costs % income), residential density, and intersection density.
A bivariate relationship between the selected independent and dependent variables was used while explaining the effect of the sign. This relationship can be categorized into nine classes, as seen in Figure 9. Shades of pink express the explanatory variable, while shades of blue are used to express mean tornado exposure in the region. The signs drawn in a cell can be explained as a positive or negative contribution to the coefficient. For example, diagonal relationships should contribute as positive for high values of tornado exposure. That is, if the value of t_ami is high as well, it is expected that t_ami will have a positive correlation. This holds for the low values of t_ami and low values of mean tornado exposure. However, if the t_ami value is high when tornado exposure is low (as in the top left cell), the relation is expected to be negative. This inverse correlation is also evident for low values of t_ami when paired with high levels of mean tornado exposure, as depicted in the bottom-right cell. While inspecting variables, we referred to those relationships based on the cell color in Figure 9.
It should also be noted that, unlike global models, regression was performed for a sub-population which was chosen by bandwidth. The values near the observation points were weighted more, and this weight decreased by increasing distance. When inspecting the relationship, we used buffer zones to simulate the selection of subpopulation by using bandwidth. Therefore, for each variable explained, buffer zones are created based on the bandwidth values presented in Table 4.As seen in Table 4, bandwidths are 38.41 miles for the five variables inspected below.
As depicted in Figure 10, different trends across buffer zones are revealed by the examination of tornado exposure and t_ami. While zone 2 displays a negative coefficient for high tornado exposure and low t_ami, zone 1 exhibits a positive coefficient for both conditions. The buffer zone around Jefferson County had different types of neighbors. Some had a positive effect on the coefficient, while others weakened this effect (e.g., gray neighbors in the southeast and north), resulting in a mildly positive coefficient. A modestly positive coefficient with a variety of neighbor impacts is seen in buffer zone 4. In contrast to buffer zone 3’s low t_ami and high tornado exposure, buffer zone 5 exhibits a negative coefficient with low tornado exposure but high t_ami.
Referring to Figure 11, in buffers 1 and 2, the great majority of the CBGs have a high tornado exposure while having a very low residential exposure, leading to a negative coefficient. On the other hand, in buffer zones 3 and 4, close neighbors have a low density of tornado exposure and residential values (i.e., white neighbors), resulting in a positive coefficient as both values are low. We see that in buffer zones 5 and 6, there are both light blue and white neighbors. As a result, without further analysis, it is hard to judge the sign with bare eyes; however, for the rest, it is very easy to predict the sign. As seen in zone 7, the great majority of close neighbors are light blue, leading to a negative coefficient. In addition, in zones 8 and 9, most of the buffer zones are composed of white neighbors, representing a positive coefficient.
For some zones, we observe analogous patterns associated with reporting bias in the literature [19,20]. As illustrated in Figure 11, buffer zones 3, 4, and 6 exhibit lower residential densities in comparison to their neighboring CBGs. Intriguingly, these zones have less tornado densities than their neighbors. For instance, zone 3 has a low tornado exposure, while the surrounding areas have moderate tornado exposures (as illustrated in Figure 3). Notably, as one moves from the perimeter to the center, there is a gradual decrease in residential density. One can argue that this abruptly decreasing tornado activity may have occurred due to reporting bias, given that the zone has a lower residential density compared with the CBGs in the perimeter.
Figure 12 illustrates that buffer zones 1 and 2 exhibit low residential density and high tornado exposure, leading to an expected negative coefficient. However, some CBGs in the buffer zone have both high tornado exposure and intersection density, possibly influencing the coefficient positively, though they are distant from selected points. For zones 3, 4, and 5, the nearest neighbors are white, resulting in positive coefficients due to bi-square weighting. Zone 6, mainly with white neighbors, contributes to a positive coefficient for residential density. Zone 7 features a selected CBG surrounded by high tornado exposure and low intersection density, resulting in a negative coefficient.
In Figure 13, it is seen that only the northern part of Meade County turned out to have a significant coefficient for the percentage of elder people (people over 65). Although the neighbors of the selected CBG are occupied with neighbors having various colors, if the sign is elevated by the closest neighbors, the coefficient should be positive. This is since the neighbors have a moderate value both for tornado exposure and inspected explanatory value.
As Figure 14 reveals, in the first buffer zone, the observation point is occupied by pink and white neighbors, resulting in a mild positive relation. On the other hand, the second zone is surrounded by dark blue points, leading to a highly positive relation in Jefferson and neighboring counties. In the third zone, however, the relation cannot be judged because of the presence of different colors around the observation point. In the fourth zone, the majority of the CBGs are white neighbors, leading to a positive contribution to the median household income variable.
The findings of this study disclose the critical locations in areas that are under risk of disruption due to tornadoes, providing a better understanding of this risk to emergency officials. Officials can utilize this assessment to identify the most vulnerable areas, with a specific focus on the roadway disruptions. This might be obtained by establishing new emergency response facilities or better tornado shelters in these highly impacted areas. As a possible impact on developing state-wide and local development policies, the findings of this study can help delineate the areas and the communities in a state that are highly at risk of disruptions due to tornadoes. This type of analysis can help planners and emergency officials develop better strategies in identifying critical and less resilient regions and make accurate assessments for targeted locations. This information can be utilized to improve emergency response and development plans by identifying the critical roadway infrastructure, which can help provide efficient emergency routes to the public before a tornado hits.

5. Conclusions

In this study, tornado impacts on the community were assessed by examining the relationship between tornado exposure (dependent variable) and demographic, socioeconomic, and transportation characteristics (explanatory variables) in Kentucky. Tornado exposure for each CBG was calculated using kernel density estimate and zonal statistics. Thanks to applying MGWR, it can be seen how the relation between the associated variable and tornado exposure changed over the study area for each explanatory variable. In addition, tornado impact on the roadways was quantified to assess roadway infrastructure vulnerability. As such, this methodology could be used to develop more informed decisions and plans in order to mitigate the risk associated with exposure to future tornado events. The described methodology can be helpful to the authorities both from a community and infrastructure (e.g., roadway impact) perspective.
From a community perspective, MGWR analysis can help gather location-specific insights related to future risk mitigation by checking the coefficients of significant variables. For example, the regions that have high tornado activity and low values of median household income will be particularly vulnerable to tornadoes since they will not have enough financial power to prepare for disaster. This can be achieved by reinforcing their buildings before the disaster or recovering from the damage in the aftermath. Due to the same reason, it may be harder for them to obtain affordable insurance coverage. However, insurance plays a significant role in long-term recovery [49]. To solve all these problems, for these regions, incentives can be introduced to citizens, such as tax breaks or low-interest loans, so that people will be more encouraged to strengthen their properties against disaster. Moreover, community-based insurance schemes that provide affordable insurance can be facilitated. MGWR can be used to detect the regions where the relationship between median household and tornado exposure is significantly inverse (i.e., a negative value). Choosing the areas that have significantly negative relations is not enough, because the regions that have less tornado activity with high values of median household income are also highlighted in this case, even though these areas are less vulnerable. Therefore, as a second filtering, regions that have relatively less median household income should be selected as vulnerable areas.
From an infrastructure perspective, it is significant to improve the resilience of roadway networks to ensure quick recovery after disasters [50]. To improve this resilience, the first step is to predict possible problematic areas. The tornado impact assessment method we have suggested could be utilized to forecast regions where roadway closures might occur due to tornadoes. After a tornado hits a region, roadways may be disrupted by downed trees. The quantification procedure highlights the areas where there is a lot of high tornado activity and/or road network density, as both of those factors can be associated with a higher chance of roadway closure. For example, when there is a higher tornado occurrence in an area, it is more likely that roadways will be closed due to vegetation. Similarly, if an area has high network density, more roadways can be disrupted by the downed trees because a higher portion of the network will be exposed to vegetation. Therefore, vegetation might be monitored for the highlighted regions to minimize future road destruction in a tornado event. In this study, two methods are discussed to quantify roadway impact. Both methods can be employed in a region. However, the second method is more reasonable for use by the authorities as it pinpoints the region where there is high tornado activity and network density at the same time. This type of approach can also help develop sustainable hurricane debris handling plans and policies.
This study proposes a simple yet effective approach to identify vulnerable populations by considering spatial heterogeneities. Meanwhile, it enables to analyze the association of network density with tornado exposure. In future work, this analysis can be conducted with more detail using tornado damage data, if available. This study also has multiple limitations. Firstly, the spatial distribution of the explanatory variables over the study area changes abruptly either when there is no normalization in the data set or when GWR is used instead of MGWR. These sudden changes may result in unpredictable model behavior. Secondly, the quality of tornado reports before the 1980s should be questioned, due to several reasons. There were inconsistencies in counting tornadoes and assessing damage [51]. Because of different practices, nonstationary behavior has been observed in the data [52]. In addition, adverse effects due to population bias were more common, especially in rural areas [20,53]. Even though the majority of tornado data has been recorded after the 1980s (approximately 76%), filtering the pre-1980 dataset in a meaningful way would bring in more reliability and accuracy, which is an excellent direction for future work. Thirdly, while obtaining kernel densities, all tornadoes that occurred in the study area were considered. However, some studies only considered EF2+ tornadoes, as the milder ones had comparatively less impact over the disaster area. This filtering may be considered in future studies. In addition, no damage data related to tornadoes were used in this study. This dataset may be employed in the future, if available. The presented methodology can also be applied in other states prone to tornadoes, given the data availability.

Author Contributions

Conceptualization, M.B.K.; methodology, M.B.K., O.A., A.K. and E.E.O.; software, M.B.K.; validation, E.E.O., O.A. and A.K.; formal analysis, M.B.K., O.A. and A.K.; investigation, M.B.K. and O.A.; resources, M.B.K. and O.A.; data curation, M.B.K.; writing—original draft preparation, M.B.K.; writing—review and editing, O.A., A.K. and E.E.O.; visualization, M.B.K.; supervision, O.A., E.E.O. and A.K.; project administration, E.E.O.; funding acquisition, E.E.O. All authors have read and agreed to the published version of the manuscript.

Funding

This study was partially funded by the Natural Hazards Center grant named “Sheltering Behavior During the December 2021 Tornado in Mayfield, Kentucky”.

Institutional Review Board Statement

Not applicable.

Informed Consent Statement

Not applicable.

Data Availability Statement

Publicly available datasets were analyzed in this study. These data can be found using the following links: https://catalog.data.gov/dataset/tiger-line-shapefile-2019-series-information-for-the-current-block-group-state-based-shapefile (accessed on 7 May 2023), https://catalog.data.gov/dataset/smart-location-database1 (accessed on 22 May 2023), https://www.census.gov/programs-surveys/acs, https://htaindex.cnt.org/download/data.php (accessed on 9 June 2023).

Conflicts of Interest

One of the authors, Alican Karaer, was employed by the company Iteris Inc. The remaining authors declare that the research was conducted in the absence of any commercial or financial relationships that could be construed as a potential conflict of interest.

References

  1. Changnon, S.A. Tornado Losses in the United States. Nat. Hazards Rev. 2009, 10, 145–150. [Google Scholar] [CrossRef]
  2. Weather Related Fatality and Injury Statistics. Available online: https://www.weather.gov/hazstat/ (accessed on 28 July 2023).
  3. First, J.M.; Ellis, K.; Held, M.L.; Glass, F. Identifying Risk and Resilience Factors Impacting Mental Health among Black and Latinx Adults Following Nocturnal Tornadoes in the U.S. Southeast. Int. J. Environ. Res. Public Health 2021, 18, 8609. [Google Scholar] [CrossRef]
  4. Strader, S.M.; Ashley, W.S.; Pingel, T.J.; Krmenec, A.J. Projected 21st Century Changes in Tornado Exposure, Risk, and Disaster Potential. Clim. Chang. 2017, 141, 301–313. [Google Scholar] [CrossRef]
  5. Wang, C.; Rider, E.; Manning, S.; Fast, J.; Islam, T. Qualitative Analysis of the Lived Experience of Tornado Survivors and Factors Affecting Community Resilience: A Case Study of an EF3 Tornado in Jacksonville, Alabama. Weather Clim. Soc. 2023, 15, 133–144. [Google Scholar] [CrossRef]
  6. Trujillo-Falcón, J.E.; Gaviria Pabón, A.R.; Reedy, J.; Klockow-Mcclain, K.E. Systemic Vulnerabilities Created an Informal Warning System for U.S. Hispanic and Latinx Immigrants in the 2021 Quad-State Tornado Outbreak. Available online: https://eartharxiv.org/repository/object/4800/download/9556/ (accessed on 7 July 2023).
  7. Senkbeil, J.C.; Scott, D.A.; Guinazu-Walker, P.; Rockman, M.S. Ethnic and Racial Differences in Tornado Hazard Perception, Preparedness, and Shelter Lead Time in Tuscaloosa. Prof. Geogr. 2014, 66, 610–620. [Google Scholar] [CrossRef]
  8. Llorente-Marrón, M.; Díaz-Fernández, M.; Méndez-Rodríguez, P.; González Arias, R. Social Vulnerability, Gender and Disasters. The Case of Haiti in 2010. Sustainability 2020, 12, 3574. [Google Scholar] [CrossRef]
  9. Strader, S.M.; Ashley, W.S. Finescale Assessment of Mobile Home Tornado Vulnerability in the Central and Southeast United States. Weather Clim. Soc. 2018, 10, 797–812. [Google Scholar] [CrossRef]
  10. Strader, S.; Ash, K.; Wagner, E.; Sherrod, C. Mobile Home Resident Evacuation Vulnerability and Emergency Medical Service Access during Tornado Events in the Southeast United States. Int. J. Disaster Risk Reduct. 2019, 38, 101210. [Google Scholar] [CrossRef]
  11. Ulak, M.B.; Kocatepe, A.; Konila Sriram, L.M.; Ozguven, E.E.; Arghandeh, R. Assessment of the Hurricane-Induced Power Outages from a Demographic, Socioeconomic, and Transportation Perspective. Nat. Hazards 2018, 92, 1489–1508. [Google Scholar] [CrossRef]
  12. Karaer, A.; Ulak, M.B.; Abichou, T.; Arghandeh, R.; Ozguven, E.E. Post-Hurricane Vegetative Debris Assessment Using Spectral Indices Derived from Satellite Imagery. In Transportation Research Record; SAGE Publications Ltd.: Thousand Oaks, CA, USA, 2021; Volume 2675, pp. 504–523. [Google Scholar] [CrossRef]
  13. Dixon, R.W.; Moore, T.W. Tornado Vulnerability in Texas. Weather Clim. Soc. 2012, 4, 59–68. [Google Scholar] [CrossRef]
  14. Pielke, R.A., Jr.; Pielke, R.A., Sr. Hurricanes: Their Nature and Impact on Society; Wiley: Hoboken, NJ, USA, 1997. [Google Scholar]
  15. León-Cruz, J.F.; Castillo-Aja, R. A GIS-Based Approach for Tornado Risk Assessment in Mexico. Nat. Hazards 2022, 114, 1563–1583. [Google Scholar] [CrossRef]
  16. Blinn, M.C. Creation of a Spatial Decision Support System as a Risk Assessment Tool Based on Kentucky Tornado Climatology. Masters Theses Spec. Proj. 2012, 1153. Available online: http://digitalcommons.wku.edu/theses/1153 (accessed on 2 July 2023).
  17. Hwang, S.N.; Meier, K. Tornado Impacts in the US from 1950-2015: A GIS-Based Analysis of Vulnerability and Evolving Risk Zones for Human Casualties. J. Geogr. Inf. Syst. 2023, 15, 563–579. [Google Scholar] [CrossRef]
  18. Schaefer, J.T.; Galway, J.G. Population Biases in the Tornado Climatology; American Meteorological Society: San Antonio, TX, USA, 1982; pp. 51–54. [Google Scholar]
  19. Potvin, C.K.; Broyles, C.; Skinner, P.S.; Brooks, H.E.; Rasmussen, E. A Bayesian Hierarchical Modeling Framework for Correcting Reporting Bias in the U.S. Tornado Database. Weather Forecast 2019, 34, 15–30. [Google Scholar] [CrossRef]
  20. Elsner, J.B.; Michaels, L.E.; Scheitlin, K.N.; Elsner, I.J. The Decreasing Population Bias in Tornado Reports across the Central Plains. Weather Clim. Soc. 2013, 5, 221–232. [Google Scholar] [CrossRef]
  21. Wang, C.; Du, S.; Wen, J.; Zhang, M.; Gu, H.; Shi, Y.; Xu, H. Analyzing Explanatory Factors of Urban Pluvial Floods in Shanghai Using Geographically Weighted Regression. Stoch. Environ. Res. Risk Assess. 2017, 31, 1777–1790. [Google Scholar] [CrossRef]
  22. Chun, H.; Chi, S.; Hwang, B.G. A Spatial Disaster Assessment Model of Social Resilience Based on Geographically Weighted Regression. Sustainability 2017, 9, 2222. [Google Scholar] [CrossRef]
  23. Anselin, L. Exploratory Spatial Data Analysis and Geographic Information Systems. N. Tools Spat. Anal. 1994, 17, 45–54. [Google Scholar]
  24. Fotheringham, A.S.; Yang, W.; Kang, W. Multiscale Geographically Weighted Regression (MGWR). Ann. Am. Assoc. Geogr. 2017, 107, 1247–1265. [Google Scholar] [CrossRef]
  25. Abkowitz, M.; Jones, A.; Dundon, L.; Camp, J. Performing A Regional Transportation Asset Extreme Weather Vulnerability Assessment. In Transportation Research Procedia; Elsevier B.V.: Amsterdam, The Netherlands, 2017; Volume 25, pp. 4422–4437. [Google Scholar] [CrossRef]
  26. Blandford, B.L.; Schurman, S.; Wallace, C.Y.; McCormack, S.M. Transportation System Vulnerability and Resilience to Extreme Weather Events and Other Natural Hazards Report for Pilot Project-KYTC District 1. Ky. Transp. Cent. Res. Rep. 2016, 1554. [Google Scholar] [CrossRef]
  27. Simpson, D.M.; Human, J.R. Large-Scale Vulnerability Assessments for Natural Hazards. Nat. Hazards 2008, 47, 143–155. [Google Scholar] [CrossRef]
  28. Gensini, V.A.; Brooks, H.E. Spatial Trends in United States Tornado Frequency. NPJ Clim. Atmos. Sci. 2018, 1, 38. [Google Scholar] [CrossRef]
  29. Poorest States in the US 2023—Wisevoter. Available online: https://wisevoter.com/state-rankings/poorest-states/ (accessed on 28 July 2023).
  30. Appalachian Regional Commission. County Economic Status in Appalachia, Fiscal Year 2022. Available online: https://www.arc.gov/map/county-economic-status-in-appalachia-fy-2022/ (accessed on 11 July 2023).
  31. Masoomi, H.; van de Lindt, J.W. Fatality and Injury Prediction Model for Tornadoes. Nat. Hazards Rev. 2018, 19, 04018009. [Google Scholar] [CrossRef]
  32. Fricker, T. Tornado-Level Estimates of Socioeconomic and Demographic Variables. Nat. Hazards Rev. 2020, 21, 04020018. [Google Scholar] [CrossRef]
  33. Ashley, W.S. Spatial and Temporal Analysis of Tornado Fatalities in the United States: 1880–2005. Weather Forecast 2007, 22, 1214–1228. [Google Scholar] [CrossRef]
  34. Simmons, K.M.; Sutter, D. Tornado Warnings, Lead Times, and Tornado Casualties: An Empirical Investigation. Weather Forecast 2008, 23, 246–258. [Google Scholar] [CrossRef]
  35. Lim, J.; Loveridge, S.; Shupp, R.; Skidmore, M. Double Danger in the Double Wide: Dimensions of Poverty, Housing Quality and Tornado Impacts. Reg. Sci. Urban. Econ. 2017, 65, 1–15. [Google Scholar] [CrossRef]
  36. Chapman, J.; Bachman, W.; Frank, L.D.; Thomas, J.; Reyes, A.R. Smart Location Database Technical Documentation and User Guide; US Environmental Protection Agency: Washington, DC, USA, 2021.
  37. H + T Index. Methods. 2022. Available online: https://htaindex.cnt.org/about/method-2022.pdf (accessed on 9 June 2023).
  38. Dixon, P.G.; Mercer, A.E.; Choi, J.; Allen, J.S. Tornado Risk Analysis: Is Dixie Alley an Extension of Tornado Alley. Bull. Am. Meteorol. Soc. 2011, 92, 433–441. [Google Scholar] [CrossRef]
  39. Marsh, P.T.; Brooks, H.E. Comments on “Tornado Risk Analysis: Is Dixie Alley an Extension of Tornado Alley?”. Bull. Am. Meteorol. Soc. 2012, 93, 405–407. [Google Scholar] [CrossRef]
  40. Smith, B.T.; Thompson, R.L.; Grams, J.S.; Broyles, C.; Brooks, H.E. Convective Modes for Significant Severe Thunderstorms in the Contiguous United States. Part I: Storm Classification and Climatology. Weather Forecast 2012, 27, 1114–1135. [Google Scholar] [CrossRef]
  41. Wheeler, D.; Tiefelsdorf, M. Multicollinearity and Correlation among Local Regression Coefficients in Geographically Weighted Regression. J. Geogr. Syst. 2005, 7, 161–187. [Google Scholar] [CrossRef]
  42. Brunsdon, C.; Fotheringham, A.S.; Charlton, M.E. Geographically Weighted Regression: A Method for Exploring Spatial Nonstationarity. Geogr. Anal. 1996, 28, 281–298. [Google Scholar] [CrossRef]
  43. Fotheringham, A.; Brunsdon, C.; Charlton, M. Geographically Weighted Regression: The Analysis of Spatially Varying Relationships; John Wiley: Hoboken, NJ, USA, 2002; Available online: https://www.researchgate.net/publication/27246972 (accessed on 14 January 2024).
  44. Oshan, T.M.; Li, Z.; Kang, W.; Wolf, L.J.; Stewart Fotheringham, A. MGWR: A Python Implementation of Multiscale Geographically Weighted Regression for Investigating Process Spatial Heterogeneity and Scale. ISPRS Int. J. Geoinf. 2019, 8, 269. [Google Scholar] [CrossRef]
  45. Multiscale Geographically Weighted Regression (MGWR) (Spatial Statistics)—ArcGIS Pro|Documentation. Available online: https://pro.arcgis.com/en/pro-app/latest/tool-reference/spatial-statistics/multiscale-geographically-weighted-regression.htm (accessed on 21 July 2023).
  46. Akaike, H. A New Look at the Statistical Model Identification. IEEE Trans. Autom. Control 1974, 19, 716–723. [Google Scholar] [CrossRef]
  47. da Silva, A.R.; Fotheringham, A.S. The Multiple Testing Issue in Geographically Weighted Regression. Geogr. Anal. 2016, 48, 233–247. [Google Scholar] [CrossRef]
  48. Lin, C.-H.; Wen, T.-H. Using Geographically Weighted Regression (GWR) to Explore Spatial Varying Relationships of Immature Mosquitoes and Human Densities with the Incidence of Dengue. Int. J. Environ. Res. Public Health 2011, 8, 2798–2815. [Google Scholar] [CrossRef]
  49. Hofmann, S.Z. Build Back Better and Long-Term Housing Recovery: Assessing Community Housing Resilience and the Role of Insurance Post Disaster. Sustainability 2022, 14, 5623. [Google Scholar] [CrossRef]
  50. El-Maissi, A.M.; Argyroudis, S.A.; Nazri, F.M. Seismic Vulnerability Assessment Methodologies for Roadway Assets and Networks: A State-of-the-Art Review. Sustainability 2020, 13, 61. [Google Scholar] [CrossRef]
  51. Agee, E.; Childs, S. Adjustments in Tornado Counts, F-Scale Intensity, and Path Width for Assessing Significant Tornado Destruction. J. Appl. Meteorol. Climatol. 2014, 53, 1494–1505. [Google Scholar] [CrossRef]
  52. Tippett, M.K. Changing Volatility of U.S. Annual Tornado Reports. Geophys. Res. Lett. 2014, 41, 6956–6961. [Google Scholar] [CrossRef]
  53. Anderson, C.J.; Wikle, C.K.; Zhou, Q.; Royle, J.A. Population Influences on Tornado Reports in the United States. Weather Forecast 2007, 22, 571–579. [Google Scholar] [CrossRef]
Figure 1. Kentucky counties with state location map.
Sustainability 16 01180 g001
Figure 2. Steps of the proposed methodology.
Sustainability 16 01180 g002
Figure 3. Kentucky tornado exposure map between 1950 and 2022.
Sustainability 16 01180 g003
Figure 4. Risk zone classes of tornado day occurrences within Kentucky between 1950 and 2010 (Blinn, 2012) [16].
Sustainability 16 01180 g004
Figure 5. Kentucky roadway tornado exposure map using the first method.
Sustainability 16 01180 g005
Figure 6. Kentucky roadway tornado exposure map using the second method.
Sustainability 16 01180 g006
Figure 7. Comparison of condition numbers: (a) GWR and (b) MGWR.
Sustainability 16 01180 g007
Figure 8. Distribution of coefficients over Kentucky: (a) intercept, Ac_land, P_WrkAge, and R_PCTLOWWA (percent of low wage workers); (b) D2A_JPHH (jobs per household), SLC_score, vacant_hou, and no_veh_hhs (no vehicle households); (c) median_household_income, ht_ami, t_ami, and residential density; (d) intersection density, P_65, P_5, and P_18.
Sustainability 16 01180 g008aSustainability 16 01180 g008b
Figure 9. Bivariate relationship between tornado exposure and the selected variable.
Sustainability 16 01180 g009
Figure 10. Spatial analysis of t_ami variable: (a) bivariate coloring of t_ami and mean tornado exposure and(b) distribution of significant t_ami coefficients (Numbers in the circles represent the buffers).
Sustainability 16 01180 g010
Figure 11. Spatial analysis of residential density variable: (a) bivariate coloring of residential density and mean tornado exposure and (b) distribution of significant residential density coefficients (Numbers in the circles represent buffers).
Sustainability 16 01180 g011
Figure 12. Spatial analysis of intersection density variable: (a) bivariate coloring of intersection density and mean tornado exposure and (b) distribution of significant intersection density coefficients (Numbers in the circles represent buffers).
Sustainability 16 01180 g012
Figure 13. Spatial analysis of P_65 variable: (a) bivariate coloring of P_65 and mean tornado exposure and (b) distribution of significant P_65 coefficients.
Sustainability 16 01180 g013
Figure 14. Spatial analysis of median household income variable: (a) bivariate coloring of median household income and mean tornado exposure and (b) distribution of significant median household income coefficients (Numbers in circles represent buffers).
Sustainability 16 01180 g014
Table 1. Variables and their explanations.
TIGER and American Community Surveys (ACS) Dataset
VariableExplanation
Occupied Housing UnitNumber of housing units that are occupied
Vacant Housing UnitNumber of housing units that are vacant
No vehicle householdNumber of households that have no access to any vehicle
Median household incomeMedian household income in the past 12 months (2019)
Nonwhite popNonwhite population in given CBG
White popWhite population in given CBG
Under 5Population of people who are under the age of five
Under 18Population of people who are under the age of eighteen
Pop 65+Population of people who are 65 and over
Total popTotal population in given CBG
Smart Location Database (SLD)
VariableExplanation
SLC ScoreSmart location score
P_WrkAgePercent of population that is working aged 18 to 64
D2a_JpHHJobs per household
D3aTotal road network density
R_PCTLOWWA(2017)Percent of low-wage workers in CBG
Ac_totalTotal geometric area (acres) of the CBG
Housing and Transportation Affordability (H+T) Index
VariableExplanation
ht_amiHousing + transportation costs % income for the regional typical household
t_amiTransportation costs % income for the regional typical household
autos_per_hh_amiAutos per household for the regional typical household
vmt_per_hh_amiAnnual vehicle miles traveled per household for the regional typical household
compact_ndxCompact neighborhood score (0–10)
res_densityResidential density (households per residential acre)
intersection_densityIntersection density in square miles
Table 2. Obtained VIF values.
Variable NameExplanationVIF_beforeVIF_after
Ac_totalTotal geometric area (acres) of the CBG2.631.92
P_WrkAGEPercent of population that is working aged 18 to 64 years2.732.62
R_PCTLOWWAPercent of low-wage workers in CBG1.941.56
D2a_JpHHJobs per household1.111.04
D3aTotal road network density11.58-
SLC ScoreSLC Score2.712.23
occ_houNumber of occupied housing units10.73-
vacant_houNumber of vacant housing units1.221.16
no_veh_hhsNo vehicle household 1.981.61
median_household_incomeMedian household income3.322.31
total_popTotal population11.1-
ht_amiHousing+ transportation costs % income for the regional typical household5.164.71
t_amiTransportation costs % income for the regional typical household8.726.71
autos_per_hhAutos per household14.25-
vmt_per_hhAnnual vehicle miles traveled per household18.71-
compact_ndCompactness index 11.01-
res_densityResidential density1.751.72
intersection_densityIntersection density6.752.42
P_65Percentage of people who are older than 653.32.69
P_5Percentage of people who are younger than 51.491.47
P_18Percentage of people who are younger than 183.163.05
P_nwhitePercentage of nonwhite population>1000-
P_whitePercentage of white population>1000-
Table 3. (A) Summary statistics for coefficient estimates and (B) model diagnostic.
Explanatory VariablesExplanationMeanStandard DeviationMinMedianMax
AIntercept-−0.0620.779−1.565−0.1111.992
Ac_totalTotal geometric area (acres) of the CBG0.0120.071−0.2280.0160.250
P_WrkAgePercent of population that is working aged 18 to 64 years0.0070.034−0.2460.0120.181
R_PCTLOWWAPercent of low-wage workers in CBG0.0180.047−0.2840.0210.160
D2a_JpHHJobs per household0.0010.002−0.0010.0010.028
SLC ScoreSLC score0.0350.077−0.2360.0340.211
vacant_houNumber of vacant housing units−0.0140.041−0.227−0.0050.089
no_veh_hhsNo vehicle household−0.0100.019−0.023−0.0180.071
median_household_incomeMedian household income0.0670.109−0.1330.0360.319
ht_amiHousing+ transportation costs % income for the regional typical household0.0490.098−0.2780.0700.372
t_amiTransportation costs % income for the regional typical household−0.1880.333−0.920−0.1310.474
res_densityResidential density0.0020.116−0.4430.0080.445
intersection_densityIntersection density0.0050.063−0.363−0.0200.380
P_65Percentage of people who are older than 650.0090.029−0.0870.0110.115
P_5Percentage of people who are younger than 5−0.0040.025−0.141−0.0030.152
P_18Percentage of people who are younger than 18−0.0070.004−0.029−0.006−0.003
BStatisticGWRMGWR
R-Squared0.9260.936
Adjusted
R-Squared
0.9110.929
AICc1668.870927.527
Sigma-Squared0.0890.071
Sigma-Squared MLE0.0740.064
Effective Degrees of Freedom2637.0602855.330
Table 4. Summary of MGWR explanatory variables, neighborhoods, and bandwidth.
Explanatory VariablesExplanationBandwidth (% of Extent)Significance (% of Features)Effective Number of ParametersAdjusted Value of AlphaAdjusted Critical Value of Pseudo-t Statistics
Intercept-38.41 (8.75)2446 (77.80)19.420.00263.0172
Ac_totalTotal geometric area (acres) of the CBG38.41 (8.75)357 (11.35)23.930.00213.0801
P_WrkAgePercent of population that is working aged 18 to 64 years38.41 (8.75)59 (1.88)25.410.00203.0979
R_PCTLOWWAPercent of low-wage workers in CBG38.41(8.75)309 (9.83)24.20.00213.0833
D2a_JpHHJobs per household285.97 (65.15)0 (0.00)1.020.04901.9698
SLC ScoreSLC score38.41 (8.75)818 (26.02)21.470.00233.0475
vacant_houNumber of vacant housing units38.41 (8.75)319 (10.15)24.030.00213.0813
no_veh_hhsNo vehicle household141.50 (32.23)797 (25.35)2.580.01942.3392
median_household_incomeMedian household income38.41 (8.75)1030 (32.76)22.030.00233.0553
ht_amiHousing + transportation costs % income for the regional typical household38.41 (8.75)1062 (33.78)21.100.00243.0423
t_amiTransportation costs % income for the regional typical household38.41 (8.75)2025 (64.41)16.580.00302.9688
res_densityResidential density38.41 (8.75)289 (9.19)15.30.00332.9439
intersection_densityIntersection density38.41 (8.75)110 (3.50)18.440.00273.0013
P_65Percentage of people who are older than 6538.41 (8.75)2 (0.06)25.190.00203.0954
P_5Percentage of people who are younger than 538.41 (8.75)32 (1.02)26.520.00193.1106
P_18Percentage of people who are younger than 18213.73 (48.69)1 (0.03)1.430.03512.1086
Disclaimer/Publisher’s Note: The statements, opinions and data contained in all publications are solely those of the individual author(s) and contributor(s) and not of MDPI and/or the editor(s). MDPI and/or the editor(s) disclaim responsibility for any injury to people or property resulting from any ideas, methods, instructions or products referred to in the content.

