Article

Investigation of Perception Differences in Shared Mobility between Driver’s License Holders and Nonholders: A Case Study of Seoul, Gyeonggi, and Incheon in South Korea

1
Department of Architecture and Urban Planning, Qatar University, Doha P.O. Box 2713, Qatar
2
Department of Global Smart City, Sungkyunkwan University, Suwon 16419, Republic of Korea
3
School of Civil and Environmental Engineering, Kookmin University, Seoul 02707, Republic of Korea
*
Author to whom correspondence should be addressed.
Sustainability 2024, 16(16), 7225; https://doi.org/10.3390/su16167225
Submission received: 23 July 2024 / Revised: 14 August 2024 / Accepted: 20 August 2024 / Published: 22 August 2024
(This article belongs to the Section Sustainable Urban and Rural Development)

Abstract

:
Shared mobility (SM) services are transitioning from the introduction stage to the growth stage, driven by the growth of the sharing economy, the promotion of smart cities, the diverse personal transportation modes, and the development of autonomous driving technologies. SM services, such as car sharing, car-hailing, shared bikes, and e-scooters, have emerged as solutions to address issues related to carbon neutrality and traffic congestion in densely populated areas. The purpose of this study is to investigate potential disparities in user perception and satisfaction among groups with or without driving experience when using SM services—through hypothesis testing using the two-proportion Z-test. Subsequently, a satisfaction analysis is conducted. This research creates foundational data for future SM services. The survey targeted 1041 residents living in Seoul, Gyeonggi Province, and Incheon, and was conducted over two weeks in March 2020. This study aims to derive associations between two groups using SM—those with and without driving experience. The results indicate that car sharing and bike sharing showed significant differences in user patterns based on driving experience, whereas e-scooters and car-hailing did not exhibit significant differences. This contradicts the assumption that people without a driver’s license would use SM more frequently. Moreover, the results of each SM’s analysis show different usage patterns and satisfaction between driver’s license holders and nonholders. This study will serve as foundational data for researching strategies to reduce personal car ownership through the promotion of public transportation and SM services. Furthermore, it can be a basis for suggesting policy recommendations to facilitate future mobility systems.

1. Introduction

Technological advancements have triggered a significant transformation in our urban mobility, travel routines, and overall way of life. The deployment of electric vehicles, the emergence of smart mobility (shared mobility (SM), urban air mobility (UAM), autonomous vehicles (AVs), etc.), and mobility as a service (MaaS) suggest services through a comprehensive platform integrating shared transportation.
SM, as a part of the smart mobility system, encompasses new on-demand transportation services accessible via mobile apps without intermediaries and has significantly advanced by optimizing time, cost, and environmental impact [1,2,3]. The adoption of SM services has been accelerated by MaaS, an integrated service that guides existing transportation and SM for routes from departure to arrival [4]. Real-time scheduling, route optimization, digital tracking, and cashless travel with GPS tracking [5,6] further promote the activation of SM services.
By reducing the need for vehicle ownership by citizens, SM has the potential to alleviate worsening traffic congestion in urban areas, thereby reducing noise pollution, curbing carbon dioxide (CO2) emissions [7,8], and diminishing reliance on fossil fuel-powered vehicles in densely populated urban areas [9]. Faced with significant societal issues, it is worth contemplating whether adopting SM can help reduce the number of individual car users and whether further car users will opt for SM and public transportation over personal car ownership [10,11,12]. From the user’s perspective, it is essential to reassess the necessity and impact in terms of enhancing pedestrian convenience and minimizing the reliance on short-distance personal vehicle usage [2,4]. Additionally, understanding how driving experience influences the adoption and utilization of shared mobility services is crucial for tailoring effective policies and strategies. Thus, this study aims to explore how driving experience affects shared mobility use and satisfaction.
Typical SM modalities can be classified into two categories—car sharing and car-hailing—which offer viable alternatives to private vehicle usage, particularly for long-distance travel. On the other hand, personal mobility (PM) solutions, such as electric shared scooters (e-scooter sharing) and electric bicycle sharing, represent prominent options for short-distance travel solutions.
Car sharing is a transport model that allows individuals to use nearby vehicles as needed, without the commitment of ownership, even for short periods.
According to Martinez’s analysis of vehicle miles traveled (VMT) [3], car-sharing members drive less after joining car-sharing programs, reducing CO2 emissions by 240 to 390 kg per person per year. This reduction is consistent with a study in the Netherlands, where car-sharing users account for only 13%–18% of the CO2 emissions compared to private vehicle owners [13,14].
Car-hailing service platforms facilitate the prediction of trip demand and scheduling, allowing users to book transportation from any geographic location [15]. Zhong noted that private vehicle owners in China are increasingly interested in car-hailing as it offers a viable alternative to traditional car use, helping them to avoid the difficulties of driving and parking in congested areas [14,16,17]. This trend reflects a shift toward using car-hailing services to save costs related to parking, fuel, and vehicle maintenance [18,19].
Personal Mobility (PM) services, exemplified by shared bicycles and electric scooters, represent a significant segment of contemporary transportation innovations [18]. e-PMVs, including shared bicycles (bikes) and e-scooters, offer the advantage of faster movement compared to driving in congested urban areas with travel speeds ranging from 20 to 60 km/h [20,21,22,23]. McKenzie reported that e-scooters, ideal for short trips of 0.8 to 3.2 km, could replace approximately 1% of taxi trips in U.S. urban areas [14,24]. Market analysis indicates that the global e-PMV market, which includes shared bikes, e-scooters, walking aids, and similar devices, is projected to grow annually at a rate of 7.0% until at least 2024, highlighting its significant potential [25,26]. However, this growth faces challenges, as evidenced by Paris becoming the first city in the world to ban e-scooters in September 2023 due to safety concerns [27]. e-PMVs can pose risks by occupying spaces designated for other forms of mobility, such as sidewalks and bicycle lanes, thus increasing hazards for both pedestrians and cyclists. In response, various countries are considering regulatory legislation for electric personal mobility vehicles, which could potentially delay the growth of e-PMVs [28,29].
This growing importance of SM has spurred a range of scholarly research into its various aspects. Researchers are examining factors influencing SM, such as different user perspectives, infrastructure system considerations [23,30,31,32,33], user demand analyses, and policy approaches [23,30,31,34,35]. Notably, studies have focused on mobility users’ patterns and sociodemographic variables, including how these factors influence usage frequency and willingness to engage with SM. For example, research conducted in four major metropolitan cities—London, Paris, Madrid, and Tokyo—and comprising 2733 car owners using SM showed that people living in cities, the younger generation, and men use SM more than others [36]. In this context, Ko [29] used correlation and multicollinearity analysis to find hidden relationships among measures of intention to use SM and found that sociodemographic characteristics, gender, possession of a car, and education significantly influence future intention to use SM. Furthermore, Ho [37] emphasized that there is a significant need for data from the user’s perspective to develop effective techniques for analyzing SM user satisfaction and intentions, addressing a gap identified in the existing research. According to the Seoul Institute’s report in Korea [4,20], each SM service needs to measure key parameters related to user patterns to predict the future of SM under a well-established transportation infrastructure.
There is a growing body of research on the relationship between SM and possession of a driver’s license. Machado’s research [2,38] suggests that individuals without a driver’s license are more likely to use shared mobility (SM) services. However, other scholars have found no significant differences in usage patterns between those with and without driver’s licenses [8]. Several studies also indicate that individuals living in areas with available SM services are less likely to possess a driver’s license than those residing in regions with limited SM options [3,8]. To address the research gap highlighted by previous studies that identified a significant relationship between personal car ownership and the use of shared mobility (SM), we tested the hypothesis that the experience of driving influences SM use (car sharing, car-hailing, bike sharing, and e-scooters). In this current study, we classified participants into two groups based on driving experience: those with and without a driver’s license. To define driving experience, having a driver’s license is a prerequisite that enables current and future private car ownership; this study aims to explore the significance and satisfaction of SM use among license holders and nonholders. Specifically, we comprehensively analyzed the usage patterns, awareness and experience, and satisfaction of driver’s license holders and nonholders. Additionally, we investigated the extent of the significance of usage patterns for driver’s license holders and nonholders.
This study offers empirical survey data from Seoul and its surrounding areas, including Gyeonggi Province and Incheon in Korea, analyzing the differing SM usage patterns among individuals with and without driving experience. These regions, known for the high transition of populations, boast highly developed public transportation networks, seamlessly integrating buses and metro systems with SM options, particularly around metro stations [39].
We build on an initial survey analysis, delving deeper into various aspects of SM use. First, it explores the characteristics of SM users in metropolitan areas, identifying individual users’ daily mobility choices based on gender and age. Secondly, this research investigates the relationship between awareness and experience of SM. Thirdly, a proportional Z-test and logistic regression analysis are applied for both SM users and the overall user group to test the hypothesis regarding the impact of a driver’s license on the use of SM services. Then, specifically, the study assesses satisfaction levels with SM services between the two distinct groups based on their car driving experience. Finally, the significance of satisfaction between driver’s license holders and nonholders with SM was investigated.

2. Data Description

2.1. Classification of SM Services Based on Their Purpose

In this study, we examine the use of SM services, elucidate the motivations behind their use, and investigate satisfaction differences between users with and without driving experience. It is essential to distinguish between the usage patterns of various SM types (refer to Table 1). Shared cars, appropriate for longer distances, fall into two categories: car-sharing and car-hailing services (such as taxis and Uber), both of which are accessible via online applications. By contrast, PM options such as bike sharing and scooter sharing (e-scooters) are more suited for shorter distances, providing convenient alternatives for short commutes.

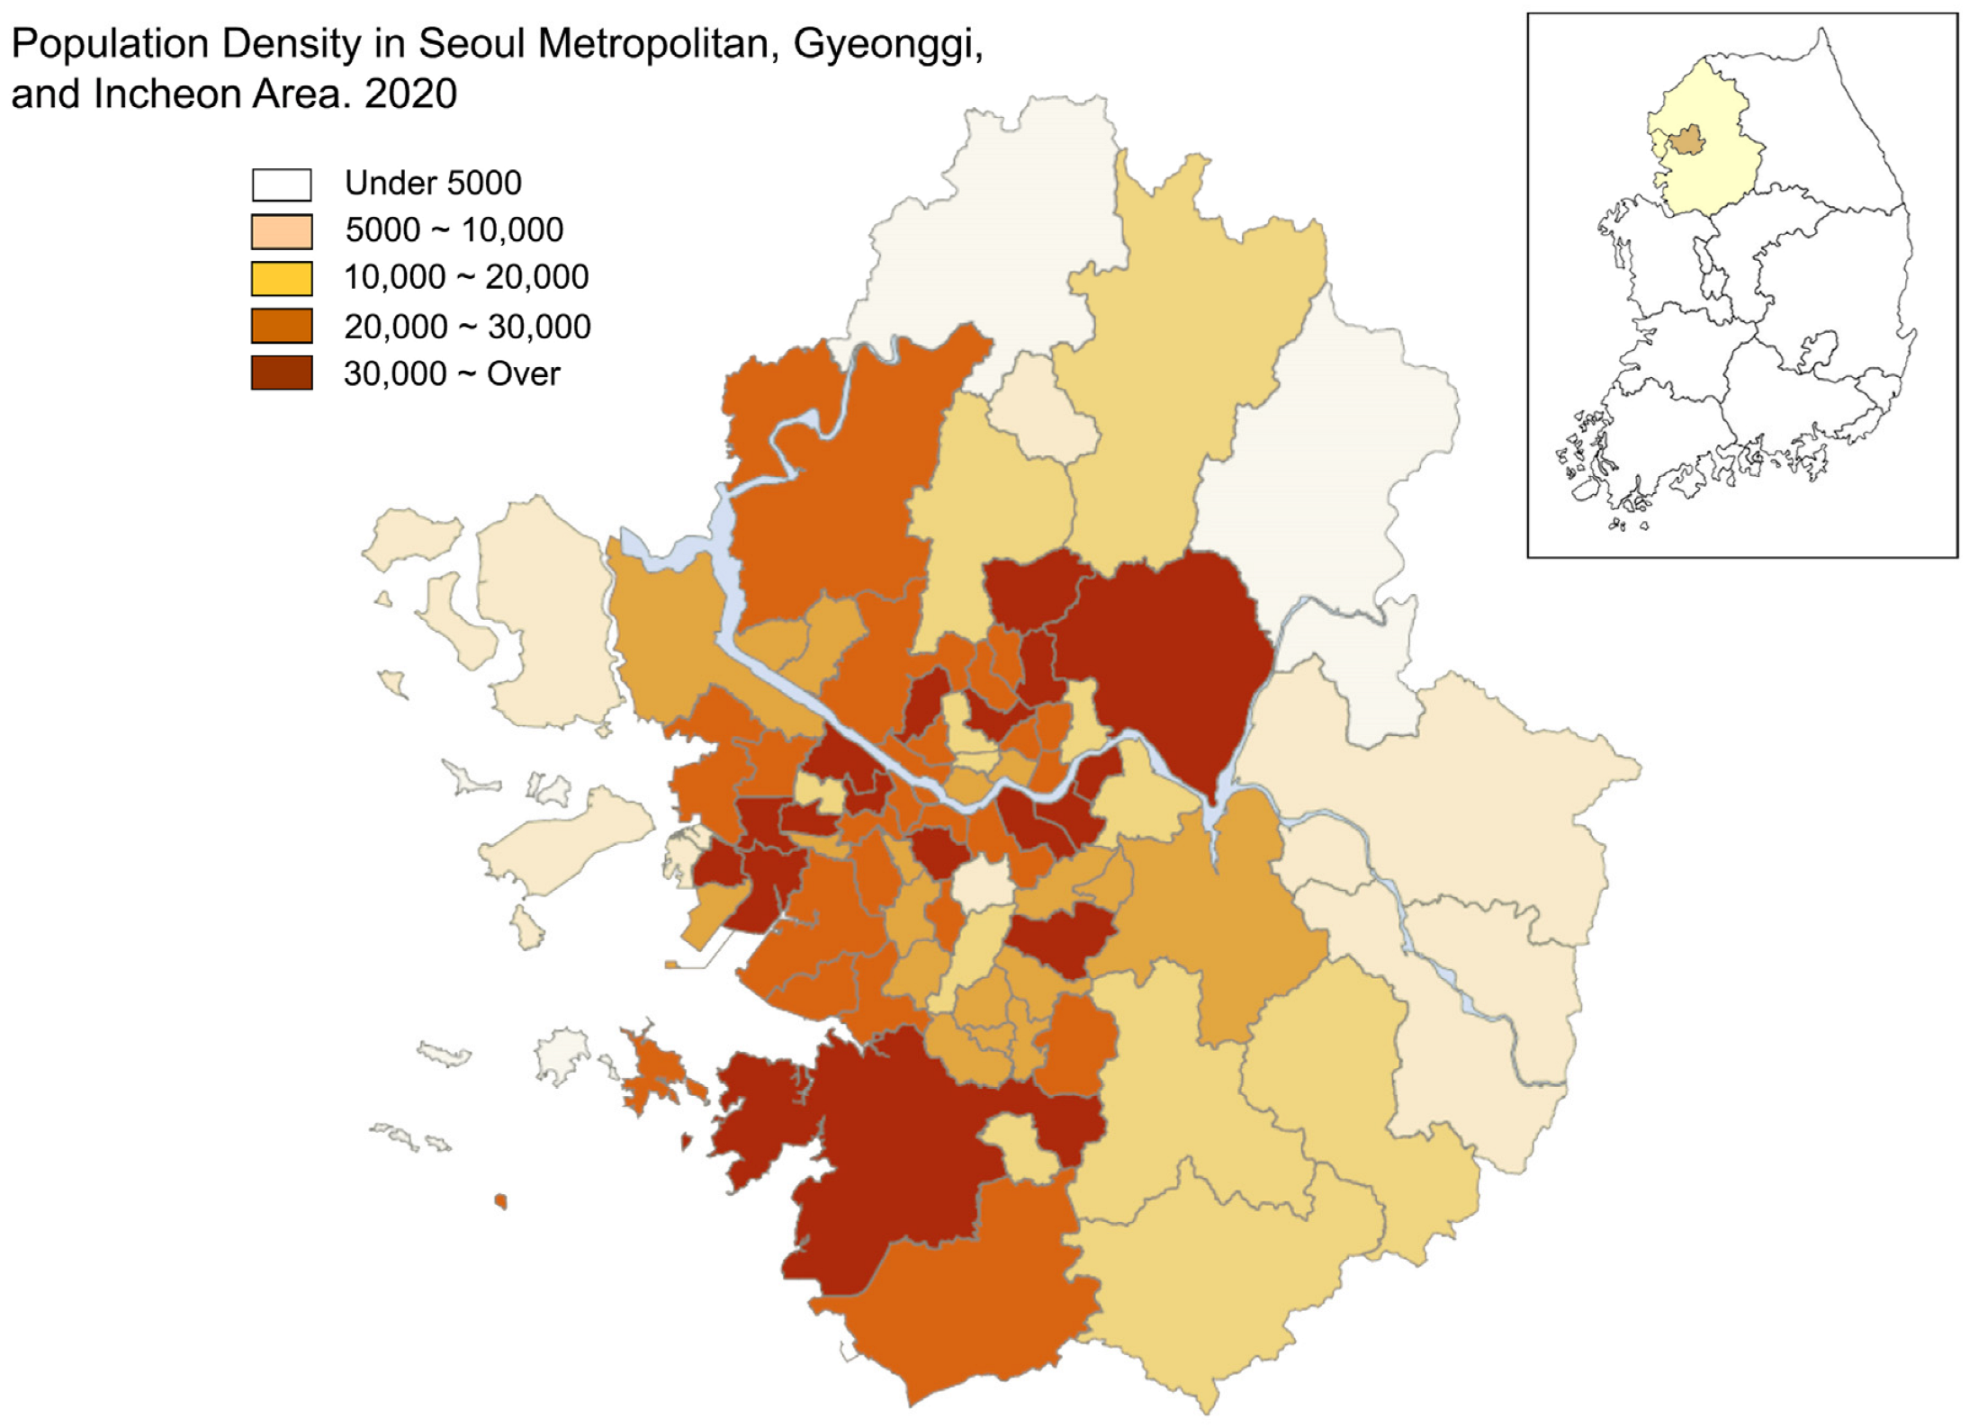
2.2. Survey Overview and Site Introduction

This research covers Seoul and its neighboring regions (Figure 1). This metropolitan area, centered around Seoul, is home to 40% of South Korea’s population. Gyeonggi Province, which comprises 31 local districts and an area of 10,171 km2, serves as an extension of Seoul. In 2023, its population was approximately 13.6 million [40]. Incheon, a major port city west of Seoul bordering the West Sea, has a population of approximately 6.14 million over 1067 km2 [39]. The region benefits from an extensive public transportation network, including metro and bus lines, facilitating efficient commuting within Seoul, between Seoul and Gyeonggi, and throughout Gyeonggi Province. The transport infrastructure in Gyeonggi Province has been extensively developed to support the large population, ensuring strong connections between the subway and wide-area buses.
This study utilized user attitudes toward SM using secondary data from the “Mobility Trend Report Survey” by Open Survey Co., Ltd. (Seoul, Republic of Korea), conducted on 2 March 2020. The original survey aimed to analyze mobility trends in light of the emergence of new shared mobility options. However, for the purposes of this study, the data have been reanalyzed to address specific research objectives to investigate how driving experience affects user attitudes toward SM. Given that Seoul, Gyeonggi, and Incheon are regions with well-developed transportation infrastructure and high utilization of SM services, 1041 individuals from the Seoul metropolitan area and its vicinity were selected from the initial pool of 2000 respondents (nationwide) based on their relevance to the study.
The original survey was structured into four sections. The first section collected the socio-demographic characteristics of respondents, including age, gender, and residential area. The second section included questions about the primary modes of transportation used by respondents, as well as their awareness and experience with SM services. The third section provided a brief explanation of the concept of shared mobility, as illustrated in Table 1, and asked respondents about their recent awareness, experience, and satisfaction with these services. Finally, the survey included questions about the ownership status of a driver’s license. These data provide a crucial foundation for evaluating driving experience, as holding a driver’s license often signifies prior driving experience. Among the existing survey items, this aspect was considered an important criterion.

2.3. Sample Characteristics

In March 2020, the survey response rates were 37.8% for Seoul Metropolitan City, 51.5% for Gyeonggi Province, and 10.8% for Incheon City. The gender distribution among respondents was balanced, with 51.1% male and 48.9% female. Age-wise, the representation was evenly spread: 22.6% in their 20s, 23.9% in their 30s, 27% in their 40s, and 26.5% in their 50s (refer to Table 2). Respondents’ occupations varied, including college/graduate students, office workers, self-employed individuals, and housewives.
In order to investigate whether possession of a driver’s license influences the use of SM, this study examined the proportion of license holders and nonholders. According to Korean National Police Agency records [41] from 2020, there were 26,161,812 driver’s license holders between the ages of 20 and 59. According to the Ministry of the Interior and Safety of Korea’s database [42], the population of South Korea in the same age group was 29,390,867. This indicates that 89% of the population in this age group holds a driver’s license, while 11% do not. Our nationwide data collection (Table 3) also revealed similar ratios, with 89% being license holders and 11% nonholders. In the Seoul, Gyeonggi, and Incheon regions, the ratios were 88% and 12%, respectively. This suggests that our study accurately reflects the driver’s license possession rates in these regions, thereby ensuring regional representativeness in our research findings. Consequently, this allowed for a more precise analysis of SM usage patterns based on driver’s license possession.
Analyzing transport usage trends, particularly age and gender patterns among private car users and public transportation users, is crucial in this research (refer to Table 4). SM is closely linked to pedestrian-friendly transportation modes, making the usage rates of public transportation (bus, metro, and taxi) and walking significant. The respondents of the survey could make multiple selections, and the rates are the proportions relative to the total number of respondents. The data reveal a high overall usage rate for public transportation, including buses and subways, surpassing that of privately owned cars. The ratio of men to women shows slight differences, suggesting that social aspects may have been considered. The data define private vehicle users in Table 4 exclusively as those using fossil-fuel vehicles and do not include electronic vehicles. Furthermore, electronic vehicles in this context specifically refer to shared bikes and e-scooters. Men use e-PMVs more frequently than women, and the usage rates for both genders decrease as age increases.

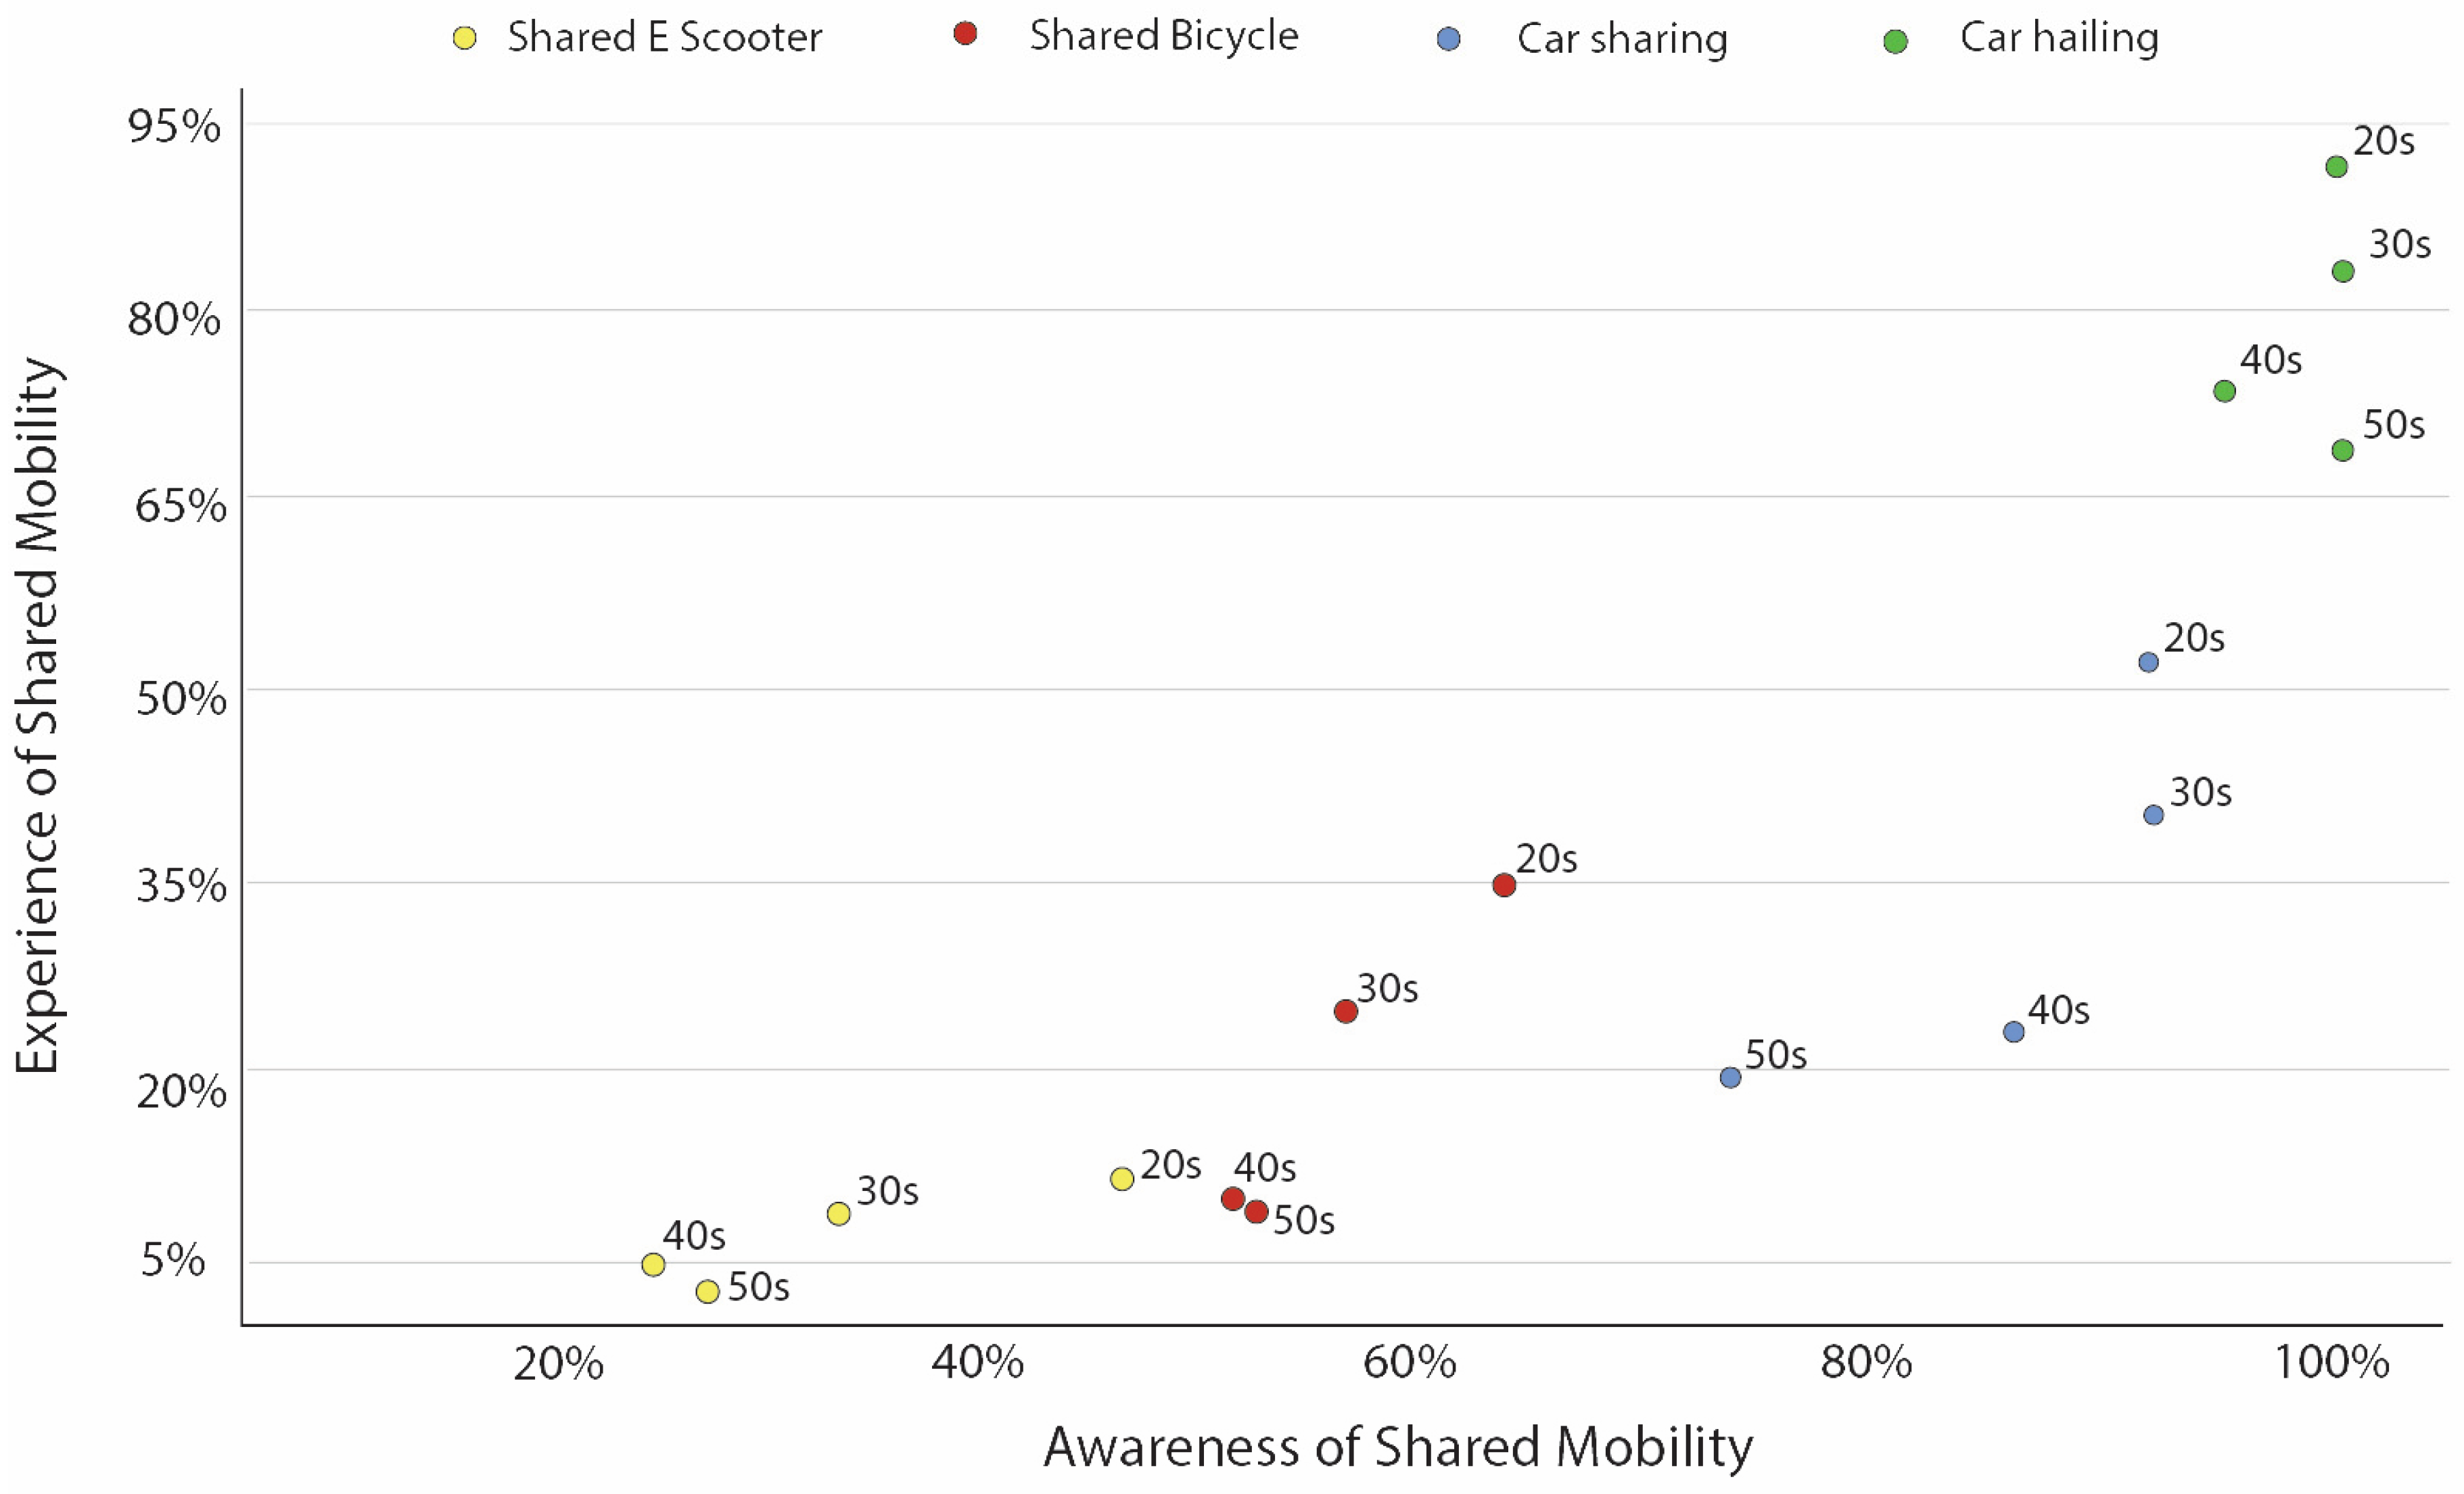
2.4. Shared Mobility Awareness and User Experience

The survey assessed public awareness and user experience of SM; the results are depicted in Figure 2. Data are categorized by age group (20s, 30s, 40s, and 50s), showing variations in SM awareness and usage among these segments. The order of SM services in terms of awareness is car-hailing, car sharing, bike sharing, and e-scooters. However, actual experience with these services is generally lower than awareness. Younger age groups display greater awareness and usage of SM than older groups. Car-related sharing services have higher awareness and usage rates than e-PMV services. Specifically, car-hailing shows high levels of both awareness (90.8%) and experience (95%). Bike sharing is well-known but less used, while e-scooters have lower awareness and usage rates.

2.5. Reasons for Using Shared Mobility

SM is predominantly employed to distinctly reflect the unique characteristics of each service. The primary purposes of using SM in the Seoul, Gyeonggi, and Incheon regions were identified and ranked from first to third. A weighted system was then applied (first place * 2, second place * 1.5, third place * 1) [43] to derive the final results. Understanding SM usage purposes aids in comprehending usage patterns and expected satisfaction across different age groups. The primary reasons for using car-hailing are the lack of public transportation at night (22.4%), the need for quick movement (21.9%), and public transportation inconvenience (17.7%). These rates are consistent across all age groups. For car sharing, the highest use is for travel (26.7%), emergencies (21.7%), and private car issues (13.5%) (Table 5).
Bike sharing is favored as a health-conscious alternative to walking (21.0%), as a substitute for longer walking distances (19.8%), and for leisure (18.1%). Usage declines from the 30s to 40s but remains similar for those in their 40s and 50s. e-scooters are predominantly used by individuals in their 20s and 30s for distances unsuitable for walking (29.4%), as an alternative to inconvenient public transportation (17.9%), and for commuting. e-scooter usage decreases with age. Notably, both PM options rank highly for the purpose of covering uncertain distances. This aligns with findings from previous studies [44], which indicate a similar usage purpose in high-traffic urban areas.

3. Methodology

3.1. Two-Proportion Z-Test

A hypothesis test for proportion is used when comparing a single group to a known or hypothesized value of the population proportion. It is utilized to determine the validity or replicability of the test outcomes. Precisely, the two-proportional Z-test is applied to evaluate the degree of statistical dissimilarity between the two proportions under consideration [45]. In cases where the data do not comply with a normal distribution, the Z-test remains applicable when the sample size (N) exceeds 30 (N > 30). The method facilitates the comparison of proportions from two different samples pertaining to the same population parameter. Z-statistics are derived from these independent samples to test the null hypothesis that the two proportions are equal. In other words, the two samples must be taken from the same population. The conditions for using the two-sample Z-test are as follows:
  • The two populations must be normal or approximately normal.
  • The two samples must be randomly sampled from the two populations.
  • The two proportions must be independent.
The two-proportion Z-test is a statistical test that can be used to determine whether two proportions are different. The test is advantageous because it does not require knowledge of the population’s standard deviation. In order to use two-proportion Z-test, the two populations must be normal or approximately normal and the two samples must be independent and randomly sampled from the two populations. When the Z-statistics yield results that are less than the predetermined significance level (p-value < 0.05), it is possible to draw the conclusion that there is sufficient evidence to assert a difference between the proportions of the two populations under examination. Consequently, the null hypothesis can be rejected.
The two-proportion Z-test is commonly used in real-world examples, such as determining the effectiveness of medicines, election results, customer purchase behavior, and A/B testing. There are two steps to performing a two-proportion Z-test.
  • The first step is to calculate the standard error of the difference between the two population proportions.
  • The second step is to calculate the Z-test statistic by taking the difference between the two population proportions and dividing it by the standard error of the difference.
  • Set the significance level, e.g., as 0.01 or 0.05. If a significance level of 0.05 is chosen, the null hypothesis is rejected for a p-value less than <0.05.
Z = p 1   ¯ p 2 ¯ p 1 ¯   1   p 1 ¯ ( 1 n 1 + 1 n 2 ) ,
where p 1 ¯ is the proportion of the first sample. p 2 ¯ is the proportion of the second sample. n 1 is the number of data samples in the first sample. n 2 is the number of data samples in the second sample.
The prevalence of individuals without a driver’s license among respondents in the entirety of the Seoul and Gyeonggi regions is denoted as p 1 ¯ . Similarly, the prevalence of driver’s license holders for each specific mode of transportation is represented as p 2 ¯ . Subsequently, the p-value is computed to reflect the proportions of driver’s license holders among the overall respondents and within each specific mobility mode. By calculating the Z-value, the cumulative probability within the normal distribution is determined, facilitating the estimation of the p-value. The p-value is used to evaluate the statistical significance of the hypotheses being examined.

3.2. Logistic Regression Analysis

Logistic regression represents a statistical approach employed for the prediction of binary outcomes, signifying that the dependent variable is dichotomous [42,46]. It is a specific instance of linear regression wherein the target variable is of a categorical nature. The model utilizes the logarithm of odds as the dependent variable. The primary function of Logistic Regression is to forecast the likelihood of a binary event’s occurrence by employing a logit function. The mathematical representation of the logistic regression model is as follows:
P ( Y = 1 X ) = 1 1 + exp ( β X )
where P ( Y = 1 X ) is the probability of the event Y = 1, given that the associated features (X) and β are the coefficients (or parameters) of the model.
The current study uses the logistic regression model to investigate the impact of satisfaction level and holding a driver’s license on the probability of using each SM. The satisfaction level of each SM and holding a driver’s license are employed as independent variables in the logistic regression model. The dependent variable is the probability of SM usage. In building a logistic model, the satisfaction level of the selected SM type is excluded from the dependent variable in order to infer the causality from preferences of other SMs. The values of coefficient estimates indicate the magnitude of the impact on a dependent variable. The values of the estimates and their statistical significance are investigated.

3.3. Evaluating User Satisfaction: Comparative Analysis and Two-Sample t-Test

To assess the satisfaction of users with SM services, a 5-point Likert scale [47] is employed. This scale ranges from 1, indicating the lowest level of satisfaction, to 5, representing the highest level of satisfaction. Using this scale, researchers can gather quantitative data on user satisfaction levels and analyze the results to gain insights into the overall satisfaction with SM services.
An initial analysis of satisfaction with SM was conducted among all respondents. An analysis of satisfaction is performed within each group based on driver’s license possession. A comparative analysis is performed on the two data groups to investigate the satisfaction levels with SM. Two-sample t-tests assuming equal variances (independent sample t-tests) are then performed for each group. The tests comprise two independent samples, starting with the null hypothesis that the two proportions are the same and that the two samples are drawn from the same population. For example, if the p-value is less than the significance level (p < 0.05), there is sufficient evidence of a difference between the two population proportions. Therefore, it is considered that there is a correlation between the groups of people who mainly drive and the group that mainly uses public transportation.

4. Results

4.1. Impact of Driving Experience on Shared Mobility Service Usage

In this study, a two-proportion Z-test was used to evaluate whether having a driver’s license influences SM service usage. The essence of this research is to determine how driving experience affects the use of these services. The hypothesis was tested using samples of licensed drivers from each SM mode and the entire pool of respondents.
The two-proportion Z-test was conducted to assess the differences in values between users of each mobility service and among those users who held driver’s licenses. In the Seoul, Gyeonggi, and Incheon regions, out of 1041 respondents, 918 possess a driver’s license, which corresponds to 88% of the total sample. Subsequently, within the group of respondents who hold a driver’s license and have chosen each type of shared mobility service, Table 6 categorized them as p1 (those with a driver’s license) and p2 (those without a driver’s license) to analyze the data values for each mobility mode.
The two-proportion Z-test for driver’s license ownership revealed that only car sharing (p-value = 0.018) showed statistical significance in license possession influencing SM service use; however, the e-scooter (0.101), car-hailing (0.417), and bike sharing (0.019) modes did not show significant results.
The findings suggest that license ownership is a key factor for using car-sharing and bike-sharing services but not for other mobility modes. The results for car sharing showed that driver’s license holders exhibited a 5% higher rate of car-sharing usage compared to nonholders, indicating a preference for car sharing among license holders.
In contrast, for bike sharing, nonholders (89%) used the SM service at a higher rate than license holders (84%), indicating that those without a driver’s license tend to use bicycles more frequently. It showed a marginally significant difference (p-value between 0.05 and 0.10) instead of being the dominant factor, indicating that driver’s license possession might still influence users’ adoption of this SM service. Car-hailing and shared e-scooter services did not show a significant difference in usage patterns between those with and without driver’s licenses.
For car-hailing services, the usage rates between driver’s license holders and nonholders were similar, showing that whether or not someone has a driver’s license does not significantly impact their use of these services. This finding contradicts the expectation that nonholders would use car-hailing more frequently and suggests that further detailed discussion is needed to fully understand these results.
In the case of e-scooter sharing, even though driver’s license holders showed a higher usage rate of 92%, which is 4% higher than nonholders, it is important to note that there was no significant difference between the two groups.
A logistic regression analysis was conducted to examine the variables influencing the selection of various SM services and to identify effects. Through this analysis, the relationships between various independent variables and dependent variables were identified, with the relationships measured by p-values. The analysis considered all influencing factors on the choice and use of each SM to determine the impact of each variable.
Table 7 presents the results of the logistic regression analysis, providing indicators of the relationships between dependent variables and various independent variables. Variables are considered to have a significant impact on each other if the p-value is 0.05 or less. The coefficient allows for estimating the relationship between independent and dependent variables. The analysis revealed that car sharing is influenced by all independent variables, including driving license possession, car-hailing, e-scooters, and bike sharing.
In the case of car-hailing, the p-values for the driving license and e-scooter variables exceeded 0.05, indicating that these two variables may not have an impact on the choice of car-hailing. E-scooters are not directly affected by the possession of a driving license, but they are influenced by the relationship with car sharing. Bike sharing exhibits a relationship with car sharing, but no mutual influence was found with e-scooters.
In conclusion, the SM services affected by the possession of a driving license may be car sharing (p-value of 0.019) and bike sharing (p-value of 0.007). According to the estimated values from the logistic regression coefficients, having a driving license positively influences the choice of car sharing, with statistical significance at the 5% significance level. However, bike sharing shows a negative coefficient for driving license possession, indicating an inverse effect compared to the relationship between car sharing and driving licenses. This suggests that individuals without a driving license are more likely to engage in bike sharing.

4.2. Shared Mobility Satisfaction Depending on Driver’s License Possession

The analysis of SM satisfaction was conducted using a 5-point Likert scale. User satisfaction is a key factor because it represents precious value for the current situation and predicts future demand. Out of a total of 1041 respondents, 345 individuals responded to the car-sharing questions. In addition, 795 respondents answered questions related to car-hailing, 71 for e-scooters, and 217 for bike sharing. Among the means of the SM services, bike sharing shows the highest level of satisfaction in terms of gender and age variables, followed by car-hailing and car sharing.
When examining the satisfaction data for each SM, it was found that females have higher satisfaction levels than males, and each mobility type exhibited different patterns by age group. Specifically, bike sharing shows the highest satisfaction levels among both males and females and across all age groups, followed by car-hailing and car sharing, and then e-scooters, which have lower satisfaction levels compared to other SMs. The satisfaction level with shared e-scooters is notably lower, particularly among older age cohorts when compared to their younger counterparts. The detailed results are presented in Table 8.
A t-test with one side is applied to evaluate respondents’ satisfaction with different types of SM and to compare the assumption that there is a difference in satisfaction levels between the groups of driver’s license holders and nonholders. The values are compared using two-sample t-tests; the data values are shown in Table 9
Across various SM options, differences in satisfaction between driver’s license holders and nonholders are generally not statistically significant, as indicated by p-values exceeding the typical threshold of 0.05. The analysis shows that the closest to a meaningful difference was observed in the satisfaction scores for shared e-scooters, although it was still not statistically significant.
In the case of car sharing, which is typically accessible only to those with a driver’s license, driver’s license nonholders may still participate as passengers. The satisfaction scores differed more noticeably: driver’s license holders reported an average satisfaction level of 3.64, which was 0.21 points higher than that of individuals without a driver’s license (3.43). However, despite the extent of this difference, it did not achieve statistical significance, as indicated by the p-value. For shared e-scooters, the satisfaction levels were lowest among the SM services, with driver’s license holders and nonholders scoring 3.58 and 3.20, respectively. Despite the notable difference of 0.38, the p-value of 0.071 suggested that this difference was also not statistically significant. However, compared with car sharing, the medium effect size of e-scooters is significant because it suggests a more substantial difference in satisfaction between driver’s license holders and nonholders. This implies that factors associated with possession of a driver’s license might play a more significant role in influencing satisfaction with e-scooter services.
For bike sharing, even with nearly identical average satisfaction levels of 3.98 and 3.97 for driver’s license holders and nonholders, the t-test revealed no significant differences, as reflected in the p-value. This pattern was similarly observed in car-hailing, where the mean satisfaction scores were comparable between the two groups, with nonholders scoring slightly higher by 0.02, yet showing no statistically significant difference. Overall, the highest average user satisfaction across all SM options was reported with bike sharing for both driver’s license holders and nonholders. Given the lack of significant differences in satisfaction based on license status in all analyzed SM modes, it can be concluded that driver’s license possession does not significantly impact satisfaction levels related to SM.
To investigate the various factors influencing user satisfaction, a Pearson correlation analysis was conducted to examine the correlation of satisfaction with each shared mobility service. This analysis aims to provide insights into user characteristics. The Pearson correlation coefficient is a statistical measure that assesses the strength and direction of a linear relationship between two variables, with a range from −1 to +1.
The values of the correlation coefficients are presented in Table 10. The findings indicate that car sharing is statistically significantly correlated with car-hailing, e-scooters, and bike sharing. Conversely, while car-hailing exhibits a correlation with car sharing and shared bikes, it does not demonstrate a statistically significant correlation with e-scooters.
Notably, there is a high correlation between car sharing and car-hailing, with an absolute value of 0.2443. This suggests that these two services can be considered alternative and complementary to each other in terms of usage patterns and service delivery methods. Additionally, it is important to note that car sharing also has a strong correlation with e-scooters and shared bikes. From the perspective of operational manipulation, one may estimate that there is a correlation between sharing, scooters, and bikes.

5. Discussion

It is necessary to analyze in-depth whether driving experience affects SM. In the use of shared mobility, a two-proportion Z-test and Pearson Correlation analysis of driver’s license holders and nonholders revealed that car sharing and bike sharing showed significant results between driver’s license holders and nonholders, supporting the hypothesis that “driver’s license ownership influences SM usage”.
The bike-sharing users include a significant number of both driver’s license holders and nonholders, with a statistically significant difference observed between these two groups. This finding suggests that the possession of a driver’s license may influence the utilization of bike sharing. However, analysis using a logistic regression model indicated that the possession of a driver’s license exhibited differing effects on preferences for car-sharing and bike-sharing usage. Specifically, driver’s license holders demonstrated a preference for car sharing, whereas nonholders showed a higher tendency toward bike sharing. This correlation suggests that the presence or absence of a driver’s license may lead users to consider different factors when selecting SM modes. Specifically, individuals with a driver’s license might prefer car sharing as it allows them to utilize their driving experience, whereas nonholders may favor bike sharing to avoid the responsibilities or requirements associated with driving.
In the case of bike sharing, the greater preference among non-license holders may be attributed to infrastructure, accessibility, or regional characteristics. Particularly in large cities, well-developed bicycle infrastructure and active public transportation systems make commuting by bike relatively more convenient. These findings align with Basu’s study (2021) [48], which shows that large cities with easy access to bike-sharing stations enable the impact of bike sharing on car dependence. Therefore, it is likely that shared bicycles will be widely used as a mode of commuting in well-developed metropolitan areas.
The logistic regression analysis results presented in Table 7 indicate that car sharing exhibits a high correlation with both e-scooter sharing and bike sharing. Specifically, variables related to car sharing show a significant positive correlation with e-scooter sharing (coefficient: 0.406, p-value: <0.001) and bike sharing (coefficient: 0.238, p-value: <0.001). These findings suggest that the relationships between SM modes may be particularly pronounced in contexts where service control is required.
Car-hailing ranked highest in terms of experience and awareness, with high satisfaction levels as well. In addition, the proportions of driver’s license holders and nonholders was similar, and there was no statistical significance between the two groups. These findings can be supported by research [17] that demonstrated a discrepancy between the concepts of car ownership and car usage. As a result, it can be inferred that car-hailing differs in its usage mechanism compared to other SM modes.
To clarify, car-hailing exhibits a distinct usage mechanism compared to other shared mobility (SM) modes. Car-hailing can be considered a hybrid service that integrates an online platform with traditional public transportation modes, such as taxis. This integration makes it the SM type most closely aligned with conventional public transport systems. Despite the challenges that large cities face, such as parking issues and traffic congestion during commuting, car-hailing offers the significant advantage of easily specifying pick-up and drop-off locations through on-demand functionality. This convenience is likely a primary factor driving its widespread adoption and usage.
In this context, the adoption of car-hailing is consistent with research [14,16] indicating that car owners show a preference for these services for their daily commutes. Thus, car-hailing not only reinforces its role as an alternative to traditional public transportation but also demonstrates its ability to cater to a diverse range of users, regardless of driver’s license status. Regarding e-scooter sharing, it is notable that the proportion of driver’s license holders (92%) exceeded that of car sharing (91%), yet the results for both did not yield statistically significant values. e-scooters attract both groups equally, potentially because they are easy to use without any special training or licensing and are accessible for short-distance travel, as previous research shows [14]. However, the reason for the lack of statistical significance may be attributed to a limited sample size. It is reasonable to predict that statistical significance would be achieved with a larger sample size, as statistical significance was observed when calculated with an increased sample size.
According to Table 10, the influence of driver’s license ownership on satisfaction varies across different modes of transportation, with car sharing and e-scooter sharing showing increased satisfaction among driver’s license holders, contrary to shared bicycles, where no noticeable difference is detected. In the case of e-scooters, although they can be ridden without a license, those with a driver’s license report higher satisfaction. As indicated by the results of the logistic regression model previously mentioned, it can be inferred that car sharing, e-scooter sharing, and bike sharing share a manipulable commonality. This may indicate that these transportation modes exhibit a measurable attribute that allows for systematic management and analysis. It is assumed that this indicates that driving experience might affect satisfaction levels. In addition, it is likely related to regulations recommending that moped license holders use e-scooters for safety reasons.
The concept of statistical significance serves to determine the likelihood that observed differences are substantial rather than coincidental. Nevertheless, the findings collectively reveal that the possession of a driver’s license does not significantly affect overall satisfaction with SM services, highlighting the nuanced role of user characteristics in the evaluation of SM experiences. These findings can be extended to an international context. Integrating the results of our study into the design of shared mobility systems in major global cities could lead to more efficient solutions.

6. Conclusions

This study delves into the usage patterns of SM from a user’s perspective, focusing particularly on whether the possession of a driver’s license influences usage and satisfaction. Conducted in the urban areas of Seoul, Gyeonggi, and Incheon, this research aimed to identify significant differences in SM usage based on whether individuals hold a driver’s license.
Driving experience influences car sharing and bike sharing, suggesting that driving experience affects the usage patterns of specific transportation modes. Through logistic regression analysis, it is determined that possessing a driver’s license has contrasting effects on car sharing and bike sharing. Specifically, holding a driving license significantly influences the choice of car sharing and bike sharing. A driving license increases the likelihood of using car sharing but decreases the preference for bike sharing, indicating opposing effects on these two modes of shared mobility.
However, for other SM modes such as e-scooters and car-hailing, no significant differences were found based on the driver’s license status, despite some variations in satisfaction scores. These research findings can be seen as showing a pattern of results that differs from previous studies [1,49,50], which suggest that an increase in the use of SM leads to a decrease in private car ownership. In the case of e-scooters, no significant difference in usage frequency was found based on driving experience. However, the low satisfaction scores may be related to safety concerns highlighted in recent societal discussions [27].
Specifically, while car-hailing is highly recognized and experienced, its usage did not show a significant statistical correlation with driving experience, suggesting that factors other than driver’s license possession might be influencing this trend. This is another noteworthy finding of this study, suggesting that the factors influencing the choice of ride-hailing services operate through mechanisms different from those affecting other SM options. The ease of accessing car-hailing services via apps, which link to traditional public transportation services such as taxis, likely contributes to this result.
Although this research has a limitation in that it cannot be generalized to all cities because the research area is a high-density area with well-developed transportation infrastructure, it explains the SM usage pattern in urban areas where a high population density and the spread of SM in connection with public transportation have been achieved [13,20,22,27,51].
SM policies still fluctuate depending on safety and competitive industry interests, such as between private companies or between private and public companies, and there is a lot of discussion on safety and legislation. In this respect, this study can suggest foundational data for practitioners to forecast future sustainable mobility systems, enhancing their understanding of SM use intentions. In addition, this study suggests a foundation for proposing diverse policy recommendations to support the proliferation of future mobility systems.

Author Contributions

Conceptualization, J.B. and J.-Y.S.; methodology, J.B. and J.-Y.S.; software, J.B.; validation, J.B. and J.-Y.S.; formal analysis, J.B.; investigation, J.B. and J.-Y.S.; resources, J.B.; data curation, J.B.; writing—original draft preparation, J.B. and J.-Y.S.; writing—review and editing, J.-Y.S.; visualization, J.B.; supervision, J.-Y.S.; project administration, J.-Y.S.; funding acquisition, J.-Y.S. All authors have read and agreed to the published version of the manuscript.

Funding

This work was supported partially by the National Research Foundation of Korea (NRF) grant funded by the Korea government (MSIT) (No. NRF-RS-2023-00209531).

Institutional Review Board Statement

Not applicable.

Informed Consent Statement

Informed consent was obtained from all subjects involved in the study.

Data Availability Statement

Dataset available on request from the authors.

Acknowledgments

This work was supported partially by the National Research Foundation of Korea (NRF) grant funded by the Korea government (MSIT) (No. NRF-RS-2023-00209531).

Conflicts of Interest

The authors declare no conflicts of interest.

References

  1. Vega-Gonzalo, M.; Gomez, J.; Christidis, P.; Vassallo, J.M. The role of shared mobility in reducing perceived private car dependency. Transp. Res. Part D Transp. Environ. 2024, 126, 104023. [Google Scholar] [CrossRef]
  2. Machado, C.A.S.; de Salles Hue, N.P.M.; Berssaneti, F.T.; Quintanilha, J.A. An overview of shared mobility. Sustainability 2018, 10, 4342. [Google Scholar] [CrossRef]
  3. Martínez-Díaz, M.; Soriguera, F.; Pérez, I. Technology: A necessary but not sufficient condition for future personal mobility. Sustainability 2018, 10, 4141. [Google Scholar] [CrossRef]
  4. Yoon, H.R.; Ki, H.K. Introduction of Seoul Integrated Transportation Service (MaaS); Research Institute in Seoul: Seoul, Republic of Korea, 2019; pp. 1–23. [Google Scholar]
  5. Dhinakaran, K.; Srinath, S.; Sriram, S.; Venkateshwar, R. GPS based tracking system for transit objects. In Proceedings of the 2017 Third International Conference on Science Technology Engineering & Management (ICONSTEM), Chennai, India, 23–24 March 2017; pp. 194–201. [Google Scholar]
  6. Park, Y.; Akar, G. Why do bicyclists take detours? A multilevel regression model using smartphone GPS data. J. Transp. Geogr. 2019, 74, 191–200. [Google Scholar] [CrossRef]
  7. Yi, W.; Yan, J. Energy consumption and emission influences from shared mobility in China: A national level annual data analysis. Appl. Energy 2020, 277, 115549. [Google Scholar] [CrossRef]
  8. Eisele, W.L.; Fossett, T.; Schrank, D.L.; Farzaneh, M.; Meier, P.J.; Williams, S.P. Greenhouse Gas Emissions and Urban Congestion: Incorporation of Carbon Dioxide Emissions and Associated Fuel Consumption into Texas A&M Transportation Institute Urban Mobility Report. Transp. Res. Rec. 2014, 2427, 73–82. [Google Scholar]
  9. Shapiro, R.J.; Hassett, K.A.; Arnold, F.S. Conserving Energy and Preserving the Environment: The Role of Public Transportation; American Public Transportation Association: Washington, DC, USA, 2002. [Google Scholar]
  10. Giesel, F.; Nobis, C. The impact of carsharing on car ownership in German cities. Transp. Res. Procedia 2016, 19, 215–224. [Google Scholar] [CrossRef]
  11. Martin, E.; Cohen, A.; Botha, J.L.; Shaheen, S. Bikesharing and Bicycle Safety; MINETA(MTI): San Jose, CA, USA, 2016. [Google Scholar]
  12. Wappelhorst, S.; Sauer, M.; Hinkeldein, D.; Bocherding, A.; Glaß, T. Potential of electric carsharing in urban and rural areas. Transp. Res. Procedia 2014, 4, 374–386. [Google Scholar] [CrossRef]
  13. Nijland, H.; van Meerkerk, J. Mobility and environmental impacts of car sharing in the Netherlands. Environ. Innov. Soc. Transit. 2017, 23, 84–91. [Google Scholar] [CrossRef]
  14. Heineke, K.; Kloss, B.; Scurtu, D. The Future of Micromobility: Ridership and Revenue after a Crisis; McKinsey: New York, NY, USA, 2020. [Google Scholar]
  15. Cheng, R.; Zeng, W.; Wu, X.; Chen, F.; Miao, B. Exploring the Influence of the Built Environment on the Demand for Online Car-Hailing Services Using a Multi-Scale Geographically and Temporally Weighted Regression Model. Sustainability 2024, 16, 1794. [Google Scholar] [CrossRef]
  16. Efthymiou, D.; Antoniou, C.; Waddell, P. Factors affecting the adoption of vehicle sharing systems by young drivers. Transp. Policy 2013, 29, 64–73. [Google Scholar] [CrossRef]
  17. Zhong, J.; Lin, Y.; Yang, S. The impact of ride-hailing services on private car use in urban areas: An examination in Chinese cities. J. Adv. Transp. 2020, 2020, 8831674. [Google Scholar] [CrossRef]
  18. Kim, K.; Baek, C.; Lee, J.-D. Creative destruction of the sharing economy in action: The case of Uber. Transp. Res. Part A Policy Pract. 2018, 110, 118–127. [Google Scholar] [CrossRef]
  19. Mitropoulos, L.; Kortsari, A.; Ayfantopoulou, G. A systematic literature review of ride-sharing platforms, user factors and barriers. Eur. Transp. Res. Rev. 2021, 13, 61. [Google Scholar] [CrossRef] [PubMed]
  20. Campisi, T.; Akgün, N.; Ticali, D.; Tesoriere, G. Exploring public opinion on personal mobility vehicle use: A case study in Palermo, Italy. Sustainability 2020, 12, 5460. [Google Scholar] [CrossRef]
  21. Mohn, T. The Good News/Bad News for E-Scooters and Speed. Available online: https://www.forbes.com/sites/tanyamohn/2023/05/17/the-good-newsbad-news-for-e-scooters-and-speed/?sh=4692305b30e4 (accessed on 5 December 2023).
  22. Castillo, A. Available online: https://www.americancityandcounty.com/2023/05/22/research-highlights-safety-tradeoffs-of-electric-scooter-speed-limiters/ (accessed on 5 March 2024).
  23. Zagorskas, J.; Burinskienė, M. Challenges caused by increased use of e-powered personal mobility vehicles in European cities. Sustainability 2019, 12, 273. [Google Scholar] [CrossRef]
  24. Lee, M.; Chow, J.; Yoon, G.; He, B. Forecasting e-scooter competition with direct and access trips by mode and distance in New York City. arXiv 2019, arXiv:1908.08127. [Google Scholar]
  25. Pham, T.Q.; Nakagawa, C.; Shintani, A.; Ito, T. Evaluation of the effects of a personal mobility vehicle on multiple pedestrians using personal space. IEEE Trans. Intell. Transp. Syst. 2015, 16, 2028–2037. [Google Scholar] [CrossRef]
  26. Howe, E.; Bock, B. Global Scootersharing Market Report 2018; InnoZ-Innovation Centre for Mobility and Societal Change (InnoZ) GmbH: Berlin, Germany, 2018. [Google Scholar]
  27. Clercq, G.D. Paris Considers Electric Scooter Ban over Safety Concerns. Available online: https://www.reuters.com/world/europe/paris-considers-electric-scooter-ban-over-safety-concerns-2022-11-15/ (accessed on 10 November 2023).
  28. Ko, E.; Kim, H.; Lee, J. Survey data analysis on intention to use shared mobility services. J. Adv. Transp. 2021, 2021, 5585542. [Google Scholar] [CrossRef]
  29. Ko, E.; Kwon, Y.; Son, W.; Kim, J.; Kim, H. Factors Influencing Intention to Use Mobility as a Service: Case Study of Gyeonggi Province, Korea. Sustainability 2021, 14, 218. [Google Scholar] [CrossRef]
  30. Sherwin, H.; Chatterjee, K.; Jain, J. An exploration of the importance of social influence in the decision to start bicycling in England. Transp. Res. Part A Policy Pract. 2014, 68, 32–45. [Google Scholar] [CrossRef]
  31. Roukouni, A.; Homem de Almeida Correia, G. Evaluation methods for the impacts of shared mobility: Classification and critical review. Sustainability 2020, 12, 10504. [Google Scholar] [CrossRef]
  32. Fazio, M.; Giuffrida, N.; Le Pira, M.; Inturri, G.; Ignaccolo, M. Planning suitable transport networks for e-scooters to foster micromobility spreading. Sustainability 2021, 13, 11422. [Google Scholar] [CrossRef]
  33. Ignaccolo, M.; Inturri, G.; Cocuzza, E.; Giuffrida, N.; Le Pira, M.; Torrisi, V. Developing micromobility in urban areas: Network planning criteria for e-scooters and electric micromobility devices. Transp. Res. Procedia 2022, 60, 448–455. [Google Scholar] [CrossRef]
  34. Krenn, P.J.; Oja, P.; Titze, S. Development of a bikeability index to assess the bicycle-friendliness of urban environments. Open J. Civ. Eng. 2015, 5, 451–459. [Google Scholar] [CrossRef]
  35. Correia, G.; Viegas, J.M. Carpooling and carpool clubs: Clarifying concepts and assessing value enhancement possibilities through a Stated Preference web survey in Lisbon, Portugal. Transp. Res. Part A Policy Pract. 2011, 45, 81–90. [Google Scholar] [CrossRef]
  36. Prieto, M.; Baltas, G.; Stan, V. Car sharing adoption intention in urban areas: What are the key sociodemographic drivers? Transp. Res. Part A Policy Pract. 2017, 101, 218–227. [Google Scholar] [CrossRef]
  37. Ho, C.Q.; Mulley, C.; Hensher, D.A. Public preferences for mobility as a service: Insights from stated preference surveys. Transp. Res. Part A Policy Pract. 2020, 131, 70–90. [Google Scholar] [CrossRef]
  38. Kim, D.; Park, Y.; Ko, J. Factors underlying vehicle ownership reduction among carsharing users: A repeated cross-sectional analysis. Transp. Res. Part D Transp. Environ. 2019, 76, 123–137. [Google Scholar] [CrossRef]
  39. Institute, N.G.I. Available online: https://map.ngii.go.kr/ms/map/NlipMap.do (accessed on 11 November 2023).
  40. Korea, S. KOSIS Korean Statistical Service. Available online: https://kosis.kr/visual/populationKorea/PopulationDashBoardMain.do (accessed on 5 October 2023).
  41. Agency, K.N.P. Status of Driver’s License Holders. Available online: https://kosis.kr/statHtml/statHtml.do?orgId=132&tblId=DT_13201_A002 (accessed on 29 July 2023).
  42. Korea, M.o.t.I.a.S.o. Population Status by Age 20–60. Available online: https://jumin.mois.go.kr/ageStatMonth.do (accessed on 30 July 2023).
  43. Kim, J. Smart Mobility Service Issue and Policy Implication; Gyeonggi Research Institute: Suwon, Republic of Korea, 2020. [Google Scholar]
  44. Kim, Y.R.C.; Ji, W.S.; Song, J.R. Smart Mobility Services: Issue and Policy Implications; Kyunggi Policy Research Center: Suwon, Republic of Korea, 2020; Volume 1–184. [Google Scholar]
  45. Ma, Q.; Yang, H.; Mayhue, A.; Sun, Y.; Huang, Z.; Ma, Y. E-Scooter safety: The riding risk analysis based on mobile sensing data. Accid. Anal. Prev. 2021, 151, 105954. [Google Scholar] [CrossRef]
  46. LaValley, M.P. Logistic regression. Circulation 2008, 117, 2395–2399. [Google Scholar] [CrossRef]
  47. Li, W.; Kamargianni, M. An integrated choice and latent variable model to explore the influence of attitudinal and perceptual factors on shared mobility choices and their value of time estimation. Transp. Sci. 2020, 54, 62–83. [Google Scholar] [CrossRef]
  48. Basu, R.; Ferreira, J. Planning car-lite neighborhoods: Does bikesharing reduce auto-dependence? Transp. Res. Part D Transp. Environ. 2021, 92, 102721. [Google Scholar] [CrossRef]
  49. Le Vine, S.; Polak, J. The impact of free-floating carsharing on car ownership: Early-stage findings from London. Transp. Policy 2019, 75, 119–127. [Google Scholar] [CrossRef]
  50. Jain, T.; Rose, G.; Johnson, M. Changes in private car ownership associated with car sharing: Gauging differences by residential location and car share typology. Transportation 2022, 49, 503–527. [Google Scholar] [CrossRef]
  51. Hinkeldein, D.; Schoenduwe, R.; Graff, A.; Hoffmann, C. Who would use integrated sustainable mobility services–and why? In Sustainable Urban Transport; Emerald Group Publishing Limited: Bradford, UK, 2015; Volume 7, pp. 177–203. [Google Scholar]
Figure 1. Seoul and Gyeonggi Province population density.
Sustainability 16 07225 g001
Figure 2. Scatter graph between Shared Mobility Awareness and user experience.
Sustainability 16 07225 g002
Table 1. Shared car and Personal mobility (PM) definition and usage.
ServiceConceptUse
Shared
Car
(SC)
Car sharing A short-period rental
service for members
(1) Search for available vehicles near the parking lot using a smartphone application
(2) Pay and reserve a vehicle with a smartphone application
(3) After use, park at the designated place
Car-hailingA service that books transportation (1) Reserve vehicle departure point and destination point in real-time using a smartphone application
(2) Take the vehicle to the departure point
Personal Mobility
(PM)
Bike sharing A sharing service for single-person transportation modes (1) Search for available electric bikes or scooters using a smartphone application
Scooter sharing
(e-scooter)
A sharing service for single-person transportation modes powered by electric batteries (2) Pay and reserve PM with a smartphone application
(3) After use, park freely on the street
Table 2. Characteristics of the respondents.
Sample
Characteristics
Driving License HolderDriving License NonholderNumber of Samples%
GenderMale5032352650.21%
Female41510051549.79%
Age20s1726323522.57%
30s2272224923.91%
40s2621928126.99%
50s2571927626.51%
Table 3. Ratio of driving license holders and nonholders.
Republic of Korea%Seoul, Kyunggi, Incheon%
Driving license holder177989%91888%
Driving license
Nonholder
22111%12312%
Total2000100%1041100%
Table 4. Individual user status for daily mobility choice. (Unit: ppl).
ServiceNumber of SamplesGenderAgeArea
MaleFemale20s30s40s50sSeoulGyeonggi ProvinceIncheon
Walk799
76.8%
386
(73.4%)
413
(80.2%)
215
(91.5%)
186
(74.7%)
203
(72.2%)
195
(70.7%)
329
(83.7%)
386
(72.0%)
84
(75%)
Bus798
76.7%
391
(74.3%)
407
(79.0%)
209
(88.9%)
179
(71.9%)
204
(72.6%)
206
(74.6%)
319
(81.2%)
407
(75.9%)
72
(64.3%)
Metro817
78.5%
426
(81.0%)
391
(75.9%)
207
(88.1%)
190
(76.3%)
202
(71.9%)
218
(79%)
351
(89.3%)
384
(71.6%)
82
(73.2%)
Taxi468
45.0%
228
(43.3%)
240
(46.6%)
138
(53.7%)
117
(47%)
110
(39.1%)
103
(37.3%)
210
(53.4%)
210
(39.2%)
48
(42.9%)
Private Vehicle663
63.7%
337
(64.1%)
326
(63.6%)
84
(35.7%)
179
(71.9%)
196
(69.8%)
204
(73.9%)
218
(55.5%)
378
(70.5%)
67
(59.8%)
Electronic Vehicle
(e-PMV)
208
20.0%
128
(24.3%)
80
(15.5%)
50
(21.3%)
62
(24.9%)
56
(19.9%)
40
(14.5%)
96
(24.4%)
92
(17.2%)
20
(17.9%)
Total1041526515235249281276393536112
Table 5. Purpose for using shared mobility.
Purpose for UsageTotalAgesSeoulKyunggiIncheon
20s30s40s50s
Shared CarCar-SharingNeed a car to travel to destination340
(26.7%)
125
(27.5%)
96
(26.3%)
71
(30.7%)
48
(21.4%)
160
(27.4%)
155
(26.3%)
25
(24.5%)
Need a car urgently277
(21.7%)
92
(20.2%)
89
(24.3%)
48
(20.5%)
48
(21.4%)
128
(21.8%)
125
(21.1%)
24
(24.0%)
Hard to use personal vehicle173
(13.5%)
46
(10.1%)
56
(15.3%)
37
(!5.8%)
34
(15.1%)
72
(12.1%)
88
(14.9%)
13
(13%)
Other reason486
(38.2%)
192
(29.7%)
124
(25.4%)
77
(24.8%)
93
(29.6%)
226
(38.7%)
221
(37.6%)
39
(38.5%)
Total Responses1272
(100%)
455
(100%)
365
(100%)
233
(100%)
223
(100%)
586
(100%)
589
(100%)
101
(100%)
Car-HailingWhen too early or too late to use
transportation
659
(22.4%)
171
(17.4%)
184
(17.9%)
159
(14.1%)
145
(13.6%)
258
(22.8%)
340
(23.1%)
61
(18.3%)
Urgent movement during a limited time644
(21.9%)
206
(21.0%)
161
(15.7%)
151
(13.48%)
126
(11.8%)
234
(20.7%)
316
(21.5%)
94
(28.2%)
Hard to use public transportation520
(17.7%)
99
(10.1%)
157
(15.3%)
132
(11.7%)
132
(12.3%)
177
(15.6%)
295
(20.0%)
48
(14.3%)
Other reasons1114
(37.9%)
314
(39.8%)
301
(37.5%)
271
(38.0%)
228
(36.2%)
463
(40.9%)
520
(35.4%)
130
(39.2%)
Total Responses2934
(100%)
790
(100%)
803
(100%)
713
(100%)
631
(100%)
1132
(100%)
1471
(100%)
333
(100%)
Personal MobilityBike SharingWhen it is an uncertain distance to walk177
(21.0%)
65
(20.6%)
51
(21.3%)
38
(24.7%)
23
(17.3%)
94
(20.3%)
72
(22.5%)
11
(18.8%)
No special reason, but want to use bicycle167
(19.8%)
71
(22.3%)
51
(21.0%)
23
(15.1%)
22
(16.5%)
88
(19.1%)
60
(18.9%)
18
(29.9%)
Need exercise with bike161
(18.1%)
71
(22.3%)
36
(15.0%)
26
(17.1%)
28
(21.2%)
103
(22.2%)
52
(16.4%)
6
(9.4%)
Other reasons338
(41.2%)
110
(34.7%)
103
(42.7%)
66
(43.1%)
59
(45.0%)
177
(38.4%)
135
(42.3%)
25
(41.9%)
Total Responses838
(100%)
317
(100%)
241
(100%)
153
(100%)
132
(100%)
462
(100%)
319
(100%)
60
(100%)
e-scooterWhen it is an uncertain distance to walk79
(29.4%)
35
(29.0%)
21
(27.2%)
18
(38.5%)
5
(20.8%)
32
(28.8%)
36
(32.6%)
10
(22.7%)
Hard to use public transportation49
(17.9%)
25
(20.3%)
14
(17.9%)
8
(17.6%)
2
(6.3%)
23
(20.7%)
14
(12.7%)
11
(23.9%)
Commuting period31
(11.7%)
12
(10.0%)
6
(7.9%)
6
(13.2%)
7
(29.2%)
15
(13.6%)
15
(13.6%)
2
(3.4%)
Other reasons110
(36.3%)
49
(40.7%)
36
(47.0%)
14
(30.8%)
11
(43.8%)
42
(37.4%)
46
(37.6%)
22
(25.0%)
Total Responses266
(100%)
121
(100%)
77
(100%)
46
(100%)
25
(100%)
112
(100%)
111
(100%)
45
(100%)
Note: The number of respondents differs by mean, age, and region as the questions were asked to those who used the service directly; after asking about the first, second, and third priorities, weighting was applied (first priority ×2, second priority ×1.5, third priority ×1).
Table 6. Result of two-proportion Z-test.
SampleNo. with
Driving License
No. of
Total
Samples
% of Driving License Z Statisticp-Value
Car-Hailingp1 (Deselected)2162460.8780 (88%)−0.208180.4175
p2 (Selected)7027950.8830 (88%)
Car Sharingp1 (Deselected)6036960.8643 (86%)−2.082960.0186 *
p2 (Selected)3153450.9130 (91%)
Bike Sharingp1 (Deselected)7358240.8919 (89%)2.055120.0199 *
p2 (Selected)1832170.8433 (84%)
Shared
e-Scooter
p1 (Deselected)8529700.8783 (88%)−1.274670.1012
p2 (Selected)66710.9295 (92%)
Total Sample-91810410.8818 (88%)
Note: * indicates statistical significance with 5% significant level.
Table 7. Results of logistic regression: independent variables, coefficient estimates, and p-values.
Car-hailingVariableInterceptLicenseCar sharingE-scooterShared bike
Coefficient0.7379−0.01240.36580.03810.1827
p-value0.0010.957<0.0010.7110.002
Car sharingVariableInterceptLicenseCar-hailingE-scooterShared bike
Coefficient−2.3900.5470.2960.4060.238
p-value<0.0010.019<0.001<0.001<0.001
Bike sharingVariableInterceptLicenseCar-hailingCar sharingE-scooter
Coefficient−1.684−0.6090.1580.2620.088
p-value<0.0010.0070.004<0.0010.244
Shared
e-scooter
VariableInterceptLicenseCar-hailingCar sharingBike sharing
Coefficient−3.7080.462−0.0280.3660.103
p-value<0.0010.3380.740<0.0010.124
Table 8. Satisfaction analysis of shared mobility use (5-Point Likert scale).
GenderAge
MaleFemale20s30s40s50s
Shared carCar sharing3.5823.6933.5793.6223.6613.688
Car-hailing3.6163.7073.7193.6503.6283.638
Personal
Mobility
Bike sharing3.9823.9713.9884.0163.9233.940
Shared
e-scooter
3.4803.7143.6253.5503.2503.636
Note: Satisfaction scores: Very satisfied—5 points, Satisfied—4 points, Neutral—3 points, Dissatisfied—2 points, Very dissatisfied—1 point.
Table 9. Independent sample t-test to test the differences in satisfaction with shared mobility between driver’s license holders and nonholders.
Driver’s License HolderDriver’s license
Nonholder
t-Statisticp-Value
Mean SDMeanSD
Car-hailing3.660.6963.680.71−0.2510.401
Car sharing3.640.7273.430.9711.4710.071 *
Bike sharing3.980.7413.970.8340.0540.479
Shared
e-scooter
3.580.8233.200.4471.6760.071 *
Note: * indicates statistical significance with 5% significant level.
Table 10. Results of Pearson correlation analysis of SM satisfaction.
CorrelationHailingSharingBike SharingShared e-Scooter
Car-Hailing1.00000.2443 *0.1406 *0.0586
Car Sharing 1.00000.2282 *0.2072 *
Bike sharing 1.00000.0798 *
Shared e-Scooter 1.0000
* indicates that the value of the correlation coefficient is statistically significant at the 5% significance level.
Disclaimer/Publisher’s Note: The statements, opinions and data contained in all publications are solely those of the individual author(s) and contributor(s) and not of MDPI and/or the editor(s). MDPI and/or the editor(s) disclaim responsibility for any injury to people or property resulting from any ideas, methods, instructions or products referred to in the content.

