

A Greenhouse Gas Footprint Analysis of Advanced Hardware Technologies in Connected Autonomous Vehicles


1
State Key Laboratory of Intelligent Green Vehicle and Mobility, School of Vehicle and Mobility, Tsinghua University, Beijing 100084, China
2
Tsinghua Automotive Strategy Research Institute, Tsinghua University, Beijing 100084, China
3
MIT Sloan School of Management, 77 Massachusetts Ave., Cambridge, MA 02139, USA
*
Author to whom correspondence should be addressed.
Sustainability 2024, 16(10), 4090; https://doi.org/10.3390/su16104090
Submission received: 10 April 2024
/
Revised: 25 April 2024
/
Accepted: 3 May 2024
/
Published: 13 May 2024
(This article belongs to the Special Issue Autonomous Systems and Intelligent Transportation Systems)
Abstract
:Greenhouse gas emissions are a critical concern for China’s automotive industry, especially for passenger cars due to their high sales’ volume. Recently, the trend towards connected and autonomous driving vehicles has been significant in the passenger car market. However, the impact of these systems on the life cycle emissions of vehicles remains unclear. This paper focuses on system function levels from driver assistance to full driving automation and studies their life cycle greenhouse gas emissions. This research establishes a component list for the hardware system and a material inventory. Then, this paper reveals significant differences in total system emissions at these technology levels, 540.1 kg for primary, 1318.7 kg for medium, and 2279.2 kg for advanced systems. Despite this difference, the total is less than 7.23% of the total vehicle emissions. To further reduce this portion of GHG emissions, it is recommended that vehicles favor millimeter-wave radar over solid-state LiDAR in their sensing system hardware, coupled with cameras as the primary sensing element. In addition, Intelligent Hardware Systems are not recommended for internal combustion engine passenger cars for optimal balance between functionality and environmental impact.
1. Introduction
The rapid economic development in China has propelled its automotive industry into a pivotal role within the national economy, contributing significantly to economic growth. Since the late 20th century, the swift expansion of this sector has notably driven the growth of the Gross Domestic Product (GDP) and created numerous job opportunities. Recently, there has been a rapid increase in both car sales and ownership in China. Sales increased from 18.0619 million vehicles in 2010 to 26.864 million vehicles in 2022 [1,2], while the number of vehicles owned grew from 91 million in 2010 to 319 million in 2022.
However, this growth has also led to various environmental challenges, particularly in terms of greenhouse gas (GHG) emissions. The automotive industry, a major consumer of gasoline and various petrochemical products, contributes significantly to greenhouse gas emissions [3]. As of 2020, China’s dependence on foreign oil had reached 73% [4], with GHG emissions in the transportation sector showing a marked increase since the year 2000, peaking at 951.0 Mt in 2018 [5]. Passenger vehicles constitute a significant portion of these emissions. In response to these environmental challenges, China signed the Paris Agreement [6] and developed a plan for carbon neutrality [7]. Carbon emissions in China and India have remained progressively higher since 2020. China accounts for 35 per cent of global CO2 emissions in 2023, according to the IEA (International Energy Agency) report in 2023 [8]. Since 2015, the Chinese government has actively promoted New energy vehicles (NEVs), including battery electric vehicles (BEVs) and plug-in hybrid electric vehicles (PHEVs), to address these challenges. Biofuels can also provide significant GHG emission benefits in a short time [9].
Total vehicle sales in the U.S. reached 15.588 million units in 2023, increased by 12.3% compared to 2022 [10]. New energy vehicle sales reached 1.4 million units, up 42.4% from 2022. Over 10.5 million new registrations were achieved in the EU in 2023, battery electric sales soared by an impressive 37% and now command a market share close to 15%, becoming the third-most-popular choice for buyers [11]. The global market share for EVs rose to 15.8% in 2023, up from 13.0% in 2022 [12]. NEV sales in major national and regional automotive markets grew strongly in 2023. The growth in the sales of NEVs has become an important measure to reduce carbon emissions in these places, and an important promotion for the automotive industry.
The rapid growth of NEVs has significantly increased market share and substantially reduced the carbon emissions of the automotive industry [13]. However, the carbon emissions of various components in the life cycle of NEVs should be taken seriously and reduced through technological progress, especially emissions of power batteries, and battery performance metrics are more crucial factors than electricity and energy consumption in battery production processes [14]. Vehicle recycling, especially power battery recycling, is also very relevant to carbon emissions. Research on electrodes, electrolytes, and other materials and structures of power batteries has never ceased in order to obtain better performance, lower cost, and lower emissions [15].
Meanwhile, the development of connected autonomous vehicles (CAVs) as a solution to urban and highway traffic problems (such as congestion and accident rates) has also been rapid in China. CAVs, leveraging advanced information and communication technology, intelligent sensing technology, and vehicular networking technology, enhance traffic efficiency and reduce accident rates, offering new solutions for urban traffic management and highway safety [16,17,18]. The development of CAVs in China has been swift, with technology rapidly advancing and the market share of vehicles equipped with intelligent driving features quickly increasing. However, despite the significant potential of CAVs in reducing traffic accidents and enhancing traffic efficiency, uncertainties remain regarding their carbon emissions over the life cycle. Currently, research on the life cycle carbon emissions of CAVs, particularly during their production, use, and disposal phases, is insufficient [16,19]. The primary reason is the nascent stage of CAV technology development, with major Original Equipment Manufacturers (OEMs) following different technological paths for sensor deployment [20], and high-level autonomous driving technology solutions not yet standardized. Moreover, most automotive sensors for autonomous driving are rapidly evolving, and many products do not meet automotive-grade requirements, making them unsuitable for use in autonomous vehicles. Presently, there is no life cycle GHG emission calculation model for CAVs that reflects the current market status of products sold in China. Therefore, to calculate and control future GHG emissions caused by intelligent hardware systems in CAVs, a life cycle carbon emission calculation model is needed based on the current market products of passenger cars in China, the functional requirements of CAVs, and representing the future technological trends.
The remainder of this paper is organized as follows. Section 2 explains the object and scope of this study and the methodology of this research. Section 3 analyzes in detail all the data used in this study, the assumptions, and their respective bases. Section 4 shows the results of life cycle GHG emissions. Section 5 provides the conclusions and outlook.
2. Methodology
2.1. Brief Description of Connected Autonomous Vehicles
2.1.1. Definition of Connected Autonomous Vehicles
The definition of the intelligent vehicle varies in different countries and organizations. The first characteristic of it is the ability to assist or replace the driver in controlling the vehicle through a certain degree of automation. “Autonomous vehicle” (AV) is the term used for this kind of vehicle, also known as self-driving cars, driverless cars, or robotic cars, which can navigate independently of direct human input. They utilize sensing technologies, such as radar, Global Positioning System (GPS), and computer vision, alongside advanced control systems [21,22]. Connected autonomous vehicles (CAVs), however, extend beyond this concept. They not only interact with other vehicles but also with motorcycles, bicycles, pedestrians, and other road users, as well as Internet of Things (IoT) services, including via Road-Side-Units [23], over Dedicated Short-Range Networking (DSRC) or 5G-V2X networking [24,25]. The CAVs referred to in this study differ from simple AVs primarily in their networking capabilities. This paper will uniformly refer to “CAV” to emphasize that this research is focusing on autonomous driving and internet-connected functions.
The classification of CAVs varies in intensity of functionality, with different global categorizations but a similar overarching logic. According to SAE International’s J3016_202104, CAVs are divided into five levels, plus a category for those without CAV functionalities [26]. China has similar standards for CAV classification. As per the national standard ‘Automated Driving Levels for Vehicles’ (GB/T 40429-2021) issued by the Ministry of Industry and Information Technology [27], CAV development is divided into six stages: Level 0 for Emergency Assistance, Level 1 for Partial Driver Assistance, Level 2 for Combined Driver Assistance, Level 3 for Conditionally Automated Driving, Level 4 for Highly Automated Driving, and Level 5 for Fully Automated Driving. Although there are some differences in details between the two regions, the number of levels and the intensity of functionalities at each level are relatively similar. These classification modes are illustrated in Table 1.
The main function of different is distinguished as follows:
L0 (No Driving Automation): At this level, the driver performs all driving tasks without any assistance from the vehicle.
L1 (Driver Assistance): The vehicle provides some assistance, such as Adaptive Cruise Control (ACC) or Lane Keeping Assist, but the driver is still responsible for controlling the vehicle and must constantly monitor the driving environment.
L2 (Partial Driving Automation): The vehicle can take control of both steering and acceleration/deceleration under certain conditions (such as on highways). The driver must remain engaged and ready to take control at any time and continue to monitor the surroundings.
L3 (Conditional Driving Automation): The vehicle can handle all aspects of driving in specific situations without driver intervention, but the driver must be ready to take control when the system requests.
L4 (High Driving Automation): The vehicle can operate independently in specific conditions (such as within geofenced areas or on certain types of roads) without any driver input. If the conditions are exceeded, the vehicle is capable of safely pulling over.
L5 (Full Driving Automation): The vehicle can drive itself under all road conditions and in any environment without any need for a driver’s presence or intervention.
According to the “Energy Saving and New Energy Vehicle Technology Roadmap 2.0”, a significant ambition is projected for the application of CAVs in China. By 2025, the plan anticipates that over 50% of new vehicle sales will comprise PA- and CA-level CAVs, with HA-level vehicles beginning to enter the market. By 2030, PA- and CA-level CAVs are expected to represent 70% of annual vehicle sales, with HA-level vehicles exceeding 20%. By 2035, various HA-level vehicles are projected to be widely operational in China [29], underscoring the government’s high expectations for CAV implementation.
China has made rapid advancements in the research and application of CAV technologies. Currently, many commercially available models in China are equipped with L1- and L2-level assisted driving systems. Many of these systems are advanced, nearing L3-level functionality. However, due to regulatory, ethical, and social responsibility considerations, manufacturers typically do not claim L3-level autonomous driving for their products. Research institutions, focusing more on foresight and less on cost and usage constraints, tend to rate the autonomous driving level of their developed systems more accurately or even higher. This study primarily investigates the life cycle emissions of different level of systems. Hence, the functional classification of systems should be based on an assessment of actual functional strength, rather than merely their claimed level of functionality.
2.1.2. Introduction to the Sub-Function Sets
To achieve the goal of safely navigating based on the surrounding environment, Intelligent Connected Vehicles (CAVs) need further functional subdivision. Despite varying functionalities at different levels, CAVs can generally be categorized into four relatively independent functional sets: perception, decision-making, execution, and communication [30]. Each of these sets comprises various fundamental technologies that together form the core hardware of CAVs [31].
The perception system forms the basis of CAV’s sensing capabilities, monitoring the vehicle’s surroundings in real-time and transforming sensory information into vehicle-understandable data for decision-making [31]. Computer vision tasks include methods for acquiring, processing, analyzing and understanding digital images [32], and are an important research area in perceptual systems.
The decision-making system in CAVs is crucial for processing and interpreting the information provided by the perception system. This system utilizes neural networks to analyze sensor data and create a 3D point cloud for environmental perception [33]. Advanced algorithms and artificial intelligence are then employed to consider various factors, including road conditions, traffic rules, behaviors of other vehicles, and passenger intention. Appropriate actions such as acceleration, deceleration, turning, and overtaking are determined based on this analysis. Decision-making systems typically use neural networks and deep learning techniques for advanced perception and decision-making tasks. These techniques learn complex features and patterns from sensory data through multi-layered neural network models that mimic the way the human brain works. Deep learning techniques are able to efficiently process large-scale data, and extract abstract features [34,35]. As for the structure, scale, and arithmetic requirements of neural networks for CAVs, they are still in the process of rapid technological iteration, and therefore are diverse and significantly different.
The integrated information is then transformed into operational commands sent to the execution system. This process exemplifies the complex interplay of technology in CAVs, integrating sensory data with decision-making capabilities to ensure safe and efficient vehicle operation [36].
The communication system in CAVs refers to the hardware systems that enable vehicle-to-external communication, commonly known as Vehicle-to-Everything (V2X) functionality. In China, CAVs are generally equipped with a T-BOX system to meet the demands for data upload and download. The T-BOX plays a critical role in gathering and consolidating vehicle data, managing uploads and downloads, and operating navigation systems [37]. Once connected to the vehicle network, it supports real-time traffic information reception, map data updates, and remote diagnostics. The information collected by the T-BOX is sent to the decision-making system for analysis, assisting in the formulation of driving strategies and actions [38].
Additionally, CAVs feature extensive data transmission cables, interfaces, and protocols that differ significantly from traditional Level 0 vehicles. The need for high integration, high-volume data transfer, and low latency in CAVs is leading to a transition towards more advanced in-vehicle communication technologies rather than CAN (Controller Area Network) buses, necessitating concurrent changes in both hardware and software architectures.
2.1.3. Component Description of Connected Autonomous Vehicles
To calculate the life cycle GHG emissions of each function set in this study, it is necessary to focus on the production phase emissions and the average power consumption of each hardware of each subsystem in the use phase. Therefore, it is necessary to further disassemble each function set into components. For the perception system, due to the different types of sensors applicable to different scenarios [39], there are currently two main technological approaches; one is the pure vision technological approach based on cameras, and the other is the dual-mode fusion technological approach based on cameras and radars. The types of sensors mainly include cameras, LiDARs, electromagnetic-wave radars, and ultrasonic radars. The solutions of different manufacturers vary but can be categorized into the above four categories according to the principle of the sensor. The structure of the decision-making system is more complex, and there is still a large degree of uncertainty in the selection of the current technology route. In general, decision-making systems for smart connected vehicles typically use neural networks and deep learning techniques to achieve advanced perception and decision-making tasks. This requires a large number of matrix computing units such as graphics processing units (GPUs) or specialized deep learning Tensor processing units (TPUs). In addition, a central processing unit (CPU) is also required in the decision-making system since it also performs tasks such as information integration, decision-making, and task management. The execution system is mainly responsible for all vehicle maneuvers, i.e., the three systems of acceleration, braking, and steering. For the acceleration system, traditional internal combustion engine vehicles are generally equipped with an electronic throttle system, electric vehicles generally use electronic control systems to realize acceleration operations, the braking system is divided into the driving brake and parking brake, and the automatic driving function is mainly used to control the driving brake; the source of braking power is the brake vacuum pump, the traditional fuel vehicles use the engine as the power source of the vacuum pump, and the electric vehicles use the electric vacuum pump. In addition, brake booster has been commonly used in all products, and the power source for the electric booster pump, the current emergence of the latest technology for electric vehicles on the electric control technology, lies in the principle of direct use of an electric motor to drive the caliper brakes, which has fewer the current applications. In the execution system, regardless of which sub-system in the intelligent networked vehicles before the beginning of the application has been generally equipped with electromechanical integration of the control system, which means the vehicle is in the process of intelligent connected upgrading, no extra component is needed to achieve the electronic control of the execution system. Therefore, the main hardware studied in this research is the life cycle emission of the hardware related to the sensing system, decision-making system, and connected vehicle functions.
2.2. Scope
This paper analyzes the greenhouse gas emissions of connected and autonomous driving systems for passenger cars. Greenhouse gases primarily include carbon dioxide (CO2), methane (CH4), nitrous oxide (N2O), and fluorinated gases (including hydrofluorocarbons, perfluorocarbons, and sulfur hexafluoride SF6). The global warming potential of these gases differs significantly. Environmental science research typically normalizes the impact of these gases using carbon dioxide equivalents (CO2eq). The GHG emissions analysis in this study is considers the global warming potential of all six kinds of greenhouse gas, hereafter referred to as GHG emissions.
Life cycle assessment (LCA) is a systematic method used to evaluate the environmental impacts of a product, process, or activity throughout its entire life cycle, from resource extraction to final disposal. LCA typically involves four main stages: goal and scope definition, life cycle inventory analysis, life cycle impact assessment, and interpretation and improvement. For vehicle life cycle carbon emissions, relevant research projects were started in the 1990s. A mature research methodology has been established in this field over the years. For example, the Greenhouse Gases, Regulated Emissions, and Energy Use in Transportation (GREET) modeling study led by the Argonne National Laboratory in the United States [40], The Ecoinvent modeling study led by the Swiss Centre, GaBi developed by Thinkstep, Germany [41], etc.
This study focuses on the life cycle greenhouse gas emissions of CAV systems in passenger cars. It distinguishes between emissions from non-connected vehicles and CAVs, specifically comparing vehicles without intelligent connectivity to those with various levels of intelligent systems. This research aims to calculate the life cycle carbon emissions of the hardware systems integrated into CAVs, rather than the life cycle emissions of the entire CAV models. This distinction is vital as the intelligent system functionalities in CAVs are somewhat independent from other aspects of the vehicle, such as power system type or performance. Additionally, the level of intelligent systems in a vehicle does not necessarily correlate with the vehicle’s overall performance, due to the diversity in consumer demands and the uncertainties in future technology market developments. Therefore, focusing on the carbon emissions of the connected and autonomous driving systems is crucial rather than the emissions considering the whole vehicle.
Based on the descriptions in Section 2.1, this study encompasses various sub-functional sets of CAVs, including the perception, decision, execution, communication systems, and other auxiliary structures like in-vehicle communication hardware. The research scope extends beyond the emissions of these entire subsystems, focusing specifically on the differences in emissions between various levels of intelligent systems. This study primarily investigates the greenhouse gas carbon emissions of the perception, decision, communication systems, and auxiliary structures of CAVs. From a life cycle perspective, this study adopts the life cycle research theory, delineating the life cycle scope of intelligent systems within two boundaries: the vehicle cycle and the fuel cycle [42]. This approach encompasses the entire chain from raw material extraction, component production, vehicle assembly, and scrapping, as well as energy consumption in all stages, including fuel combustion and electricity usage. The final result is the life cycle GHG emissions of the CAV hardware system.
The disposal and recycling phase is a crucial factor in the life cycle greenhouse gas emissions of passenger cars, especially for new energy vehicles with large quantities of power batteries. However, for CAVs’ hardware systems, the situation differs. The raw materials used in electronic components are relatively abundant and easier to obtain. Recycling these components is complex and often environmentally unfriendly, yielding only small amounts of precious metals like gold, silver, and copper. The economic and environmental benefits of recycling electronic components are limited. Analogous to mobile phone recycling, GHG emissions during electronics recycling range from −0.2 to 0 according to He et al. [43]. By analogy with the electronics industry, the scale of recycling electronic components is small compared to the total production. Furthermore, the reusability of automotive electronic components is constrained by their stringent operational requirements and compatibility with specific vehicle systems, making them difficult to repurpose. This complexity, coupled with the lack of established recycling processes for these systems, means that intelligent systems have little impact on the vehicle recycling process. The emissions of the system disposal are ignored.
2.3. Method and Assumptions
The main research methodology of this study is to establish a list of materials for the production of smart grid hardware systems, and split all the system components within the scope of this study to the raw material level. Then, the total GHG emissions of the production phase of the system are finally obtained based on the emissions of each material from the mining end to the raw material end, and the emissions of the processing phase, respectively.
For the using stage emissions, the average power consumption during operation is obtained by component, and then the total life cycle GHG emissions in the utilization stage are calculated based on the total operating hours of each component in the vehicle life cycle. In the process of disassembling the functions of the smart grid hardware system in this study, the following main assumptions are followed:
- The architectural layout of the computing unit is assumed to be similar to that of a full-size desktop computer, with similar types of electronic components arranged in similar densities on the motherboard (however, there are unique structural requirements for heat dissipation, enclosure, and structural component parts on passenger cars, which are not referenced in full-size desktop computers).
- High-process chip carbon emissions do not decrease due to changes in grid carbon emissions. The main reason is that there is no major power grid system reform plan in the region where the major chip production factories are located, and there is no carbon peak, carbon neutral commitment, or decree in the country where they are located.
- In terms of environmental sensing, although the current mainstream technology routes include pure vision-based technology routes (e.g., Tesla), and LiDAR-based fusion technology routes equipped with cameras, millimeter-wave radar, and ultrasonic radar (most mainstream car companies), at present, the pure vision technology route makes it difficult to support advanced automatic driving. This paper is focused on intermediate and advanced automatic driving hardware assumptions based on the fusion technology route, and the assumption of the types and amount of hardware on behalf of the guarantee function can be realized, thus achieving a more moderate level of technology.
- For laser radar, although there have been much research into and development of the automatic driving function of the car enterprise or the internet enterprise, all of these developments use mechanical laser radar, such as Waymo, Apollo, etc., but according to the analysis in Section 3 and the current Chinese market within the market model products, mechanical laser radar, due to its structural characteristics and cost issues, will not be applied to the market vehicle. Thus, all the car laser radars are assumed to be semi-solid or all-solid laser radar.
- For each major production material (e.g., steel, aluminum, copper, glass, plastic, etc.), the carbon emissions are assumed to be based on the average level of the corresponding industries in China around 2020 according to the conclusions of existing studies.
In addition, for the total running hours in the vehicle utilization cycle, as there are no directly available research data related to it, in this study, based on Argonne lab’s research related to the total distance traveled by Chinese passenger cars [44], the total running hours in the usage cycle are calculated based on the average hourly speeds in the test condition cycle of Chinese passenger cars.
3. Data and Calculation
All data and performed calculations are based on what is illustrated in the research methodology. All required data and calculations are finalized.
3.1. Hardware System Decomposition
Initially, this study establishes assumptions about the types and numbers of sensors configured in vehicles for the intelligent network connection system hardware. Considering the hardware configurations of existing products and industry development trends, this study assumes that the intelligent network connection system needs to meet the minimum requirements of functional intensity for that level, with appropriate hardware redundancy on top of basic functionality. Currently, high-level autonomous driving (adv.) is not yet realized, but its overall component architecture, especially the sensor system, can be assumed. Although there is uncertainty regarding the specific technical route, generally, there is a requirement for high detection distance and precision in all directions for vehicles. Moreover, the computing power requirement for the decision-making system is higher to fully incorporate developed deep learning models without significant simplification. Therefore, in determining the specific hardware quantity of different levels of autonomous driving systems, three principles are followed:
- Current status of commercially available products: currently commercially available models are mainly equipped with primary automated driving hardware, and a full set of sensors, computing platforms, and actuators, and other components are important references for the types and quantities of future system hardware.
- Basic functional requirements: there are basic physical requirements for future automatic driving sensor arrangement, i.e., each means of detection can cover all directions in two dimensions, multi-point arrangement, and hardware with redundancy, and intermediate and advanced automatic driving should be set up in the main direction with sufficient redundancy.
- Reasonable prediction: for example, due to the increase in sensors and the increase in model volume, intermediate and advanced automatic driving requires a significant increase in arithmetic power, which is far more than the decrease in arithmetic power demand that can be brought about by the optimization of the model; even if the telematics network has been popularized, in order to ensure that the automatic driving function can be guaranteed under all road infrastructure conditions, car companies generally will not reduce the intelligent configuration of a single vehicle.
Then, this study summarizes the sensor and computing platform configurations of mainstream domestic and foreign automotive companies and research institutions in their autonomous driving solutions, and the summary table is shown in Table 2. In this table, this study simplifies the smart grid functions into three levels. “Pri.” stands for connected and autonomous system that is classified as primary, and roughly corresponds to the L1 and L2 levels in SAE International standard. “Med.” stands for medium level, corresponds to the L3 level. “Adv.” stands for advanced level, and corresponds to the L4 and L5 levels. This simplifies the discrimination between classes with relatively similar functionality and blurred boundaries.
The hardware systems shown in the table are mainly concentrated in the Pri. and Med. levels, and the number of sensors varies greatly, but based on the principles of all the hardware assumptions, this study takes Huawei and Xiaopeng, which represent the highest level of autonomous driving enterprises, as the benchmark for the assumption of the hardware system of the Med. level, because at the early stage of the rapid development of autopilot in the Pri. level, the automobile enterprises give a redundancy of sensors due to the lack of software capacity and commercial considerations; so, the number of hardware in the hardware assumption process is reduced accordingly. Due to the lack of software capability and commercial considerations, each automobile company has a certain redundancy in sensor arrangement, which exceeds the needs of the system; so, the number of hardware components is reduced accordingly in the hardware assumption process. The configuration of other sensors adheres to the principle of selecting the most commonly used options, with only minimal adjustments. Med. level autonomous driving is a level that is currently in the early stage of development, and there are two technological approaches, Tesla’s purely vision-based program and Huawei’s vision and radar fusion-based approach. However, it is argued in this study that the pure vision-based scheme has certain requirements for the driving environment and higher requirements for the algorithm. Therefore, this study considers that future autonomous driving sensor solutions will develop in the direction of fusion-based. The principle of sensor configuration is that the quantity of any specific type of sensor should not be increased once it achieves complete coverage in all vehicle directions with the necessary redundancy. Moreover, ultrasonic radars are slated for discontinuation as their functions can be more effectively fulfilled by alternative sensors.
In addition, in terms of the specific technological approach of parts, LiDARs, as a special and crucial part of autonomous driving systems, need to be discussed separately. Most of the early autonomous driving cars use mechanical LiDAR as a key sensor; for example, Waymo’s self-driving car uses Velodyne’s mechanical LiDAR. Numerous traditional assisted driving options use mechanical LiDAR in their R&D and some of their products. This kind of LiDAR is one of the necessary components in most tech companies’ autonomous driving systems, providing a high level of sensing capability. However, its various disadvantages are also very obvious, making it difficult to roll out autonomous driving systems on a large scale. Mechanical LiDARs are usually placed on top of the vehicle, above all other components, to obtain a wide, 360° field of view, and these LiDARs are large and heavy, seriously affecting the aerodynamic structure of the vehicle. Moreover, the cost of mechanical LiDAR is high, which makes the early automatic driving system extremely costly and difficult to apply on a large scale, which is also one of the reasons why it is difficult to popularize the early automatic driving vehicles. However, in recent years, China’s solid-state LiDAR (or Semi-solid-state LiDAR), technology has been developing rapidly, and its main structure is significantly more compact compared to the traditional mechanical LiDAR, with smaller, lighter, and less moving parts, well adapted to the vehicle, and above all, lower cost. Currently, all commercially available vehicles are only suitable for semi-solid or solid-state LiDAR, and this study assumes the sensors for all levels of autonomous driving according to the detection angle of semi-solid-state LiDAR and the arrangement of the existing products. Finally, the system hardware list of autonomous driving is shown in Table 3. The hardware system includes cameras, millimeter-wave radar, semisolid LiDAR, ultrasonic radar, OBUs that provide communication functionality, computing platforms, cables that support each hardware component, and structural hardware for hardware mounting.
3.2. Life Cycle Emissions’ Calculation
3.2.1. Production Stage
In order to calculate the production stage emissions of the hardware system, it is necessary to establish an inventory of materials used in the production stage. In this study, each component is decomposed, and materials used in each component are listed according to their structure and characteristics. A main part of GHG emissions of several components are generated from the manufacturing of electronic components and integrated circuits (IC), which are extremely complex and subject to future technological development. To calculate the emission of these ICs, this paper transforms them into similar electronic products for analogous calculations based on methods used in similar studies [55]. This allows the decomposition of the autonomous driving system to be transformed into two parts: a study of emissions from the production of IC, and a study of other general materials.
The emissions data from the GREET model are used for the inventory, published by Argonne Laboratories [40].
For electronic components, this study analogizes the calculation platform to the motherboard and heat sink of a full-size personal computer and calculates the quantitative relationship between the weight and area of the motherboard and the carbon emissions at the production stage based on the density and type of component arrangement on the motherboard. In addition, since the vehicle-grade chips used in the car are currently specially designed for vehicle-grade chips, most domestic manufacturers use dedicated chips from NVIDIA for all levels of automated driving, and Huawei uses its own self-developed vehicle-grade automated driving chips. This is a big difference from the CPU and GPU chips of traditional full-size computers. However, for the master board manufacturing process, the generation of emissions is basically positively correlated with the chip process, and the emissions of the chip production process will be significantly higher for advanced processes. Therefore, in this study, high-process chips are analyzed separately, and the process of the chips used in each component is predicted according to the computability requirement. The main resources consumed in the chip manufacturing process are ultra-clean water and electricity, and the more advanced the process, the higher the energy consumption [56,57]. Based on this characteristic of the chip process and technology, this study utilizes historical data fitting to calculate the carbon emissions in the production stage [58]. The empirical equation obtained from the final fit is shown in Equation (1):
stands for emissions of IC during the production stage kgCO2eq, and is the process of the computer chip.
Therefore, take the computing platform as an example; the material or components used include an advanced process chip, master board, and other electronic components. For chips, the process is determined firstly before the emissions’ calculation as in Equation (1). Then, the emissions of the master board and electronic components can be calculated by analogy to the structure of the computing platform with master boards of full-size computers. Finally, considering the material inventory and calculation of the computing platform, the whole hardware system of CAVE can be calculated as in Equation (2):
In this equation, is the emission of the CAV hardware system in the production stage, is the emissions produced of the th material, th is the component (kgCO2eq/kg), is the weight ratio of th material in th component (%), is the weight of component th (kg), and is the number of component th used in the hardware system. These parameters are determined according to existing product specifications, disassembly reports, and information based on product pictures. The materials required for each component of the passenger car intelligent network system are shown in Table 4. This study calculates the emissions during the production stage of the hardware system by material inventory and the life cycle GHG emission values for each material during its production stage.
3.2.2. Emission Calculation of Usage Phase
The emissions during the usage phase of passenger vehicle connected and autonomous driving hardware systems strongly relate to the power consumption of all components and their total operational duration. The current capabilities of CAVs are not yet powerful enough to ensure operation at higher speeds and lower accident rates compared to human driving. Manufacturers are not expected to prioritize power consumption reduction in the short term. Therefore, this study assumes that the intelligent connected hardware systems will operate at a rated power consumption throughout the vehicle’s operation.
During the usage phase, CAVs’ primary function is to drive, with the total operating time calculated from total mileage and average speed. Based on Argonne National Laboratory’s analysis of Chinese passenger cars, this study assumes an average total driving distance of 165.2 thousand kilometers during the usage phase for current passenger cars in China [44]. To simulate actual driving speeds and acceleration conditions on Chinese roads, the WLTP cycle is used for fuel and electricity consumption tests, closely matching statistical data on energy consumption for passenger cars in China. Therefore, this study calculates the average total driving time to be 2.51 h/100 km based on this testing cycle, thereby inferring the total runtime and energy consumption of the connected and autonomous driving system during the vehicle usage phase.
With total energy consumption, GHG emissions can be referred to. For passenger cars, the power consumption of connected and autonomous driving systems is significantly lower than that of the passenger car powertrains; the power source of system operation is the power battery or the alternator on board. The power sources are different between systems on traditional internal combustion engine vehicles (ICEV) and new energy vehicles. Electricity in ICEVs is generated by an alternator and stored in batteries, and gasoline is consumed in this procedure, while NEVs obtain electricity from the grid. Consequently, the source of GHG emissions during the usage phase differs between these vehicle types. Despite the fact that autonomous driving systems are mostly equipped on NEVs, ICEVs may also adopt the systems as technology develops and market penetration evolves. Therefore, this study also calculates carbon emissions during the usage phase for ICEVs based on the power generation efficiency of the propulsion system and the life cycle emissions of gasoline. The calculation is as shown in Equation (3):
In these equations, is the emissions of connected and autonomous driving systems on ICEVs during the using phase (kgCO2eq). is the power consumption of connected and autonomous driving system level (W). is the efficiency for alternators of ICEVs. is the life cycle emissions of fuel consumption (kgCO2eq/MJ). is the total time of system operation in the using phase (h). is the life cycle emissions of electricity used; data of average power grid emission of 550.7 kgCO2/kWh are used in this research [42].
4. Results
Based on the methodology and data illustrated above, the emissions of each component in the life cycle are calculated. It is clear that the hardware system GHG emissions are related to the carbon emissions produced by each type of component as well as the number of these components used. This study first compares the emissions produced by each component of the CAVs, which are shown in Figure 1. It can be found that the components with the highest manufacturing emissions in the perception system are the LiDAR and the millimeter radar, mainly because they consist of transmitting and receiving electronics, and the GHG emissions of the other perception system components are relatively small. Although this study does not include traditional mechanical LiDAR in the assumptions, its production stage emissions were still calculated for comparison, and it is known that the production emissions of mechanical LiDAR are significantly higher than those of other types of components due to its larger size, significantly higher weight, and larger moving parts. Mechanical LiDAR solutions lead to significantly higher carbon emissions even if the LiDAR solution makes it possible to use fewer alternative radar components. Therefore, the use of solid-state or semi-solid-state LiDAR is also a superior solution from the point of view of GHG emissions. For the other components, the OBU is a highly integrated component, incorporating the transmitter and receiver elements for all types of network connections, the storage elements for GPS and high-precision maps, etc., as well as cables and antennas that account for a large proportion of the weight, which consumes plenty of material in the production process and generates a large amount of GHGs. The structure in the system, which refers to the additional structure on a CAV used to mount the components, is also made up of a large amount of metal materials, and plastics, and generates a large amount of GHG emissions due to its large total weight.
When considering the quantity of components used (especially the number of sensors), the total GHG emissions and their composition during the production stage of the hardware system can be calculated, as shown in Figure 2. The bar chart represents the emissions values of various components during the production stage, while the pie chart represents the proportion of emissions from various types of components during the production stage. It can be seen that for different levels of intelligent connected systems, there are significant differences in GHG emissions and their composition during the production stage. In terms of the total emissions, the greenhouse gas emissions for the Pri. level are 440.1 kg, for Med., these are 863.9 kg, and for Adv., these are 1425.1 kg. The GHG emissions increase by more than two times with the improvement in the system level. This is mainly due to changes in the hardware of the perception system and the decision-making system. The main reason for the increase in GHG emissions in the perception system is the increase in the number of sensors, while the increase in greenhouse gas emissions in the decision-making system is mainly due to the increase in the computability requirements, leading to an increase in core chips or processes, or an increase in the number of chips. This study discusses in detail the GHG emissions changes in the perception system and the decision-making system for each level of the system. For a Pri. level system, ultrasonic radar takes a main part of emissions due to its large quantity required, making up nearly half of the emissions. The Pri. level system does not require high computability; the production emissions of the computing platform are only the second-largest proportion of the total emissions. The emissions’ proportion of other components during the production stage decreases in sequence. For passenger car intelligent connected hardware systems, the total greenhouse gas emissions increase with the improvement in the level of intelligent connectivity functions.
The composition of emissions for different levels of intelligent connected driving also varies. In the Pri. level system, the main source of emissions is ultrasonic radar, accounting for 27.4%, followed by OBU and computing platform, with 18.0% and 17.1%, respectively. However, as the level of the connected and autonomous driving system increases, emissions from many types of hardware are significantly increased due to the need for sensor capabilities and computability increases. In the Adv. level system, the manufacturing of the computing platform becomes the second-largest source of carbon emissions, accounting for 26.9%, and the manufacturing of LiDARs becomes the third, accounting for 26.3%. The Adv. level system no longer requires the use of ultrasonic radar and relies more on other types of radar to detect all directions and adequate distances. In the end, the emissions of these three types of sensors account for a proportion of 63.7% of the emissions in the production stage.
For the usage stage, the power consumption varies for different levels of systems; higher-level functionality results in higher greenhouse gas emissions. However, compared to the energy consumption during vehicle driving, the energy consumption of the system is significantly lower. This study calculates the unit power consumption (Watt) of the system in the usage stage, the energy consumption, and GHG emissions during the usage stage for both ICEVs and NEVs. It is assumed that the connected and autonomous driving system is continuously active when driving, as shown in Figure 3a.
The total power consumption for the Pri. level system is 72.3 W, for the Med. level system, it is 328.8 W, and for the Adv. level system, it is 617.5 W. When converted to unit mileage power consumption, it becomes 0.18 kWh/100 km for the Pri. level, 0.67 kWh/100 km for the Med. level, and 1.36 kWh/100 km for the Adv. level. As for the total energy consumption during the usage stage, it is 300.1 kWh, 1103.1 kWh, and 2251.5 kWh, respectively. The higher power consumption of the Med. and Adv. level systems is mainly due to the need for more sensors to operate simultaneously, and for some of the sensors, the power needs to be higher than that at the Pri. level. Additionally, the computability requirements for the computing platform increase significantly, which also leads to higher power consumption. Analyzing the distribution of the energy consumption in the usage phase, the computing platform’s power consumption is a significant component in all levels of systems, accounting for 55.3%, 48.7%, and 45.3%, respectively. LiDAR is also an important component, and its emissions’ proportion rapidly increases with the system’s level, from 16.6% for the Pri. level to 35.0% for the Adv. level. The increase in energy consumption of LiDAR is one of the important reasons why the Adv. level systems have higher GHG emissions during the usage stage.
When calculating the total GHG emissions during the usage stage, as described in Section 3.2.2, it is necessary to calculate the vehicle models with different power systems separately, distinguishing between NEVs and ICEVs. It is known that although these have the same energy consumption, significant differences in GHG emissions appear due to ICEVs using alternators for electricity generation, as shown in Figure 3b.
The GHG emissions during the usage stage for NEVs are 100 kg, 368 kg, and 750 kg, while for ICEVs, the emissions are generally more than three times those of NEVs, being 328 kg, 1207 kg, and 2464 kg. The electricity generation efficiency of the internal combustion engine and the alternator is relatively low, although the alternator on the vehicle generally has a high efficiency, generally exceeding 90%, and the combined thermal efficiency of the two processes is low because the thermal efficiency of the internal combustion engine is low. Additionally, since this study considers the average emissions from the Chinese power grid for the greenhouse gas emissions from electricity, a significant portion of these comes from renewable energy sources, further highlighting the advantage of NEVs over ICEVs in terms of emissions. This comparison reveals that the characteristics of NEVs make them more suitable for connected and autonomous driving systems.
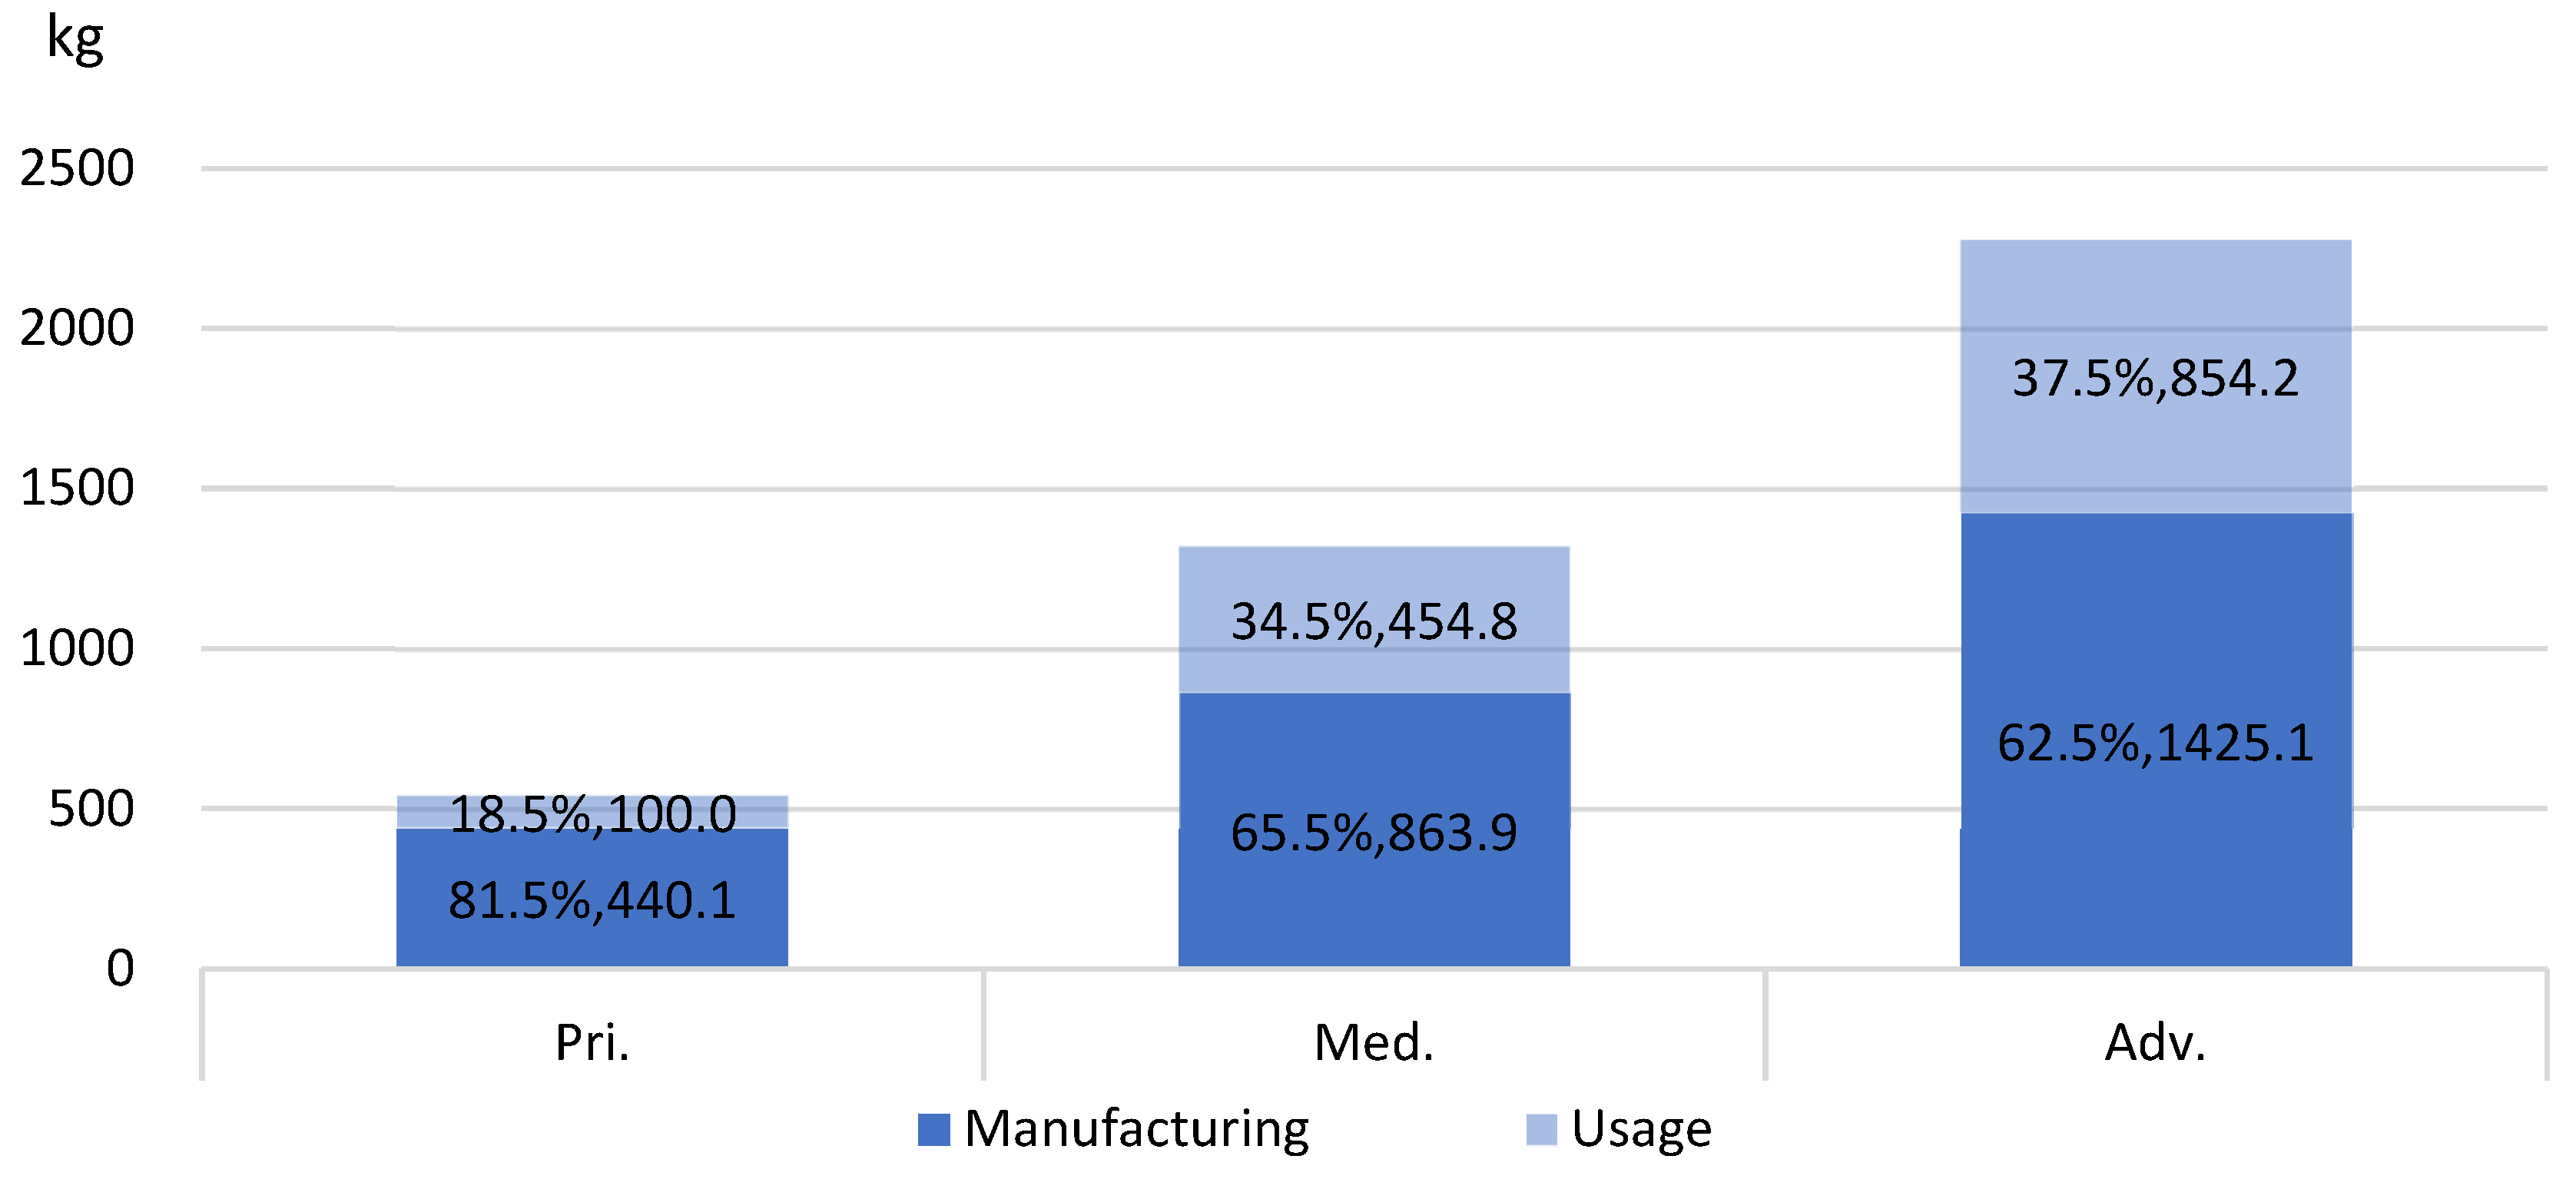
Finally, when analyzing the GHG emissions of connected and autonomous driving hardware systems from a life cycle perspective, there are significant differences in the distribution of emissions between the production stage and the usage stage for various components within the system. Combining the GHG emissions from the production and usage stages for different hardware systems and related products, the total GHG emissions for the life cycle of connected and autonomous driving systems are obtained. As shown in Figure 4, for the Pri. level intelligent connected vehicles, the emissions are relatively low, totaling 540.1 kg, with the majority of carbon emissions coming from the production stage (81.5%). The total emissions for the Med. level system reaches 1318.7 kg, while for the Adv. Level, it is 2279.2 kg, with a significantly reduced production stage emissions’ proportion (62.5%). It can be seen that the total life cycle emissions of connected and autonomous driving systems increase significantly with the improvement in the system’s functioning level, mainly driven by the production stage, where emissions more than double with each increase in level.
Emissions during the usage stage are mainly due to the significant increase in energy consumption of the computing platform and LiDAR, although this increase is not as pronounced as in the production stage. Furthermore, when considering the proportion of emissions during the usage stage compared to the production stage, it is smaller in the overall life cycle. This ultimately reflects that the differences in greenhouse gas emissions primarily stem from the different types and number of hardware components used during the production stage.
5. Conclusions and Discussion
5.1. Conclusions
China’s automotive development has been rapid in recent years, with continuous technological innovation, and it is mainly centered on two directions: new energy power systems and vehicle intelligence. Technology has developed and sales of new energy intelligence vehicles have grown. The increase in technology penetration coupled with China’s large base of ownership makes it clear that connected and autonomous driving vehicle technology will have a significant impact on the passenger car industry, including greenhouse gas emissions. This impact needs to be analyzed in order to achieve China’s 2060 “carbon neutral” commitment.
This study developed a calculation model and material inventory to estimate the life cycle greenhouse gas emissions of connected and autonomous driving hardware systems in passenger cars, focusing on systems’ function levels from driver assistance to partial or fully autonomous driving. It summarizes the hardware configurations used in vehicles in the current market, particularly in the Chinese automotive market. By setting reasonable assumptions for the type, quantity, and performance of hardware components across different levels of the system, this study analyzes the material inventory of connected and autonomous driving hardware systems and quantitatively calculates the GHG emissions and their distribution throughout the life cycle.
It is found that, under the power grid and automotive manufacturing industry, the emissions of the hardware system rise as the system level increases. The emissions of the Pri. system are 540.1 kg, of which 81.5% are from the production phase, while for the Med. Level, these are 1318.7 kg, and 2279.2 kg for the Adv. level; thus, the share of emissions in the production stage is reduce to 62.5%.
GHG emissions are one of the important issues that the automotive industry needs to focus on in the future. As the penetration rate of CAVs in the industry increases, a large amount of new GHG emissions will be generated. Considering the annual sales volume of 30 million passenger cars in China, if 50% of the vehicles are upgraded to the Adv. level system, the GHG emissions will rise by 34.19 million tons. However, when comparing the life cycle emissions of the connected and autonomous hardware system with the whole vehicle, it can be seen that the emissions of the hardware system only account for a small proportion.
In general, the life cycle GHG emissions of a plug-in hybrid A-class SUV without a connected and autonomous driving system are 31.52 t [42]. The GHG emissions of an Adv. level system only account for 7.23% of the proportion. For passenger vehicles, the connected and autonomous driving system will bring a comprehensive improvement in performance, while the GHG emissions are relatively small. From this point of view, the development of CAVs is worthwhile. However, in the early stages of development, the level of the system and the level of the model should match; for example, for a C class SUV model with 51.26 t life cycle emissions, the Adv. level system accounts for only 4.45% of the carbon emissions, but with the same system fitted to an A00 class model with 23.36 t, these become 9.76% [42]. In view of this, smaller vehicles with connected and autonomous driving systems will significantly increase the life cycle greenhouse gas emissions of the entire vehicle compared to larger vehicles; so, Med. and Adv. level systems should be prioritized for larger models. After all, a significantly higher share of carbon emissions is associated with manufacturing costs and electricity consumption, with obvious combined disadvantages. Consumers may prefer to spend their budgets on a higher model class.
In addition, this study analyzes the share of GHG emissions of each component in each phase. In the production phase, the distribution of GHG emissions varies for different levels of systems. For the Pri. level, the largest part of emissions is related to the ultrasonic radar, and the GHG emissions of each component do not differ much. However, for the Adv. level, the largest emitting part is the millimeter-wave radar, followed by the computing platform and the LiDAR, mainly due to the significant increase in the number of millimeter-wave radars used, while the increase in the number of LiDARs is relatively small.
Combining the distribution of emissions over the life cycle, it can be found that besides the computing platform, the selection of LiDAR and millimeter-wave radar and their quantity is one of the important factors affecting the emissions. In terms of technology route selection, visual perception is essential in all current technology routes; so, the number of cameras is difficult to reduce. In terms of radar perception, millimeter-wave radar and LiDAR have some similarities in principle, both of which emit a laser or waves and recognize the reflected signal, but there are some differences in environmental adaptability and accuracy, etc. LiDAR is prone to errors in bright light, while other cases have higher accuracy, and millimeter-wave radar is able to adapt to all kinds of light and rain, snow, and foggy weather, but the accuracy is lower.
5.2. Discussion
In future vehicle design, we can choose to set up redundancy reasonably in the important direction, reduce redundancy in the secondary direction, and appropriately reduce the number of LiDAR on the basis of the assumptions in this study to reduce the greenhouse gas emissions in the production stage; at the same time, less redundant sensing data can save the computing platform arithmetic to further reduce the emissions, which is one of the future technological development trends, at least in the Med. level system. The accuracy requirements identified are relatively low and environment adaptation requirements are higher, and the sensing system can be adjusted to a structure that mainly relies on millimeter-wave radar for identification. Combined with the calculation results, it can also be known that because mechanical LiDAR can complete omnidirectional scanning, but its weight is too large, and its power consumption and production emissions are significantly higher than those of solid-state LiDAR, semi-solid-state LiDAR or all-solid-state LiDAR are the inevitable future development technology routes of LiDAR. Moreover, products launched by Chinese companies tend to preset some redundant and embedded hardware when designing vehicle model. Especially when choosing a chip, a big redundancy of computability will be set by a large margin. The production emission of a chip is related to its arithmetic power. From the point of view of carbon emissions, by replacing a chip in a Pri. level system chip into an Adv. level chip, the production carbon emission will go up from 75 kg to 383 kg, which is a small change in the system, and even smaller in the whole vehicle. So, in order for the computer platforms of sold vehicles to keep up with the latest self-driving technology at all times, embedding the chip in it is worth it, and is likely to be more carbon-efficient in the long run.
Fuel vehicles are not perfectly adapted to the smart grid system, and the power generation process will consume a large amount of fuel and will not be able to use lower-emission energy from the grid. Therefore, it is not recommended to equip ICEVs with connected and autonomous driving systems.
6. Outlook
This study calculates the GHG emissions of the smart grid system; yet, further research can still be conducted. On the one hand, the connected and autonomous driving system can further change the fuel consumption or energy consumption of the vehicle during the driving process, and the autonomous driving system enables fuel-saving effects through planned driving programs. From the vehicle fleet point of view, platooning, higher average speed, and smoother traffic flow also have a certain effect on fuel consumption or energy consumption during the usage phase. The effects of these aspects can hardly be realized until the share of CAVs in China reaches a certain level. This research focuses on GHG emissions at the single-vehicle level. Therefore, research will be conducted to analyze the GHG emissions of the passenger car industry considering the penetration rate in the future.
This research concentrated on the carbon emissions of connected and autonomous systems within individual vehicles. Moving forward, the scope of our investigation will expand to the lifecycle emissions changes as influenced by advancements in related industries and technological evolution. Additionally, comprehensive analyses involving technology penetration and vehicle ownership will be undertaken to evaluate the systemic impacts of these technological trends on a national scale. Importantly, an economic–technology evaluation will be explored as a pivotal element that drives the progression of these technologies. This holistic approach will enable a better understanding of the interconnected factors that influence the sustainability and economic feasibility of connected and autonomous vehicle technologies. Continued research in these domains is imperative to provide nuanced insights that could guide policy-making and industry practices towards sustainable automotive innovations [1,2].
Author Contributions
Conceptualization, F.Z.; Methodology, H.Z.; Investigation, H.Z.; Resources, H.H.; Data curation, H.S.; Writing—original draft, H.Z.; Supervision, Z.L. All authors have read and agreed to the published version of the manuscript.
Funding
This research was funded by the National Natural Science Foundation of China, with the funding account number 52272371 and the Beijing Municipal Science & Technology Commission, with the funding account number 9232011.
Institutional Review Board Statement
This research project was conducted in accordance with ethical principles and guidelines. No human subjects were involved in this study. Therefore, there are no issues related to the rights, welfare, or dignity of human participants to report.
Informed Consent Statement
This research project did not involve the participation of human subjects. Therefore, no informed consent was required for this study.
Data Availability Statement
Data will be made available on request.
Conflicts of Interest
The authors declare that they have no known competing financial interests or personal relationships that could have appeared to influence the work reported in this paper.
Abbreviations
| GDP | Gross Domestic Product |
| GHG | Greenhouse gas |
| NEV | New energy vehicle |
| BEV | Battery electric vehicles |
| PHEV | Plug-in hybrid electrical vehicle |
| CAV | Connected autonomous vehicle |
| BEV | Battery electrical vehicle |
| OEM | Original equipment manufacturer |
| GPS | Global positioning system |
| GPU | Graphics processing units |
| TPU | Tensor processing units |
| DA | Driver assistance |
| PA | Partial driving automation |
| CA | Conditional driving automation |
| HA | High driving automation |
| FA | Full driving automation |
| Pri. | Connected and autonomous system that is classified as primary |
| Med. | Connected and autonomous system that is classified as medium |
| Adv. | Connected and autonomous system that is classified as primary |
| LiDAR | Light detection and ranging |
| IC | Integrated circuit |
| Emissions of IC during the production stage (kgCO2eq) | |
| Process of the computer chip (nm) | |
| The emission of CAV hardware system in the production stage | |
| Producing emissions of th material, th component (kgCO2eq/kg) | |
| The weight ratio of th material in th component (%) | |
| The weight of component th (kg) | |
| The number of components th used in the hardware system | |
| Emissions of connected and autonomous driving systems on ICEVs during the using phase (kgCO2eq) | |
| Power consumption of connected and autonomous driving system level (W) | |
| Efficiency for alternators of ICEVs | |
| Life cycle emissions of fuel consumption (kgCO2eq/MJ) | |
| Total time of system operation in using phase (h) | |
| Life cycle emissions of electricity used kgCO2/kWh |
References
- Central People’s Government of the People’s Republic of China. Ministry of Industry and Information Technology Released 2010 Automotive Industry Economic Report. Available online: https://www.gov.cn/govweb/gzdt/2011-01/18/content_1787053.htm (accessed on 28 November 2023).
- Ministry of Industry and Information Technology of the People’s Republic of China. Ministry of Industry and Information Technology released 2022 Automotive Industry Economic Report. Available online: https://www.miit.gov.cn/jgsj/zbys/qcgy/art/2023/art_ff136c2c686a4728a4905e62a7e991d6.html (accessed on 28 November 2023).
- Franzò, S.; Nasca, A. The environmental impact of electric vehicles: A novel life cycle-based evaluation framework and its applications to multi-country scenarios. J. Clean. Prod. 2021, 315, 128005. [Google Scholar] [CrossRef]
- China Petroleum and Chemical Industry Federation. China’s External Oil Dependence Soars to 73%. Available online: http://www.cpcif.org.cn/detail/d6e86fef-4cc9-4e66-815f-d00c2849e4af (accessed on 4 December 2023).
- International Energy Agency. Key Energy Statistics; Annual; International Energy Agenc: Paris, France, 2020. [Google Scholar]
- UNFCCC Secretariat. Report of the Conference of the Parties on Its Twenty-First Session, Held in Paris from 30 November to 13 December 2015; UNFCCC Secretariat: Paris, France, 2016. [Google Scholar]
- Zhao, F.; Liu, X.; Zhang, H.; Liu, Z. Automobile Industry under China’s Carbon Peaking and Carbon Neutrality Goals: Challenges, Opportunities, and Coping Strategies. J. Adv. Transp. 2022, 2022, 5834707. [Google Scholar] [CrossRef]
- International Energy Agency. CO2 Emissions in 2022. Available online: https://www.iea.org/reports/co2-emissions-in-2022 (accessed on 4 November 2023).
- Ternel, C.; Bouter, A.; Melgar, J. Life cycle assessment of mid-range passenger cars powered by liquid and gaseous biofuels: Comparison with greenhouse gas emissions of electric vehicles and forecast to 2030. Transp. Res. Part D Transp. Environ. 2021, 97, 102897. [Google Scholar] [CrossRef]
- Good Car Bad Car. 2023 U.S Auto Sales Figures—By Manufacturer (Automaker Rankings). Available online: https://www.goodcarbadcar.net/2023-us-auto-sales-figures-by-manufacturer/ (accessed on 25 March 2023).
- European Automobile Manufacturers’ Association. EU Car Sales on the up in 2023, with Electric Models Increasingly Popular. Available online: https://www.acea.auto/video/eu-car-sales-on-the-up-in-2023-with-electric-models-increasingly-popular/ (accessed on 14 January 2024).
- Irle, R. Global EV Sales for 2023. Available online: https://www.ev-volumes.com/news/global-ev-sales-for-2022/ (accessed on 25 March 2023).
- Yuan, X.; Zuo, J. Transition to low carbon energy policies in China—From the Five-Year Plan perspective. Energy Policy 2011, 39, 3855–3859. [Google Scholar] [CrossRef]
- Kim, S.-H.; Park, S.-H.; Lim, S.-R. Identification of principal factors for low-carbon electric vehicle batteries by using a life cycle assessment model-based sensitivity analysis. Sustain. Energy Technol. Assess. 2024, 64, 103683. [Google Scholar] [CrossRef]
- Malozyomov, B.V.; Kukartsev, V.V.; Martyushev, N.V.; Kondratiev, V.V.; Klyuev, R.V.; Karlina, A.I. Improvement of Hybrid Electrode Material Synthesis for Energy Accumulators Based on Carbon Nanotubes and Porous Structures. Micromachines 2023, 14, 1288. [Google Scholar] [CrossRef] [PubMed]
- Rahman, M.M.; Thill, J.-C. Impacts of connected and autonomous vehicles on urban transportation and environment: A comprehensive review. Sustain. Cities Soc. 2023, 96, 104649. [Google Scholar] [CrossRef]
- Nunes, A.; Axhausen, K.W. Road safety, health inequity and the imminence of autonomous vehicles. Nat. Mach. Intell. 2021, 3, 654–655. [Google Scholar] [CrossRef]
- Rios-Torres, J.; Malikopoulos, A.A. A Survey on the Coordination of Connected and Automated Vehicles at Intersections and Merging at Highway On-Ramps. IEEE Trans. Intell. Transp. Syst. 2017, 18, 1066–1077. [Google Scholar] [CrossRef]
- Bansal, P.; Kockelman, K.M. Forecasting Americans’ long-term adoption of connected and autonomous vehicle technologies. Transp. Res. Part A Policy Pract. 2017, 95, 49–63. [Google Scholar] [CrossRef]
- Butt, F.A.; Chattha, J.N.; Ahmad, J.; Zia, M.U.; Rizwan, M.; Naqvi, I.H. On the Integration of Enabling Wireless Technologies and Sensor Fusion for Next-Generation Connected and Autonomous Vehicles. IEEE Access 2022, 10, 14643–14668. [Google Scholar] [CrossRef]
- Narayanan, S.; Chaniotakis, E.; Antoniou, C. Shared autonomous vehicle services: A comprehensive review. Transp. Res. Part C Emerg. Technol. 2020, 111, 255–293. [Google Scholar] [CrossRef]
- Howard, D.; Dai, D. Public Perceptions of Self-driving Cars: The Case of Berkeley, California. In Proceedings of the Transportation Research Board 93rd Annual Meeting, Washington, DC, USA, 12–16 January 2014; p. 14-4502. [Google Scholar]
- Loke, S.W. Cooperative Automated Vehicles: A Review of Opportunities and Challenges in Socially Intelligent Vehicles Beyond Networking. IEEE Trans. Intell. Veh. 2019, 4, 509–518. [Google Scholar] [CrossRef]
- Wang, W.; Guo, K.; Cao, W.; Zhu, H.; Nan, J.; Yu, L. Review of Electrical and Electronic Architectures for Autonomous Vehicles: Topologies, Networking and Simulators. Automot. Innov. 2024, 7, 82–101. [Google Scholar] [CrossRef]
- Xia, N.; Yang, C.-S. Vehicular Communications: Standards and Challenges. In Proceedings of the Internet of Vehicles: Technologies and Services for Smart Cities, Kanazawa, Japan, 22–25 November 2017; pp. 1–12. [Google Scholar]
- On-Road Automated Driving Committee. Taxonomy and Definitions for Terms Related to On-Road Motor Vehicle Automated Driving Systems; SAE International: Warrendale, PA, USA, 2014. [Google Scholar]
- National Technical Committee of Auto Standardization. Taxonomy of Driving Automation for Vehicles; National Technical Committee of Auto Standardization: Beijing, China, 2021. (In Chinese) [Google Scholar]
- J3016_202104; Definitions for Terms Related to Driving Automation Systems for On-Road Motor Vehicles. SAE International: Warrendale, PA, USA, 2021.
- Technology Energy Saving and New Energy Vehicles Strategic Advisory Committee. Technology Roadmap for Energy Saving and New Energy Vehicles 2.0, 2nd ed.; Technology Energy Saving and New Energy Vehicles Strategic Advisory Committee: Beijing, China, 2021. (In Chinese) [Google Scholar]
- Touchton, B.; Galluzzo, T.; Kent, D.; Crane, C. Perception and Planning Architecture for Autonomous Ground Vehicles. Computer 2006, 39, 40–47. [Google Scholar] [CrossRef]
- Ignatious, H.A.; Sayed, H.-E.; Khan, M. An overview of sensors in Autonomous Vehicles. Procedia Comput. Sci. 2022, 198, 736–741. [Google Scholar] [CrossRef]
- Klette, R. Concise Computer Vision; Springer: London, UK, 2014. [Google Scholar]
- Fu, M.; Zhu, M.; Yang, Y.; Song, W.; Wang, M. LiDAR-based vehicle localization on the satellite image via a neural network. Robot. Auton. Syst. 2020, 129, 103519. [Google Scholar] [CrossRef]
- Bojarski, M.; Testa, D.D.; Dworakowski, D.; Firner, B.; Flepp, B.; Goyal, P.; Jackel, L.D.; Monfort, M.; Muller, U.; Zhang, J.; et al. End to End Learning for Self-Driving Cars. arXiv 2016, arXiv:1604.07316. [Google Scholar]
- Wang, S.; Jia, D.; Weng, X.J.A. Deep Reinforcement Learning for Autonomous Driving. arXiv 2018, arXiv:1811.11329. [Google Scholar]
- Rajamani, R. Vehicle Dynamics and Control; Springer Science & Business Media: Berlin, Germany, 2012. [Google Scholar]
- Zeadally, S.; Hunt, R.; Chen, Y.-S.; Irwin, A.; Hassan, A. Vehicular ad hoc networks (VANETS): Status, results, and challenges. Telecommun. Syst. 2012, 50, 217–241. [Google Scholar] [CrossRef]
- T/CSAE 53-2017; Cooperative Intelligent Transportation System; Vehicular Communication; Application Layer Specification and Data Exchange Standard. China Society of Automotive Engineers: Beijing, China, 2017.
- Muckenhuber, S.; Softic, K.; Fuchs, A.; Stettinger, G.; Watzenig, D. Sensors for Automated Driving. In Autonomous Vehicles: Business, Technology and Law; Van Uytsel, S., Vasconcellos Vargas, D., Eds.; Springer Nature: Singapore, 2021; pp. 115–146. [Google Scholar]
- Wang, M.; Elgowainy, A.; Lu, Z.; Bafana, A.; Benavides, P.T.; Burnham, A.; Cai, H.; Dai, Q.; Gracida, U.; Hawkins, T.R.; et al. Greenhouse Gases, Regulated Emissions, and Energy Use in Technologies Model; Computer software; 9 October 2020. Available online: https://www.osti.gov/doecode/biblio/43903 (accessed on 25 April 2024).
- Baitz, M.; Colodel, C.; Kupfer, T.; Pflieger, J.; Schuller, O.; Hassel, F.; Kokborg, M.; Köhler, A.; Stoffregen, A. GaBi Database & Modelling Principles 2012. Available online: http://gabi-6-lci-documentation.gabi-software.com/xml-data/external_docs/GaBiModellingPrinciples.pdf (accessed on 6 April 2024).
- Zhang, H.; Zhao, F.; Hao, H.; Liu, Z. Comparative Analysis of Life Cycle Greenhouse Gas Emission of Passenger Cars: A Case Study in China. SSRN 2022, 1–21. [Google Scholar] [CrossRef]
- He, P.; Feng, H.; Chhipi-Shrestha, G.; Hewage, K.; Sadiq, R. Life Cycle Assessment of e-Waste—Waste Cellphone Recycling. In Electronic Waste; Wiley: Hoboken, NJ, USA, 2022; pp. 231–253. [Google Scholar]
- Ou, S.; Yu, R.; Lin, Z.; Ren, H.; He, X.; Przesmitzki, S.; Bouchard, J. Intensity and daily pattern of passenger vehicle use by region and class in China: Estimation and implications for energy use and electrification. Mitig. Adapt. Strateg. Glob. Change 2019, 25, 307–327. [Google Scholar] [CrossRef]
- Singh, A. Vision-RADAR fusion for Robotics BEV Detections: A Survey. In Proceedings of the 2023 IEEE Intelligent Vehicles Symposium (IV), Anchorage, AK, USA, 4–7 June 2023; pp. 1–7. [Google Scholar]
- Sun, P.; Kretzschmar, H.; Dotiwalla, X.; Chouard, A.; Patnaik, V.; Tsui, P.; Guo, J.; Zhou, Y.; Chai, Y.; Caine, B.; et al. Scalability in Perception for Autonomous Driving: Waymo Open Dataset. In Proceedings of the 2020 IEEE/CVF Conference on Computer Vision and Pattern Recognition (CVPR), Seattle, WA, USA, 13–19 June 2020; pp. 2443–2451. [Google Scholar]
- Baidu Apollo. Baidu Apollo Self Driving Openness White Paper 1.0; Baidu Apollo: Beijing, China, 2023; p. 27. [Google Scholar]
- Huawei, A. AITO M7. Available online: https://aito.auto/model/m7/ (accessed on 4 December 2023).
- Tesla. Model 3 Lease starting at $329/mo*. Available online: https://www.tesla.com/model3 (accessed on 21 December 2023).
- Flir, T. Chameleon3 USB3. Available online: https://www.flir.cn/products/chameleon3-usb3/ (accessed on 6 December 2023).
- Continental. Autonomous Mobility ARS510. Available online: https://www.continental-automotive.com/en/components/radars/long-range-radars/advanced-radar-sensor-ars51x.html (accessed on 1 October 2023).
- Hesai. FT120 Solid State Ultra Wide Angle Near Range Lidar. Available online: https://www.hesaitech.com/cn/zh/FT120 (accessed on 10 October 2023).
- Bosch. Ultrasonic Sensor. Available online: https://www.bosch-mobility.com/en/solutions/sensors/ultrasonic-sensor/ (accessed on 13 October 2023).
- NVIDIA. NVIDIA DRIVE End-to-End Platform Designed for the Software-Defined Automobile. Available online: https://www.nvidia.cn/self-driving-cars/ (accessed on 4 January 2024).
- Gawron, J.H.; Keoleian, G.A.; De Kleine, R.D.; Wallington, T.J.; Kim, H.C. Life Cycle Assessment of Connected and Automated Vehicles: Sensing and Computing Subsystem and Vehicle Level Effects. Environ. Sci. Technol. 2018, 52, 3249–3256. [Google Scholar] [CrossRef] [PubMed]
- Krishnan, N.; Boyd, S.; Somani, A.; Raoux, S.; Clark, D.; Dornfeld, D. A Hybrid Life Cycle Inventory of Nano-Scale Semiconductor Manufacturing. Environ. Sci. Technol. 2008, 42, 3069–3075. [Google Scholar] [CrossRef]
- Rizvi, S.; Diebold, A.C.; Dhudshia, V.H.; Sun, Y.-P.; Foster, L.W.; Baumann, R.; Wood, S.C.; Barna, G.G. Handbook of Semiconductor Manufacturing Technology; Nishi, Y., Doering, R., Eds.; CRC Press: Boca Raton, FL, USA, 2008. [Google Scholar]
- Boyd, S.; Horvath, A.; Dornfeld, D. Life-cycle assessment of computational logic produced from 1995 through 2010. Environ. Res. Lett. 2010, 5, 014011. [Google Scholar] [CrossRef]
Figure 1.
Greenhouse gas emissions by component in the production stage.
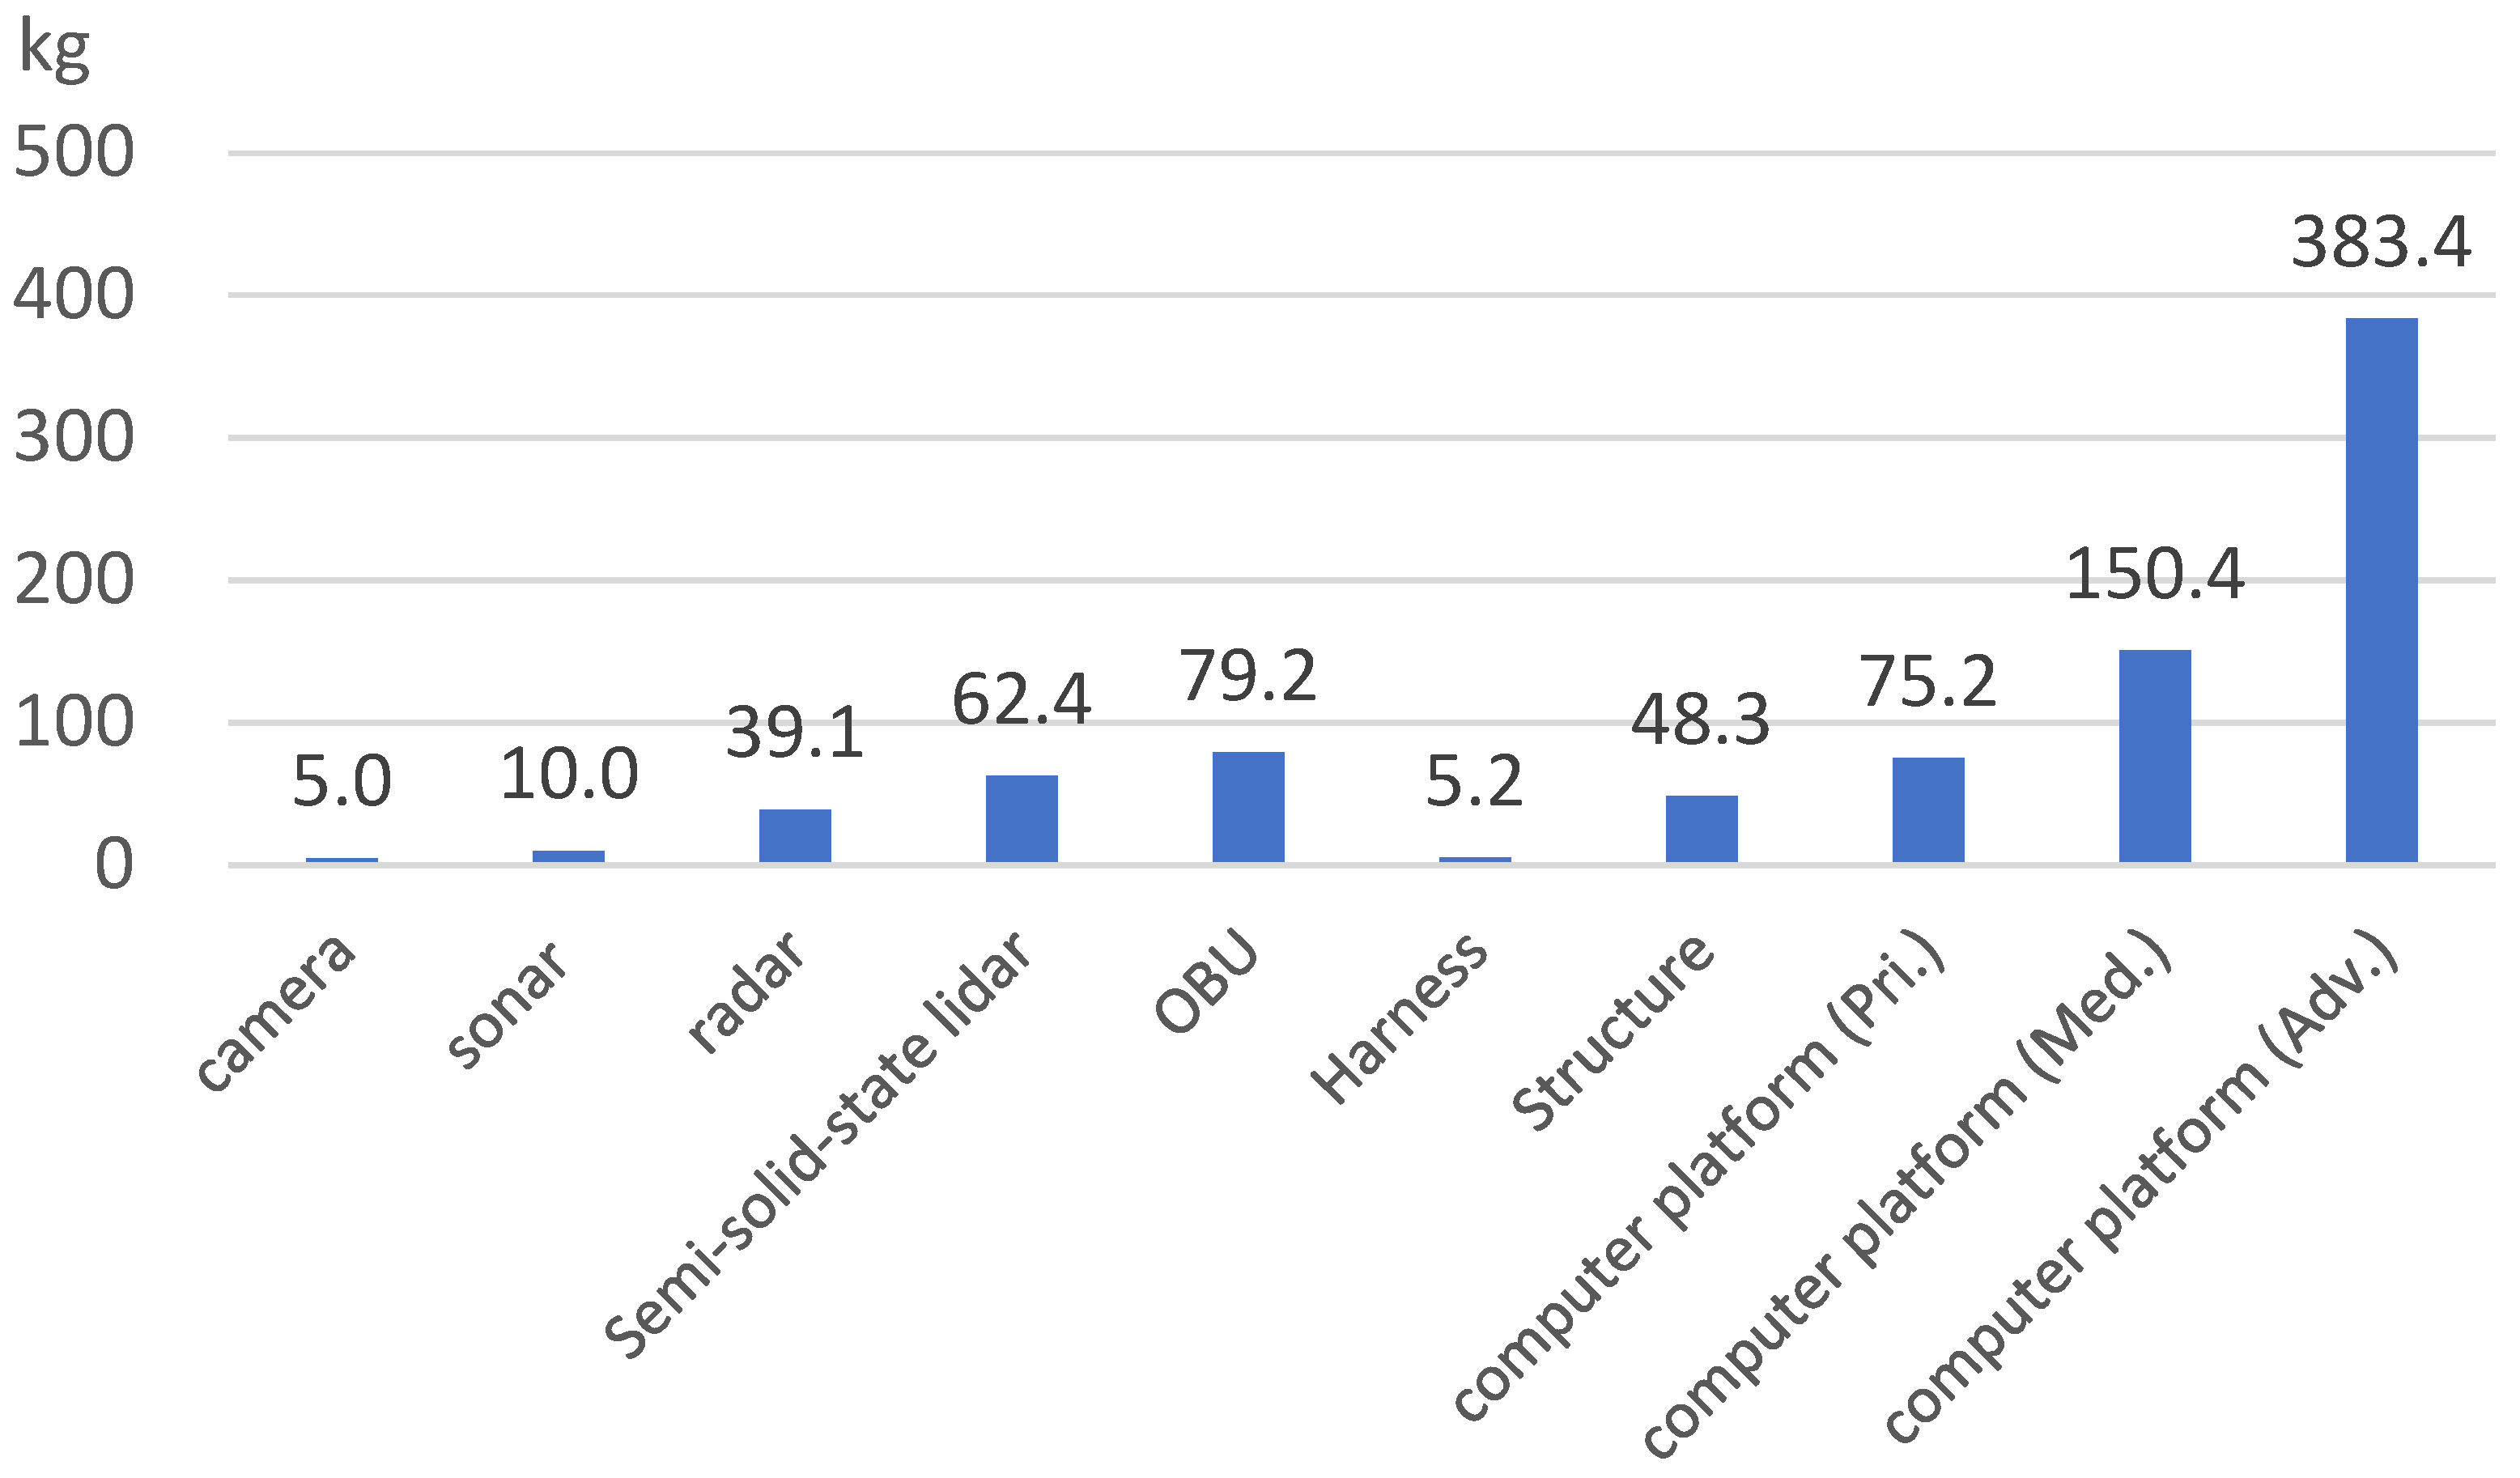
Figure 2.
Emissions’ distribution of connected and autonomous driving system in the production phase.
Figure 2.
Emissions’ distribution of connected and autonomous driving system in the production phase.
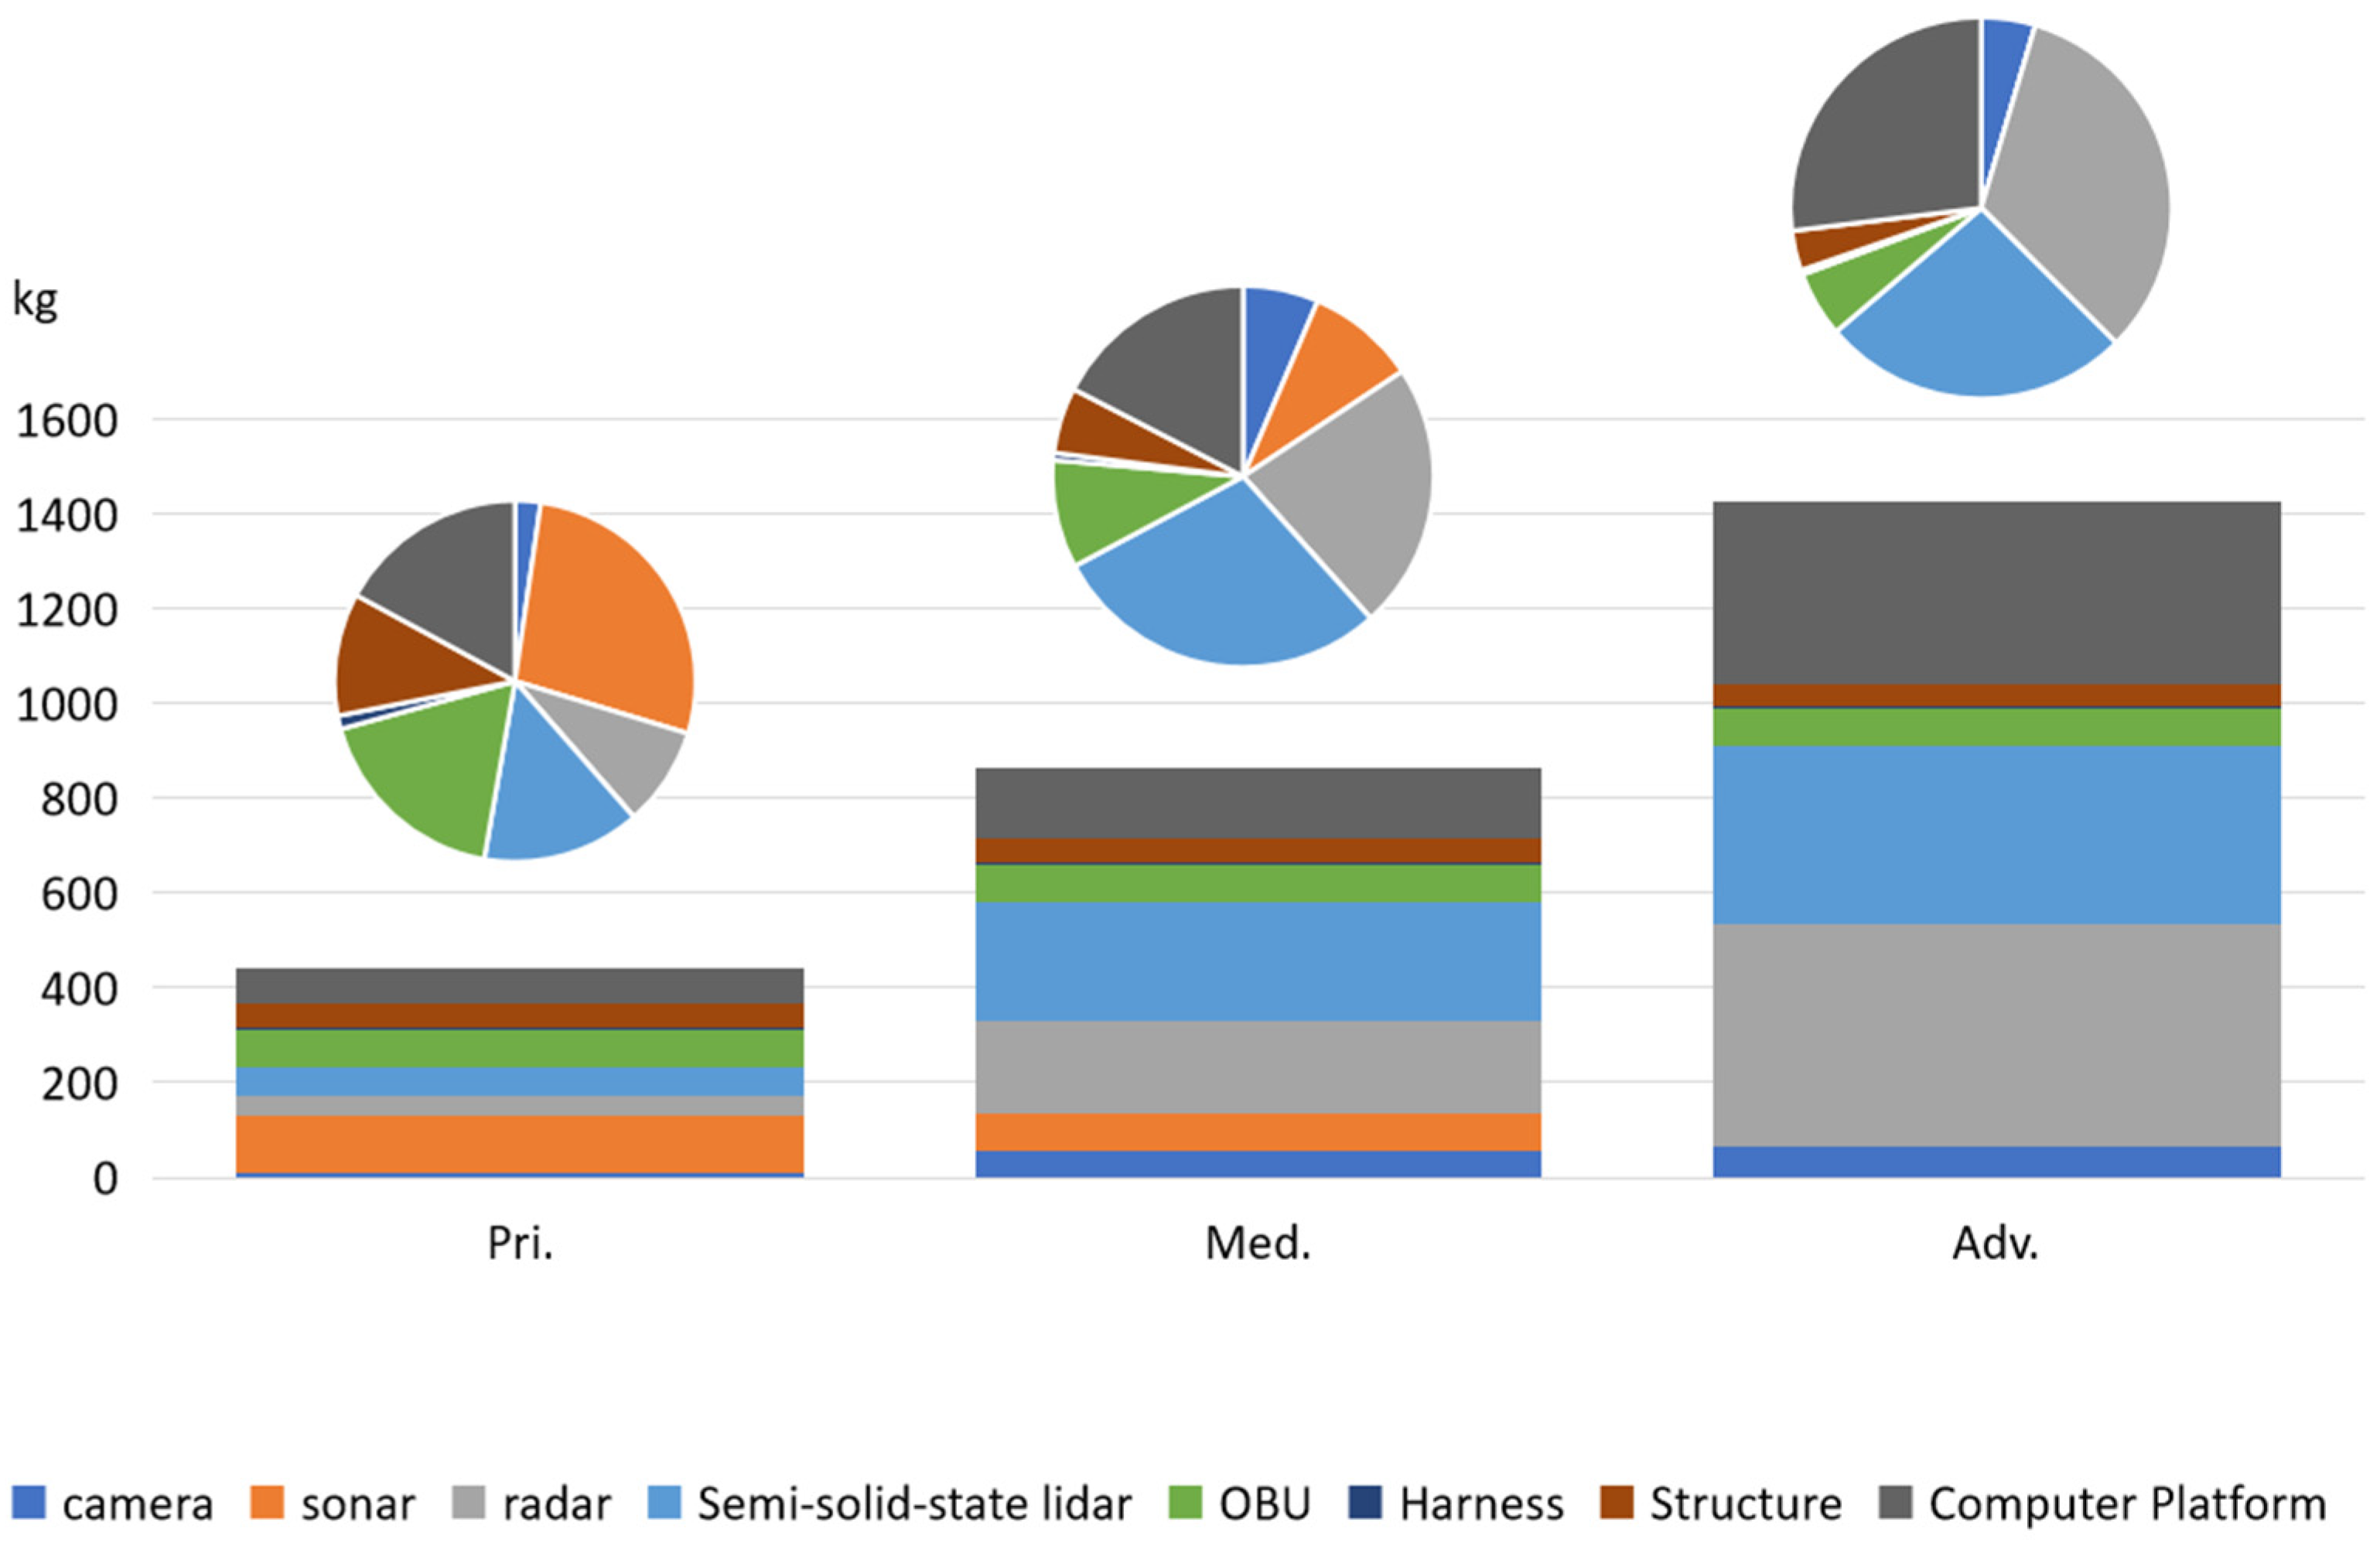
Figure 3.
Power consumption and GHG emissions in the usage phase of NEV and ICEV systems. (a) Energy consumption of each component (Watt). (b) Emissions of connected and autonomous driving systems in NEVs or ICEVs in the usage phase (kg).
Figure 3.
Power consumption and GHG emissions in the usage phase of NEV and ICEV systems. (a) Energy consumption of each component (Watt). (b) Emissions of connected and autonomous driving systems in NEVs or ICEVs in the usage phase (kg).
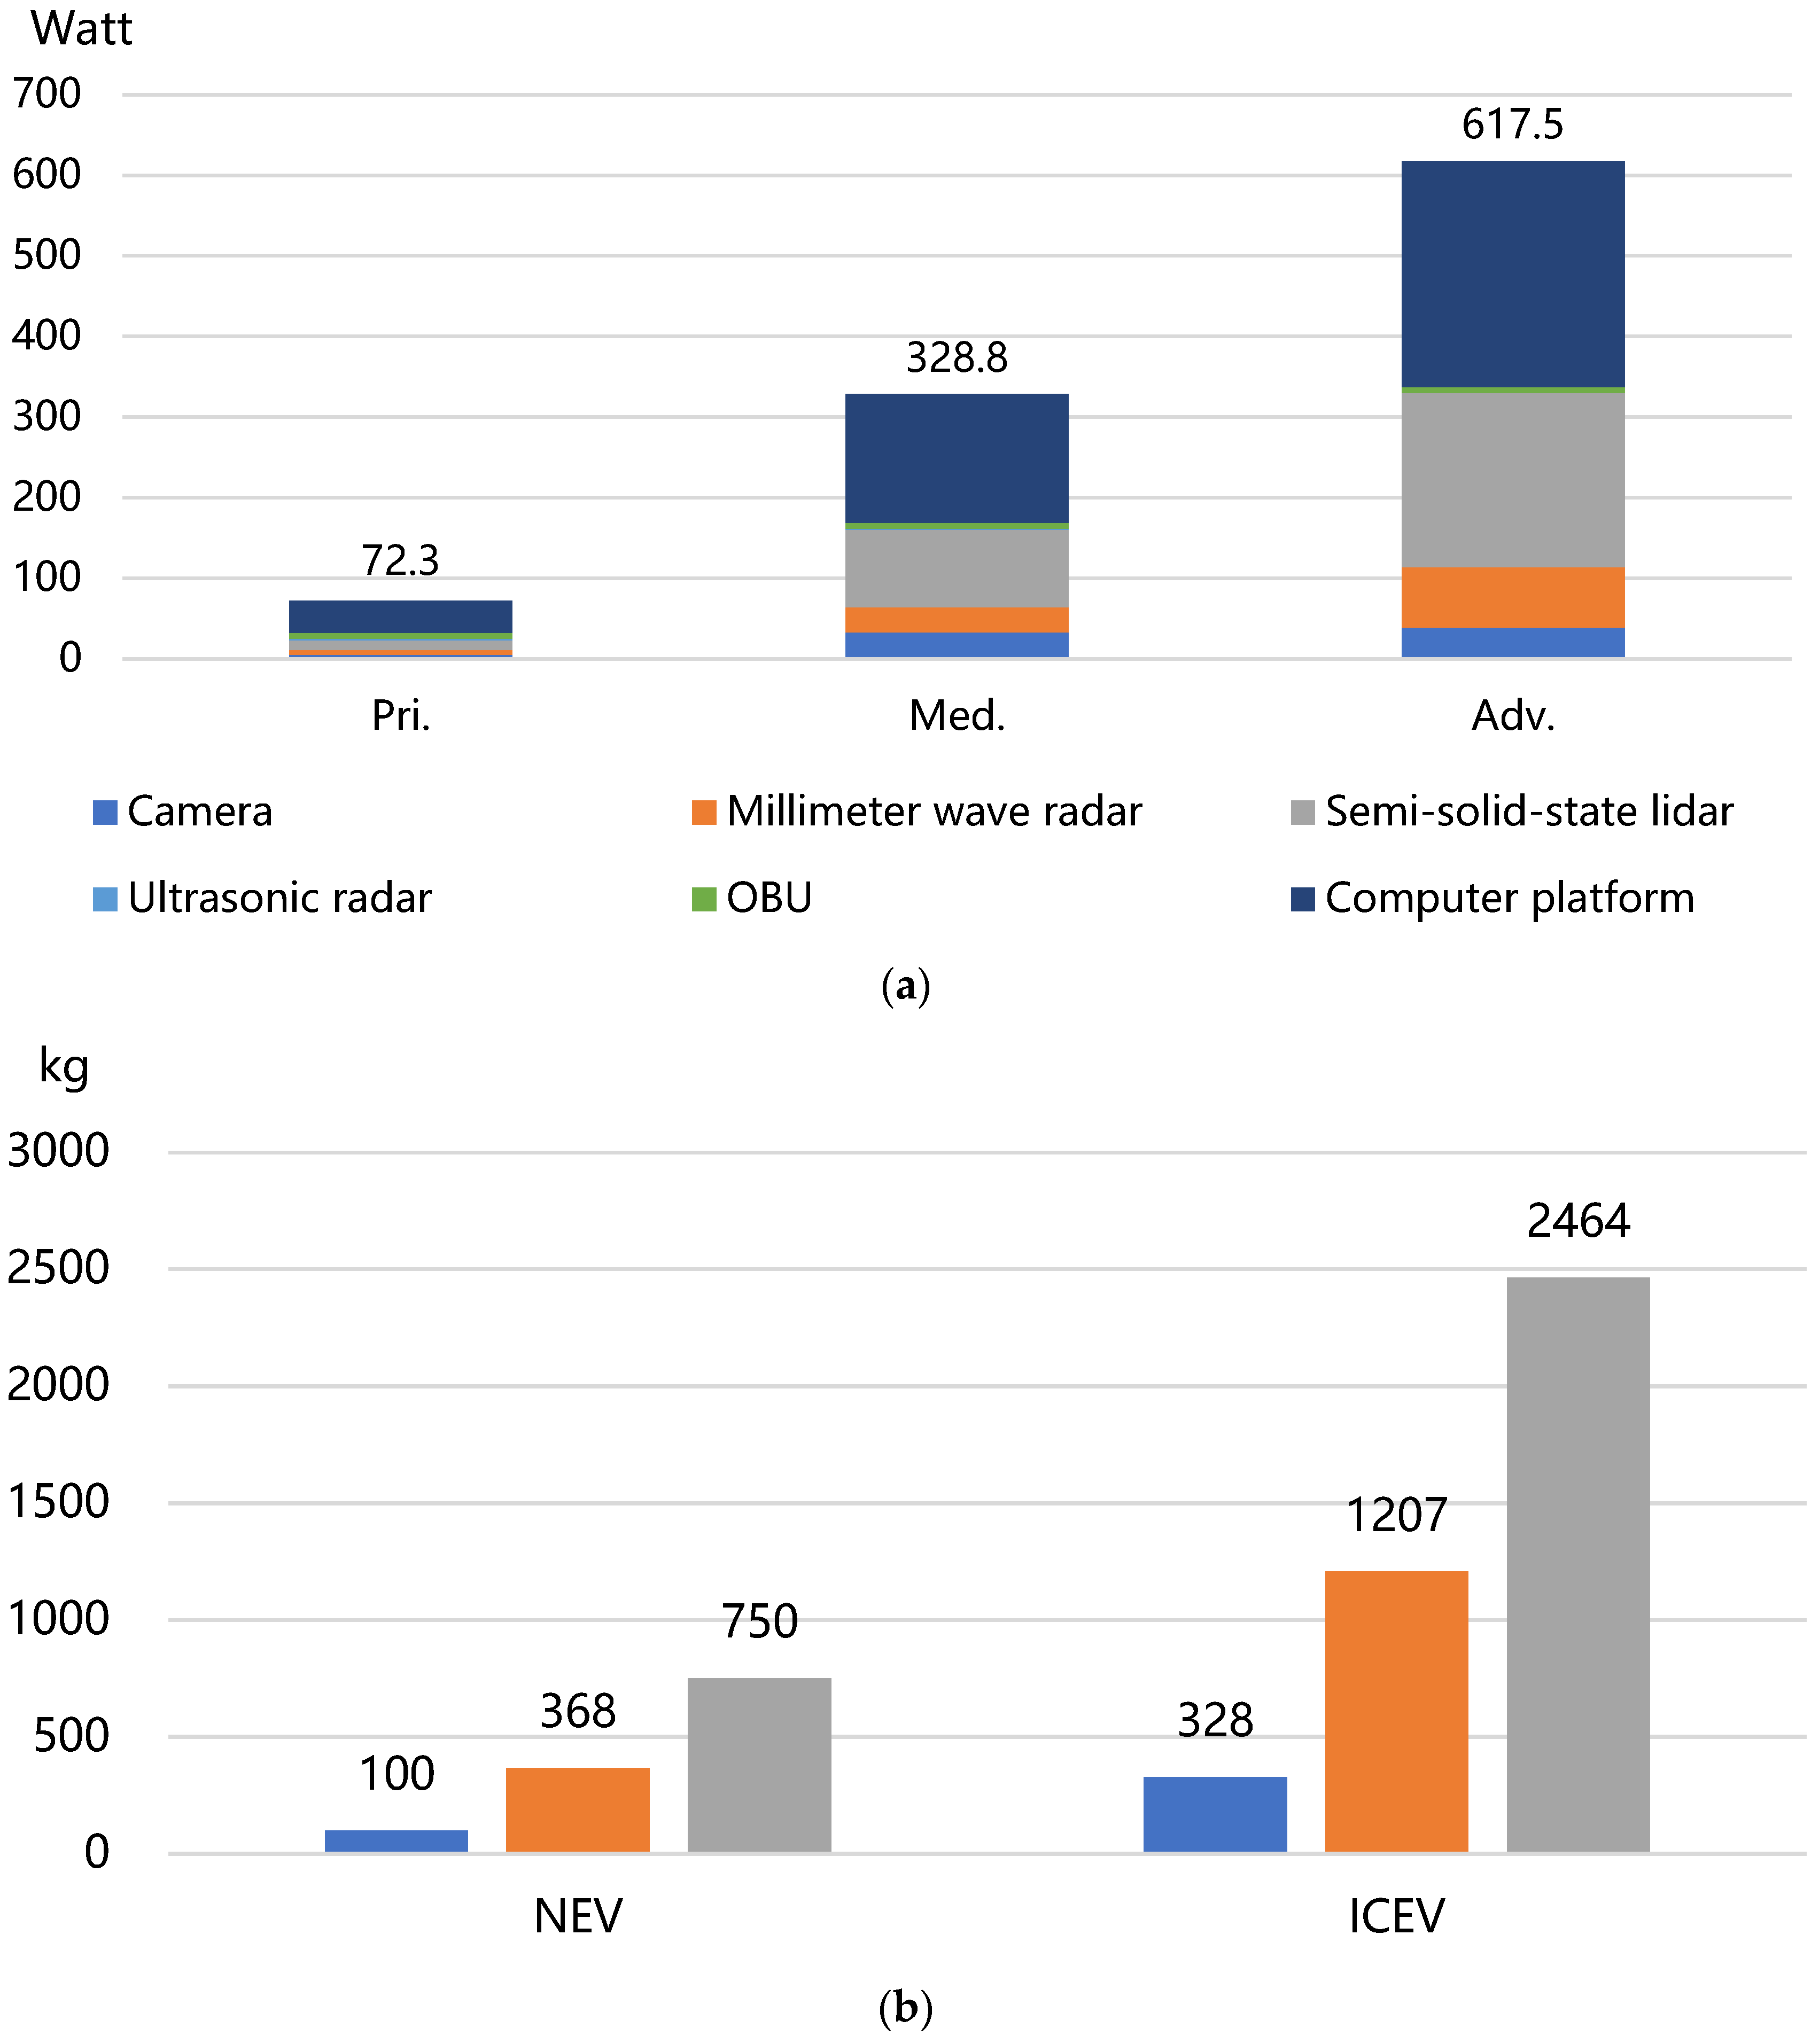
Figure 4.
Life cycle GHG emissions of connected and autonomous driving systems (NEV).

Table 1.
China and SAE’s classification of connected autonomous vehicles functions.
| National Technical Committee of Auto Standardization (China) [27] | SAE International [28] |
|---|---|
| L0: Emergency assistance | Level 0 (L0): No Driving Automation |
| L1: Partial driver assistance | Level 1 (L1): Driver Assistance (DA) |
| L2: Combined driver assistance | Level 2 (L2): Partial Driving Automation (PA) |
| L3: Conditionally automated driving | Level 3 (L3): Conditional Driving Automation (CA) |
| L4: Highly automated driving | Level 4 (L4): High Driving Automation (HA) |
| L5: Fully automated driving | Level 5 (L5): Full Driving Automation (FA) |
Table 2.
Autonomous driving solutions from mainstream vehicle companies and research organizations.
| Company | Name of Solution or Vehicle Model | Level | Camera | Radar | Lidar | Ultrasonic Radar | Computing Chipset or SOC |
|---|---|---|---|---|---|---|---|
| Waymo [45,46] (Mountain View, CA, USA) | waymo driver | Adv. | 29 | 6 | 5 | 0 | Self-developed chip |
| Apollo [47] (Beijing, China) | Apollo City Driving Max | Med. | 11 | 5 | 2 | 12 | Freescale i.MX 6D/6Q, STM32F103 |
| Apollo Highway Driving Pro | Pri. | 9 | 5 | 0 | 12 | Freescale i.MX 6D/6Q, STM32F103 | |
| Huawei [48] (Shenzhen, China) | AITO M7 | Pri. | 11 | 3 | 1 | 12 | Huawei MDC610 |
| Tesla [49] (Austin, TX, USA) | Model 3 | Med. | 8 | 12 | 0 | 0 | FSD Chip |
| GM (Detroit, MI, USA) | Cruise | Med. | 14 | 8 | 5 | 10 | Snapdrago SA8540P SoC, SA9000P |
| XPENG (Beijing, China) | P7 | Med. | 13 | 5 | 0 | 12 | Xavier |
| Audi (Ingolstadt, Germany) | A8 | Med. | 6 | 5 | 1 | 12 | zFAS |
| Benz (Stuttgart, Germany) | EQS | Med. | 6 | 5 | 1 | 12 | Xavier |
| Li Auto (Beijing, China) | L9 | Pri. | 11 | 1 | 1 | 12 | Orin-X |
| Nio (Shanghai, China) | ES7 | Pri. | 11 | 5 | 1 | 12 | Orin (×4) |
| BMW (Munich, Germany) | iX3 | Pri. | 8 | 5 | 0 | 12 | Mobileye EyeQ4 |
Table 3.
List of autonomous driving hardware systems.
| Components | Number | Average Power | Weight | Refer | ||||
|---|---|---|---|---|---|---|---|---|
| Pri. | Med. | Adv. | Pri. | Med. | Adv. | (g) | ||
| Camera | 6 | 11 | 13 | 2.5 | 3 | 3 | 36/27.9 | FLIR Blackfly (Teledyne FLIR, Goleta, CA, USA), Chameleon3 [50], ORYX (Saint-Jean-de-Moirans, France) |
| Millimeter-wave radar | 1 | 5 | 12 | 6.25 | 6.25 | 6.25 | 140 | Continental (Hannover, Germany) ARS441, ARS510 [51] |
| Solid-state LiDAR | 1 | 4 | 6 | 12 | 24 | 36 | 620 | Hesai (Shanghai, China) FT120 [52] |
| Ultrasonic radar | 12 | 8 | 0 | 0.13 | 0.13 | 0.13 | 50 | Bosch (Gerlingen-Schillerhöhe, Germany) Ultrasonic [53] |
| OBU | 1 | 1 | 1 | 7.5 | 7.5 | 7.5 | 420 | Confidentiality is required |
| computing platform | 1 | 1 | 1 | 40 | 140 | 200 | 400 | NVDIA (Santa Clara, CA, USA) [54] |
| Harness | 1 | - | 1000 | |||||
| Structure | 1 | - | 6000 | |||||
Table 4.
Materials distribution of connected and autonomous driving system hardware (ratio numbers are the weight share of material in each component).
Table 4.
Materials distribution of connected and autonomous driving system hardware (ratio numbers are the weight share of material in each component).
| Material | Steel | Cast Iron | Aluminum | Copper | Glass | Plastic | Rare Earth | Electronics |
|---|---|---|---|---|---|---|---|---|
| camera | 0% | 0% | 0% | 0% | 9% | 45% | 0% | 46% |
| sonar | 0% | 0% | 0% | 0% | 0% | 50% | 0% | 50% |
| radar | 0% | 0% | 0% | 0% | 0% | 30% | 0% | 70% |
| Mechanical LiDAR | 0% | 7% | 61% | 6% | 5% | 7% | 6% | 5% |
| Semi-solid-state LiDAR | 0% | 0% | 0% | 0% | 19% | 70% | 1% | 10% |
| OBU | 0% | 0% | 0% | 8% | 0% | 45% | 0% | 47% |
| Computer Harness | 0% | 2% | 70% | 6% | 0% | 4% | 2% | 16% |
| Structure | 0% | 0% | 0% | 100% | 0% | 0% | 0% | 0% |
Disclaimer/Publisher’s Note: The statements, opinions and data contained in all publications are solely those of the individual author(s) and contributor(s) and not of MDPI and/or the editor(s). MDPI and/or the editor(s) disclaim responsibility for any injury to people or property resulting from any ideas, methods, instructions or products referred to in the content. |
© 2024 by the authors. Licensee MDPI, Basel, Switzerland. This article is an open access article distributed under the terms and conditions of the Creative Commons Attribution (CC BY) license (https://creativecommons.org/licenses/by/4.0/).
Share and Cite
MDPI and ACS Style
Zhang, H.; Zhao, F.; Song, H.; Hao, H.; Liu, Z. A Greenhouse Gas Footprint Analysis of Advanced Hardware Technologies in Connected Autonomous Vehicles. Sustainability 2024, 16, 4090. https://doi.org/10.3390/su16104090
AMA Style
Zhang H, Zhao F, Song H, Hao H, Liu Z. A Greenhouse Gas Footprint Analysis of Advanced Hardware Technologies in Connected Autonomous Vehicles. Sustainability. 2024; 16(10):4090. https://doi.org/10.3390/su16104090
Chicago/Turabian StyleZhang, Haoyi, Fuquan Zhao, Haokun Song, Han Hao, and Zongwei Liu. 2024. "A Greenhouse Gas Footprint Analysis of Advanced Hardware Technologies in Connected Autonomous Vehicles" Sustainability 16, no. 10: 4090. https://doi.org/10.3390/su16104090
Note that from the first issue of 2016, this journal uses article numbers instead of page numbers. See further details here.