Spatiotemporal Patterns and Driving Factors of Green and Low-Carbon Urbanization in the Yangtze River Delta Region, China

1
College of Environmental & Resource Sciences, Zhejiang University, Hangzhou 310058, China
2
Zhejiang Ecological Civilization Academy, Anji 313300, China
*
Author to whom correspondence should be addressed.
Sustainability 2024, 16(10), 4006; https://doi.org/10.3390/su16104006
Submission received: 20 March 2024
/
Revised: 29 April 2024
/
Accepted: 9 May 2024
/
Published: 10 May 2024
Abstract
:Green and low-carbon urbanization (GLCU) is as a key objective within the realm of urban sustainable development. The extent of coordination between urbanization and low-carbon development determines the level of GLCU. However, the complex driving mechanism of GLCU has not garnered the required attention within the existing literature. In light of this, the present paper introduces a multi-dimensional comprehensive evaluation framework aimed at assessing the level of GLCU. Specifically, it delves into the spatial–temporal characteristics and driving forces that underpin GLCU. The results indicate that the level of GLCU in the YRD region increased rapidly from 2005 to 2020, evolving from low coordination to moderate coordination. Yet, the trade-off between urbanization and low-carbon development still exists. The surge in population density and economic prosperity emerged as the principal positive drivers of GLCU, while the carbon emissions intensity exerted a negative influence. Furthermore, the effect of industrial structure shifted from a positive driver to a negative one. The effects of these drivers upon GLCU varied at different urbanization stages and determined the patterns of urban development, indicating that policies for sustainable development should be tailored to cities at different urbanization stages. These findings can provide useful information for policy makers and urban planners in managing and promoting urban sustainable development.
1. Introduction
Urbanization plays a pivotal role in the trajectory of human development [1]. It is projected that almost 60% of the global population will reside in urban areas by 2030 [2]. However, characterized by densely packed populations and unsystematic urban sprawl, urbanization has triggered a series of challenges including resource shortages, environmental pollution, and ecological degradation [3,4]. These have exerted immense pressure on the ecological system and regional sustainable development. Though cities occupy a mere 3% of the planet’s land area, they play a substantial role in the phenomenon of global climate change, accounting for 60–80% of global energy consumption and over 70% of greenhouse gas emissions [5]. Thus, exploring green and low-carbon paths to urbanization is crucial to urban sustainable development.
In light of the escalating risks posed by climate change, the United Nations General Assembly has adopted important agreements like the Kyoto Protocol (1997), and the Paris Agreement (2015), among others, thereby fostering a deeper sense of international cooperation. China, as a prominent contributor to global greenhouse gas emissions, has actively sought novel approaches to achieve a harmonious equilibrium between ecological progress and economic development [6]. As the major sources of global carbon emissions, cities are key areas for curbing carbon emissions. Since 2010, China has launched three phases of low-carbon initiatives across six provinces and eighty-one cities [7]. The Chinese government proposed a new-type urbanization plan in 2014, advocating the adoption of green lifestyles and eco-friendly urban development methods.
In recent decades, the concept of low-carbon development (LCD) has been intricately woven into the field of urban sustainable development. To address the impact of urbanization on LCD, numerous enquiries have been conducted [8]. Various modeling approaches such as the STIRPAT model [9], the LMDI model [10], the GWR model [11], and the panel threshold regression model [12] have been utilized to explore the impact of urbanization on carbon emissions. Li et al. adopted the spatial lag panel Tobit model to probe the correlation between urbanization and CO2 emission efficiency [13]. Utilizing the LMDI model, Shen et al. divided the components affecting carbon emissions into five factors in a specific case study involving Beijing [14].
The analysis of dynamic interaction mechanisms between urbanization and LCD, using system theory, can profoundly reveal the sustainable development of cities. So far, most researches have predominantly concentrated on examining the relationship between urbanization and several aspects, including the ecological environment, ecosystem services, and carbon emissions [15,16,17]. For instance, Liu et al. carried out a comprehensive examination of the spatiotemporal coordination between urbanization and environmental systems, using coupling coordination degree (CCD) and decoupling models [18]. Tian et al. evaluated the spatiotemporal coupling interactions of urbanization and ecosystem services [19]. However, limited attention has been directed towards the direct coordination relationship between urbanization and LCD. Song et al. explored how LCD could be achieved amid rapid urbanization by creating a CCD model based on provincial-level data [20]. Li et al. measured the coupling coordination degree between new-type urbanization and LCD and its spillover effect in the urban agglomeration of the Yangtze River Delta [21]. While most existing studies regarded urbanization and LCD as independent systems, the reality is that cities operate as an open and complex system. Given this intricate interaction, it is imperative to analyze the interrelationship between urbanization and LCD from a more comprehensive standpoint [22]. Analyzing the correlation between the subsystems of urbanization and LCD helps to reveal their internal mechanisms. In addition, a large number of results generated by driving factor analysis provides a challenge for policymakers, while cluster analysis of cities is more conducive to the formulation and implementation of targeted policies [23].
The Yangtze River Delta (YRD) is widely recognized as one of China’s most highly urbanized regions, and it plays a pivotal role in the country’s economic and social progress [24,25]. However, this rapid urbanization has brought forth challenges such as environmental pollution, resource shortages, and substantial pressures on greenhouse gas emission reduction [26]. In order to achieve sustainable development, it is essential to adopt a green and low-carbon urbanization (GLCU) pattern. Taking the YRD region as a case study, this study evaluates the development level of GLCU and delves into its driving factors. The core aims of this study are as follows: (1) to conduct an evaluation framework to explore the spatial and temporal pattern of GLCU in the YRD region; (2) to evaluate the interaction between urbanization and LCD; and (3) to explore the driving mechanism of GLCU in the urbanization process.
Compared to earlier research, this research involved the construction of a multi-dimensional comprehensive framework for evaluating the coupling coordination relationship between urbanization and low-carbon development and discussion of the trade-off and synergy relationship at the subsystem level between them as well. In addition, the heterogeneity of the drivers of the coupling coordination degree of urbanization and low-carbon development in different categories of cities was explored, providing targeted information for making policies instrumental for urban sustainable development.
The remaining parts of this paper are organized as follows. Section 2 details the materials and methods. An introduction of the study area and the models for GLCU assessment are presented in this part. Then, Section 3 presents the results and discussion. The conclusions and policy implications of this paper are provided in Section 4.
2. Materials and Methods
2.1. Study Area
The YRD region, situated in eastern China, comprises Shanghai, Jiangsu, Zhejiang, and Anhui with a total of 41 cities (Figure 1). Dominated by plains and hills, the YRD region belongs to a subtropical monsoon climate with four distinct seasons, possessing a superior geographical location and resource conditions. As one of the three major urban agglomerations in China, it boasts a large economic aggregate, a comprehensive industrial system, remarkable openness, and a robust capacity for innovation [27]. Although it accounts for about 17% of the national population, it contributes nearly 25% of China’s entire GDP. The urbanization rate in the YRD region developed exponentially when the urban population share soared from 50.5% in 2005 to an impressive 70.8% in 2020 [28]. Urbanization promoted socio-economic development, albeit accompanied by challenges like local resource shortages and environmental pollution due to population growth and sprawling land use. In the meantime, the rapid socio-economic development triggered considerable energy consumption, generating a large quantity of CO2 emissions and imposing high pressures on greenhouse gas emission reductions in the YRD region [29]. Green and low-carbon urbanization is perceived as a crucial approach to achieving sustainable and high-quality development [30]. Thus, exploring a robust implementation framework for GLCU is the basis for formulating regional sustainable development strategies.
2.2. Methods and Models
2.2.1. Evaluation Framework of GLCU
There are complex interactions between urbanization and LCD. On the one hand, urbanization triggers population growth and land expansion, leading to an increase in energy consumption and urban carbon emissions [31]. On the other hand, urbanization provides an internal impetus and development foundation for LCD by improving the economic level and infrastructure construction [17]. LCD creates a competitive low-carbon industrial foundation for urbanization by upgrading the industrial structure and reducing energy consumption [32]. At the same time, ecological construction and green methods of production and lifestyles contribute to the improvement of the living environment and provide a material basis for the healthy and stable development of urbanization [33]. The level of green and low-carbon urbanization is usually measured by the coordination between urbanization and LCD. To examine the interplay between urbanization and LCD, we established a multi-dimensional evaluation framework and engaged in an evaluation of coordination degree using a coupling coordination degree (CCD) model (Figure 2).
Urbanization is an ongoing and dynamic process, which is evident in population agglomeration, alterations in spatial pattern, and shifts in socio-economic structure. To characterize the level of urbanization, a comprehensive set of 13 indicators was meticulously selected to measure four characteristics of urbanization (i.e., land use urbanization, population urbanization, economic urbanization, and social urbanization). This selection was made in alignment with relevant research findings and the accessibility of data [34,35] (Table 1). Low-carbon development transcends the mere mitigation of carbon emissions during periods of development. In essence, it entails improving energy efficiency and building a sustainable ecosystem in the context of socio-economic progress [36]. On the basis of the concept of LCD, an evaluation index for the LCD pattern was formulated into five dimensions, including carbon emissions, carbon sink, environmental governance, green lifestyle, and green production (Table 1). Reducing carbon emissions and enhancing the capacity of carbon sinks are the starting points for LCD. Environmental governance measures the government’s ability and effectiveness in environmental protection, which provides support for LCD. A green lifestyle is a lifestyle that utilizes resources efficiently and produces less waste in the living process, and green production is an environmentally friendly production mode, both of which are important manifestations of LCD.
To eliminate the influence of differences in dimension, magnitude, and sign between indicators, the data were standardized using the min–max normalization method [41]. The formula is as follows:
Positive indicator:
Negative indicator:
is the normalized value of the indicator j of city i in the θth year, stands for the original value, and and represent the maximum and minimum values of the indicator j in all of the cities and years. All the index values are within the scope of [0,1] after standardized processing.
The entropy weight method was employed to determine the weights of each indicator. As an objective weighting method known for its high precision and objectivity, the entropy method finds extensive applications across diverse evaluation domains [42]. The main steps of the entropy weight method are as follows:
Calculate the proportion of the indicator j of city i in the θth year:
where r represents the total number of years and n is the number of cities.
Calculate the entropy value of indicator j:
Calculate the information utility value of indicator j:
Calculate the weight of indicator j:
where m represents the total number of indicators. The results of the weights are presented in Table 1.
The comprehensive indices of UL or LCD of city i in the θth year are calculated using the weighted summation method:
2.2.2. Coordination Relationship Analysis
The degree of coordination between the urbanization level (UL) and LCD was measured using the coupled coordination degree (CCD) model. The CCD model, which incorporates the development level and the interrelationship between systems [43,44], is calculated as follows:
where C represents the coupling degree between UL and LCD, with values ranging from 0 to 1; U1 and U2 represent the index values of UL and LCD, respectively; T denotes the extent of comprehensive coordination between UL and LCD; α and β represent the indeterminate coefficients of UL and LCD, respectively, and are set to a uniform value of 1/2 in this study, underscoring the equal significance attributed to UL and LCD; and D denotes the CCD of the UL and LCD system, ranging from 0 to 1.
Based on relevant research results [45,46], we classified the CCD into five levels: uncoordinated (0 ≤ CCD ≤ 0.4), low coordination (0.4 < CCD ≤ 0.6), primary coordination (0.6 < CCD ≤ 0.7), moderate coordination (0.7 < CCD ≤ 0.8), and high coordination (0.8 < CCD ≤ 1).
To gain deeper insights into the interaction between the intrinsic factors of urbanization and LCD, we employed the Pearson correlation coefficient to investigate the synergy and trade-off between these factors. The expression for the Pearson correlation coefficient is as follows:
where xi and yi denote the UL and LCD of each city, respectively; r is the correlation coefficient of variables x and y within the range from −1 to 1. A negative r denotes a trade-off relationship, while a positive r signifies a synergistic relationship [47]. The correlation coefficient was tested using the SPSS pro (https://www.spsspro.com, accessed on 13 July 2023).
2.2.3. Driving Factor Analysis
The variations in the level of socio-economic development and environmental conditions among cities lead to the formation of diverse GLCU patterns [48]. In order to analyze these GLCU patterns in the YRD region, the K-means clustering method was employed based on the time series dataset of CCD [49].
Due to the existence of spatiotemporal heterogeneity, the impact of drivers on GLCU varies over time and space. However, the traditional ordinary least squares (OLS) model and spatial panel model ignore such differences, which may fail to present practically meaningful reference results [11]. In order to explore the spatiotemporal heterogeneous effect of the driving factors, the geographically and temporally weighted regression (GTWR) model was adopted for driving factor analysis. The GTWR model considers both temporal and spatial non-stationarity [50], which can yield precise simulations, thus providing a basis for the implementation of green and low-carbon development strategies in the YRD region.
Global Moran’s I was first utilized to judge the spatial autocorrelation relationship inherent in GLCU. Since Moran’s I can reflect the CCD cluster in space, the GTWR model was employed to simulate the drivers of GLCU [51]. This model was calculated as follows:
where yi denotes the coordination degree of urbanization and LCD for city i; denotes the spatiotemporal coordinate for city i; denotes the intercept coefficients for city i; denotes the local coefficient of the kth driver for city i; xik denotes the explanatory variable of the kth driver for city i; and φi denotes the random error.
Previous studies demonstrate that the development of GLCU is influenced by economic, societal, and ecological dimensions [23,52]. Based on the relevant literature, we selected five possible driving factors, namely population density (inhabitants per square kilometer), economic level (GDP per capita), industrial structure (proportion of secondary industries in the total GDP), carbon intensity (CO2 emission intensity), and ecological construction (green area per capita). The collinearity test results indicated that all variance inflation factors (VIFs) were below the threshold of 10, indicating the absence of collinearity among the driving factors.
Global Moran’s I was obtained using ArcGIS 10.2. The analysis of the drivers of GLCU involved the utilization of the GTWR plug-in created by Huang et al. [53].
2.3. Data Source
The CO2 emission data of 41 cities in the YRD region were obtained for the years 2005, 2010, 2015, and 2020. This information was sourced from the China city carbon dioxide emissions dataset compiled by the China City Greenhouse Gas Working Group (CCG) [54,55].
In addition, economic, social, and environmental statistics were extracted from reputable sources such as the China Urban Statistical Yearbook, the China Urban and Rural Construction Statistical Yearbook (https://data.cnki.net/) (accessed on 2 June 2023), and statistical yearbooks and bulletins from Shanghai (http://tjj.sh.gov.cn/) (accessed on 2 June 2023), Jiangsu (http://tj.jiangsu.gov.cn/) (accessed on 2 June 2023), Zhejiang (http://tjj.zj.gov.cn/) (accessed on 2 June 2023), and Anhui (http://tjj.ah.gov.cn/) (accessed on 2 June 2023) for the years 2006, 2011, 2016, and 2021. The process of linear regression was employed to estimate the values of missing data.
3. Results and Discussion
3.1. Coordination between Urbanization and LCD
Driven by regional development, urbanization within the YRD region has grown steadily, as evidenced by the ascending index value from 0.25 in 2005 to 0.50 in 2020. Analysis of the shifting kernel density curve depicting urbanization trends in the YRD region indicated a gradual decline in cities with low urbanization levels and a gradual elevation in those boasting high urbanization levels (Figure 3a). The spatial distribution of urbanization features heightened urbanization in the center and lower levels at the periphery. The cities with a high degree of urbanization are concentrated in the vicinity of Shanghai (Figure 3b,c). However, the spatial pattern of urbanization changed from a unipolar concentration to a multipolar distribution from 2005 to 2020, with rapid urbanization growth in provincial capitals such as Hangzhou and Hefei, bolstered by policy support.
The LCD index in the YRD region rose from 0.53 in 2005 to 0.61 in 2020. A subtle rightward shift of the kernel density curve associated with LCD attested to this incremental increase in the LCD level. Furthermore, the differences in LCD levels among cities has narrowed (Figure 3d). A notable disparity exists in the spatial distribution between places characterized by high levels of urbanization and those exhibiting high levels of LCD. In 2005, the cities with high LCD levels were primarily distributed in the northern Jiangsu cities of Huai’an, Yancheng, and Suqian, alongside Anhui’s Huangshan and Bozhou. In contrast, the cities with low LCD levels were mainly concentrated in southeastern Zhejiang’s Wenzhou and Taizhou, Shanghai, as well as Anhui’s Tongling and Maanshan (Figure 3e). The LCD level of Shanghai and Anhui increased faster than that of Jiangsu and Zhejiang from 2005 to 2020. Cities with low LCD levels were primarily located in southern Jiangsu and eastern Zhejiang in 2020 (Figure 3f).
The CCD model analysis demonstrated a noteworthy trend in research area, wherein the CCD between urbanization and LCD rose from 0.59 in 2005 to 0.74 in 2020. This shift signifies a significant transition from a low coordination state to one of moderate coordination (Figure 4). The results show that 46% of the cities (19 cities) operated at a low coordination level, while 51% of the cities (21 cities) exhibited a primary coordination level in 2005. Notably, Shanghai stood out by achieving a moderate level of coordination in 2005. The cities with lower low CCD values were mainly distributed in southern Anhui. The level of GLCU in the YRD region increased rapidly over the study period. In 2020, a substantial 78% of the cities progressed to a state of moderate coordination. However, a handful of cities, five in Anhui, and two in southwestern Zhejiang, remained in the primary coordination stage. Differences in the level of CCD between cities always exist. Shanghai had the highest CCD level and showed a good development trend. Shanghai was not only at the top of the YRD region in terms of urbanization level but its LCD level also improved during the study period, so its CCD level was in the leading position. Jiangsu and Zhejiang Provinces had high levels of urbanization, but their LCD level increased at a slow pace, which restricted the development of the CCD level. The cities of Anhui Province were at the bottom of the CCD level in the YRD region, mainly due to the comparatively backward level of urbanization.
The CCD of urbanization and LCD is governed by a complex interplay of intrinsic factors, especially trade-offs and synergies among them. The findings of the correlation analysis indicate that the interaction between urbanization and LCD was mainly impacted by the trade-off among urbanization and carbon emissions and carbon sinks and green lifestyles (Figure 5).
Many studies have substantiated that urbanization invariably causes a city’s carbon emissions to increase [56,57]. The analysis of the intrinsic factors of urbanization and LCD demonstrates that carbon emissions and urbanization are negatively correlated, but the trade-off between them was not significant except in 2010 (Figure 5). This trade-off was mainly influenced by population dynamics and energy consumption resulting from urbanization. These factors exerted obviously positive effects on carbon emission growth [58]. However, some studies have also concluded that urbanization has a double-edged impact on carbon emissions [59]. Though urbanization promotes the growth of energy usage, the advancement of civilization and technology also facilitates the refinement of energy consumption patterns and industrial structures, producing an inhibiting effect on carbon emissions [60]. Thus, the effect of urbanization on carbon emissions is dynamic in nature.
The Pearson analysis results indicate that the correlation between carbon sinks and urbanization shifted from a state of low synergy (r = 0.47) in 2005 to a weak trade-off (r = −0.40) in 2020 (Figure 5). The expansion of urbanized areas is often accompanied by a substantial reduction in ecological lands [61]. Due to the rapid expansion of urbanization, the carbon storage of all cities in the YRD region decreased significantly, with the most pronounced change observed in the past decade [62]. If the consumption of urban carbon sinks persists, it will further worsen the detrimental impact on the progression of LCD [63]. Therefore, it becomes imperative to closely monitor the expansion of construction land and improve the intensive use of land in the process of urbanization [64].
The dynamic between green lifestyle and urbanization exhibited a notably strong trade-off (r < −0.75) (Figure 5). The residential sector became the second largest consumer of energy, representing a share of more than 10% in China’s overall energy consumption [65]. Urbanization led to an improvement in living standards and changes in residents’ lifestyles, thereby increasing household energy consumption. Additionally, over the course of urban expansion, the increasing size of the population and the rise in per capita consumption expenditure lead to an increase in household waste generation. Therefore, in order to advance green and low-carbon urban development, it is essential to advocate for such a way of life [66].
The relationships between environmental governance and urbanization are synergistic, with economic urbanization demonstrating the most pronounced synergy (Figure 5). The accumulation of funds generated via economic development is the basis for effective environmental management. However, the relationship between green production and urbanization transitioned from a weak trade-off (r = −0.27) to low synergy (r = 0.32), indicating a perceptible shift towards cleaner production within the industrial landscape of the YRD region from 2005 to 2020.
3.2. Driving Factors of GLCU
The dynamic changes in intrinsic factors throughout the urbanization process lead to distinctive development patterns within cities. Cities with similar characteristics often have similar development patterns [67,68]. Utilizing the time series data detailing the CCD of urbanization and LCD, 41 cities in the YRD region are classified into four distinct clustering categories via K-means clustering.
Cities in Class 1, including Shanghai, Nanjing, and Wuxi (Figure 6a), featured superior geographical advantages, high levels of economic development, and higher population densities (Table 2). These cities made significant progress in optimizing industrial structures, fostering technological innovation, and enhancing urban greening from 2005 to 2020. As such, they continued to hold the top spot in the YRD region in relation to GLCU levels (Figure 6b). Cities in Class 2 are mainly distributed in southern Jiangsu, northern Zhejiang, as well as Hefei in Anhui (Figure 6a). Most cities in Class 2 are provincial capitals or are situated in proximity to Class 1 cities, benefiting from favorable market conditions and supportive policies. Under the influence of Class 1 cities, the GLCU level of these cities exhibited rapid growth in recent years. Cities in Class 3 are chiefly concentrated in northern Jiangsu, southern Zhejiang, and central Anhui (Figure 6a). The development of Class 3 cities relied predominantly on primary and secondary industries. The extensive mode of economic growth resulted in the highest carbon emissions and electricity consumption intensity (Table 2), highlighting a conspicuous tension between urbanization and LCD. Cities in Class 4 include Lishui in Zhejiang Province and Lu’an, Chizhou, and Xuancheng in Anhui Province (Figure 6a). While these cities exhibited the lowest degree of coordination between urbanization and LCD, they demonstrated rapid improvements in this coordination. The difference in GLCU levels between Class 4 and Class 3 cities decreased from 0.092 in 2005 to 0.017 in 2020 (Figure 6b). Although Class 4 cities have the highest LCD level among all clusters (Figure 6c), their urbanization level needs further improvement.
To delve into the intricate mechanism behind the emergence of green and low-carbon development modes in different types of cities, the GTWR model was employed to examine the drivers of GLCU. The global spatial autocorrelation showed that Moran’s I for CCD exceeded 0.3 (p < 0.01), indicating that there was spatial heterogeneity in the distribution of GLCU in the YRD region. This substantiated the pertinence of the GTWR model as an apt instrument to unravel the driving factors for GLCU.
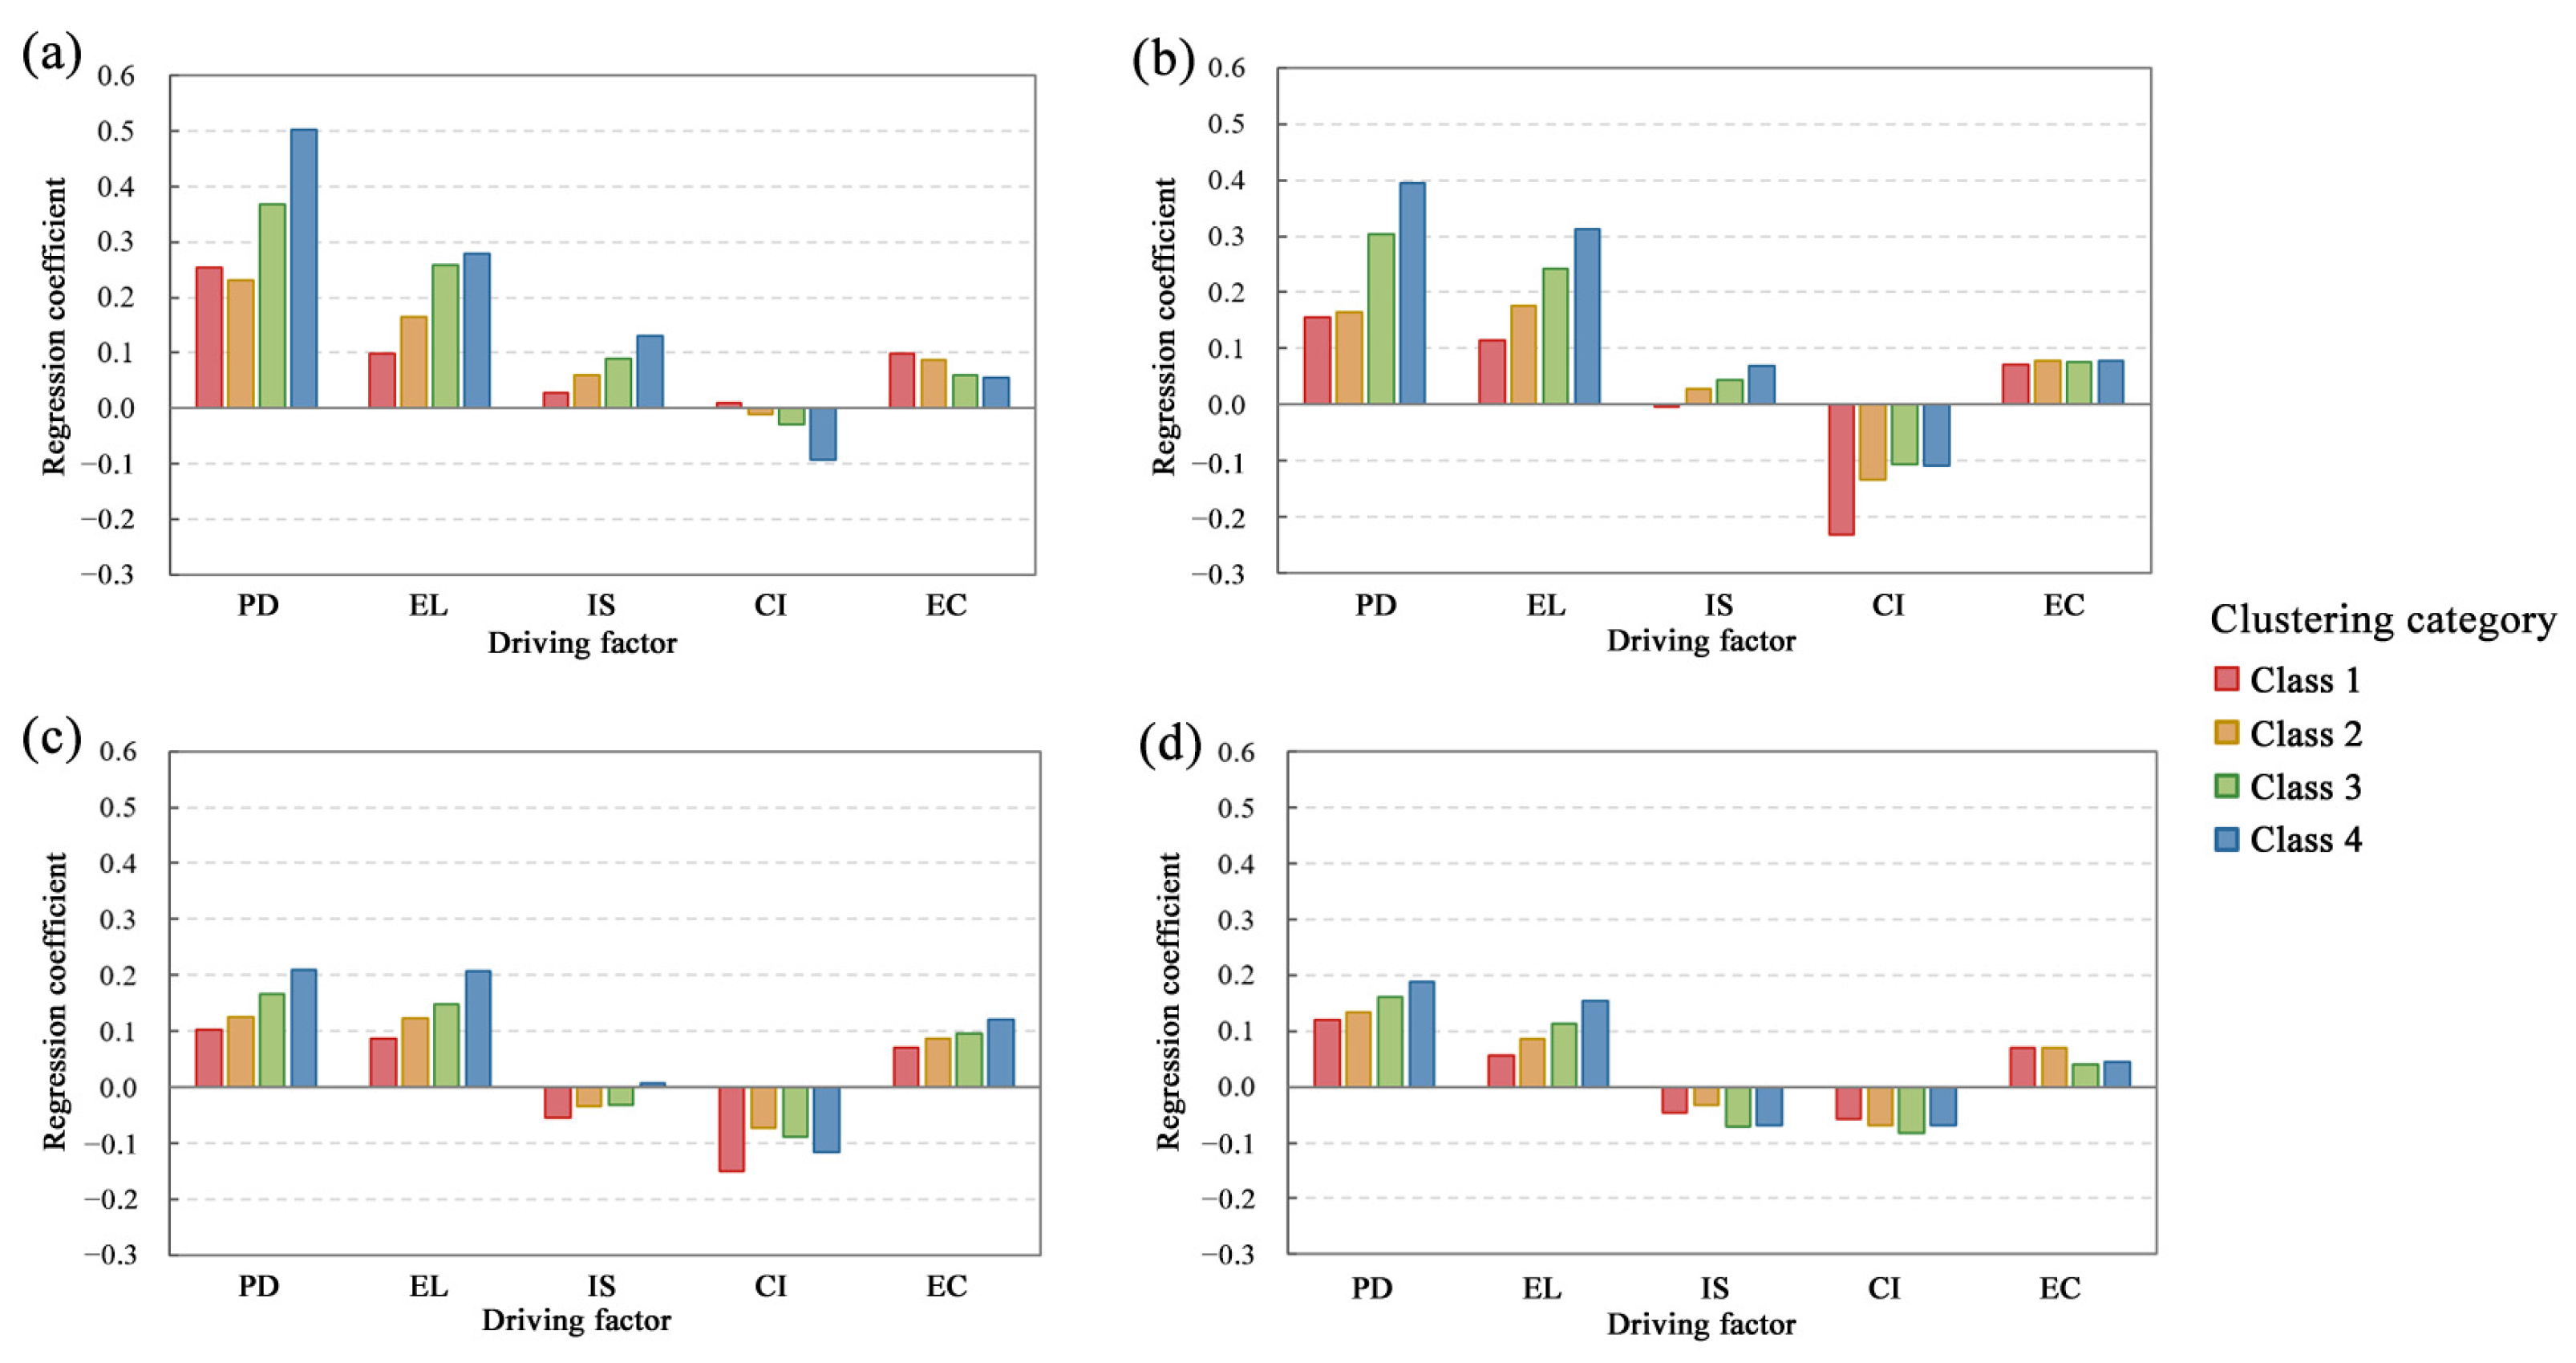
With a R2 value of 0.99 and AICc value of −666.2, the GTWR model successfully simulated the driving factors of GLCU in the study area. The regression coefficients of the driving factors for each cluster of cities from 2005 to 2020 are shown in Figure 7.
The results from the GTWR model show a positive correlation between population density (PD) and GLCU (Figure 7). The high regression coefficients for population density in cities with low levels of GLCU (Class 3 and Class 4) indicate that the positive driver of population density is more pronounced in the early stages of development. Population is the fundamental driving force for the development of GLCU. On the one hand, the rapid growth in urban population drives the development of urbanization, which has an important impact on the comprehensive development level of GLCU. On the other hand, population agglomeration improves production efficiency and resource utilization efficiency, thereby reducing per capita CO2 emissions [69]. It is worth noting that the positive driving effect of population density is steadily weakened from 2005 to 2020, which may be related to the “congestion effect” stemming from high population density. To some extent, population agglomeration can increase the intensity of resource and energy consumption, exerting strain on the ecological environment [33,70].
The economic level (EL) has a favorable impact on enhancing the level of GLCU (Figure 7). The economy constitutes the bedrock for coordinating urbanization and LCD. Based on a stronger economy, more funds can be invested in urban construction, environmental protection, and low-carbon technology, thereby propelling the GLCU level [71], especially in the early stage of urbanization. The impacts of GDP per capita turned out to be more pronounced in less developed cities. Compared to Class 1 and Class 2 cities, those in Class 3 and Class 4 grapple with financial and geographical disadvantages, necessitating more investment in GLCU development.
The influence of industrial structures (IS) on GLCU shifted from a positive to a negative orientation from 2005 to 2020 (Figure 7). In the early stage of urbanization, the growth of the secondary industry acted as a catalyst for economic growth and population agglomeration, adding impetus to urbanization development. However, growth on the industrial scale not only led to a rise in the emission of industrial pollutants but also exerted an extensive adverse influence on energy efficiency [72]. The incongruity between the industrial structure and GLCU development steadily emerged. The negative correlation between these two factors first appeared in the most developed cities in Class 1. Marked by the extension of value-added industrial chains, these cities spearheaded the transformation into a green and clean industrial structure. But, the negative impact of the industrial structure persisted. The deleterious effect of the secondary industry’s share on each category of GLCU was evident in 2020, indicating the importance of industrial transformation and upgrading [73].
Carbon intensity (CI) has a negative driving effect on GLCU, with its negative correlation oscillating during the study period (Figure 7). CO2 emission intensity is closely related to economic and technological levels and energy utilization efficiency [74]. During the initial phase of urbanization, economic growth often coincided with resource depletion and energy consumption, triggering an increase in carbon emission intensity which has a serious negative impact on GLCU. When industrialization reached a certain stage, the development and promotion of energy-conserving and eco-friendly technology facilitated an improvement in energy use efficiency, and the negative impact of carbon emission intensity on GLCU was reduced. Therefore, there was an initial increase followed by a subsequent decline in the negative correlation seen between carbon emission intensity and GLCU.
The regression coefficients of ecological construction (EC) are positive for all clustered cities from 2005 to 2020 (Figure 7), indicating that enhancing ecological construction is beneficial for all cities to achieve green and low-carbon development.
4. Conclusions and Policy Implications
4.1. Conclusions
The interplay between urbanization and LCD is complex, necessitating a comprehensive exploration of their interdependence for sustainable urban development. The objective of this study was to establish an evaluation framework for GLCU, focusing on the YRD region as a case study to examine the spatiotemporal patterns of GLCU. The findings indicate that the state of coordination between urbanization and LCD in the YRD region upgraded from low coordination in 2005 to moderate coordination in 2020. However, there are trade-offs between urbanization and carbon emissions and carbon sinks and green lifestyle subsystems. The variations in the effects of the five drivers on GLCU are investigated through the GTWR model. The population density and the economic level emerged as constant catalysts in GLCU development. In contrast, carbon intensity exerted a negative effect, and the impact of industrial structure shifted from positive to negative. Identifying the effect of driving factors at different urbanization stages is vital to promote GLCU.
4.2. Policy Implications
Green and low-carbon urbanization is a prerequisite for urban sustainable development. Given the substantial variations in development levels and natural circumstances among cities, it is imperative to formulate policies that are tailored to local conditions.
For those developed cities, it is more important to give priority to the quality of urbanization rather than its speed in the future since the positive driving effect of population density on GLCU is gradually weakening. Considering the extremely strong trade-off between green lifestyles and urbanization, local governments should promote the optimization of population structures and enhance public knowledge regarding low carbon lifestyles to alleviate the pressure of excessive population density on urban sustainable development.
As economic prosperity has a positive impact and the intensity of carbon emissions has a negative effect on GLCU, efforts should be concentrated on phasing out enterprises with high energy consumption and high pollution gradually. For regions with a low urbanization level and underdeveloped economy, which often have good ecological foundations, it is recommended to accelerate the development of low-carbon industrial systems on the basis of its own conditions and achieve environmental protection and urbanization development simultaneously.
For manufacturing-oriented cities, it is imperative to improve energy efficiency and adjust the industrial structure. Local governments should further guide the optimization of industrial structures and encourage the growth of high-tech and green industries, so as to reduce environmental damage and resource waste. Meanwhile, there is a need to focus on the rationalization of the secondary and tertiary industry input rather than deliberately emphasizing the growth of the tertiary industry. Otherwise, the efficiency of economic development may be reduced.
Expanding the carbon sink area is a viable way to enhance carbon absorption and reducing carbon emissions, but the trade-off between urbanization and carbon sink systems has gradually emerged in recent years. Thus, local governments should actively optimize the land use structure, regulate land development intensity, and prudently increase the allocation of carbon sinks within land planning.
4.3. Limitations and Future Research Directions
This study involved a systematic study of the spatiotemporal evolution of GLCU and its driving factors in the YRD region, providing information for urban sustainable development strategic decision-making. Nevertheless, there are still shortcomings that need to be improved in further research. Firstly, urbanization and LCD are two complex processes, and this study attempts to establish a multi-dimensional evaluation system for urbanization and LCD, where possible. However, due to the limitations in data availability, our indicator system is not comprehensive enough. In future studies, more comprehensive indicators should be involved in the indicator system of urbanization and LCD evaluation. Secondly, the development of GLCU is influenced by various driving factors. This study has only selected five representative elements that drive factor analysis. It is necessary to expand the selection of driving factors and explore the development mechanisms of GLCU more deeply.
Author Contributions
Conceptualization, F.W.; methodology, Y.H.; investigation, C.K.; data curation, Y.H.; writing—original draft preparation, Y.H.; writing—review and editing, F.W. and C.K.; visualization, Y.H.; supervision, F.W.; funding acquisition, F.W. All authors have read and agreed to the published version of the manuscript.
Funding
This research was funded by the Zhejiang Province Science and Technology Projects (2023C03131) and the Ecological Civilization Convergence Project of Zhejiang University.
Institutional Review Board Statement
Not applicable.
Informed Consent Statement
Not applicable.
Data Availability Statement
Data are contained within the article.
Conflicts of Interest
The authors declare no conflicts of interest.
References
- Chen, W.; Zhou, T.; Liang, J. Urbanization, Ecosystem Services, and Their Interactive Coercive Relationship in Hunan Province, China. Environ. Sci. Pollut. Res. 2023, 30, 3416–3431. [Google Scholar] [CrossRef]
- Zhou, Z.; Cao, L.; Zhao, K.; Li, D.; Ding, C. Spatio-Temporal Effects of Multi-Dimensional Urbanization on Carbon Emission Efficiency: Analysis Based on Panel Data of 283 Cities in China. Int. J. Environ. Res. Public Health 2021, 18, 12712. [Google Scholar] [CrossRef]
- García-Nieto, A.P.; Geijzendorffer, I.R.; Baró, F.; Roche, P.K.; Bondeau, A.; Cramer, W. Impacts of Urbanization around Mediterranean Cities: Changes in Ecosystem Service Supply. Ecol. Indic. 2018, 91, 589–606. [Google Scholar] [CrossRef]
- Ren, W.; Xue, B.; Xie, X.; Zhao, B.; Li, J.; Han, B. Urban Comprehensive Carrying Capacity and Urbanization in Northeast China. Sustainability 2023, 15, 13649. [Google Scholar] [CrossRef]
- Wang, S.; Shi, C.; Fang, C.; Feng, K. Examining the Spatial Variations of Determinants of Energy-Related CO2 Emissions in China at the City Level Using Geographically Weighted Regression Model. Appl. Energy 2019, 235, 95–105. [Google Scholar] [CrossRef]
- Dong, F.; Yu, B.; Hadachin, T.; Dai, Y.; Wang, Y.; Zhang, S.; Long, R. Drivers of Carbon Emission Intensity Change in China. Resour. Conserv. Recycl. 2018, 129, 187–201. [Google Scholar] [CrossRef]
- Song, Q.; Qin, M.; Wang, R.; Qi, Y. How Does the Nested Structure Affect Policy Innovation?: Empirical Research on China’s Low Carbon Pilot Cities. Energy Policy 2020, 144, 111695. [Google Scholar] [CrossRef]
- Sun, W.; Huang, C. How Does Urbanization Affect Carbon Emission Efficiency? Evidence from China. J. Clean. Prod. 2020, 272, 122828. [Google Scholar] [CrossRef]
- Poumanyvong, P.; Kaneko, S. Does Urbanization Lead to Less Energy Use and Lower CO2 Emissions? A Cross-Country Analysis. Ecol. Econ. 2010, 70, 434–444. [Google Scholar] [CrossRef]
- Xu, S.-C.; He, Z.-X.; Long, R.-Y.; Chen, H. Factors That Influence Carbon Emissions Due to Energy Consumption Based on Different Stages and Sectors in China. J. Clean. Prod. 2016, 115, 139–148. [Google Scholar] [CrossRef]
- Wang, Y.; Li, X.; Kang, Y.; Chen, W.; Zhao, M.; Li, W. Analyzing the Impact of Urbanization Quality on CO2 Emissions: What Can Geographically Weighted Regression Tell Us? Renew. Sustain. Energy Rev. 2019, 104, 127–136. [Google Scholar] [CrossRef]
- Khan, K.; Su, C.-W. Urbanization and Carbon Emissions: A Panel Threshold Analysis. Environ. Sci. Pollut. Res. 2021, 28, 26073–26081. [Google Scholar] [CrossRef]
- Li, J.; Huang, X.; Kwan, M.-P.; Yang, H.; Chuai, X. The Effect of Urbanization on Carbon Dioxide Emissions Efficiency in the Yangtze River Delta, China. J. Clean. Prod. 2018, 188, 38–48. [Google Scholar] [CrossRef]
- Shen, L.; Wu, Y.; Lou, Y.; Zeng, D.; Shuai, C.; Song, X. What Drives the Carbon Emission in the Chinese Cities?—A Case of Pilot Low Carbon City of Beijing. J. Clean. Prod. 2018, 174, 343–354. [Google Scholar] [CrossRef]
- Liu, N.; Liu, C.; Xia, Y.; Da, B. Examining the Coordination between Urbanization and Eco-Environment Using Coupling and Spatial Analyses: A Case Study in China. Ecol. Indic. 2018, 93, 1163–1175. [Google Scholar] [CrossRef]
- Zhang, K.; Liu, T.; Feng, R.; Zhang, Z.; Liu, K. Coupling Coordination Relationship and Driving Mechanism between Urbanization and Ecosystem Service Value in Large Regions: A Case Study of Urban Agglomeration in Yellow River Basin, China. Int. J. Environ. Res. Public Health 2021, 18, 7836. [Google Scholar] [CrossRef]
- Zhang, Y.; Dai, Y.; Chen, Y.; Ke, X. Coupling Coordination Development of New-Type Urbanization and Cultivated Land Low-Carbon Utilization in the Yangtze River Delta, China. Land 2022, 11, 919. [Google Scholar] [CrossRef]
- Liu, X.; Guo, P.; Yue, X.; Zhong, S.; Cao, X. Urban Transition in China: Examining the Coordination between Urbanization and the Eco-Environment Using a Multi-Model Evaluation Method. Ecol. Indic. 2021, 130, 108056. [Google Scholar] [CrossRef]
- Tian, Y.; Zhou, D.; Jiang, G. Conflict or Coordination? Multiscale Assessment of the Spatio-Temporal Coupling Relationship between Urbanization and Ecosystem Services: The Case of the Jingjinji Region, China. Ecol. Indic. 2020, 117, 106543. [Google Scholar] [CrossRef]
- Song, Q.; Zhou, N.; Liu, T.; Siehr, S.A.; Qi, Y. Investigation of a “Coupling Model” of Coordination between Low-Carbon Development and Urbanization in China. Energy Policy 2018, 121, 346–354. [Google Scholar] [CrossRef]
- Li, D.; Cao, L.; Zhou, Z.; Zhao, K.; Du, Z.; Han, K. Coupling Coordination Degree and Driving Factors of New-Type Urbanization and Low-Carbon Development in the Yangtze River Delta: Based on Nighttime Light Data. Environ. Sci. Pollut. Res. 2022, 29, 81636–81657. [Google Scholar] [CrossRef] [PubMed]
- Guo, X.; Fang, C.; Mu, X.; Chen, D. Coupling and Coordination Analysis of Urbanization and Ecosystem Service Value in Beijing-Tianjin-Hebei Urban Agglomeration. Ecol. Indic. 2022, 137, 108782. [Google Scholar] [CrossRef]
- Qin, H.; Huang, Q.; Zhang, Z.; Lu, Y.; Li, M.; Xu, L.; Chen, Z. Carbon Dioxide Emission Driving Factors Analysis and Policy Implications of Chinese Cities: Combining Geographically Weighted Regression with Two-Step Cluster. Sci. Total Environ. 2019, 684, 413–424. [Google Scholar] [CrossRef] [PubMed]
- Xia, C.; Zheng, H.; Meng, J.; Li, S.; Du, P.; Shan, Y. The Evolution of Carbon Footprint in the Yangtze River Delta City Cluster during Economic Transition 2012–2015. Resour. Conserv. Recycl. 2022, 181, 106266. [Google Scholar] [CrossRef]
- Yu, X.; Wu, Z.; Zheng, H.; Li, M.; Tan, T. How Urban Agglomeration Improve the Emission efficiency? A Spatial Econometric Analysis of the Yangtze River Delta Urban Agglomeration in China. J. Environ. Manag. 2020, 260, 110061. [Google Scholar] [CrossRef] [PubMed]
- Hou, Y.; Zhang, K.; Zhu, Y.; Liu, W. Spatial and Temporal Differentiation and Influencing Factors of Environmental Governance Performance in the Yangtze River Delta, China. Sci. Total Environ. 2021, 801, 149699. [Google Scholar] [CrossRef] [PubMed]
- Ni, R.; Wang, F.; Yu, J. Spatiotemporal Changes in Sustainable Development and Its Driving Force in the Yangtze River Delta Region, China. J. Clean. Prod. 2022, 379, 134751. [Google Scholar] [CrossRef]
- NBS. China Statistical Yearbook; China Statistics Press: Beijing, China, 2021. [Google Scholar]
- Zhou, C.; Wang, S.; Wang, J. Examining the Influences of Urbanization on Carbon Dioxide Emissions in the Yangtze River Delta, China: Kuznets Curve Relationship. Sci. Total Environ. 2019, 675, 472–482. [Google Scholar] [CrossRef] [PubMed]
- Qiu, S.; Wang, Z.; Liu, S. The Policy Outcomes of Low-Carbon City Construction on Urban Green Development: Evidence from a Quasi-Natural Experiment Conducted in China. Sustain. Cities Soc. 2021, 66, 102699. [Google Scholar] [CrossRef]
- Lv, T.; Hu, H.; Zhang, X.; Xie, H.; Wang, L.; Fu, S. Spatial Spillover Effects of Urbanization on Carbon Emissions in the Yangtze River Delta Urban Agglomeration, China. Environ. Sci. Pollut. Res. 2022, 29, 33920–33934. [Google Scholar] [CrossRef]
- Cheng, J.; Yi, J.; Dai, S.; Xiong, Y. Can Low-Carbon City Construction Facilitate Green Growth? Evidence from China’s Pilot Low-Carbon City Initiative. J. Clean. Prod. 2019, 231, 1158–1170. [Google Scholar] [CrossRef]
- Dong, L.; Shang, J.; Ali, R.; Rehman, R.U. The Coupling Coordinated Relationship Between New-Type Urbanization, Eco-Environment and Its Driving Mechanism: A Case of Guanzhong, China. Front. Environ. Sci. 2021, 9, 638891. [Google Scholar] [CrossRef]
- He, J.; Wang, S.; Liu, Y.; Ma, H.; Liu, Q. Examining the Relationship between Urbanization and the Eco-Environment Using a Coupling Analysis: Case Study of Shanghai, China. Ecol. Indic. 2017, 77, 185–193. [Google Scholar] [CrossRef]
- Wang, Z.; Liang, L.; Sun, Z.; Wang, X. Spatiotemporal Differentiation and the Factors Influencing Urbanization and Ecological Environment Synergistic Effects within the Beijing-Tianjin-Hebei Urban Agglomeration. J. Environ. Manag. 2019, 243, 227–239. [Google Scholar] [CrossRef]
- Wang, Y.; Fang, X.; Yin, S.; Chen, W. Low-Carbon Development Quality of Cities in China: Evaluation and Obstacle Analysis. Sustain. Cities Soc. 2021, 64, 102553. [Google Scholar] [CrossRef]
- Yu, Y.; Tong, Y.; Tang, W.; Yuan, Y.; Chen, Y. Identifying Spatiotemporal Interactions between Urbanization and Eco-Environment in the Urban Agglomeration in the Middle Reaches of the Yangtze River, China. Sustainability 2018, 10, 290. [Google Scholar] [CrossRef]
- Long, R.; Li, H.; Wu, M.; Li, W. Dynamic Evaluation of the Green Development Level of China’s Coal-Resource-Based Cities Using the TOPSIS Method. Resour. Policy 2021, 74, 102415. [Google Scholar] [CrossRef]
- Lu, Z.; Shao, C.; Wang, F.; Dong, R. Evaluation of Green and Low-Carbon Development Level of Chinese Provinces Based on Sustainable Development Goals. Sustainability 2023, 15, 15449. [Google Scholar] [CrossRef]
- Du, X.; Shen, L.; Ren, Y.; Meng, C. A Dimensional Perspective-Based Analysis on the Practice of Low Carbon City in China. Environ. Impact Assess. Rev. 2022, 95, 106768. [Google Scholar] [CrossRef]
- Cui, X.; Fang, C.; Liu, H.; Liu, X. Assessing Sustainability of Urbanization by a Coordinated Development Index for an Urbanization-Resources-Environment Complex System: A Case Study of Jing-Jin-Ji Region, China. Ecol. Indic. 2019, 96, 383–391. [Google Scholar] [CrossRef]
- Li, Y.; Li, Y.; Zhou, Y.; Shi, Y.; Zhu, X. Investigation of a Coupling Model of Coordination between Urbanization and the Environment. J. Environ. Manag. 2012, 98, 127–133. [Google Scholar] [CrossRef]
- Liu, W.; Zhan, J.; Zhao, F.; Wei, X.; Zhang, F. Exploring the Coupling Relationship between Urbanization and Energy Eco-Efficiency: A Case Study of 281 Prefecture-Level Cities in China. Sustain. Cities Soc. 2021, 64, 102563. [Google Scholar] [CrossRef]
- Duan, Z.; Kim, S. Characteristics and Variations in Korea through the Lens of Net-Zero Carbon Transformation in Cities. Sustainability 2023, 15, 13748. [Google Scholar] [CrossRef]
- Zhu, S.; Huang, J.; Zhao, Y. Coupling Coordination Analysis of Ecosystem Services and Urban Development of Resource-Based Cities: A Case Study of Tangshan City. Ecol. Indic. 2022, 136, 108706. [Google Scholar] [CrossRef]
- Li, W.; Wang, Y.; Xie, S.; Cheng, X. Coupling Coordination Analysis and Spatiotemporal Heterogeneity between Urbanization and Ecosystem Health in Chongqing Municipality, China. Sci. Total Environ. 2021, 791, 148311. [Google Scholar] [CrossRef] [PubMed]
- Luo, Q.; Zhou, J.; Zhang, Y.; Yu, B.; Zhu, Z. What Is the Spatiotemporal Relationship between Urbanization and Ecosystem Services? A Case from 110 Cities in the Yangtze River Economic Belt, China. J. Environ. Manag. 2022, 321, 115709. [Google Scholar] [CrossRef] [PubMed]
- Wang, L.; Chen, L.; Li, Y. Digital Economy and Urban Low-Carbon Sustainable Development: The Role of Innovation Factor Mobility in China. Environ. Sci. Pollut. Res. 2022, 29, 48539–48557. [Google Scholar] [CrossRef] [PubMed]
- Hartigan, J.A.; Wong, M.A. Algorithm AS 136: A K-Means Clustering Algorithm. J. R. Stat. Soc. 1979, 28, 100–108. [Google Scholar] [CrossRef]
- Wu, Y.; Wu, Y.; Li, C.; Gao, B.; Zheng, K.; Wang, M.; Deng, Y.; Fan, X. Spatial Relationships and Impact Effects between Urbanization and Ecosystem Health in Urban Agglomerations along the Belt and Road: A Case Study of the Guangdong-Hong Kong-Macao Greater Bay Area. Int. J. Environ. Res. Public Health 2022, 19, 16053. [Google Scholar] [CrossRef]
- Xu, B.; Xu, L.; Xu, R.; Luo, L. Geographical Analysis of CO2 Emissions in China’s Manufacturing Industry: A Geographically Weighted Regression Model. J. Clean. Prod. 2017, 166, 628–640. [Google Scholar] [CrossRef]
- Hu, W.; Liu, J. The Coupling and Coordination of Urban Modernization and Low-Carbon Development. Sustainability 2023, 15, 14335. [Google Scholar] [CrossRef]
- Huang, B.; Wu, B.; Barry, M. Geographically and Temporally Weighted Regression for Modeling Spatio-Temporal Variation in House Prices. Int. J. Geogr. Inf. Sci. 2010, 24, 383–401. [Google Scholar] [CrossRef]
- Cai, B.; Liang, S.; Zhou, J.; Wang, J.; Cao, L.; Qu, S.; Xu, M.; Yang, Z. China High Resolution Emission Database (CHRED) with Point Emission Sources, Gridded Emission Data, and Supplementary Socioeconomic Data. Resour. Conserv. Recycl. 2018, 129, 232–239. [Google Scholar] [CrossRef]
- Cai, B.; Cui, C.; Zhang, D.; Cao, L.; Wu, P.; Pang, L.; Zhang, J.; Dai, C. China City-Level Greenhouse Gas Emissions Inventory in 2015 and Uncertainty Analysis. Appl. Energy 2019, 253, 113579. [Google Scholar] [CrossRef]
- Liddle, B. Impact of Population, Age Structure, and Urbanization on Carbon Emissions/Energy Consumption: Evidence from Macro-Level, Cross-Country Analyses. Popul. Environ. 2014, 35, 286–304. [Google Scholar] [CrossRef]
- Cai, B.; Guo, H.; Cao, L.; Guan, D.; Bai, H. Local Strategies for China’s Carbon Mitigation: An Investigation of Chinese City-Level CO2 Emissions. J. Clean. Prod. 2018, 178, 890–902. [Google Scholar] [CrossRef]
- Liu, Y.; Jiang, Y.; Liu, H.; Li, B.; Yuan, J. Driving Factors of Carbon Emissions in China’s Municipalities: A LMDI Approach. Environ. Sci. Pollut. Res. 2022, 29, 21789–21802. [Google Scholar] [CrossRef]
- Wang, F.; Fan, W.; Liu, J.; Wang, G.; Chai, W. The Effect of Urbanization and Spatial Agglomeration on Carbon Emissions in Urban Agglomeration. Environ. Sci. Pollut. Res. 2020, 27, 24329–24341. [Google Scholar] [CrossRef] [PubMed]
- Wang, Z.; Cui, C.; Peng, S. How Do Urbanization and Consumption Patterns Affect Carbon Emissions in China? A Decomposition Analysis. J. Clean. Prod. 2019, 211, 1201–1208. [Google Scholar] [CrossRef]
- Wang, C.; Zhan, J.; Chu, X.; Liu, W.; Zhang, F. Variation in Ecosystem Services with Rapid Urbanization: A Study of Carbon Sequestration in the Beijing–Tianjin–Hebei Region, China. Phys. Chem. Earth 2019, 110, 195–202. [Google Scholar] [CrossRef]
- Ding, T.; Chen, J.; Fang, Z.; Chen, J. Assessment of Coordinative Relationship between Comprehensive Ecosystem Service and Urbanization: A Case Study of Yangtze River Delta Urban Agglomerations, China. Ecol. Indic. 2021, 133, 108454. [Google Scholar] [CrossRef]
- Shen, X.; Zheng, H.; Jiang, M.; Yu, X.; Xu, H.; Zhong, G. Multidimensional Impact of Urbanization Process on Regional Net CO2 Emissions: Taking the Yangtze River Economic Belt as an Example. Land 2022, 11, 1079. [Google Scholar] [CrossRef]
- Wang, J.; Zhao, M.; Zhong, W.; Li, J.; Zheng, C. Coupling Relationship of Urban Development and the Eco-Environment in Guanzhong Region, China. Sustainability 2022, 14, 2969. [Google Scholar] [CrossRef]
- Zhao, P.; Zhang, M. The Impact of Urbanisation on Energy Consumption: A 30-Year Review in China. Urban Clim. 2018, 24, 940–953. [Google Scholar] [CrossRef]
- Li, C.; Li, H.; Qin, X. Spatial Heterogeneity of Carbon Emissions and Its Influencing Factors in China: Evidence from 286 Prefecture-Level Cities. Int. J. Environ. Res. Public Health 2022, 19, 1226. [Google Scholar] [CrossRef]
- Du, H.; Chen, Z.; Mao, G.; Li, R.Y.M.; Chai, L. A Spatio-Temporal Analysis of Low Carbon Development in China’s 30 Provinces: A Perspective on the Maximum Flux Principle. Ecol. Indic. 2018, 90, 54–64. [Google Scholar] [CrossRef]
- Fang, Y.; Shan, Z. How to Promote a Smart City Effectively? An Evaluation Model and Efficiency Analysis of Smart Cities in China. Sustainability 2022, 14, 6512. [Google Scholar] [CrossRef]
- Zhao, X.; Burnett, J.W.; Fletcher, J.J. Spatial Analysis of China Province-Level CO2 Emission Intensity. Renew. Sustain. Energy Rev. 2014, 33, 1–10. [Google Scholar] [CrossRef]
- Gong, W.-F.; Fan, Z.-Y.; Wang, C.-H.; Wang, L.-P.; Li, W.-W. Spatial Spillover Effect of Carbon Emissions and Its Influencing Factors in the Yellow River Basin. Sustainability 2022, 14, 3608. [Google Scholar] [CrossRef]
- Wu, S.; Zhang, K. Influence of Urbanization and Foreign Direct Investment on Carbon Emission Efficiency: Evidence from Urban Clusters in the Yangtze River Economic Belt. Sustainability 2021, 13, 2722. [Google Scholar] [CrossRef]
- Wang, Y.; Duan, X.; Wang, L.; Zou, H. Spatial Temporal Patterns and Driving Factors of Industrial Pollution and Structures in the Yangtze River Economic Belt. Chemosphere 2022, 303, 134996. [Google Scholar] [CrossRef]
- Song, M.; Tao, W.; Shen, Z. Improving High-Quality Development with Environmental Regulation and Industrial Structure in China. J. Clean. Prod. 2022, 366, 132997. [Google Scholar] [CrossRef]
- Xu, J.; Li, Y.; Hu, F.; Wang, L.; Wang, K.; Ma, W.; Ruan, N.; Jiang, W. Spatio-Temporal Variation of Carbon Emission Intensity and Spatial Heterogeneity of Influencing Factors in the Yangtze River Delta. Atmosphere 2023, 14, 163. [Google Scholar] [CrossRef]
Figure 1.
Location of the Yangtze River Delta (YRD) region.
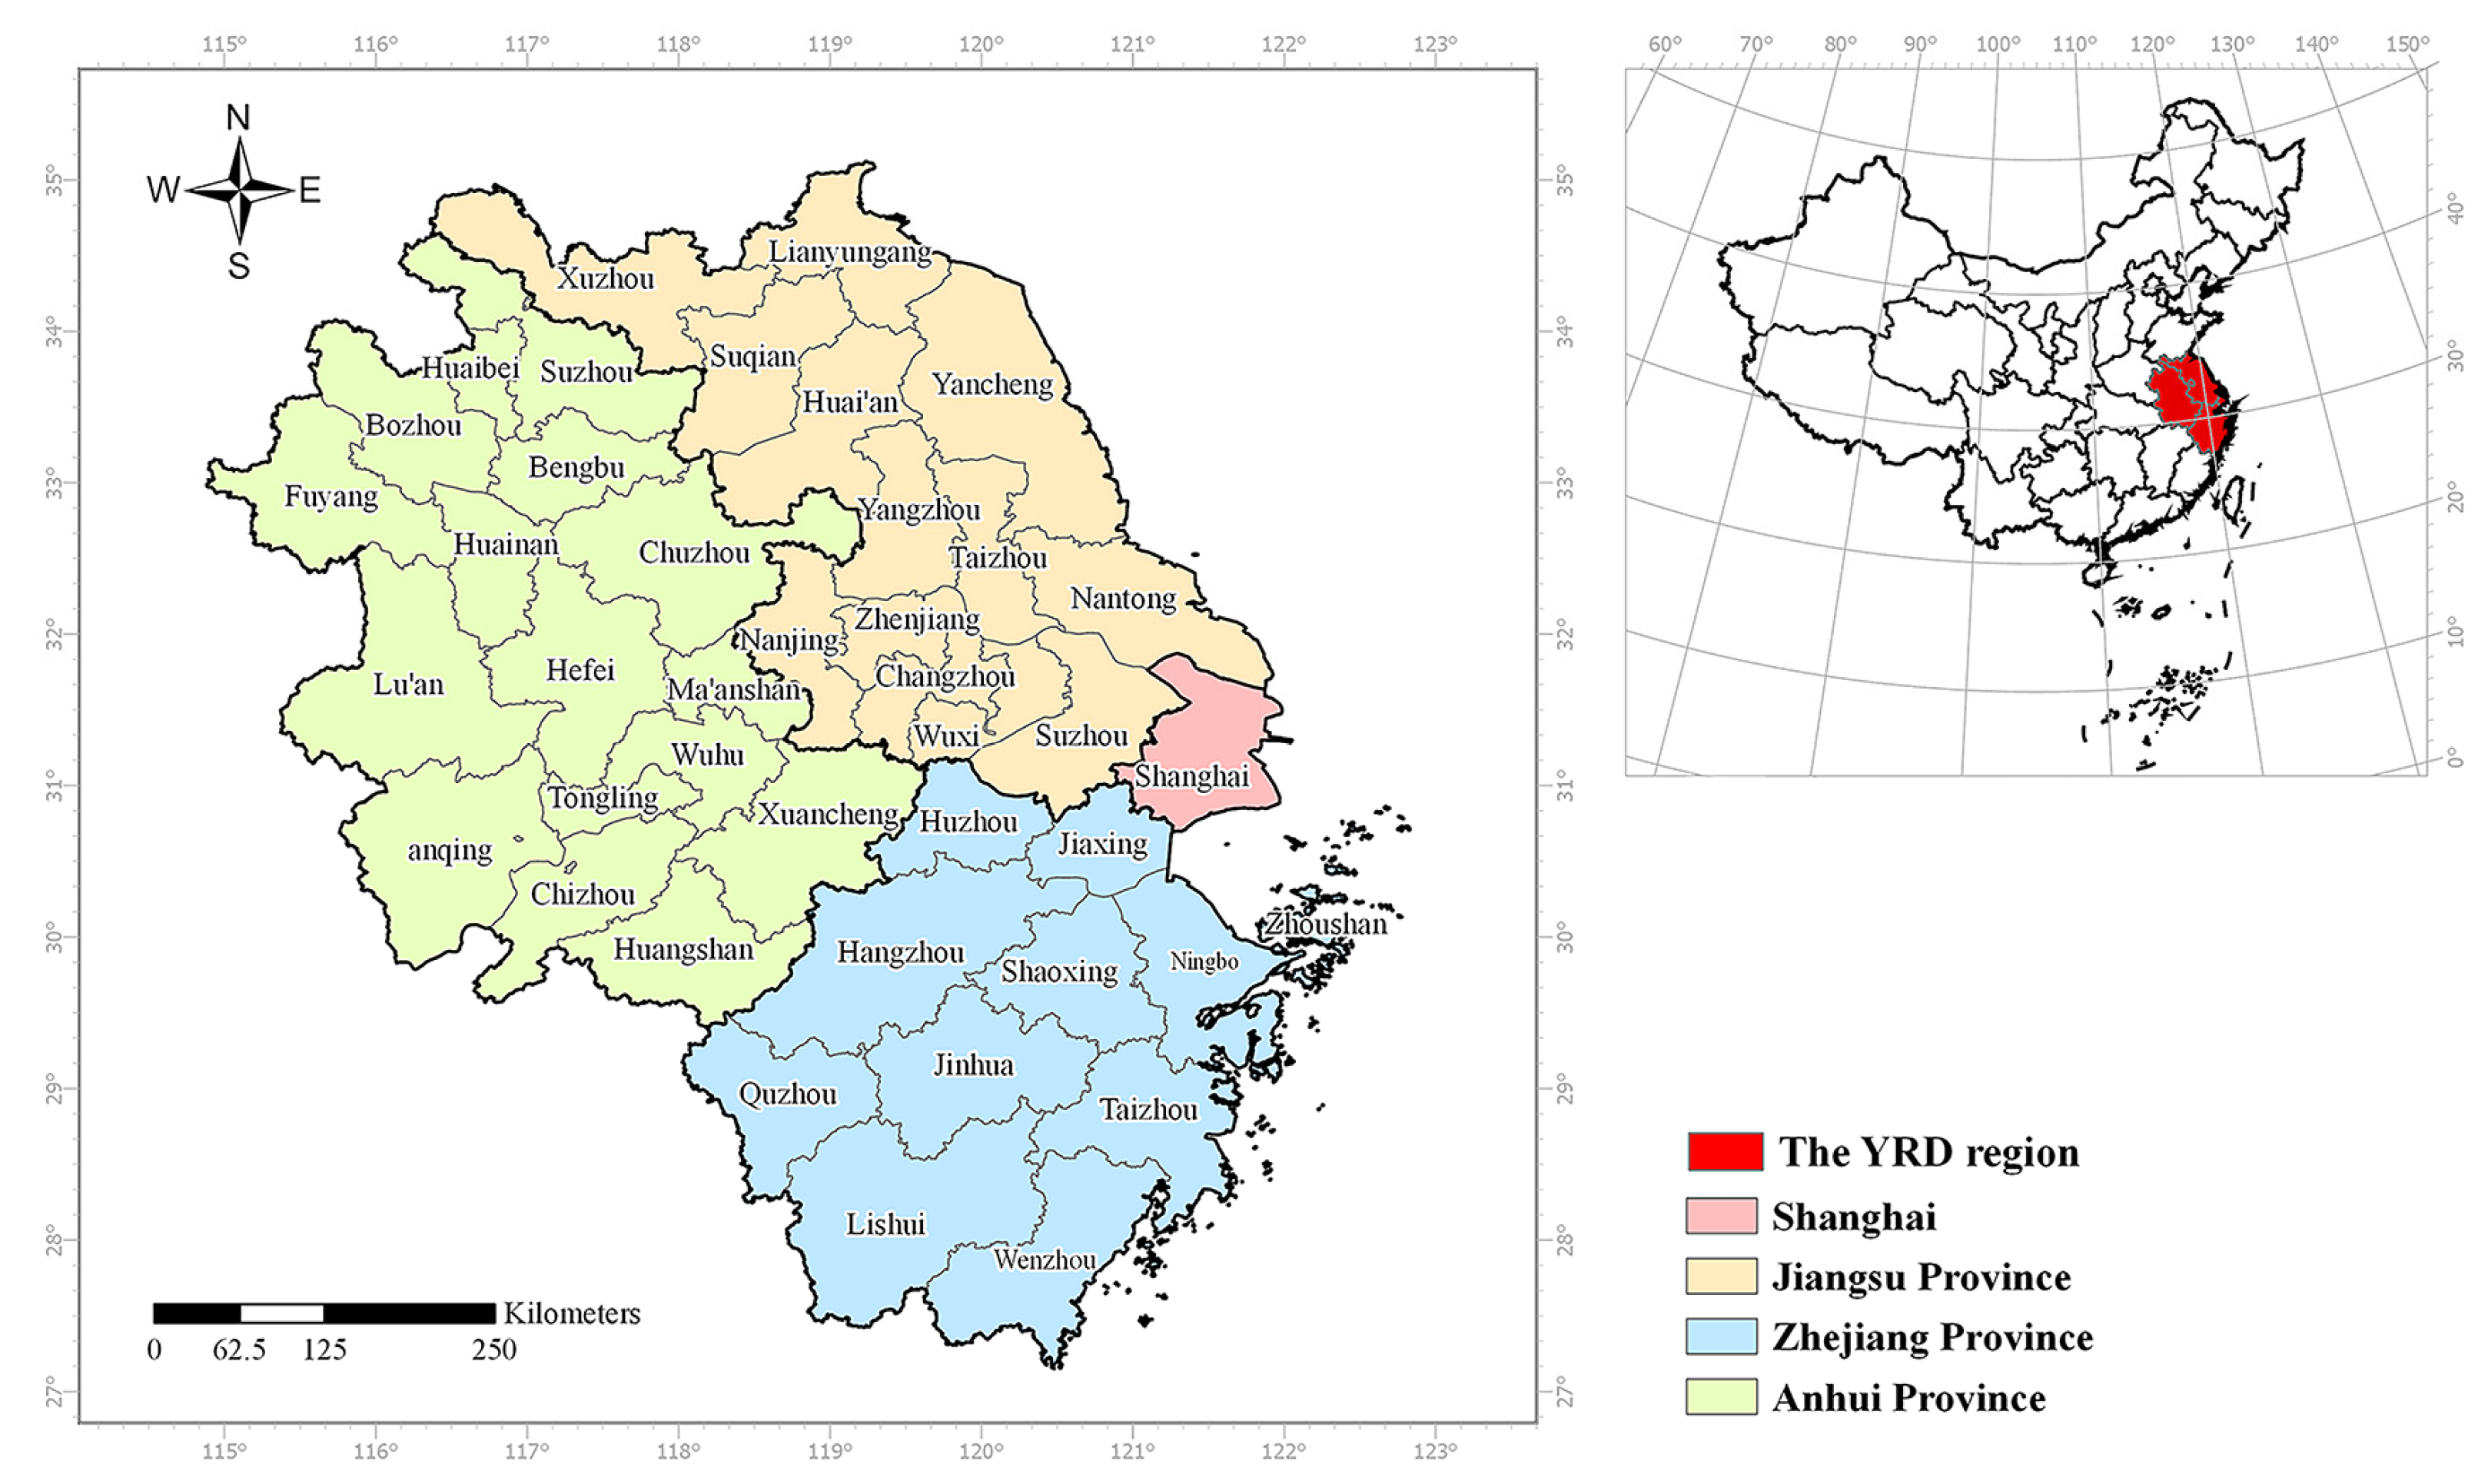
Figure 2.
Evaluation framework for green and low-carbon urbanization (GLCU).
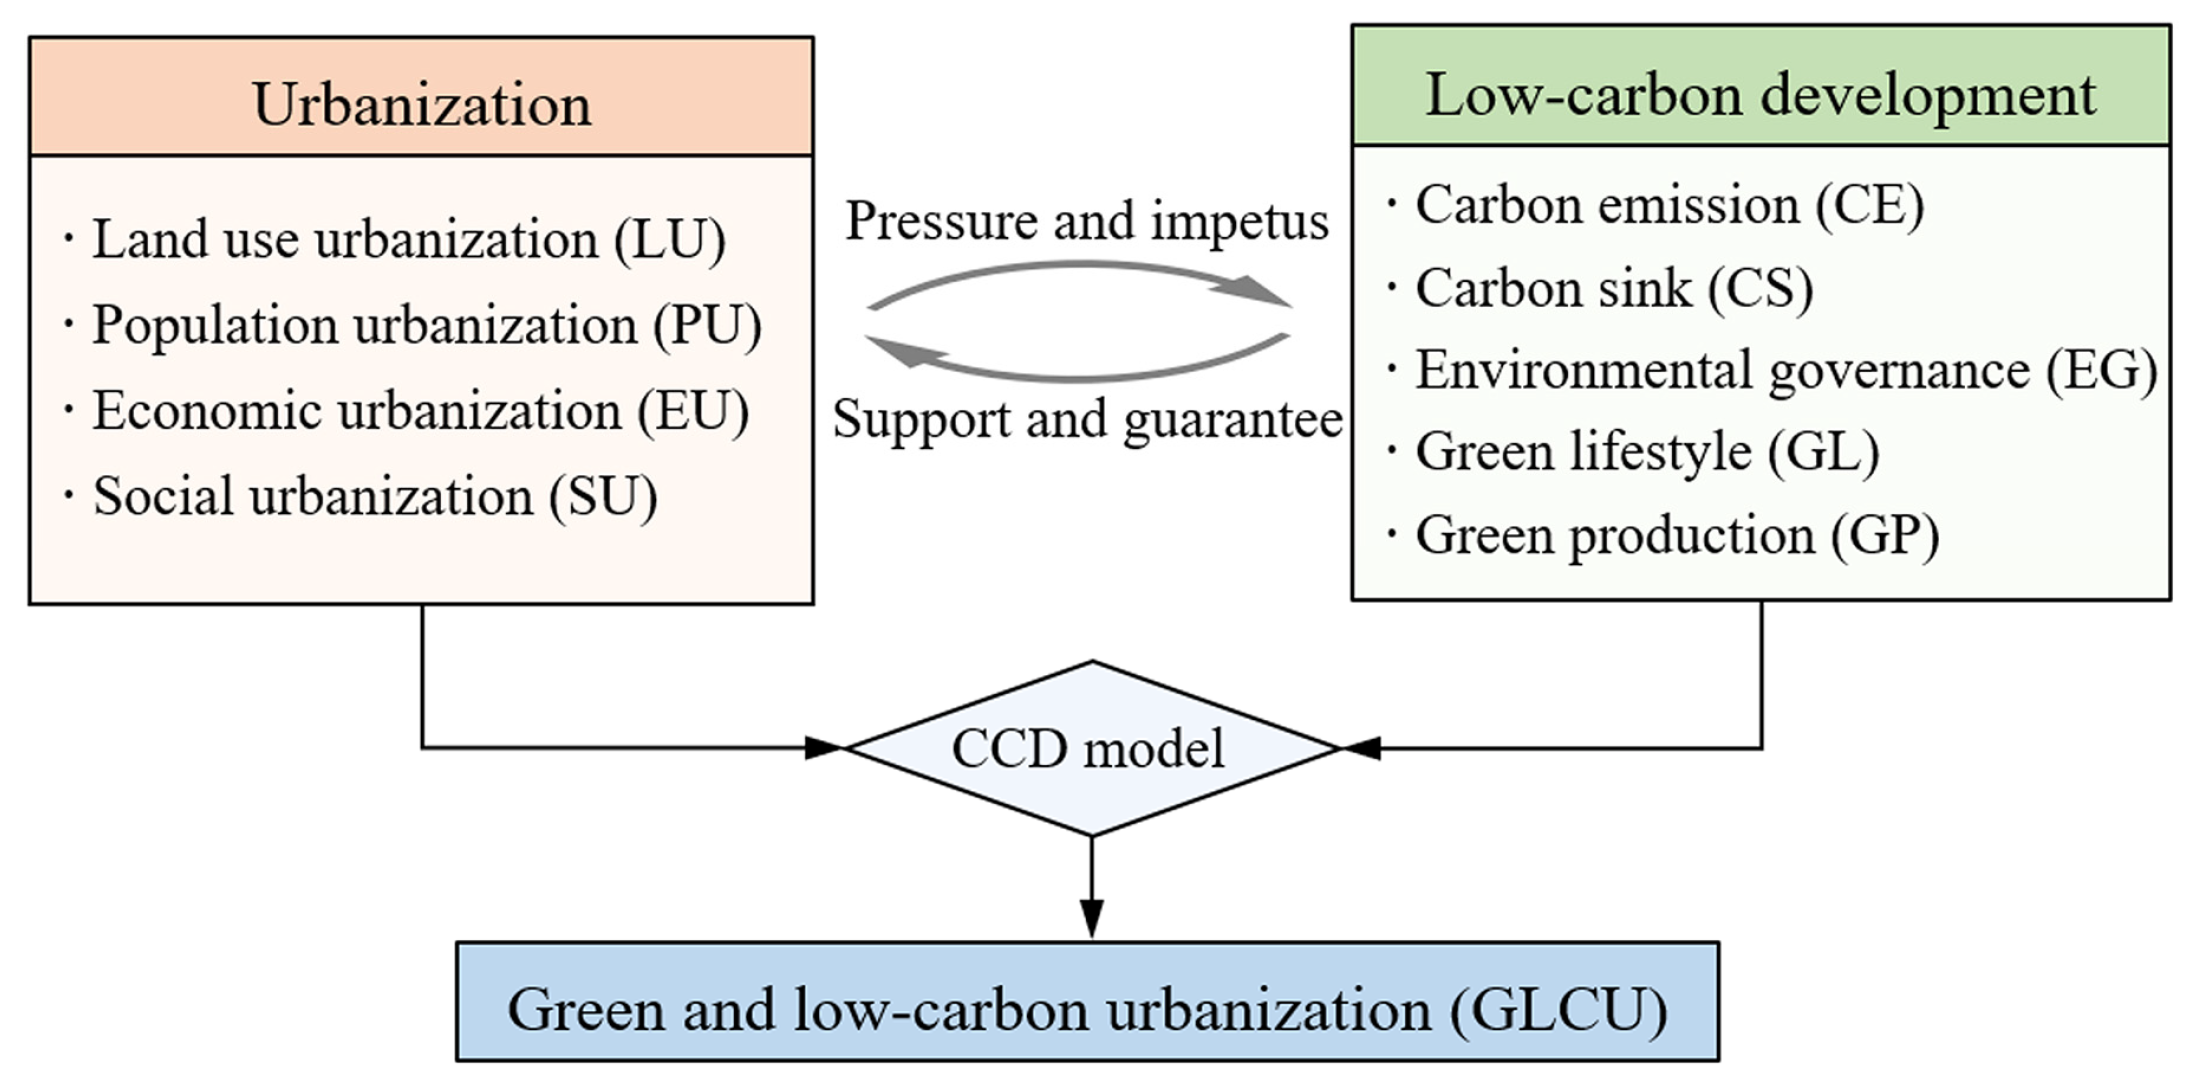
Figure 3.
The spatial–temporal distribution of urbanization level (UL) and low-carbon development (LCD) in the YRD region. (a) Kernel density curve of UL. (b,c) Spatial distribution of UL in 2005 and 2020. (d) Kernel density curve of LCD. (e,f) Spatial distribution of LCD in 2005 and 2020.
Figure 3.
The spatial–temporal distribution of urbanization level (UL) and low-carbon development (LCD) in the YRD region. (a) Kernel density curve of UL. (b,c) Spatial distribution of UL in 2005 and 2020. (d) Kernel density curve of LCD. (e,f) Spatial distribution of LCD in 2005 and 2020.

Figure 4.
Spatiotemporal variation in green and low-carbon urbanization (GLCU) in the YRD region. (a) The index of coupled coordination degree (CCD) of each city. (b,c) Spatial distribution of CCD in 2005 and 2020. (d) Proportion of cities with different GLCU patterns.
Figure 4.
Spatiotemporal variation in green and low-carbon urbanization (GLCU) in the YRD region. (a) The index of coupled coordination degree (CCD) of each city. (b,c) Spatial distribution of CCD in 2005 and 2020. (d) Proportion of cities with different GLCU patterns.
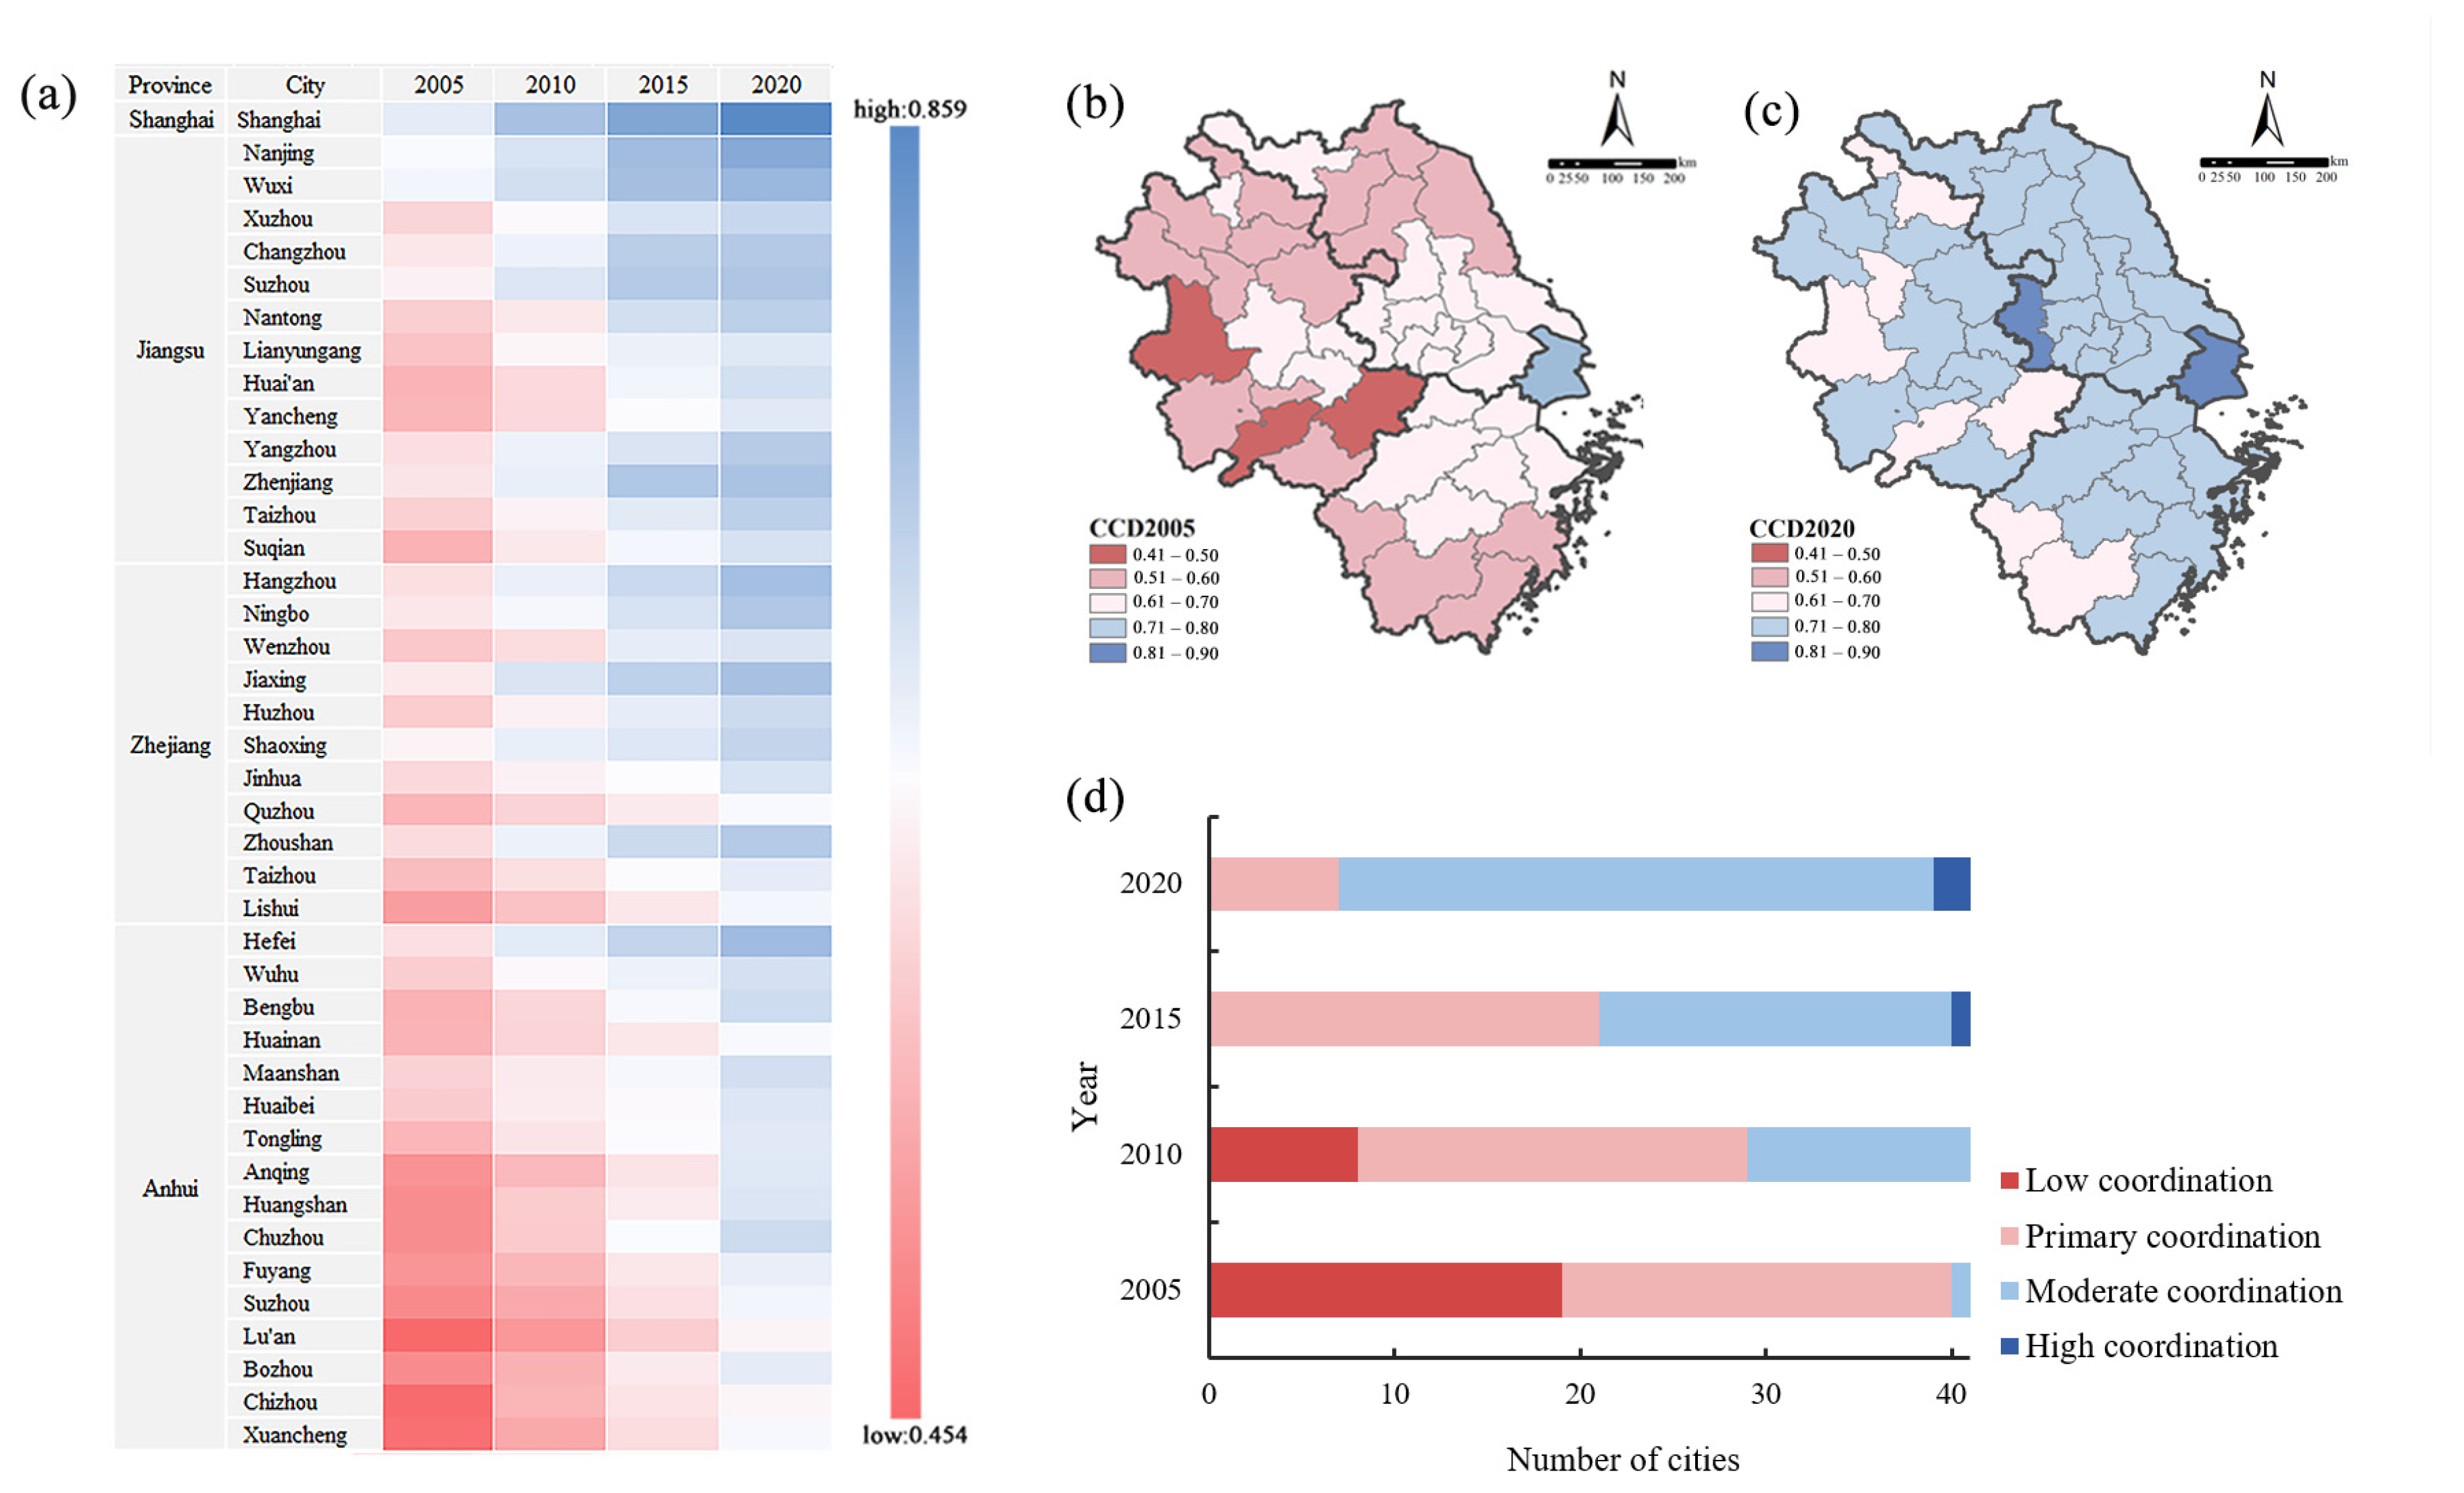
Figure 5.
The correlation coefficients among factors of the green and low-carbon urbanization in the YRD region: (a) 2005; (b) 2010; (c) 2015; and (d) 2020. The size of the circle indicates the strength of the correlation, and the color represents the direction of the correlation. ***, **, and * represent 1%, 5%, and 10% significance levels, respectively.

Figure 6.
The spatial–temporal characteristics of green and low-carbon urbanization (GLCU) pattern. (a) Spatial distribution of the GLCU pattern. (b) Temporal variation in GLCU for each class. (c) The level of urbanization (UL) and low-carbon development (LCD) in each category from 2005 to 2020.
Figure 6.
The spatial–temporal characteristics of green and low-carbon urbanization (GLCU) pattern. (a) Spatial distribution of the GLCU pattern. (b) Temporal variation in GLCU for each class. (c) The level of urbanization (UL) and low-carbon development (LCD) in each category from 2005 to 2020.
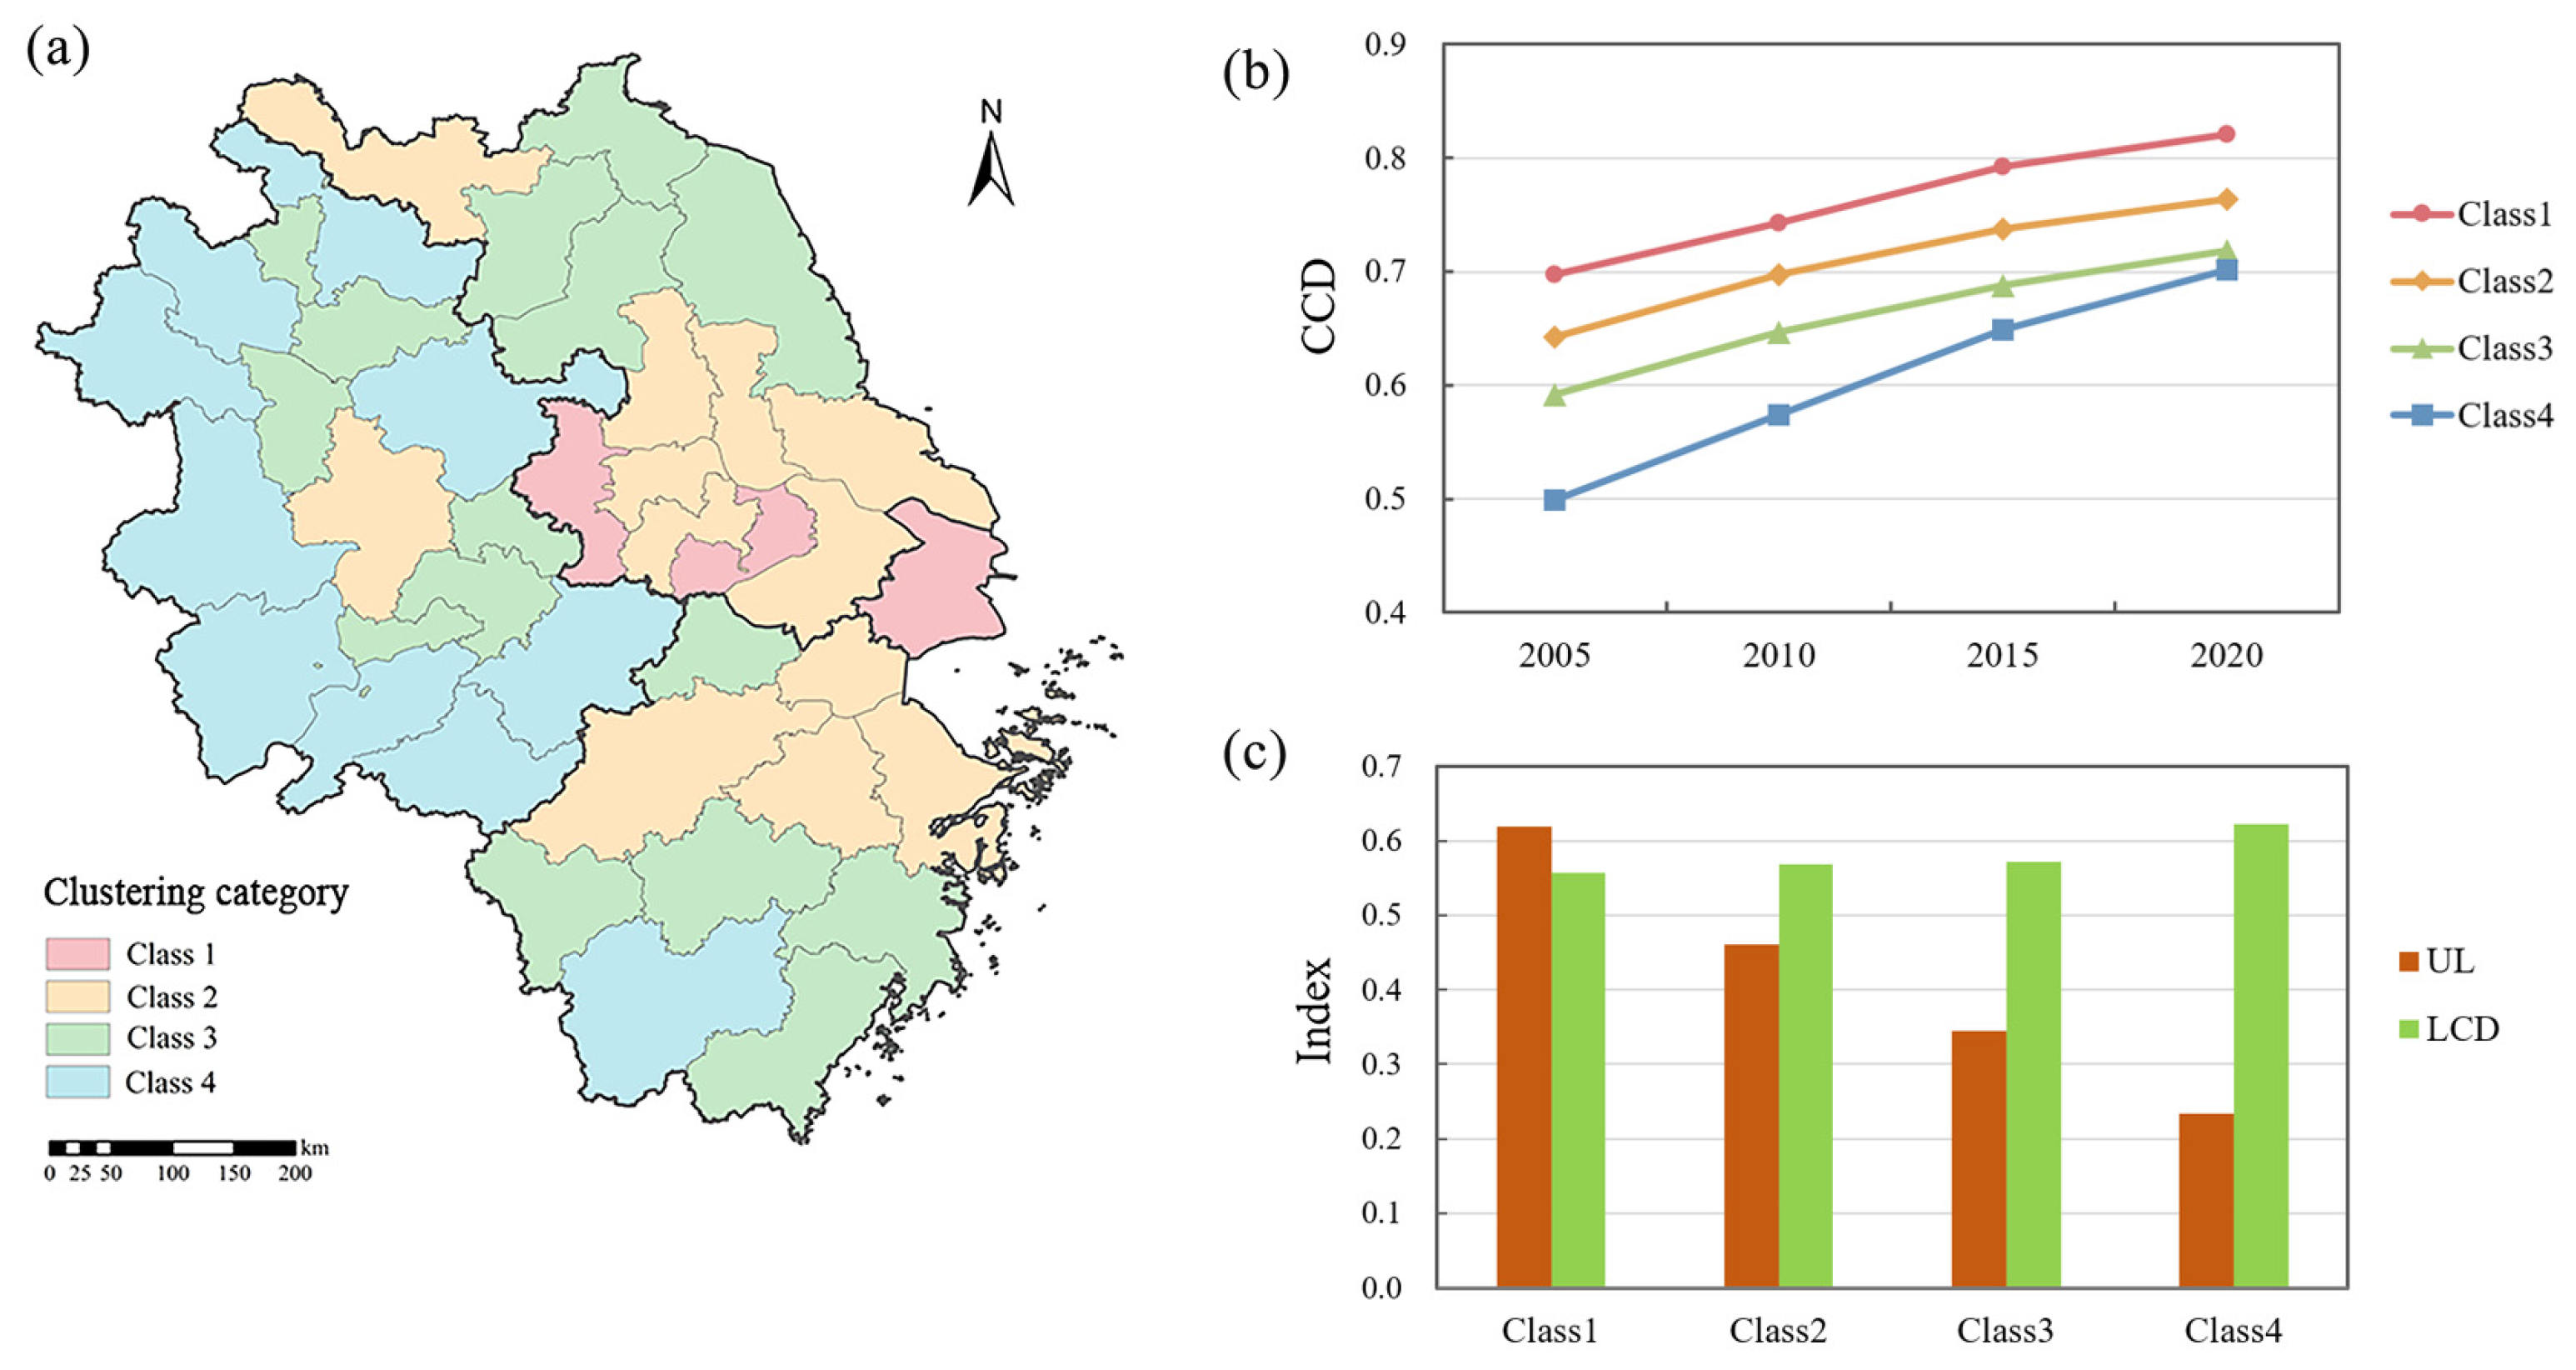
Figure 7.
Driving forces of factors in different green and low-carbon urbanization categories from 2000 to 2020: (a) 2005; (b) 2010; (c) 2015; (d) 2020.
Figure 7.
Driving forces of factors in different green and low-carbon urbanization categories from 2000 to 2020: (a) 2005; (b) 2010; (c) 2015; (d) 2020.

Table 1.
Indicators to characterize urbanization and low-carbon development.
| System | Dimensions | Indicator | Indicator Property 1 | References | Weights |
|---|---|---|---|---|---|
| Urbanization | Land use urbanization (LU) | Built-up area per capita (m2) | + | [34] | 0.0840 |
| Road surface area per capita (m2) | + | [37] | 0.0567 | ||
| Proportion of construction land area (%) | + | [34] | 0.1143 | ||
| Population urbanization (PU) | Urbanization rate of permanent residents (%) | + | [18] | 0.0623 | |
| Proportion of non-agricultural employees (%) | + | [34] | 0.0508 | ||
| Population density (inhabitants/km2) | + | [34] | 0.1660 | ||
| Economic urbanization (EU) | GDP per capita (CNY) | + | [34] | 0.1253 | |
| Proportion of secondary and tertiary industries in the total GDP (%) | + | [34] | 0.0199 | ||
| Disposable income of urban residents per capita (CNY) | + | [35] | 0.1290 | ||
| Social urbanization (SU) | Number of beds in health institutions per 10,000 people (beds) | + | [35] | 0.0684 | |
| Number of public transport vehicles per 10,000 people (vehicles) | + | [34] | 0.1016 | ||
| Water coverage rate (%) | + | [38] | 0.0091 | ||
| Gas coverage rate (%) | + | [38] | 0.0127 | ||
| Low-carbon development (LCD) | Carbon emission (CE) | CO2 emissions per capita (ton) | − | [21] | 0.0450 |
| CO2 emission intensity (ton/10,000 CNY) | − | [21] | 0.0205 | ||
| Carbon sink (CS) | Green coverage rate of built-up area (%) | + | [37] | 0.0543 | |
| Public green area per capita (m2) | + | [34] | 0.1425 | ||
| Environmental governance (EG) | Sewage treatment rate (%) | + | [34] | 0.0519 | |
| Comprehensive utilization rate of general industrial solid waste (%) | + | [37] | 0.0534 | ||
| Green lifestyle (GL) | Domestic water consumption per capita (liter) | − | [39] | 0.0844 | |
| Domestic electricity consumption per capita (kwh) | − | [39] | 0.1400 | ||
| Domestic garbage production per capita (kg) | − | [18] | 0.0926 | ||
| Green production (GP) | The ratio of tertiary industry to secondary industry output value (%) | + | [21] | 0.2278 | |
| SO2 emissions per unit of industrial output value (ton/10,000 CNY) | − | [34] | 0.0232 | ||
| Electricity consumption per unit of industrial output value (kwh/10,000 CNY) | − | [40] | 0.0524 | ||
| Electricity consumption per unit of GDP (kwh/10,000 CNY) | − | [36] | 0.0119 |
1 + refers to a positive indicator; − refers to a negative indicator.
Table 2.
Descriptive statistics for cities in Class 1–4.
| City Class | Urbanization Rate of Permanent Residents (%) | Population Density (Inhabitants/km2) | Per Capita GDP (104 CNY) | Proportion of Secondary Industries in the Total GDP (%) | Per GDP CO2 Emissions (ton/104 CNY) | Per GDP Electricity Consumption (kwh/104 CNY) |
|---|---|---|---|---|---|---|
| Class1 | 86.3 | 2316 | 16.0 | 36.1 | 0.8 | 483 |
| (84.8, 88.1) | (1512, 2767) | (15.7, 16.2) | (30.9, 40.8) | (0.7, 0.8) | (417, 521) | |
| Class2 | 74.7 | 899 | 12.4 | 43.8 | 0.9 | 618 |
| (70.8, 79.5) | (732, 960) | (11.3, 13.3) | (40.1, 47.1) | (0.7, 1.0) | (499, 684) | |
| Class3 | 64.6 | 558 | 7.6 | 42.6 | 1.7 | 728 |
| (61.8, 67.1) | (496, 625) | (6.6, 8.9) | (40.2, 44.5) | (0.7, 2.5) | (597, 901) | |
| Class4 | 53.5 | 347 | 5.4 | 39.8 | 1.1 | 660 |
| (44.9, 60.5) | (171, 479) | (3.8, 6.4) | (35.4, 43.9) | (0.7, 1.1) | (491, 753) |
The data for each category represent the average value for 2020; the values in parentheses represent the interquartile range for cities in each category.
Disclaimer/Publisher’s Note: The statements, opinions and data contained in all publications are solely those of the individual author(s) and contributor(s) and not of MDPI and/or the editor(s). MDPI and/or the editor(s) disclaim responsibility for any injury to people or property resulting from any ideas, methods, instructions or products referred to in the content. |
© 2024 by the authors. Licensee MDPI, Basel, Switzerland. This article is an open access article distributed under the terms and conditions of the Creative Commons Attribution (CC BY) license (https://creativecommons.org/licenses/by/4.0/).
Share and Cite
MDPI and ACS Style
Huang, Y.; Kuai, C.; Wang, F. Spatiotemporal Patterns and Driving Factors of Green and Low-Carbon Urbanization in the Yangtze River Delta Region, China. Sustainability 2024, 16, 4006. https://doi.org/10.3390/su16104006
AMA Style
Huang Y, Kuai C, Wang F. Spatiotemporal Patterns and Driving Factors of Green and Low-Carbon Urbanization in the Yangtze River Delta Region, China. Sustainability. 2024; 16(10):4006. https://doi.org/10.3390/su16104006
Chicago/Turabian StyleHuang, Yingao, Chenjun Kuai, and Feier Wang. 2024. "Spatiotemporal Patterns and Driving Factors of Green and Low-Carbon Urbanization in the Yangtze River Delta Region, China" Sustainability 16, no. 10: 4006. https://doi.org/10.3390/su16104006
Note that from the first issue of 2016, this journal uses article numbers instead of page numbers. See further details here.