Article

Catchment Storage Command Relationship for Sustainable Rainfed Agriculture in the Semi-Arid Regions of Rajasthan, India

1
ICAR-Central Research Institute for Dryland Agriculture, Hyderabad 500059, India
2
ICAR—National Institute of Biotic Stress Management, Raipur 493225, India
3
All India Coordinated Research Project for Dryland Agriculture, Arjia, Bhilwara 311001, India
*
Author to whom correspondence should be addressed.
Sustainability 2024, 16(10), 3996; https://doi.org/10.3390/su16103996
Submission received: 23 January 2024 / Revised: 22 March 2024 / Accepted: 28 March 2024 / Published: 10 May 2024
(This article belongs to the Special Issue Agricultural Water Saving Technologies in Yield Enhancing)

Abstract

:
This study conducted to evaluate catchment storage and command relationship and water use strategies under supplemental irrigation for sustainable rainfed agriculture in the semi-arid regions of Rajasthan, India. In southern Rajasthan, a small category of farmers is above 78%, the potential evapotranspiration is greater than the average rainfall with prevailing arid conditions, and rainfed agriculture is a challenging task. An agricultural micro watershed of 2.0 ha evaluated to establish a catchment storage command area (CSC) relationship and micro irrigation system as an effective water use strategy. The significant results indicate that a farm pond with a storage capacity of 560 m3 with permanent lining (cement + brick) is sufficient to harvest runoff water from a 2.0 ha catchment under the rainfall conditions of below normal (up to 50% deficit), long-term average, and wet years. Harvested rainwater can be used to irrigate a command area of even up to 1.0 ha, with supplemental irrigation of 5 cm in both the seasons of kharif as well as rabi. The two crops, maize (Zea mays) in the kharif season and coriander (Coriandrum sativum) in the rabi season, were significantly profitable with supplemental irrigation by adopting a drip irrigation system.

1. Introduction

1.1. Statement of the Problem

Rainfed agriculture in India accounts for about 51% (72.98 m ha) of the net cultivated area and supports 40% of food grain production and 60% of the livestock population, which mainly depends on monsoon rainfall. This is also mainly monsoon-reliant and risk-prone, and it often encounters extreme variations in rainfall, resulting in a wide range of fluctuations and instability in crop yields [1]. Farmers in the southern part of Rajasthan, India, normally face severe water scarcity under deficit rainfall conditions. During long dry spells, crops experience severe moisture stress and these regions classified as an arid/semi-arid region. The agricultural land has fragmented into small holdings; crop yields are not economical and fluctuate from season to season, owing to erratic rainfall [2].

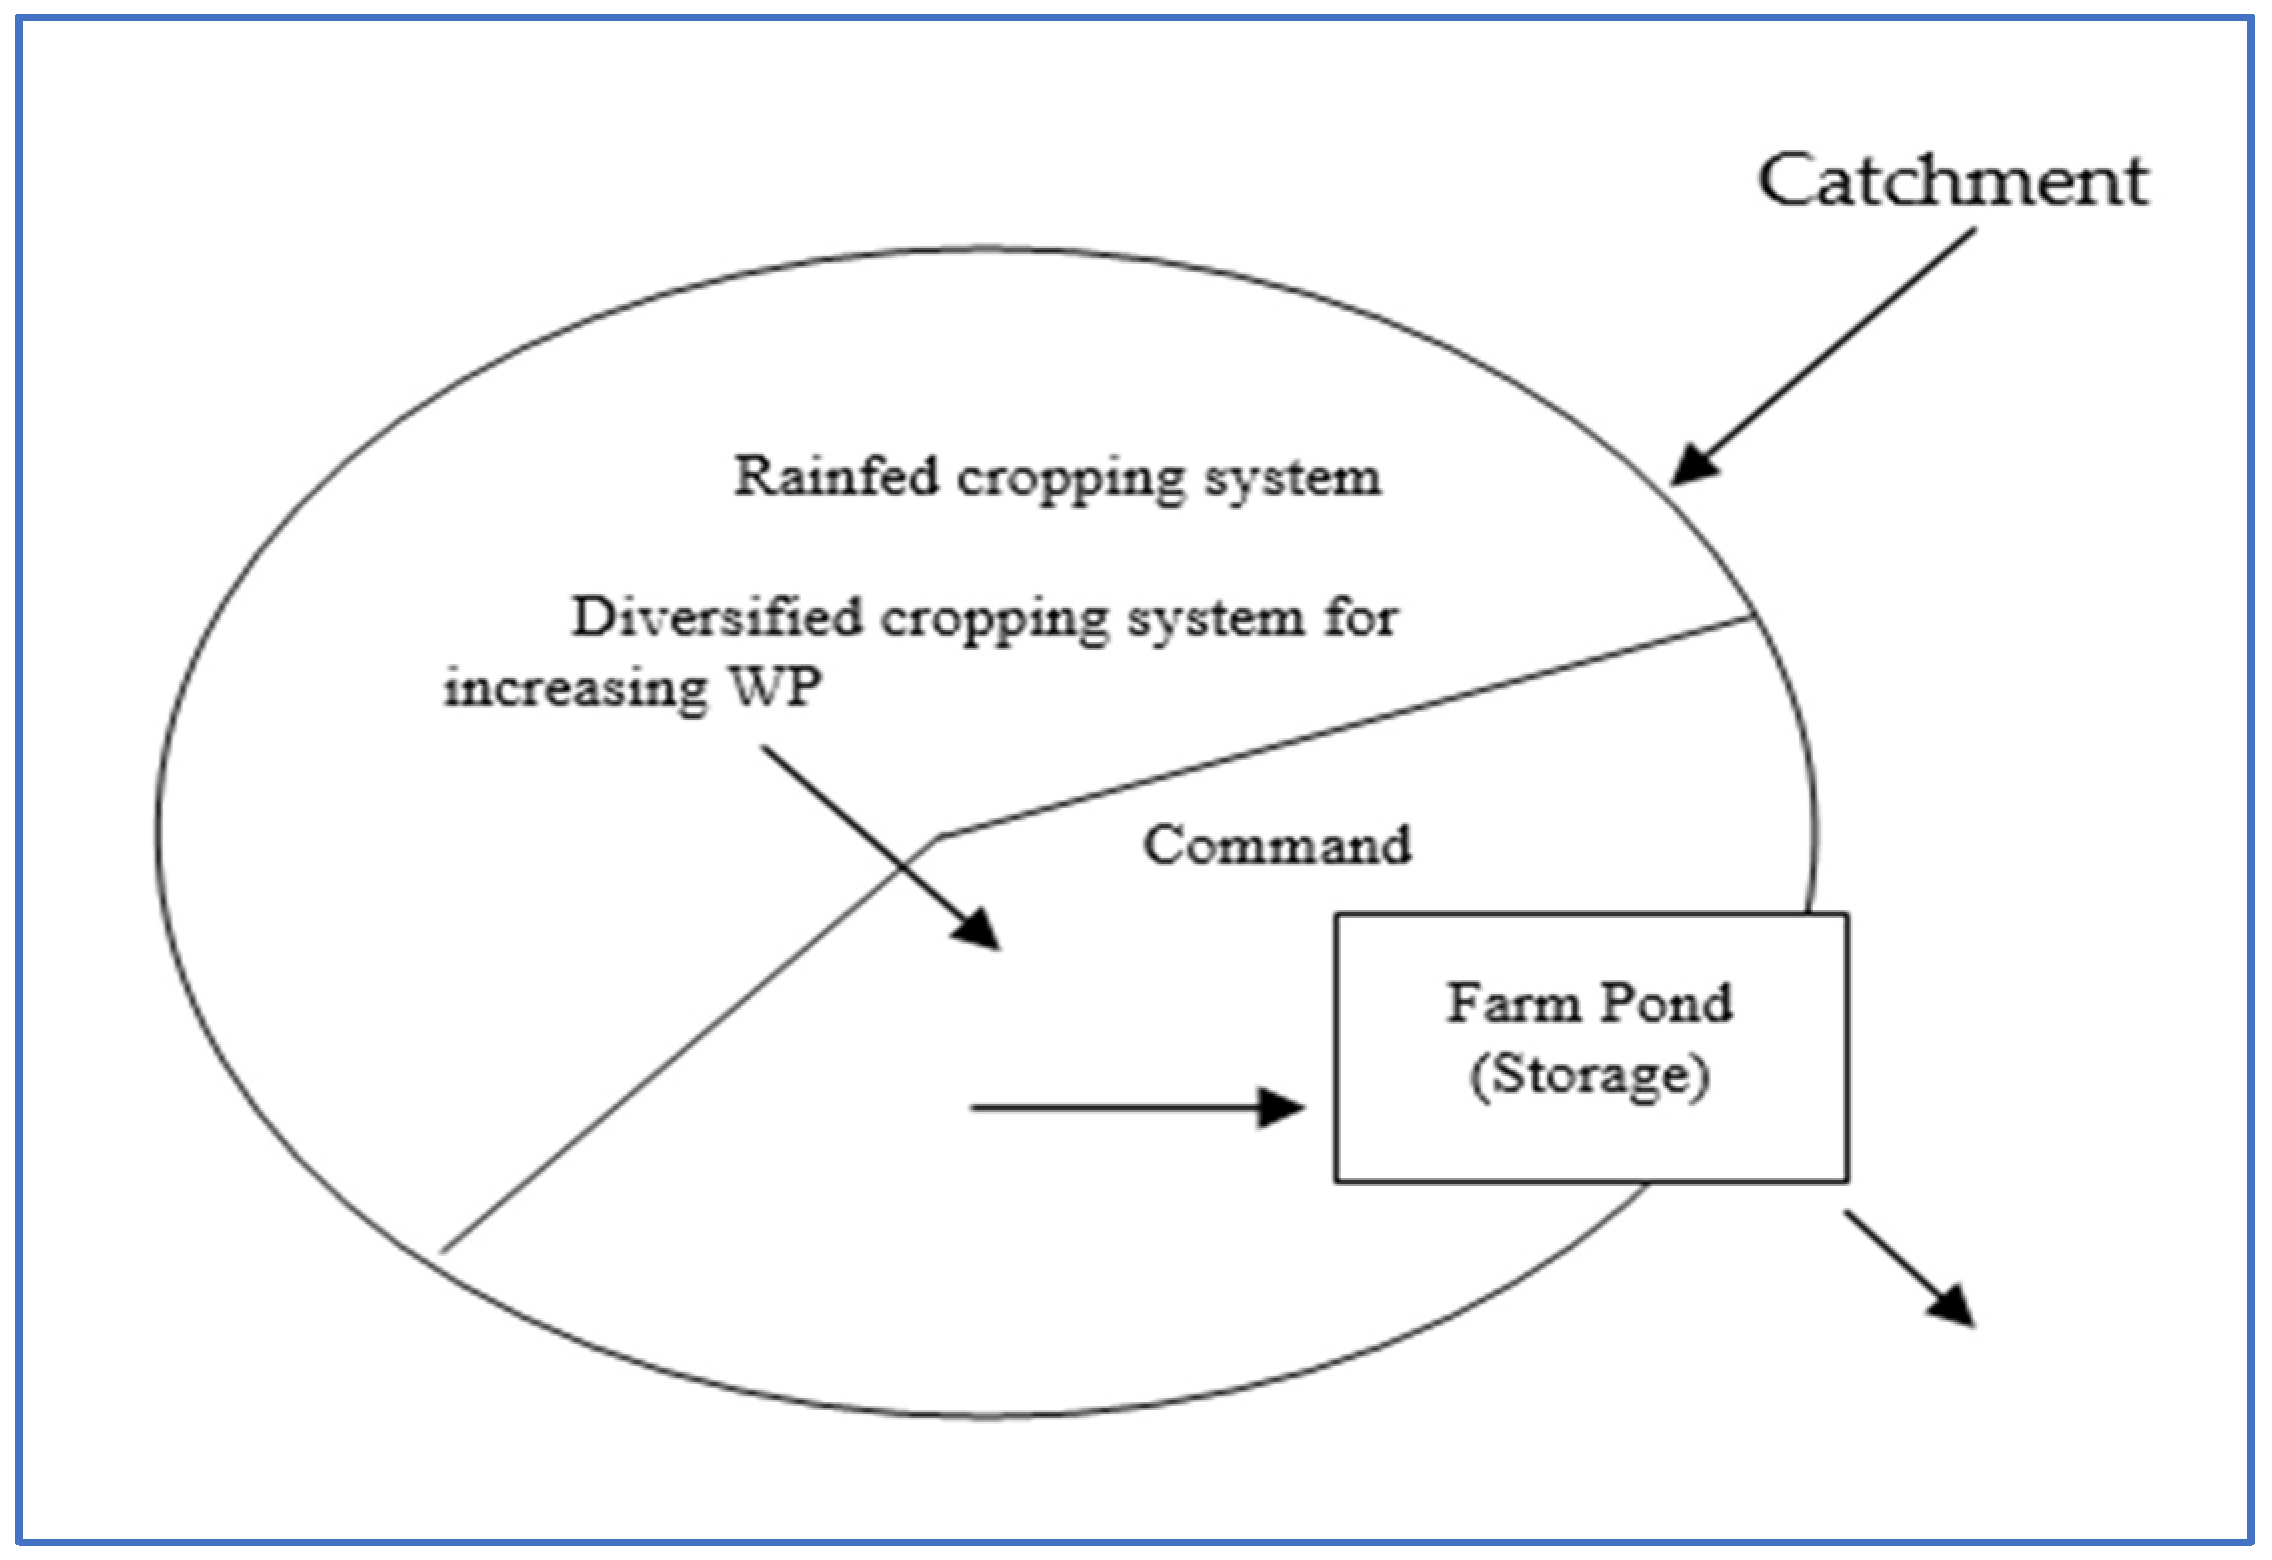
1.2. Genesis and CSC Concept

The CSC, catchment–storage–command, area relationship is a similar concept of water-harvesting tanks constructed under different watershed development programs that used for storing runoff water, groundwater recharge, and utilization as supplemental irrigation for increasing crop yields and multiple other uses. A catchment area is an area of land that collects water after rainfall, and the command area is the extent of the area, which can be irrigated from that water storage. There are approximately 350,000 storage tanks for rainwater harvesting structures existing in India [3]. The major challenges in the design of water harvesting systems include determining the catchment area to storage capacity ratio [4]. However, the design is, normally based on local experience, which depends on climate, topography, soil, and land use characteristics. Samra et al [5] conducted a review of water-harvesting systems at the national level. He emphasized that performance indicators such as catchment area, storage capacity, and command area of the system be indicated while reporting the studies on these systems. As a result, the concept of CSC is to conserve maximum moisture under watershed mode and store it for use in the donor catchment or downstream area during dry spells and crop critical stages.

1.3. Definition of Drypell

According to Barron et al. [6], a dry spell refers to a period greater than 5 days without rainfall, which results in a soil water deficit that could lead to crop water stress. In India during the SWM (southwest monsoon) season, a prolonged dry spell lasting 7 days may lead to drought and have major impacts on agricultural production [7].

1.4. Review of Literature

Looking into the RWH (rainwater harvesting) and efficient utilization in rainfed agriculture enhanced crop yields by reducing the risk of production in many Sub-Saharan African countries [8,9,10,11,12,13,14]. For legume crops like cowpea in a country like Nigeria, the savannah zone with the application of supplemental irrigation collected from runoff water has the dual benefits of alleviating the prevailing slack periods and improving the yields of smallholder farming systems [15]. Legumes like rye (Secale cereale) and sunhemp (Crotalaria spectabilis) improve major physical properties of the soil when compared to the monocropping maize crop.
Rainwater harvesting also adopted in India in an attempt to alleviate depleting groundwater storage. However, there is a need for better understanding of the impacts of many small dams within a watershed, particularly hydrological studies [16]. Excess utilization of groundwater has increased the accessibility of a reliable source of irrigation water for smallholder farmers across India, and this helps to relieve poverty in rural areas. Overexploitation of groundwater leads to a decline in water levels. As a result, RWH has been widely implemented to raise falling groundwater levels, but with no scientific or hydrological studies to confirm this fact [16]. Using rainwater for household tasks like cleaning, laundry, and garden watering can save drinking water, which is one advantage of implementing rainwater harvesting and storage system. It also reduces runoff by collecting at home, which minimizes the volume of water running into storm drainage systems and prevents the risk of floods [15].
Recent study results reveal that small dams (storage structures) constructed by gabions and wood were considered NBS (nature-based solutions) to manage flood risk and overland flow, even in mountainous regions. Rainwater-harvesting structures control flood peaks, store runoff water, and act as a climate-change-mitigating strategy and have minimum maintenance with an ecological concept [17]. In another study in Southern Burkina Faso, supplementary irrigation found to be cost-effective and enhance income, especially during drought-prone years. However, gains from supplemental irrigation have limitations within the catchment because labor and capital are constraints on pond technology [18]. The impact of long-term rainwater conservation structures like staggered contour trenches with a density of 417 trenches/ha was the best conservation practice under the horti-pastoral land use system. This kind of study will be helpful to watershed managers and policymakers to reclaim and improve the sustaining productivity of degraded ravine lands [19]. On-farm water-productivity techniques if coupled with improved irrigation management options; better crop selection and appropriate cultural practices; improved genetic make-up; and timely socioeconomic interventions will help to achieve integrated farm resource management and improvement in the dry rainfed region of West Asia and North Africa [20].
According to Oweis, T. and Hachum, A. [21], rainwater management through dug-out farm ponds is an important part of the strategy for enhancing the productivity of rainfed agriculture. Rainwater harvesting and utilization were economically viable in the district of Adilabad, India, receiving higher annual rainfall (1100 mm) with 69 percent of water harvesting in farm ponds generating an additional income of more than INR 20,000 per year when compared to 8 percent in the regions receiving (Ananthapuramu district, India) less annual rainfall (450 mm). A study on the performance of small rainwater-harvesting structures (farm ponds) in major rainfed states of India revealed that the rainwater harvested and used for either supplemental irrigation or recharging open wells. The use of farm ponds in Maharashtra resulted in a significant increase in farm productivity (12–72%), cropping intensity, and consequently farm income [22]. In Chittoor district, India, harvested rainwater in farm ponds and utilized profitably for supplemental irrigation to mango plantations, vegetables, and other crops and animal-based enterprises with net returns estimated to be between USD 120 and 320 per structure per annum. Rainwater harvesting in small farm ponds is a solution to overcome the increased frequencies of droughts, particularly midseason and terminal droughts of rainfed crops under climate change scenarios [23]. This technology has the potential to increase the availability of water for supplemental irrigation, as well as to increase cropped area and productivity, leading to an increase in net returns from the crops. Several studies have demonstrated that collecting agricultural runoff into dug-out farm ponds and supplementing irrigation can boost and stabilize crop productivity [24]. In certain Indian states, there is ample scope and possibility for capturing excess runoff throughout the rainfed regions [25].

1.5. Limitations of Rainwater Managment

Various studies revealed that the rainwater harvested and stored in a farm pond without lining has evidence of seepage losses, salinity, and water logging, etc., ultimately decreasing the fertility of the adjacent agricultural lands [26,27,28]. A study results revealed that rainwater harvesting structures like dug-out ponds constructed with a lining of calcareous soil recorded a minimum seepage rate of 1.05 to 1.08 cm/m/day compared to unlined farm ponds. The reduction in seepage rate varied from 61.4 to 62% over the control [29]. The major constraints observed in a study on different lining materials used for farm ponds were exposure of lining material to high temperatures during the summer, possible physical damage by animals, poor maintenance of lining material, availability of runoff during the offseason, etc. [30].

1.6. Climate Change Impact on Rainfed Crops

Investigation results on projected climate change on the phenology, effective rainfall (Pe), crop water requirement, and irrigation water requirement of maize indicated that mean seasonal maximum temperature, minimum temperature and rainfall were projected to increase [31]. Efficient use of soil moisture, either by conserving it in-situ or ex-situ, i.e., harvesting the runoff water and reusing it, can lead to sustainable productivity in rainfed crops.
Based on the above reviewed research gaps, a study was proposed and conducted at the All India Coordinated Research Project on Dryland Agriculture (AICRPDA) center in Arjia district, Rajasthan, India, to evaluate the catchment storage and command area relationship with the following objectives:
  • To establish a rainfall–runoff relationship and design a rainwater-harvesting structure in the form of a farm pond for threshold storage.
  • To develop a water use strategy for supplemental irrigation to enhance water productivity with diversified farming systems.

2. Materials and Methods

2.1. Study Hypothesis and Conceptualization

A field study was conducted based on the concept of “Harvesting of rainwater from a defined catchment and establishing a relationship between catchment area, maximum storage and providing supplemental irrigation in the command area for enhancing water productivity in rainfed agriculture” at the AICRPDA (All India Coordinated Research Project of Dryland Agriculture) center, Arjia, located in Bhilwara district, India. The conceptual diagram of the CSC relationship with an RWH farm pond is shown below (Figure 1).

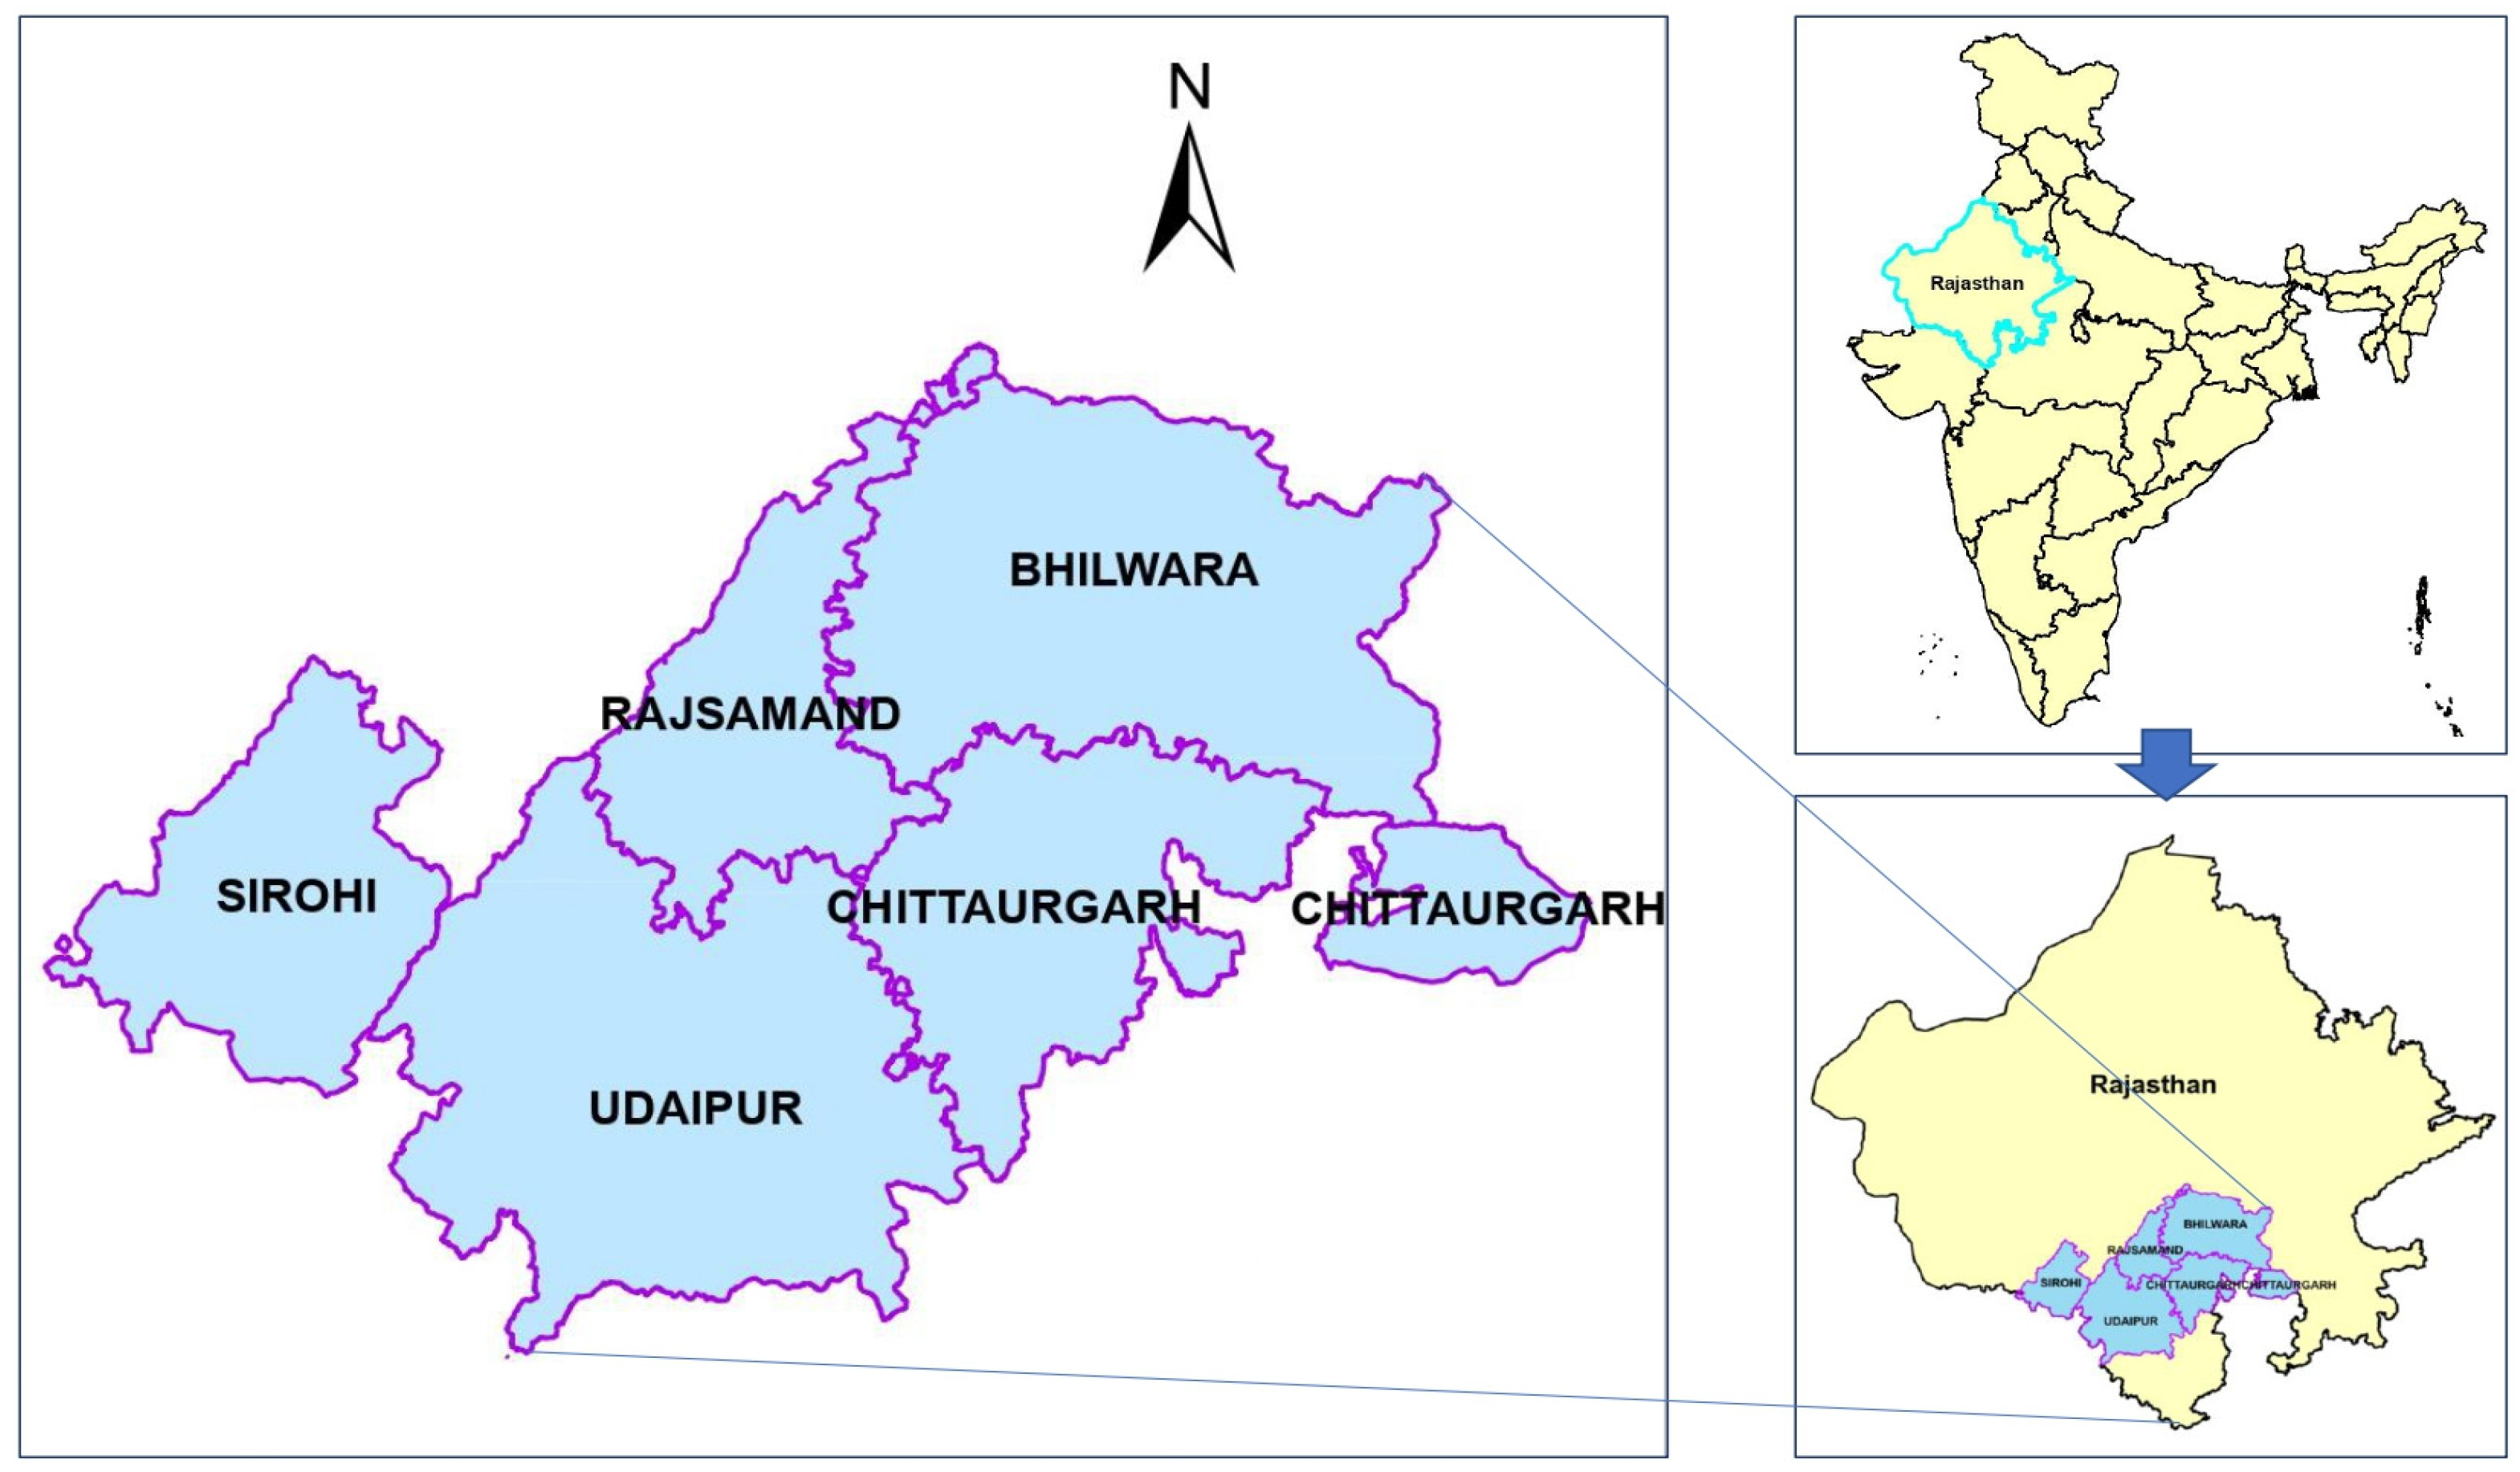
2.2. Study Area and Climate

The AICRPDA center, Arjia, located in Bhilwara district, India (25°23′55.25″ N, 74°36′44.11″ E and 406 m MSL), represents the domain districts consisting of Bhilwara, Rajsamand, Chittoorgarh, Udaipur, and part of Sirohi districts in Rajasthan, situated in the climate of sub-humid southern plains and Aravali hill zone (Figure 2). The long-term average annual rainfall of the station is 658.00 mm, out of which, 93% is received through the southwest monsoon (June–September) and the rest as winter rainfall. The climate of the region is semi-arid, with an average of 33 rainy days. Temperature varies from a maximum of 46 °C in summer to a minimum of 8.1 °C in winter. Normal and yearly water balance studies show that cumulative potential evapotranspiration (PET) is 1666.5 mm, which indicates that available rainfall is insufficient to meet the water demand of crops. The total monthly-accumulated water deficit is 1037 mm, which is partly met through storage and recharge of rainfall during the monsoon season. The soils of this region are ustochrepts and are medium textured, reddish to brown in color, high in base saturation, and medium in depth. In many parts, there are loam and clay loam soils with a saline base. These soils were derived from sedimentary alluvium. The available water holding capacity of soils varies from 90 to 120 mm, with the other important physical and chemical properties listed below (Table 1).

2.3. Site Description

A defined agricultural micro watershed with a catchment area of 2.0 ha was demarcated for rainwater harvesting in to a farm pond. The farm pond was excavated mechanically, and manual labor was used for compaction, etc., at the lower point of the field so that all the runoff water was able to be collected easily with a minor gradient of slope in the field. The dimensions of the farm pond were top 16.5 × 16.5 m, depth 3.0 m, and side slope 1:1, with a volume of 560 m3. An inlet was provided for a smooth entry of water into the farm pond, and an outlet weir was also constructed (stone masonry) for safe disposal of the excess runoff.
A cement, brick, and concrete lining with a thickness of 0.12 cm on the sides and bottom was made to control seepage losses on all four sides, including the bottom. An electric pump set of 3.0 hp was installed for lifting harvested rainwater. A rain gauge was installed to measure rainfall data, and at the inlet, a H-type flume was installed along with an automatic stage-level recorder for measuring the stage and runoff. The characteristics of the micro watershed with land use and land management with a relief ratio of 0.2 and a relative relief ratio of 0.004 indicated little variation in the steepness and intensity of the erosion process in the watershed (Table 2). Hence, land use plays a major role in generating overland flow and runoff in this micro watershed. The shape of the watershed was characterized by the shape index, which influences the time taken for water to travel from a remote point to an inlet (time of concentration). Daily rainfall and maximum and minimum temperatures during the experimental seasons (kharif) are presented in Figure 3. From Figure 3, it can be observed that the year 2019 was a drought year with crop seasonal of only 109.2 mm. The maximum temperature through the cropping season was above 35 °C with a minimum of 25 °C, and these conditions were not suitable for crops. During the period from 2010 to 2014, the crop seasonal rainfall ranged from 421 to 610 mm, representing average to good rainfall conditions with good crop yields. In all the years from 2009 to 2014, the terminal drought conditions occurred, except during the year 2011, with the crop period rainfall of 610.0 mm with uniform distribution without any effective dry spells. The minimum and maximum temperatures were also in average conditions, ranging from 20 to 30 °C, favoring the crop production situation.

2.4. Land Use Landcover

Maize (Zea mays) is the major crop in this region, and it occupies 33% of the total cultivated area, with other important crops being sorghum, black gram, green gram, sesame, groundnut, cluster bean, and in some parts cotton during the kharif season. Wheat, mustard, gram, barley, and taramira were major rabi season crops. Perennial fruit crops are Anola, pomegranate, and ber. The area under fodder crops is mainly in common pool resources (CPRs) and uncultivated areas. In India, maize is the third most important food crop after rice and wheat, with an average productivity of 2430 kg/ha. Rajasthan state covers 9.9% of Indian maize production. Maize is a staple food for humans and a quality feed for animals (https://farmer.gov.in/M_cropstaticsmaize.aspx (accessed on 23 July 2022)). Normal crops like maize and pulses are sown in the catchment area during the kharif season, even with land configurations like field bunds, ridges, and furrows and some area under intercropping too. In the donor area and under the downstream side during the rabi season, crops like wheat, mustard, gram, barley, and taramira are sown. For rabi, crops are provided supplemental irrigation if harvested rainwater remains available in the farm pond.

2.5. Rainfall and Runoff Data Recording

Rainfall data recorded daily with the help of an installed rain gauge and month-wise mean runoff-producing rainfall events were calculated (Table 3). Since the catchment is an agricultural micro watershed, some of the rainwater was conserved due to field interventions like field bunds, crop cover, and other land configurations. Runoff generated beyond these in-situ conservation measures was enrouted to the inlet and was recorded with the help of the H-type flume and stage-level recorder installed. Runoff data were analyzed and tabulated with respect to monthly run-off-yielding rainfall storms from 1994 to 2021 to establish a rainfall–runoff relationship (Table 4). However, there were no data available during the years 1995, 1998–2003, and 2005 (8 years). Data for these years were recorded but misplaced and could not be used for analysis. Still, 19 years of data was tabulated in Table 4 for further analysis.

2.6. Rainwater Utilization Strategy in Enhancing the WP of a Diversified Farming System in Kharif

An experiment was conducted to evaluate the rainwater utilization strategy to enhance water productivity (WP) in a diversified farming system. The command area was decided by referring to the earlier literature. A minimum area can be irrigated with harvested rainwater of unit volume. A command area measuring 64 m × 32 m (2048 sq m) just above the farm pond in the donor area of the catchment was selected for the experimentation. We assumed that at least a volume of 512 m3 can be harvested into the designed farm pond to impose all the treatments.
Harvested rainwater was applied through drip irrigation (5 cm) as well as surface irrigation, i.e., flood irrigation (5 cm) in diversified cropping systems for higher income during the kharif season for the period 2009–2014 (5 years). The design of the experiment was RBD (randomized block design) with five main treatments of different vegetables, viz., sponge guard, bottle gourd, ridge gourd, kachari, vegetable cowpea, and maize, with 2 irrigation methods. The spacing was adopted with a row-to-row distance (cm) in maize 60 cm; bottle gourd: 2 × 2 m; ridge gourd, sponge guard, and kachari: 1 × 0.5 m; and cow pea: 30 cm. The two irrigation methods were surface irrigation and drip irrigation. The depth of irrigation was (5 cm), applied at 50% of pan evaporation, i.e., 50% deficit irrigation, in two treatments in maize (var. PEHM2), irrigated (5 cm) and control (maize without irrigation). A supplemental irrigation of 5 cm was applied in all the treatments across the crops during the terminal drought situation (because of the early withdrawal of the monsoon; Figure 3), with drip irrigation as well as surface irrigation in all the years except during 2013, as there was no water available in the farm pond due to drought. Year-wise dry spells from 2009 to 2014 are described in the Table 5. All these vegetable crop yields were harvested and then converted to maize grain equivalent yields for convenience in comparison. Maize is a dominant crop in this region and commonly consumed as a staple food. Further, these results were reported in terms of maize grain equivalent yield (MGEY), as shown in Table 6.

2.7. Rainwater Utilization Strategy in Enhancing WP of the Diversified Farming System in Rabi

Another experiment was conducted during 2011–2014 (4 years) for enhancing water productivity (WP) by utilizing harvested rainwater during the post-monsoon (rabi) season on different diversified crops for higher income. If harvested rainwater in the farm pond remained after the kharif season, it was utilized as supplemental irrigation in the rabi season. In all these four years of experimentation, harvested rainwater was available in the farm pond. The experiment was designed in a randomized block design with three main treatments: coriander, greenpea (vegetable), and brinjal, with two irrigation methods, surface irrigation and drip irrigation, with depths of irrigation of 5 cm and applied at 50% of pan evaporation, i.e., 50% deficit irrigation. For all the crops, viz., coriander, pea, and brinjal, supplemental irrigation (5 cm) was applied through drip irrigation as well as surface irritation during critical stages like vegetative, flowering, and fruit setting in dry spells during the crop growing period. The details of dry spells occurred year-wise are shown in Table 5. Harvested crop yields were further converted into pea pod equivalent yields for easy comparison. The results are reported in terms of pea pod equivalent yield (PPEY) (Table 7).

2.8. Irrigation Schedule

The crops raised in this study were maize and vegetables under rainfed conditions. During the kharif season, the harvested rainwater utilized as supplemental irrigation mainly during dry spells (Table 5 and Figure 3) to make the crop sustainable and further augment the yields, supplemental irrigation has to be applied at critical crop stages if water is available. The quantity of irrigation applied was 5 cm to address dry spells that occurred due to climate vulnerability.

2.9. Statistical Analysis

Data analysis performed by the using analysis of variance (ANOVA) with the SPSS software 2022, and the least-significant difference test method (LSD) (p < 0.05) used for the ANOVA. All researchers very commonly use these statistical methods and hence, the details of these methods were not described. Analyses carried out using the runoff volume recorded with respect to runoff yield under different rainfall storms. In addition, we analyzed the crop data recorded under the experiments conducted to evaluate the diversified crops (vegetables) during kharif season as well as rabi season. Data with significant results (coefficient of deviation at 5%) were tabulated in Table 4, Table 5, Table 6 and Table 7. Microsoft Excel used to process these results.

3. Results and Discussion

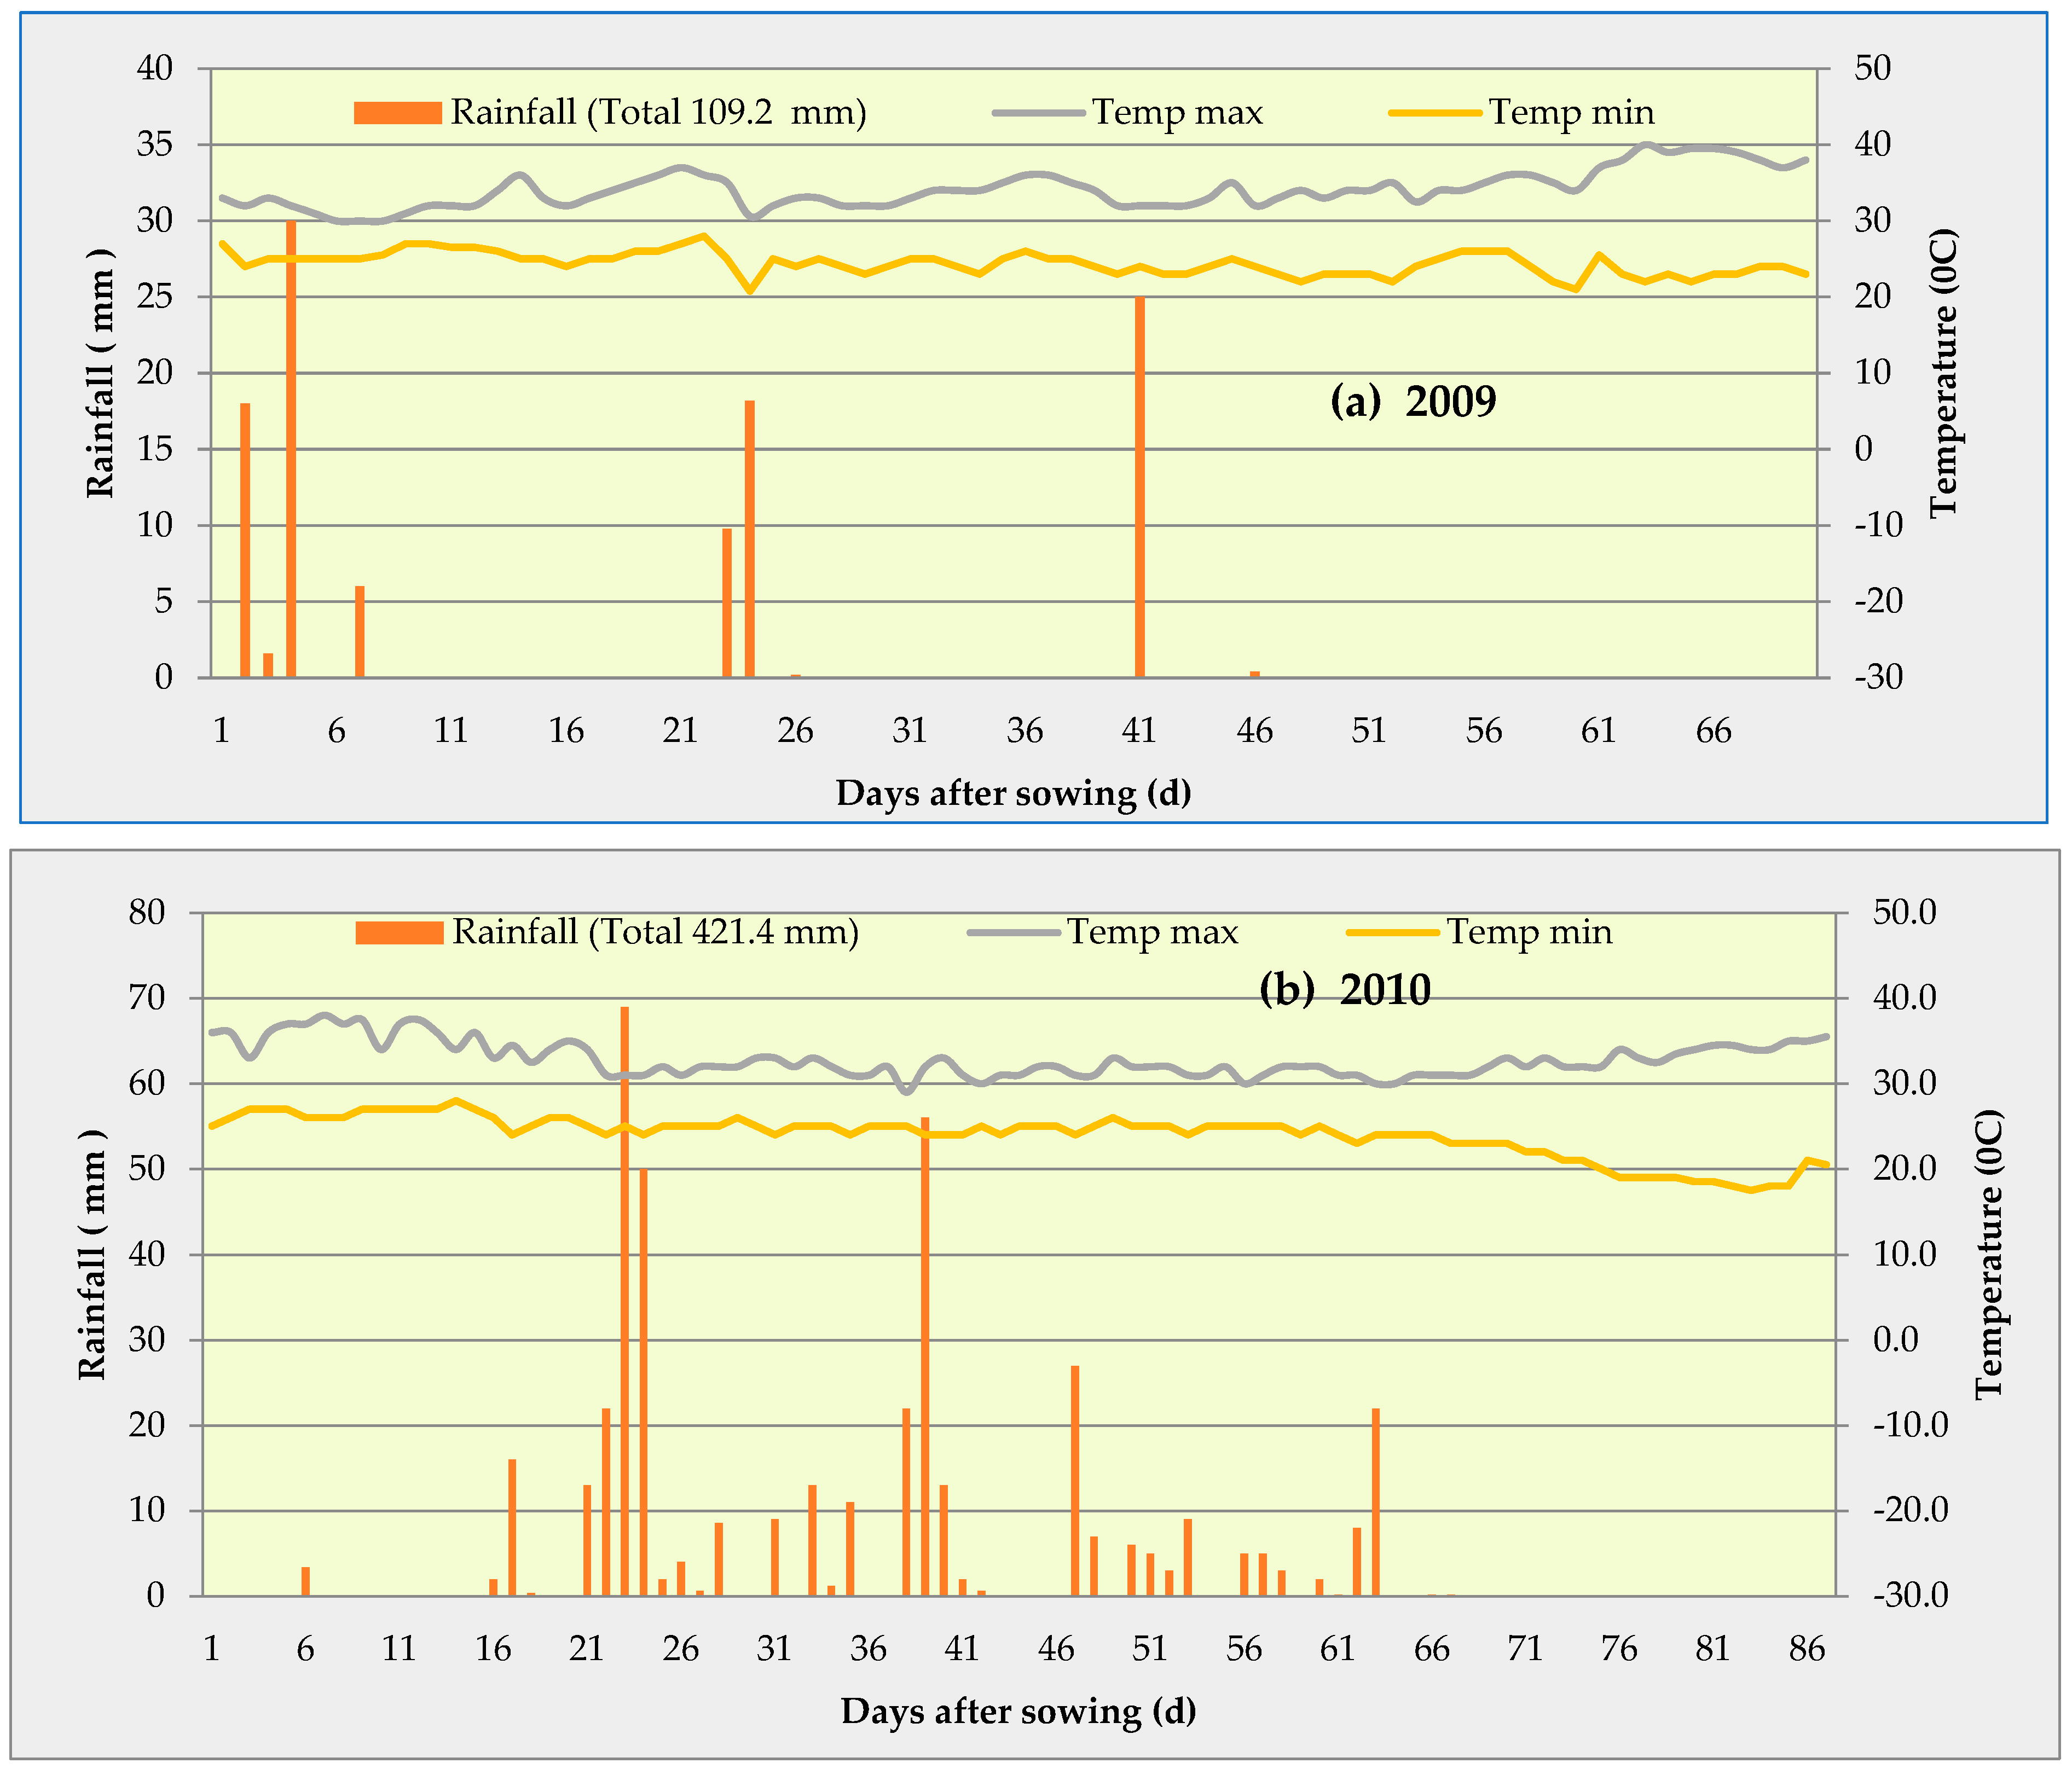
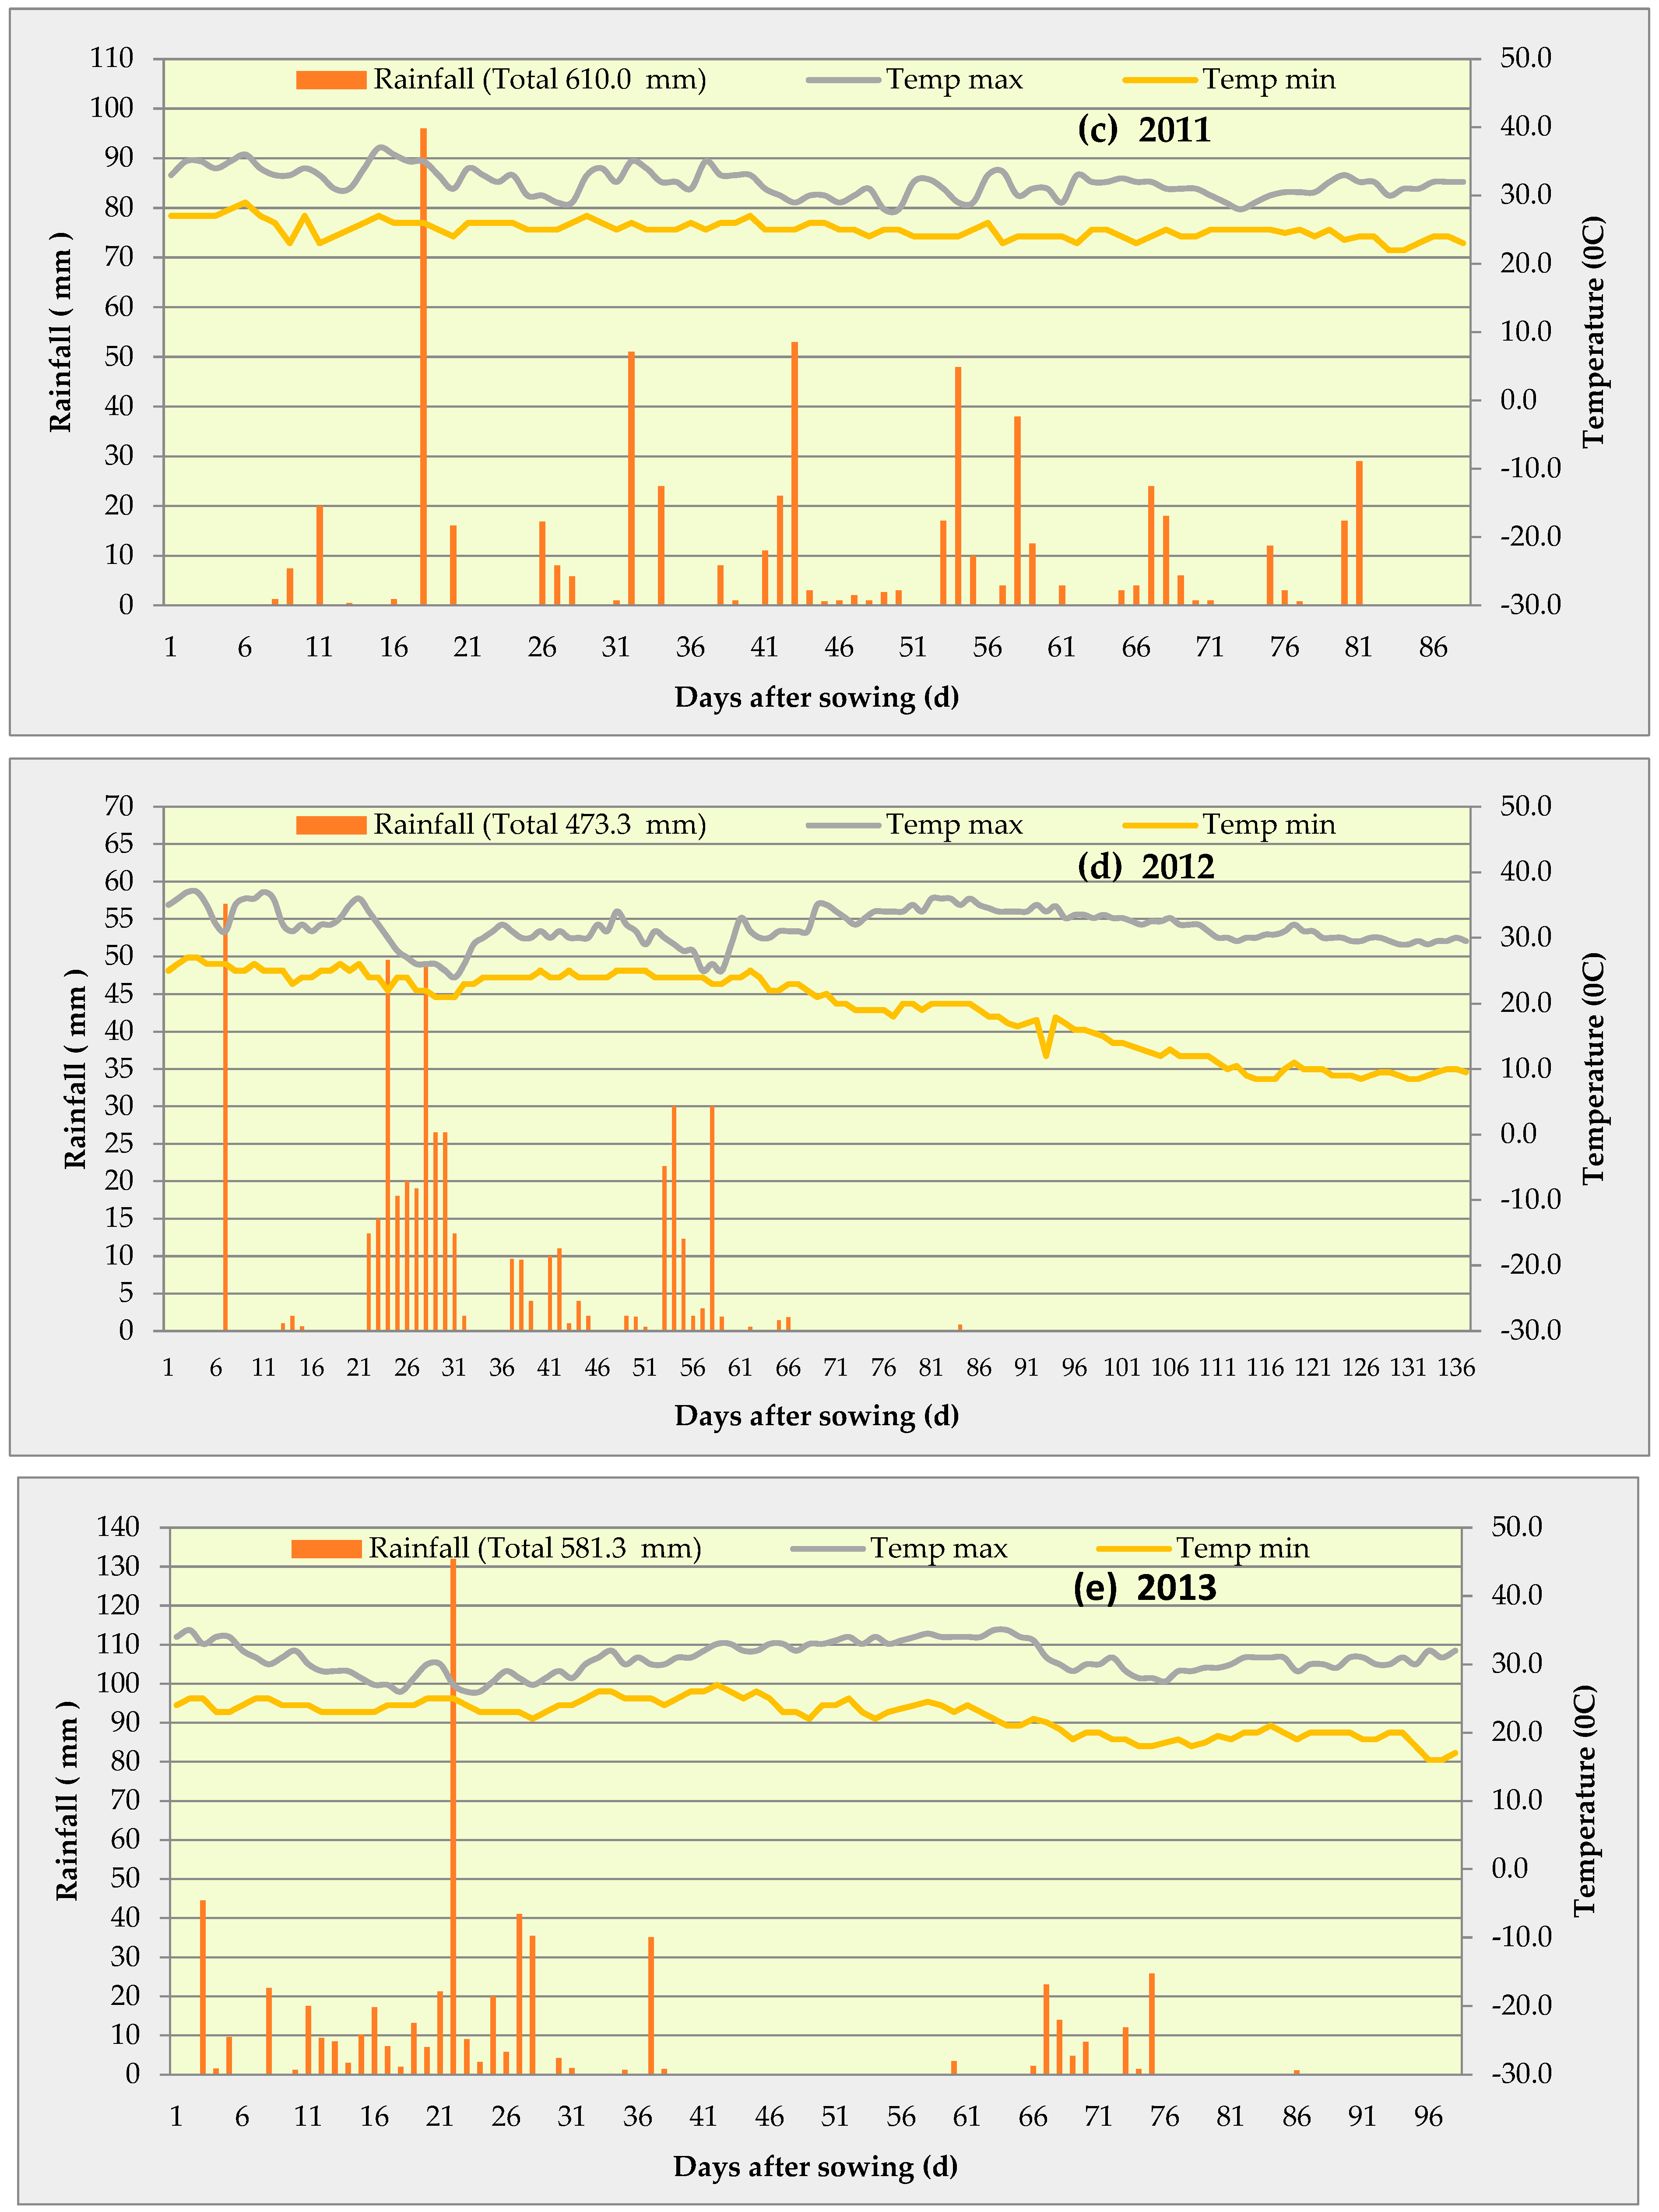
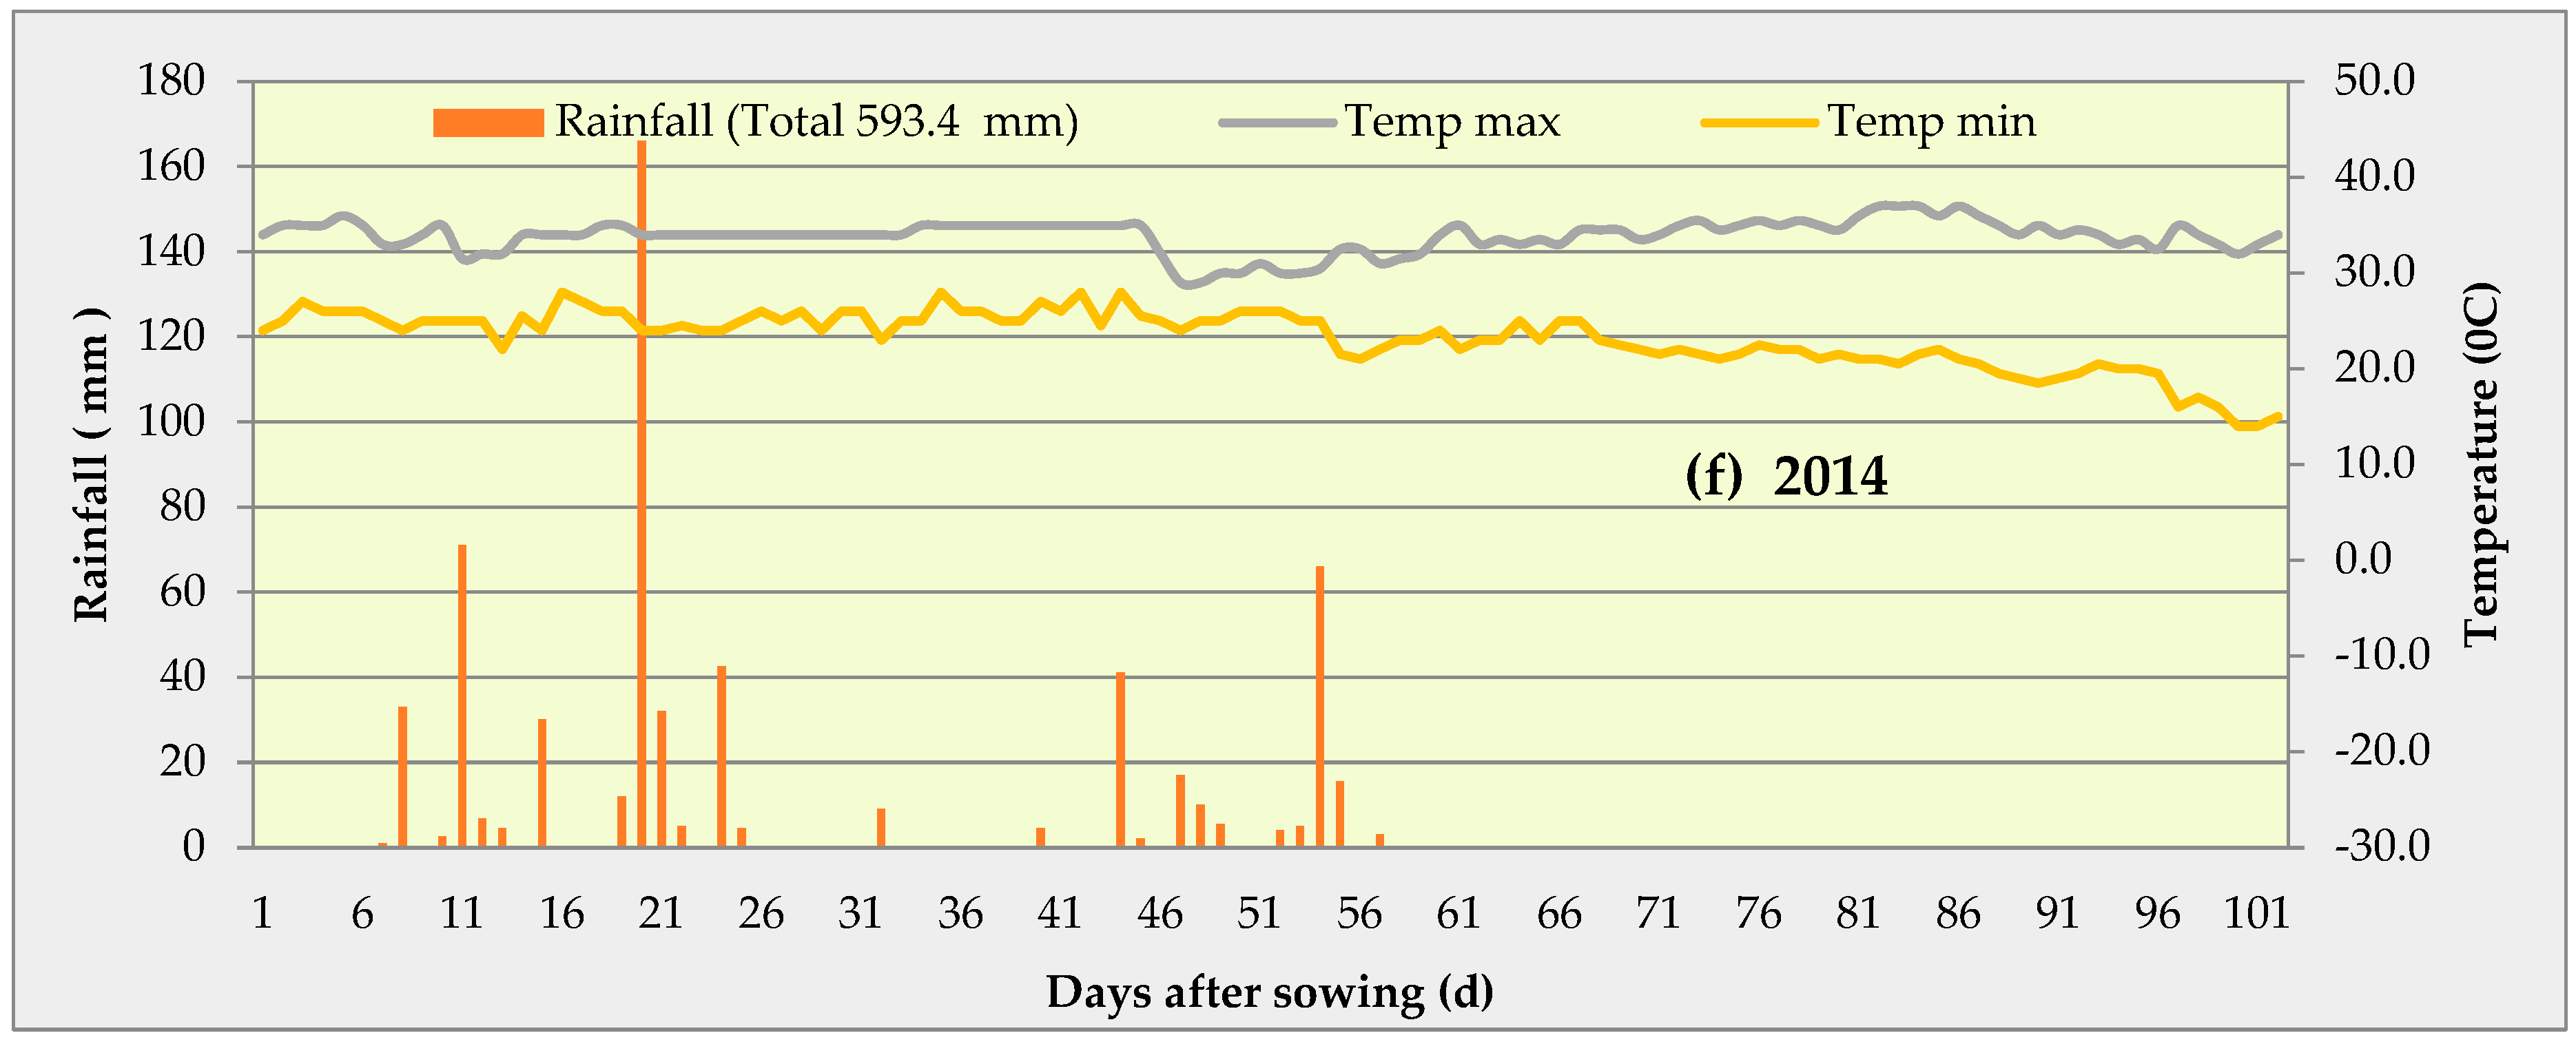
3.1. Rainfall Pattern and Supplemental Irrigation

The long-term average annual rainfall of the study area is 658.00 mm, out of which 93% received in the monsoon season (June–September) and rest as summer and winter rainfall. It was observed that July and August months contribute the maximum seasonal rainfall. The climate in this region is semi-arid/arid. Normal and yearly water balance in this region shows that the cumulative potential evapotranspiration (PET) is 1666.5 mm, and the monthly-accumulated water deficit is 1037 mm. For this deficit, moisture in soils needs to be supplemented for crops through harvesting rainwater in the farm pond during the monsoon season as well as the remaining storage in the rabi season to obtain sustainable yields.

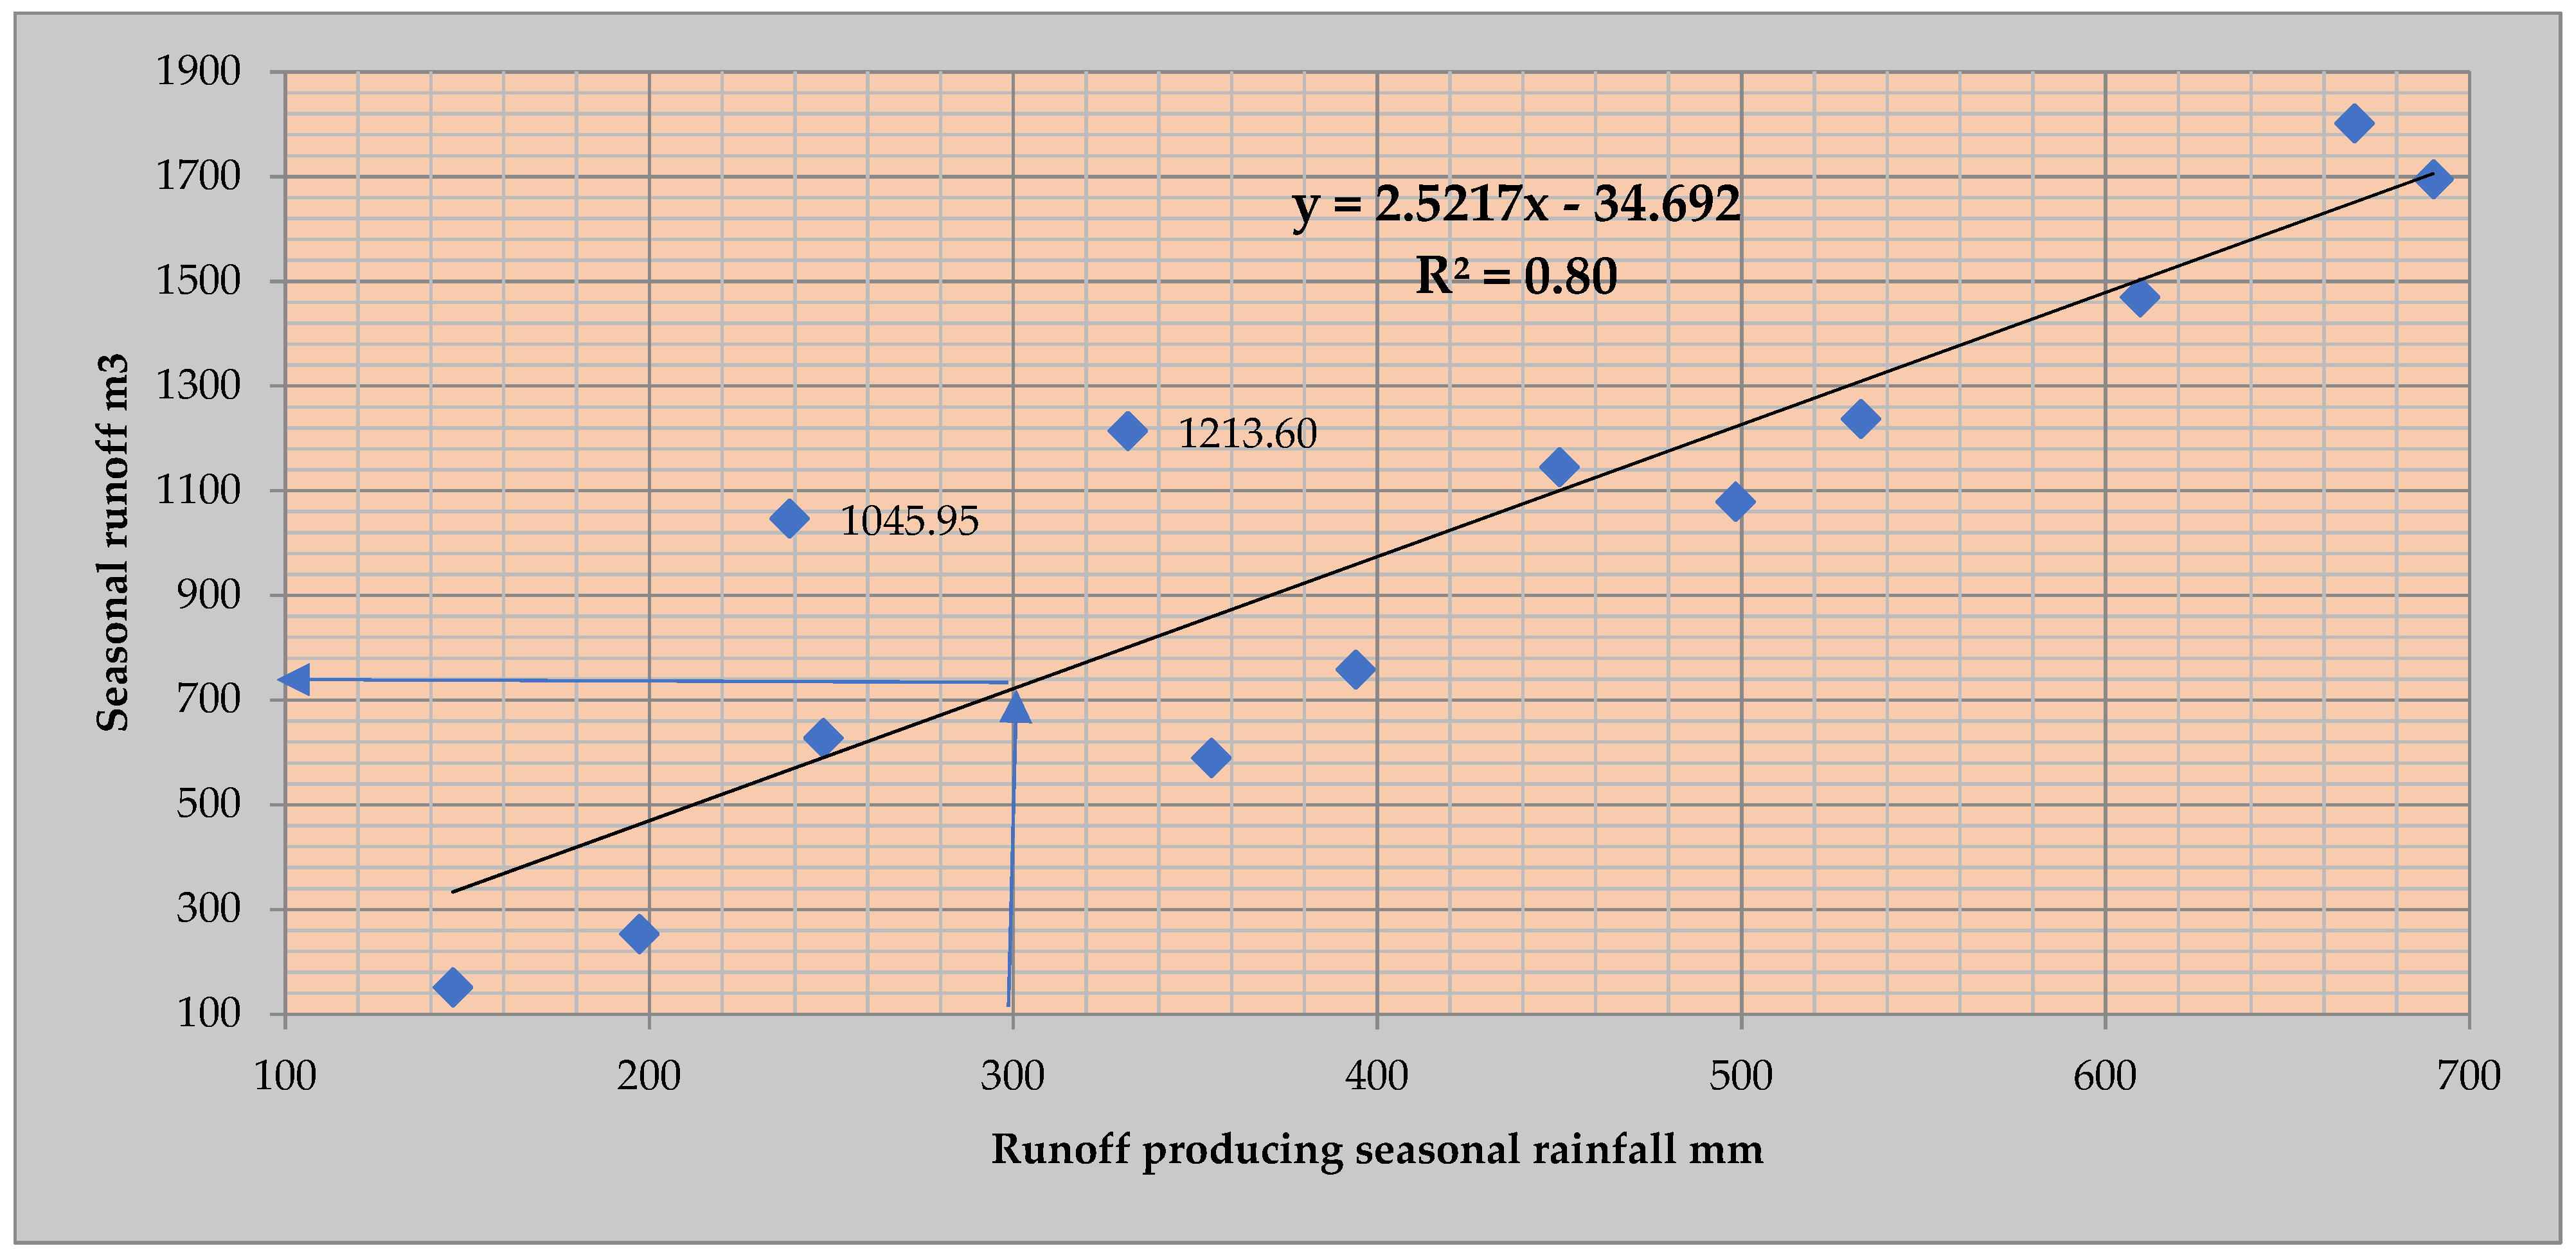
3.2. Rainfall Runoff Relation

The farm pond was filled with runoff water, which yielded from rainfall storms under an agricultural catchment after the soil moisture conservation practices like in-situ field bunds, crop growing, and sometimes ICS (intercropping systems) and other land configurations in the donor area. Apart from all these conservation measures, the runoff water harvested into the farm pond capacity (560 m3). The average amount of runoff harvested was about 15% of the total rainfall received in the catchment. Major losses occurred in the farm pond through seepage, and these seepage losses controlled with cement brick lining in bottom and sides. Other losses were due to evaporation; the quantity of evaporation was very small when compared to seepage losses, so the evaporation losses in this experiment ignored. The runoff volume recorded with different storms from 1994 to 2014 and tabulated in Table 4 for the mean months of the season from June to December. Statistical analysis of mean values carried out using ANOVA and found to be significant with CD at 5%.
The monthly average runoff recorded showed statistically significant results (Table 4), and a maximum amount of runoff (1801 m3) recorded in the year 1994 for a seasonal rainfall of 1037.4 mm, which was a wet year with more than long-term average. The minimum runoff volume (150.6 m3) recorded in 2009, which was mainly due to drought conditions with a 50% deficit of seasonal rainfall (306.8 mm). The mean monthly runoff-producing rainfall, presented in Table 3. A relation between rainfall and runoff was established by plotting runoff-producing rainfall in mm on the x-axis and total seasonal runoff in cubic meters on the y-axis with a linear trend line and a coefficient correlation of 0.8 (Figure 3); the equation is shown as Equation (1). From Figure 3, it can be inferred that the minimum runoff-producing rainfall received in a season is 340 mm, which is able to produce a runoff volume of 700 m3 as shown in Figure 4. Vice versa, a maximum runoff of 1700 m3 volume generated with a seasonal runoff producing a rainfall of 700 mm. The farm pond that used in this study for harvesting rainwater from a demarcated agricultural catchment of 2.0 ha was sufficient to store the runoff generated. While designing this farm pond, it assumed that at least three fillings occurred in the monsoon season. Therefore, the existing size of FP justified this concept of catchment storage command. Even if the maximum expected runoff volume of 1700 m3 produced by this catchment, as it assumed to occur in at least three fillings per season and to be utilized in a cascading mode for the total collection of rainwater. Hence, the designed capacity of the farm pond (560 m3) is able to store the generated runoff easily.
Therefore, in an agricultural catchment of 2.0 ha with land configurations (field bunds, ridges, and furrows, including ICS) in the southern zone of Rajasthan, rainwater can be harvested in the range of 700–1700 m3, depending upon seasonal rainfall. Hence, the rainfall runoff relationship established with the concept of catchment storage relationship in the form of an equation with a maximum regression coefficient (R2) value of 0.80.
Y = 2.5217 X 34.69
where X is runoff-producing seasonal rainfall in mm and Y is seasonal runoff in cubic meters. This equation can be used for calculating the expected runoff for a forecasted seasonal runoff, and accordingly, farmers can plan a cropping system for profitable returns.
From Figure 3, it can be observed that there were two high runoff-generating points (1045.95 m3 and 1213.60 m3) for the years 2012 and 2013, respectively. The reason for high generation runoff, as shown in Figure 3, was that there was a continuous rainfall of more than 53 mm for more than five days, representing the antecedent moisture condition of the soil of AMCIII [32].
It is observed from Table 4 that up to a maximum deficit of 50% in rainfall will be able to generate runoff. The southern zone of Rajasthan with clay loam soils cannot generate runoff if the rainfall goes beyond 50% deficit. Usually, beyond 50% deficit of rainfall represents a drought condition in Rajasthan. As rainfall exceeds at above the long-term normal average, then the runoff harvested would also increase proportionately. It also observed that in the last 20 years, mean average runoff generated was maximum during the months of July and August only during the monsoon season. These two months of the season were very crucial for harvesting rainwater to a maximum designed capacity. This study’s results reveal a minimum runoff in the range of 700–1700 m3 can be harvested depending upon the seasonal rainfall with runoff-producing storms and antecedent moisture conditions of the soil. Therefore, Equation (1) indicates the rainfall–runoff relationship, which established purely on the basis physical observations of 20 year (1994–2014) from an agricultural catchment. A threshold storage of 560 m3 was designed with an assumption of three fillings occurring in a season, which can accommodate a maximum of 1700 m3 runoff volume with the dimensions of farm pond top 16.5 m × 16.5 m, bottom 10.5 m × 10.5 m, and depth 3.0 m, with side slope of 1:1.

3.3. Design of Threshold Storage

The design of threshold storage depends on prevailing climate change conditions. Threshold storage is a useful quantity of storage in a farm pond. Based on the results of a study conducted over 20 years, based on physically recorded data from an agricultural watershed. From Equation (1) and Figure 4, it is observed that an agricultural watershed with a catchment area of 2.0 ha, even after considering the in-situ conservation measures of land configuration with field bunds, ridge and furrow, and intercropping system (ICS) with rainfall either at a deficit of 50% or in normal to wet years will be generating a runoff volume of 700–1700 m3. According to the Intergovernmental Panel on Climate Change (IPCC), there have been a lot of extreme events since 1950, and most of the changes that have taken place have been attributed to anthropogenic activities. This includes an increase in the frequency of heavy precipitation events in various locations [33]. Based on the present climate variable conditions, it can be assumed that a greater number of fillings may occur in a season and be able to accommodate the maximum runoff generated with a cascade mode of utilization. Therefore, the threshold storage possibly will be designed for a runoff volume of 560 m3 so as to accommodate at least 33.3% of the runoff volume generated in 2.0 ha of agricultural watershed, which occupies 4% of the catchment area. Assuming a supplemental irrigation of 5 cm to be provided at the time of dry spells/critical stages in kharif season and a supplemental irrigation at critical stages during rabi season, so that it can cover up to a maximum of 1.0 ha.

3.4. Rainwater Utilization Strategy in Enhancing the WP of a Diversified Farming System in Kharif

The results of the experiment conducted to evaluate the effective utilization of harvested rainwater applied through drip irrigation as well as surface irrigation (flood) during kharif season for the period 2009–2014 (5 years, data were not available for 2013) are discussed. Diversified cropping systems with crops, viz., sponge guard, ridge guard, bottle guard, and kachari (cucumber), and their yields reported in terms of maize grain equivalent yield (MGEY) are shown in Table 6.

3.4.1. Effect of Supplement Irrigation on Crop Yield

Supplemental irrigation, particularly in the upper soil layer, can directly raise the soil water content [34]. The application of irrigation to crops through surface irrigation has more conveyance losses before reaching the crop root zone. In the case of drip irrigation, moisture applied around the root zone, which has more conveyance efficiency, being readily available at root zone and promoting plant growth parameters like plant height, plant circumference, leaf area, and number of leaves per plant [35]. Five-year average results of these diversified crops with the application of harvested rainwater as a supplemental irrigation of 5 cm (50% of Pan evaporation) through drip irrigation during dry spells and sometimes in critical stages (Table 5) in different years (Figure 3) are shown. Significantly, we recorded the highest maize grain equivalent (MGEY) yield (6497 kg/ha), which was obtained by the drip irrigation method when compared with the surface irrigation method of application (5565 kg/ha) (Table 6). In this drip irrigation method of application, 50% of water saved, and moisture will be available at the root zone, with minimum conveyance losses leading to higher yield and productivity, which in turn fetches higher income. The impact of supplemental irrigation through a drip system enhanced maize grain yield by 17% over surface irrigation. However, the vegetable crops in terms of maize grain yield with a 5 year mean recorded the highest yield in kachari (8348 kg/ha) (Figure 4), followed by ridge gourd (7416 kg/ha), bottled gourd (6347 kg/ha), vegetable cowpea (6103 kg/ha), and the least in sponge gourd (4927 kg/ha).
However, during the study period of 5 years (2009–14), the year 2009 was a drought year with a deficit rainfall (50%); only maize stover was harvested, and under the 20% deficit of rainfall years (2011 and 2014), a higher significant maize grain yield (8288 kg/ha-mm) was recorded in 2011 when compared to 2014 (3869 kg/ha). This was because the rainfall uniformly distributed for the entire crop season, especially at critical crop stages (Figure 3). For sole maize with a supplemental irrigation of 5 cm under critical stages and dry spells, the average of the 5 year results showed significantly higher grain yield production (4110 kg/ha) when compared to the control without any irrigation (2586 kg/ha), showing an increase of up to 58%. Therefore, in semi-arid regions with clay loam soils under rainfed ecosystems, we recommend having diversified crops, like vegetables (sponge guard, bottle guard, ridge guard, and vegetable cowpea), with the main crop grain equivalent yield (maize).

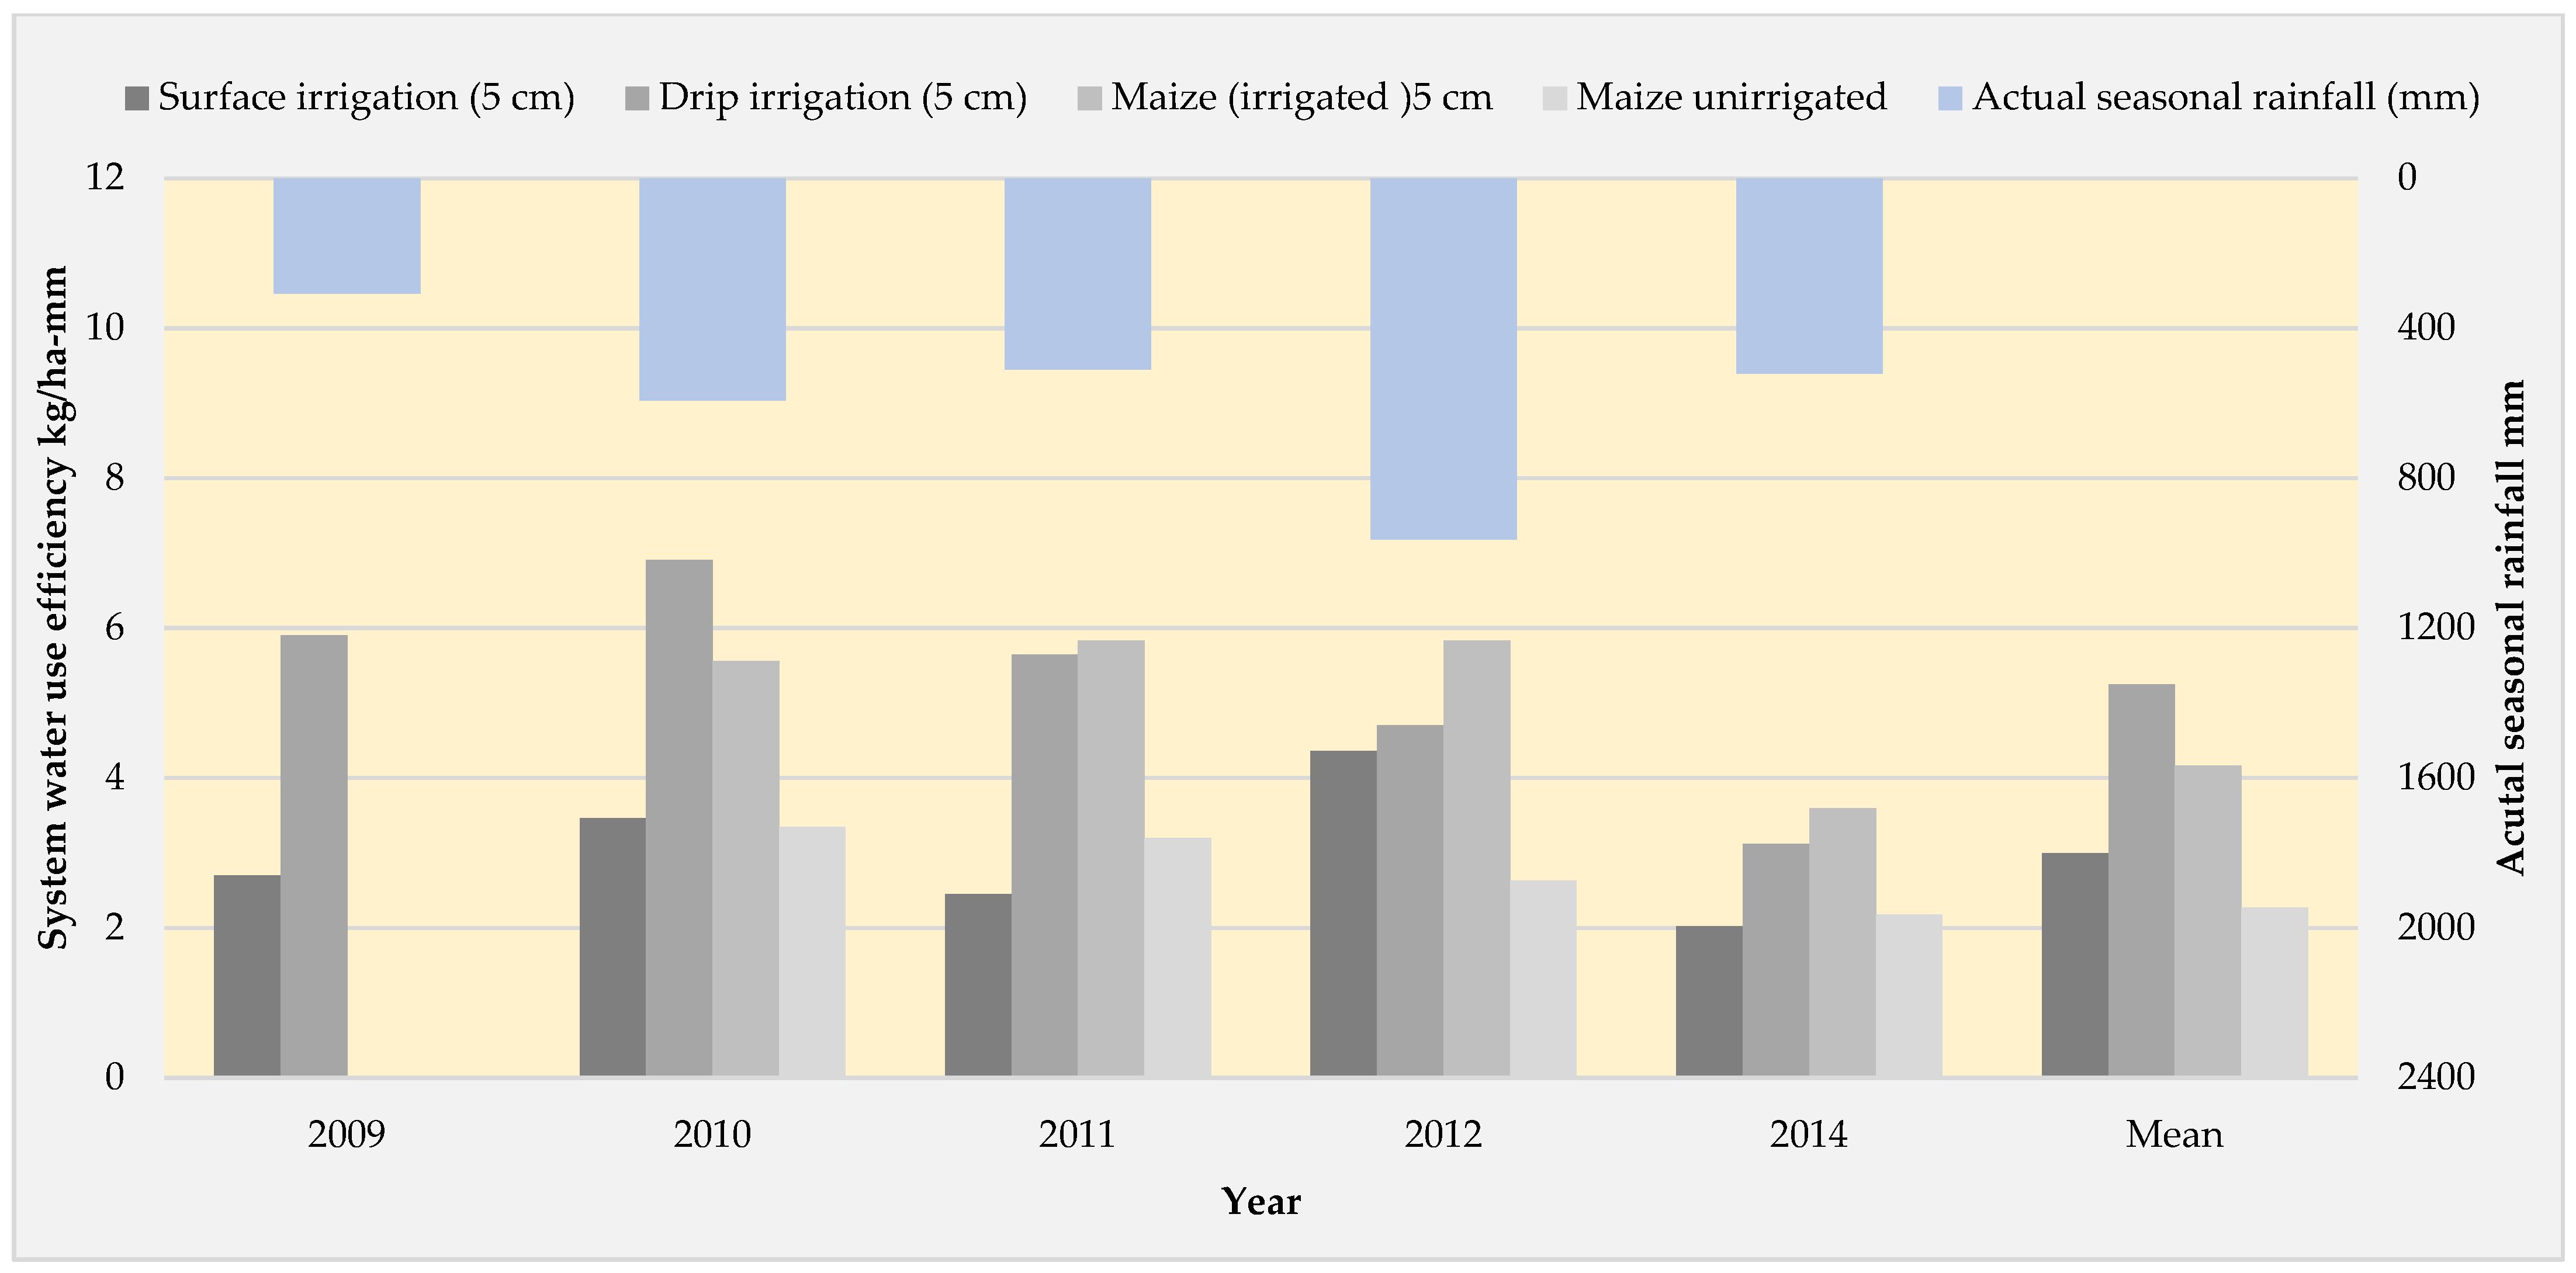
3.4.2. Effect of Supplement Irrigation on System Water Use Efficiency

The application of supplemental irrigation (5 cm) during dry spells and critical stages with a drip system with 5 year average values recorded significantly (p < 0.05) higher maize grain system water use efficiency (5.25 kg/m3) compared to maize grain system water productivity (3.00 kg/m3) with the surface irrigation method. The system water use efficiency (regular rainfall and supplemental irrigation 5 cm) was significantly higher in a normal rainfall year under uniform distribution when compared to an above normal (wet) rainfall year, with a 20% deficit or even 50% deficit of rainfall (Figure 5). The application of supplemental irrigation (5 cm) will act as a lifesaver to obtain a sustainable yield. In fact, normal rainfall years with uniform distribution will provide more system water use efficacy than a wet year or drought year. Under prevailing climate change weather conditions, it is almost impossible to receive a long normal average rainfall with uniform distribution. Hence, the supplemental irrigation of 5 cm would provide a sustainable yield in a rainfed ecosystem under deficit rainfall years.
Conversely, during the year 2009, sponge gourd yield vitiated due to severe drought conditions. There was no rainfall during the months of September and October because of the early withdrawal of the monsoon by 1 October. During kharif, 2013, an intermittent dry spell of 14 days from 27 July to 11 August observed during the rainy season. This dry spell adversely affected the crop development (Table 5). Another dry spell occurred from 31 August onwards, which drastically reduced the crop yields as the crops were under peak vegetative phase and reproductive stage. Because of this, only biological maize grain equivalent yield was recorded. Further, the biological yield reduced because of heavy weed infestation and damage by blue bull. Maize recorded 5082 kg/ha straw yield with the application of one irrigation (5 cm) during the dry spell period. Therefore, under the diversified cropping systems, sponge gourd, bottle gourd, ridge gourd, vegetable cowpea, and kachari would produce significantly maximum maize equivalent yield (enhanced by 17%), higher water productivity, and a benefit/cost ratio with the application of supplemental irrigation (5 cm) under a drip system when compared to the surface irrigation method in kharif season.

3.4.3. Effect of Supplemental Irrigation on Yield and Economics of Kharif Vegetables

Highest net returns with highest B:C ratio were recorded significantly (p < 0.05) with supplemental irrigation (5 cm) through drip system during the year 2011 (5.1), followed by 2012 (4.7), 2012 (3.95), 2014 (3.88), and 2009 (2.31) with four years average of 3.46 (Figure 6). The reasons for these results were supplemental irrigation, as well as normal and uniformly distributed rainfall. During the drought year of 2009 also, the higher net monitory returns with the B:C ratio (2.31) was recorded with supplemental irrigation and Table A2 in Appendix A, shows the values of benefit cost ration and water productivity during kharif season. These results also prove that under rainfed conditions, the application of supplemental irrigation (5 cm) through a drip irrigation system will able to assure net monitory returns, even during climate vulnerability. A drip irrigation system not only saves the quantity of water, but also enables qualitative products (uniform color and size), which fetches a higher price in the market.

3.5. Rainwater Utilization Strategy in Enhancing the WP of Diversified Farming System in Rabi

In another experiment conducted to evaluate the effective utilization of harvested rainwater, which was available for use in rabi season, supplemental irrigation through surface as well as drip irrigation was applied in different diversified crops during critical stages and in rabi season during the period of 2011–2014 (4 years).

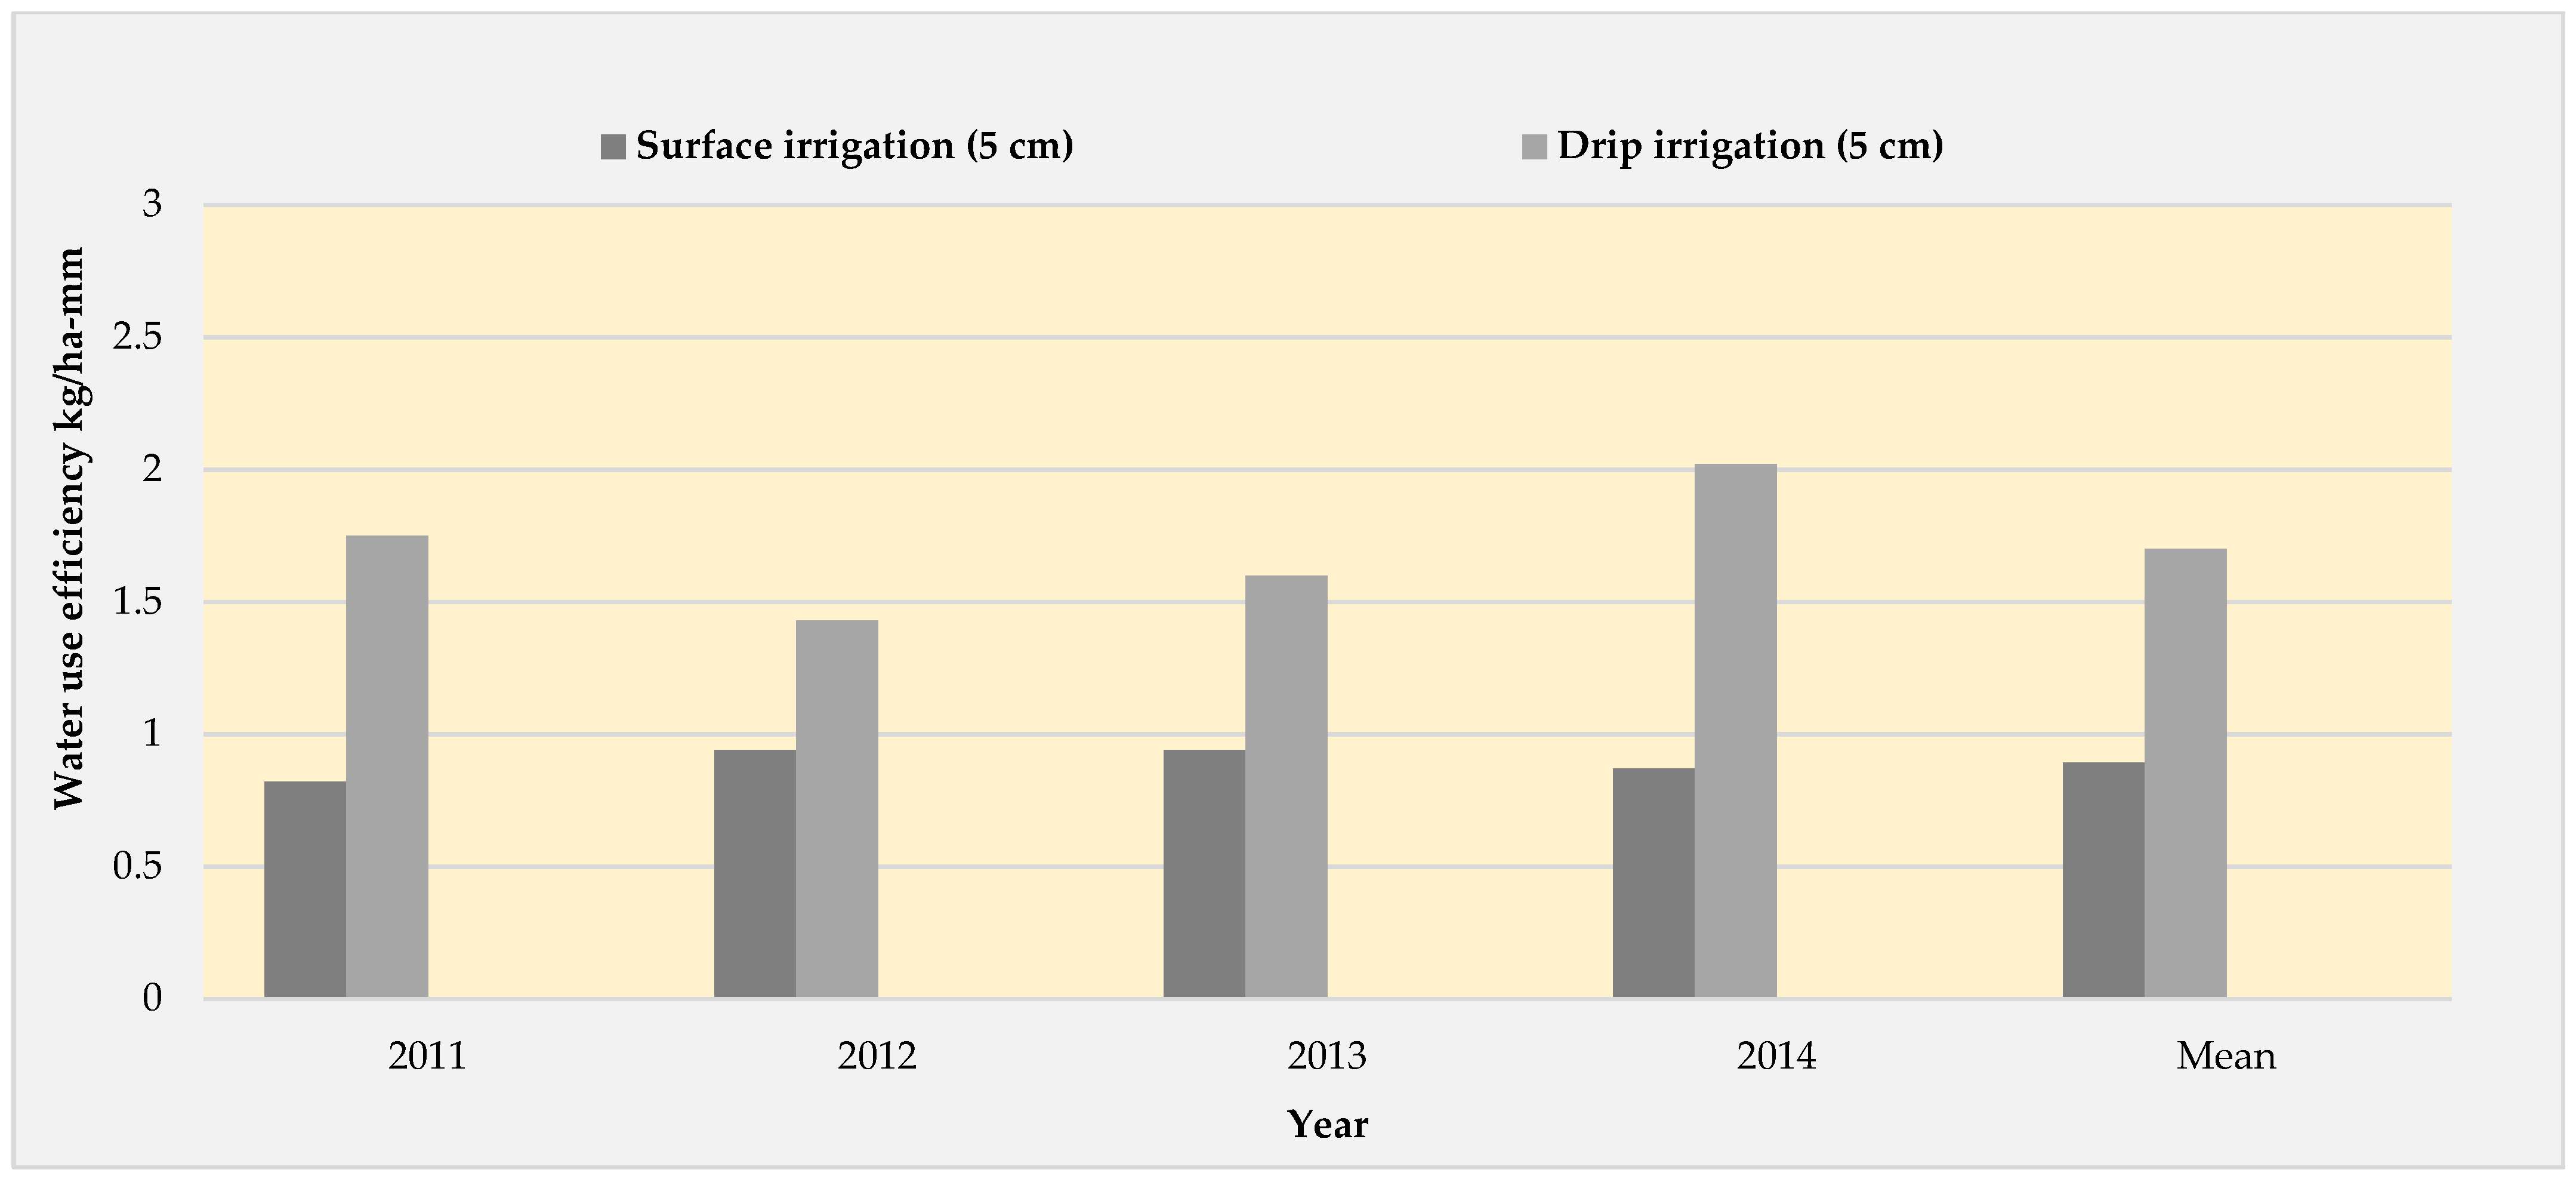
3.5.1. Effect of Supplemental Irrigation on Yield and Productivity of Rabi Vegetables

The diversified crops like vegetables (sponge guard, coriander, pea pod, and brinjal) were raised in rabi season and had supplemental irrigation (5 cm) applied through drip irrigation during critical stages, especially at flowering. The crop (sponge guard, coriander, pea pod, and brinjal) yields were converted into pea pod equivalent yield, and the results were reported in terms of pea pod equivalent yield (PEEY). The significantly (p < 0.05) recorded highest pea pod (four years average) equivalent yield (4669.25 kg/ha) was found with the application of 5 cm supplemental irrigation with a drip system when compared to the surface irrigation method (4058.75 kg/ha) (Table 5). Among the different rabi vegetable crops, coriander (green) was recorded as the significantly highest pea pod equivalent (4 years mean) yield (5267.25 kg/ha), and the pea pod and brinjal yields in terms of pea pod equivalent yields were in par with each other. In drip irrigation, moisture will be available only near the root zone with less seepage and conveyance losses, apart from 50% water saving, which leads to higher yield and productivity.
Mean results of the four-year study indicate that supplemental irrigation (5 cm) through a drip system also significantly (p < 0.05) recorded higher pea pod water productivity (1.70 kg/ha-mm) when compared to surface irrigation (0.89 kg/m3). Application of harvested rainwater as supplemental irrigation with a drip system was very effective in vegetable crops during rabi season and the value yield and economics for shown in Table A1 of Appendix A. In drip irrigation, moisture will be available only near the root zone with less seepage and conveyance losses, apart from 50% water saving, which leads to higher yield and productivity. Therefore, under the diversified cropping systems like those of coriander, pea pod, and brinjal crops, they would produce significant maximum pea pod equivalent yield (increased by 15%) and higher water productivity with the application of supplemental irrigation (5 cm) under the drip system when compared to the surface irrigation method in rabi season (Figure 7).

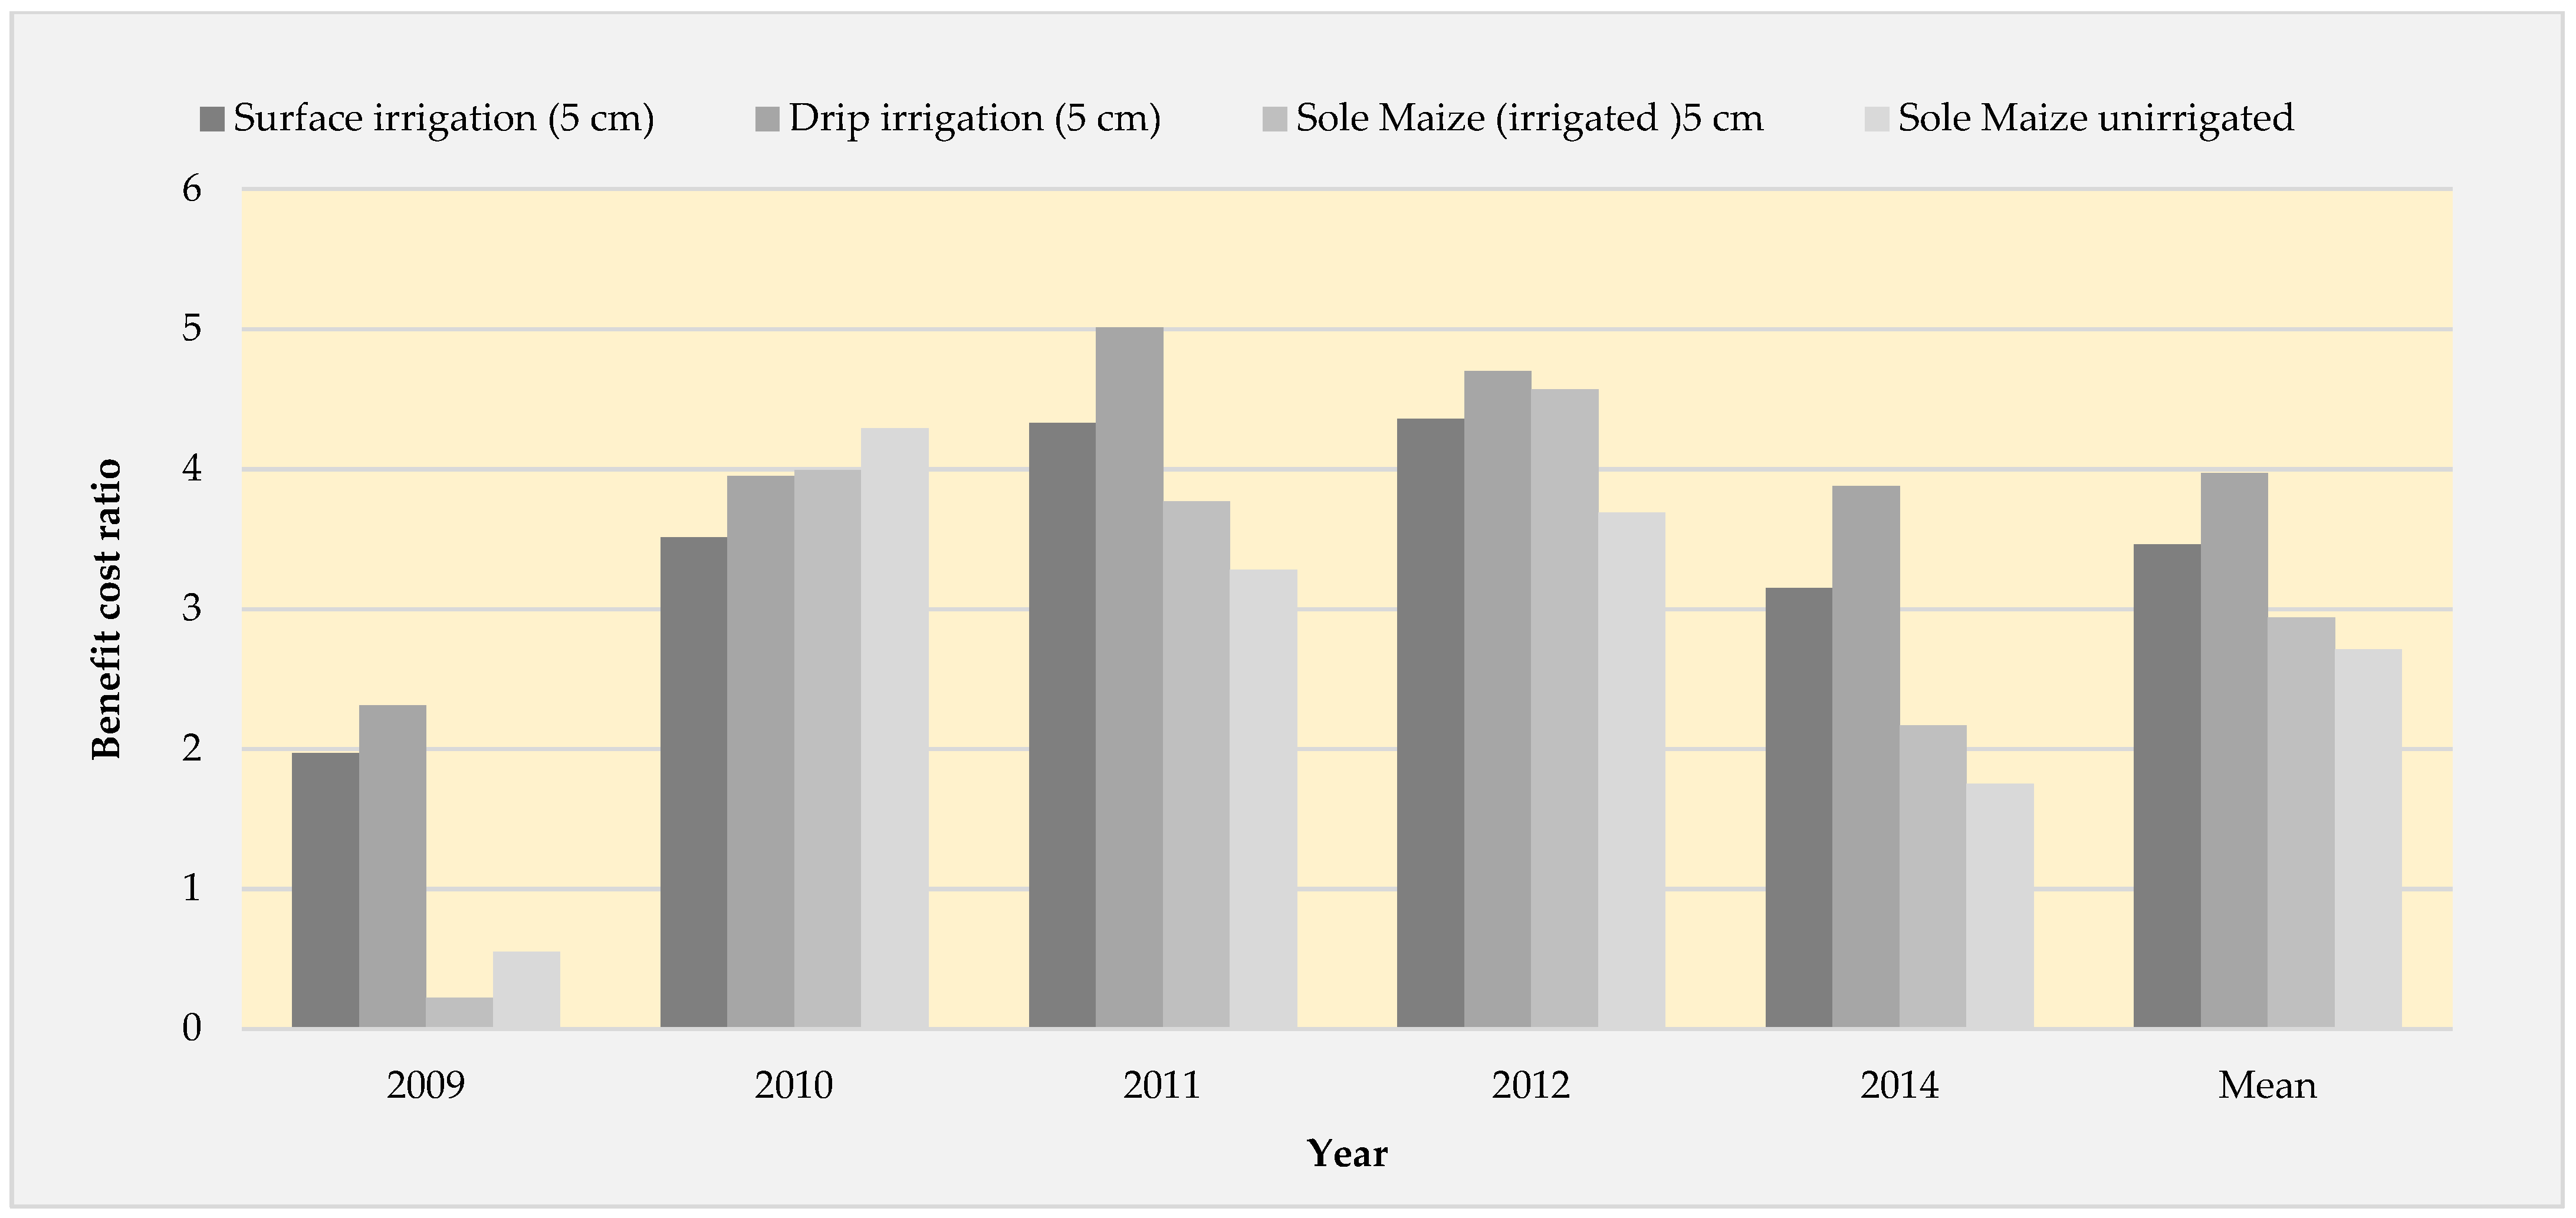
3.5.2. Effect of Supplemental Irrigation on the Economics of Rabi Vegetables

The average of the four-year (2011–2014) results indicates that the highest benefit/cost ratio recorded significantly (p < 0.05) with the supplemental irrigation through drip system (4.09) compared to the surface method of irrigation (2.89) (Figure 8). The reasons for these results were that the supplemental irrigation through the drip system at the critical stage (flowering) of vegetables helped in fruit farming and pod setting, in turn enhancing the yield to obtain a higher market price. The drip irrigation system not only saves the quantity of water but also enables qualitative products (uniform color and size), which fetches a higher price in the market. During the study period, higher water productivity obtained using the drip irrigation method of application when compared to the surface irrigation method. The application of harvested rainwater as supplemental irrigation with a drip system was very effective for vegetable crops during rabi season.
Based on the above two studies, it can be inferred that supplemental irrigation of 5 cm applied through a drip irrigation system enhanced productivity by 17% in maize equivalent through vegetable crops and 59% higher for maize solely grown with a drip system in kharif season, and proportionate results were also obtained for rabi season. Therefore, two crops, maize in kharif and coriander (vegetable) in rabi season, were significantly profitable with supplemental irrigation by the drip irrigation system. These results also proved that a supplemental irrigation of 5 cm could enhance the yield, water productivity, and benefit/cost ratio significantly. These results are on par with earlier studies too. According to Patode et al. [36], in vertisols with an average rainfall of the region 817 mm, the catchment–storage–command relationship showed rainwater harvested from a catchment area of 5 ha and stored in farm pond of 2014.8 m3 was able to irrigate (command) an area of about 4.0 ha, being mainly applied for crops like cotton and soybean. Efficient utilization of harvested water can also be profitable by using farm pond with HDPE polythene lining, as reported by earlier researchers for this region [30,37], so as to reduce the cost of lining material when compared to cement, brick, and concrete lining.

3.6. Limitations of the Study

  • A small category of farmers only can adopt this system, and 2–4% of farmland will be lost to the RWH structure.
  • The cost of excavation, including cement concrete lining.
  • The results obtained are location/site specific.
  • Evaporation losses were not accounted here.

4. Conclusions

  • Based on the results and discussion, in semi-arid regions of Rajasthan, India, with an average annual rainfall of 657 mm in clay loamy soils (ustochrepts), an agricultural catchment of 2.0 ha is able to harvest a threshold volume in the range of 700–1700 m3, depending on seasonal rainfall. This water can be stored in a RWH structure (farm pond) of a capacity of 560 m3 by considering/assuming at least three fillings occur in monsoon season.
  • A farm pond of a capacity of 560 m3 can accommodate, even if there is minimum runoff on average and below-average rainfall years and maximum runoff in a wet year where the rainfall receives more than average.
  • Harvested rainwater can be efficiently utilized through drip irrigation to a command area of 1.0 ha in both the seasons (kharif and rabi) by providing a supplemental irrigation of 5 cm in each season under a normal rainfall situation for dominant crops in the regions like maize and vegetables (coriander).
  • Regular desilting of the farm pond will be required to maintain a designed storage, and the silt material can be applied to crop fields of the command area, which in turn enriches the nutrients.
  • In the semi-arid tropical region of Rajasthan, India, with a farming situation of loamy soils, a catchment of 2.0 ha of agricultural micro watershed can be stored in a RWH structure (farm pond) of a capacity of 560 m3 and can be able to supply an irrigation of 5 cm to a command area of 1.0.

Author Contributions

Conceptualization, J.V.N.S.P.; Methodology, B.N., J.V.N.S.P., A.A.R., K.A.G., K.B.S., J.K.B. and A.K.K.; Formal analysis, A.A.R. and G.R.C.; Investigation, B.N., K.A.G. and K.B.S.; Data curation, G.R.C. and J.K.B.; Writing—original draft, B.N.; Writing—review & editing, A.A.R.; Supervision, V.K.S.; Project administration, B.N. and J.V.N.S.P. All authors have read and agreed to the published version of the manuscript.

Funding

This study was funded by the Indian Council of Agricultural Research, New Delhi, India, through AICRPDA, ICAR-CRIDA, Hyderabad, India. We sincerely acknowledge Maharana Pratap University of Agriculture and Technology, Udaipur, Rajasthan, India, for research guidance and cooperation.

Institutional Review Board Statement

Not applicable.

Informed Consent Statement

Not applicable.

Data Availability Statement

Data will be made available on request.

Conflicts of Interest

The authors declare that they have no known competing financial interests or personal relationships that could have appeared to influence the work reported in this paper.

Appendix A

Table A1. Water productivity and economics of vegetable yields during rabi season.
S. No.TreatmentWater Productivity (kg/m3)B:C Ratio
2011201220132014Mean2011201220132014Mean
Rabi crops
1Coriander green1.581.271.391.791.516.684.683.182.374.23
2Pea pod1.51.51.31.171.375.774.692.791.293.63
3Brinjal0.780.860.841.370.963.363.72.351.472.72
4S.E m± 0.12 0.35
5C.D at 5% 0.41 NS
CV(%) 18.39 19.82
6Surface irrigation0.820.940.940.870.894.433.492.391.242.89
7Drip irrigation1.751.431.62.021.706.114.663.422.184.09
8S.E m± 0.10 0.12
9C.D at 5% 0.46 0.53
CV(%) 15.90 6.70
Table A2. Water productivity and economics of vegetable yields during kharif season.
S. No.TreatmentsWater Productivity (kg/m3)B:C Ratio
20092010201120122014Mean20092010201120122014Mean
1Sponge gourd03.343.22.632.182.2702.954.423.712.652.75
2Bottle gourd 3.992.933.323.112.273.122.112.74.754.483.363.48
3Ridge gourd6.015.62.923.162.073.952.883.693.824.592.943.58
4Kachari (cucumber)7.847.846.464.743.566.094.095.496.536.175.345.52
5Veg cow pea3.666.24.334.422.774.281.623.83.814.83.283.46
S.Em± 0.54 0.25
C.D (at 5%) 1.63 0.75
CV (%) 30.78 14.81
1Surface irrigation
(5 cm)
2.73.462.454.362.023.001.973.514.334.363.153.46
2Drip irrigation
(5 cm)
5.96.915.644.73.125.252.313.955.014.73.883.97
S.Em± 0.45 0.06
C.D (at 5%) 1.78 0.23
CV (%) 24.53 3.56
1Sole maize (irrigated) 5 cm05.565.835.833.594.160.223.993.774.572.172.94
2Sole maize unirrigated03.343.22.632.182.270.554.293.283.691.752.71
S.Em± 0.39 0.17
C.D (at 5%) 1.54 NS
CV (%) 27.32 13.23
Normal seasonal rainfall (mm)
Actual seasonal rainfall (mm)306.8593.0509.7963.8521.6

References

  1. Government of INDIA, Department of Agriculture and Farmers Welfare. 2022. Available online: https://agriwelfare.gov.in (accessed on 23 July 2022).
  2. Keatinge, G. Agricultural Progress in Western India; Longmans, Green and Co.: New York, NY, USA, 1922; Volume 110. [Google Scholar]
  3. Kumar, S. Does “Participation” in Common Pool Resource Management Help the Poor? A Social Cost-Benefit Analysis of Joint Forest Management in Jharkhand, India. Dev. Crit. Essays Hum. Geogr. 2002, 30, 295–314. [Google Scholar] [CrossRef]
  4. Sharda, V.N.; Shrimali, S.S. Water Harvesting and Recycling in Northern Hilly Regions. Indian J. Soil Conserv. 1994, 22, 84–93. [Google Scholar]
  5. Samra, J.S. Water Harvesting and Recycling: Indian Experiences; Central Soil & Water Conservation Research & Training Institute: Dehra Dun, India, 2002; 347p. [Google Scholar]
  6. Barron, J.; Rockström, J.; Gichuki, F.; Hatibu, N. Dry Spell Analysis and Maize Yields for Two Semi-Arid Locations in East Africa. Agric. For. Meteorol. 2003, 117, 23–37. [Google Scholar] [CrossRef]
  7. Raghavan, K. Break-Monsoon Over India. Environ. Sci. Mon. Weather Rev. 1973, 101, 33–43. [Google Scholar] [CrossRef]
  8. Boers, T.M.; Zondervan, K.; Ben-Asher, J. Micro-Catchment-Water-Harvesting (MCWH) for Arid Zone Development. Agric. Water Manag. 1986, 12, 21–39. [Google Scholar] [CrossRef]
  9. Bruins, H.J.; Evenari, M.; Nessler, U. Rainwater-Harvesting Agriculture for Food Production in Arid Zones: The Challenge of the African Famine. Appl. Geogr. 1986, 6, 13–32. [Google Scholar] [CrossRef]
  10. Fox, P.; Rockström, J. Supplemental Irrigation for Dry-Spell Mitigation of Rainfed Agriculture in the Sahel. Agric. Water Manag. 2003, 61, 29–50. [Google Scholar] [CrossRef]
  11. Hatibu, N.; Young, M.D.B.; Gowing, J.W.; Mahoo, H.F.; Mzirai, O.B. Developing Improved Dryland Cropping Systems for Maize In Semi-Arid Tanzania. Part 1: Experimental Evidence for The Benefits of Rainwater Harvesting. Exp. Agric. 2003, 39, 279–292. [Google Scholar] [CrossRef]
  12. Motsi, K.E.; Chuma, E.; Mukamuri, B.B. Rainwater Harvesting for Sustainable Agriculture in Communal Lands of Zimbabwe. Phys. Chem. Earth 2004, 29, 1069–1073. [Google Scholar] [CrossRef]
  13. Barron, J.; Okwach, G. Run-off Water Harvesting for Dry Spell Mitigation in Maize (Zea Mays L.): Results from on-Farm Research in Semi-Arid Kenya. Agric. Water Manag. 2005, 74, 1–21. [Google Scholar] [CrossRef]
  14. Liu, F.; Wu, Y.; Xiao, G.; Gao, Q. Rainwater-Harvesting Agriculture and Wateruse Efficiency in Semi-Arid Regions in Gansu Province, China. Outlook Agric. 2005, 34, 154–165. [Google Scholar] [CrossRef]
  15. Adekalu, K.O.; Balogun, J.A.; Aluko, O.B.; Okunade, D.A.; Gowing, J.W.; Faborode, M.O. Runoff Water Harvesting for Dry Spell Mitigation for Cowpea in the Savannah Belt of Nigeria. Agric. Water Manag. 2009, 96, 1502–1508. [Google Scholar] [CrossRef]
  16. Glendenning, C.J.; Babu, S.; Asenso-Okyere, K. Review of Agricultural Extension in India. Are Farmers Information Needs Being Met; International Food Policy Research Institute (IFPRI): Washington, DC, USA, 2010. [Google Scholar]
  17. Liu, J.; Tan, J.; Zhang, S.; Zhong, C.; Lv, L.; Tara, A. Suitability Assessment of Small Dams’ Location as Nature-Based Solutions to Reduce Flood Risk in Mataniko Catchment, Honiara, Solomon Islands. Sustainability 2023, 15, 3313. [Google Scholar] [CrossRef]
  18. Sanfo, S.; Barbier, B.; Dabiré, I.W.P.; Vlek, P.L.G.; Fonta, W.M.; Ibrahim, B.; Barry, B. Rainfall Variability Adaptation Strategies: An Ex-Ante Assessment of Supplemental Irrigation from Farm Ponds in Southern Burkina Faso. Agric. Syst. 2017, 152, 80–89. [Google Scholar] [CrossRef]
  19. Ali, S.; Sethy, B.K.; Parandiyal, A.K.; Kumar, A.; Singh, R.K.; Somasundaram, J.; Mina, B.L. Long-Term Effects of Rainwater Conservation Measure on Improving Yield, Runoff Use Efficiency and Soil Properties of Horti-Pastoral System on the Degraded Ravine Lands of India. Agric. Water Manag. 2020, 233, 1060–1068. [Google Scholar] [CrossRef]
  20. Oweis, T.; Hachum, A. Water Harvesting and Supplemental Irrigation for Improved Water Productivity of Dry Farming Systems in West Asia and North Africa. Agric. Water Manag. 2006, 80, 57–73. [Google Scholar] [CrossRef]
  21. Rao, C.A.R.; Rao, K.V.; Raju, B.M.K.; Samuel, J. Levels and Determinants of Economic Viability of Rainwater Harvesting Farm Ponds. Int. J. Agric. Econ. 2019, 74, 539–551. [Google Scholar]
  22. Kumar, S.; Ramilan, T.; Ramarao, C.A.; Rao, C.S.; Whitbread, A. Farm Level Rainwater Harvesting across Different Agro Climatic Regions of India: Assessing Performance and Its Determinants. Agric. Water Manag. 2016, 176, 55–66. [Google Scholar] [CrossRef]
  23. Srinivasa Rao, C.; Rejani, R.; Rama Rao, C.A.; Rao, K.V.; Osman, M.; Srinivasa Reddy, K.; Kumar, M.; Kumar, P. Farm Ponds for Climate-Resilient Rainfed Agriculture. Curr. Sci. 2017, 112, 471–477. [Google Scholar] [CrossRef]
  24. Krishna, J.H.; Arkin, G.F.; Martin, J.R. Runoff Impoundment for Supplemental Irrigation in Texas1. JAWRA J. Am. Water Resour. Assoc. 1987, 23, 1057–1061. [Google Scholar] [CrossRef]
  25. Wani, S.; Singh, H.; Sreedevi, T.; Pathak, P.; Rego, T.; Shiferaw, B.; Iyer, S. Farmer-Participatory Integrated Watershed Management: Adarsha Watershed, Kothapally India—An Innovative and Upscalable Approach. J. SAT Agric. Res. 2003, 2, 1–27. [Google Scholar]
  26. Getaneh, M.; Tsigae, A. Comparative Analysis of Lining Materials for Reduction of Seepage in Water Harvesting Structures, Adet, Ethiopia. Int. Soc. Dev. Sustain. 2013, 2, 1623–1635. [Google Scholar]
  27. Manoj, S.; Sarangi, S.K.; Singh, R.K.; Ngchan, S.V.; Chowdhury, P. Enhancing Productivity of Micro-Watershed Based Farming Systems in Tropical Humid Hilly Regions through Enhancing Productivity of Micro Watershed Based Farmin. Indian J. Soil Conserv. 2013, 41, 37–42. [Google Scholar]
  28. Jayanthi, M.; Rekha, P.N.; Muralidhar, M.; Gupta, B.P. Seepage Reduction in Brackishwater Ponds with Different Materials. Ecol. Environ. Conserv. 2004, 10, 257–260. [Google Scholar]
  29. Jat, M.L.; Kothari, A.K.; Sharma, S.K. Performance Evaluation of Different Evaporation Retardants in Semi Arid Tropics. Indian J. Soil Conserv. 2010, 38, 169–172. [Google Scholar]
  30. Narsimlu, B.; Kishore, N.; Sahadeva Reddy, G.; Chary, R.; Sridhar, K.B.; Gopinath, K.A. Enhancing Water Productivity in the Scarce Rainfall Zone of Andhra Pradesh ThroughFarm Ponds with Seepage Control. In Proceedings of the First International Conference on Reimagining Rainfed Agro-Ecosystems, ICAR-CRIDA, Santoshnagar, Hyderabad, Telangana State, India, 20–22 December 2022. [Google Scholar]
  31. Bal, S.K.; Sandeep, V.M.; Kumar, P.V.; Rao, A.V.M.S.; Pramod, V.P.; Manikandan, N.; Rao, C.S.; Singh, N.P.; Bhaskar, S. Assessing Impact of Dry Spells on the Principal Rainfed Crops in Major Dryland Regions of India. Agric. For. Meteorol. 2022, 313, 108768. [Google Scholar] [CrossRef]
  32. Hjelmfelt, A.T., Jr. Investigation of Curve Number Procedure. J. Hydraul. Eng. 1991, 117, 725–737. [Google Scholar] [CrossRef]
  33. Wang, Z.; Zhong, R.; Lai, C.; Zeng, Z.; Lian, Y.; Bai, X. Climate Change Enhances the Severity and Variability of Drought in the Pearl River Basin in South China in the 21st Century. Agric. For. Meteorol. 2018, 249, 149–162. [Google Scholar] [CrossRef]
  34. Dai, Y.; Fan, J.; Liao, Z.; Zhang, C.; Yu, J.; Feng, H.; Zhang, F.; Li, Z. Supplemental Irrigation and Modified Plant Density Improved Photosynthesis, Grain Yield and Water Productivity of Winter Wheat under Ridge-Furrow Mulching. Agric. Water Manag. 2022, 274, 107985. [Google Scholar] [CrossRef]
  35. Abou Kheira, A.A. A Study of Trickle Irrigation Systems for Irrigating Some Horticultural Crops in Delta Soils, Shebin El-Kom; Minufiya University: Shibin el Kom, Egypt, 2005. [Google Scholar]
  36. Patode, R.; Nagdeve, M.; Gabhane, V.V.; Ganvir, M.; Turkhede, A.; Gajjala, R. Relationship of Catchment, Storage Capacity and Command Area for Rainwater Harvesting in the Farm Pond. In Water Managment and Water Governance; Springer: Berlin/Heidelberg, Germany, 2020; pp. 449–462. ISBN 978-3-030-58050-6. [Google Scholar]
  37. 2019-2020, A. Annual Report of AICRP on Dryland Agriculture. Available online: https://www.icar-crida.res.in/publications_annualreports.html (accessed on 23 July 2022).
Figure 1. Conceptual diagram of the catchment–storage–command relationship.
Sustainability 16 03996 g001
Figure 2. Location map of study area and Southern Rajasthan, India.
Sustainability 16 03996 g002
Figure 3. Daily rainfall and maximum and minimum temperatures during the kharif crop growing season from 2009 to 2014.
Sustainability 16 03996 g003aSustainability 16 03996 g003bSustainability 16 03996 g003c
Figure 4. Rainfall runoff relationship in an agricultural watershed of 2.0 ha for the period 1994–2014.
Sustainability 16 03996 g004
Figure 5. System water use efficiency under different seasonal rainfall years during kharif.
Sustainability 16 03996 g005
Figure 6. Benefit/cost ratio under different seasonal rainfall years (kharif).
Sustainability 16 03996 g006
Figure 7. System water use efficiency under different seasonal rainfall years (rabi).
Sustainability 16 03996 g007
Figure 8. Benefit/cost ratio under different seasonal rainfall years (rabi).
Sustainability 16 03996 g008
Table 1. Important physical and chemical properties of the soil in the domain area.
S.
No.
Depth
cm
Sand
%
Silt
%
Clay
%
Bulk Density (g/cm3)WC
mm/m
OMC
%
PHAvailable N (kg/ha)Available P (kg/ha)Available K (kg/ha)
10–3053.2920.0026.711.51900.487.9021839.0389
230–6049.0021.5029.501.561200.568.2
WC: water content; OMC: organic matter content, P: phosphorous content, N: nitrogen content, K: potassium content.
Table 2. Characteristics of agricultural micro watershed.
S. No.CharacteristicsValue
1Catchment area (ha)2.0
2Perimeter (m)544
3Maximum length (m)159
4Average width (m)115
5Shape index1.38
6Watershed relief (m)2.29
7Relief ratio0.02
8Relative relief0.004
9Elongation ratio0.74
10Compactness coefficient1.09
11Farm factor0.82
12Land managementOutward sloping
13LanduseAgriculture
Table 3. Monthly mean runoff-producing rainfall from agricultural micro watershed.
S. No.MonthsRunoff-Producing Rainfall (mm)
1994199619972004200620072008200920102011201220132014
1June179.80008907607368000
2July401.6162.4163140210168.865146491475766.771
3August61267.446.8469.434828.4950202218.4151.5264.7241
4September26103380430118.4006530082
5October0000000000000
6November000000001260000
7December0000000000000
Total668.4532.8247.8609.4690197.2354.4146450498.4238.5331.4390.00
Table 4. Monthly mean runoff recorded from agricultural micro watershed.
S. No.MonthsRunoff (m3)
1994199619972004200620072008200920102011201220132014Mean
1June386.010.0000197.750155.800149.65111.52000.0076.98
2July1201.09390.48501.22311.00438.58232.1971.96150.5732.08227.61173.04191.34146.38312.89
3August150.10687.4471.421157.95969.8520.38126.580662.77565.58797.441022.26424.96512.06
4September63.96158.4654.53088.150234.6400174.2575.470186.5479.69
5October0000000000000.000.00
6November00000000300.120000.0023.09
7December0000000000000.000.00
Total1801.161236.38627.171468.951694.33252.57588.98150.571144.611078.961045.951213.60757.881004.71
S.Em± 40.29
C.D (5%) 113.58
CV (%) 130.50
Normal seasonal
rainfall (mm)
626626626615614.5614.5614.5611.5611.5611.9611.9614.5614.5
Actual seasonal
rainfall (mm)
1037.4826571.6978.41032.8520.4633.5306.8593509.7963.8747.2521.6
Note: Data not available during the years 1995, 1998–2003, and 2005.
Table 5. Dry spells occurring year-wise during the crop-grown period from 2009 to 2014.
S. NoYear Dry Spell PeriodNo. of DaysStage of Crops in MaizeStage of Crops (Vegetables)
1200928 July–11 August15TassellingVegetative, flowering, and fruit/pod setting stages of vegetables
216 August–29 August14Silking
35 September–until withdrawal of monsoon35 +Grain development
4201016 September–until withdrawal of monsoon25 +Grain development
5201119 September–until withdrawal of monsoon21 +Grain development
6201214 July–6 August24Vegetative
721 September–until withdrawal of monsoon19 +Silking and grain development
8201326 August–15 September21Silking
92 October–until withdrawal of monsoon9 +Grain development
1020141 July–9 July 10Vegetative
1120 August–26 August07Tasselling
1214 September–until withdrawal of monsoon26 +Grain development
+ Second week of October is the harvesting period of crops.
Table 6. Effect of supplemental irrigation on yield of kharif crops.
S. No.TreatmentsMaize Grain Equivalent Yield (kg/ha)
20092010201120122014Mean
1Sponge gourd063617767545450544927
2Bottle gourd532156678125644062846367
3Ridge gourd791684287097654070987416
4Kachari (cucumber)827092319017712081028348
5Veg cow pea393276556267665060106103
S.Em±28344938695.5411622.24
C.D (at 5%)595943810311.713401865.46
CV (%) 20.98
1Surface irrigation (5 cm)460469347021612631565568
2Drip irrigation (5 cm)557180038288675538696497
S.Em±12720117223.1513282.45
C.D (at 5%)376597512115.85456323.75
CV (%) 3.06
1Maize (irrigated) 5 cm4789 *45474333408228004110
2Maize unirrigated3433 *28502534224118702586
S.Em± 121.15
C.D (at 5%) 475.70
CV (%) 8.09
Normal seasonal rainfall (mm)611.5611.5611.9611.9614.5
Actual seasonal rainfall (mm)306.8593.0509.7963.8521.6
* Maize stover yield, as it was drought year. Data not available for the year 2013.
Table 7. Productivity of rabi crops as influenced by supplemental irrigation in kharif and rabi seasons.
S. No.TreatmentPea Pod Equivalent Yield (kg/ha)
2011201220132014Mean
Rabi Crops
1Coriander green70835052454743875267.25
2Pea pod51473801342128173796.5
3Brinjal37334271384433333795.25
4S.E m±40066.8960.20145329.76
5C.D at 5%892262.61236.355691141.12
CV(%) 15.39
6Surface irrigation50004143393631564058.75
7Drip irrigation58224608437838694669.25
8S.E m±40020.1319.1213266.08
9C.D at 5%892100.7495.7456297.41
CV(%) 3.03
Disclaimer/Publisher’s Note: The statements, opinions and data contained in all publications are solely those of the individual author(s) and contributor(s) and not of MDPI and/or the editor(s). MDPI and/or the editor(s) disclaim responsibility for any injury to people or property resulting from any ideas, methods, instructions or products referred to in the content.

