
A Continuous Plug-Flow Anaerobic-Multistage Anoxic/Aerobic Process Treating Low-C/N Domestic Sewage: Nutrient Removal, Greenhouse Gas Emissions, and Microbial Community Analysis

Abstract
:1. Introduction
2. Materials and Methods
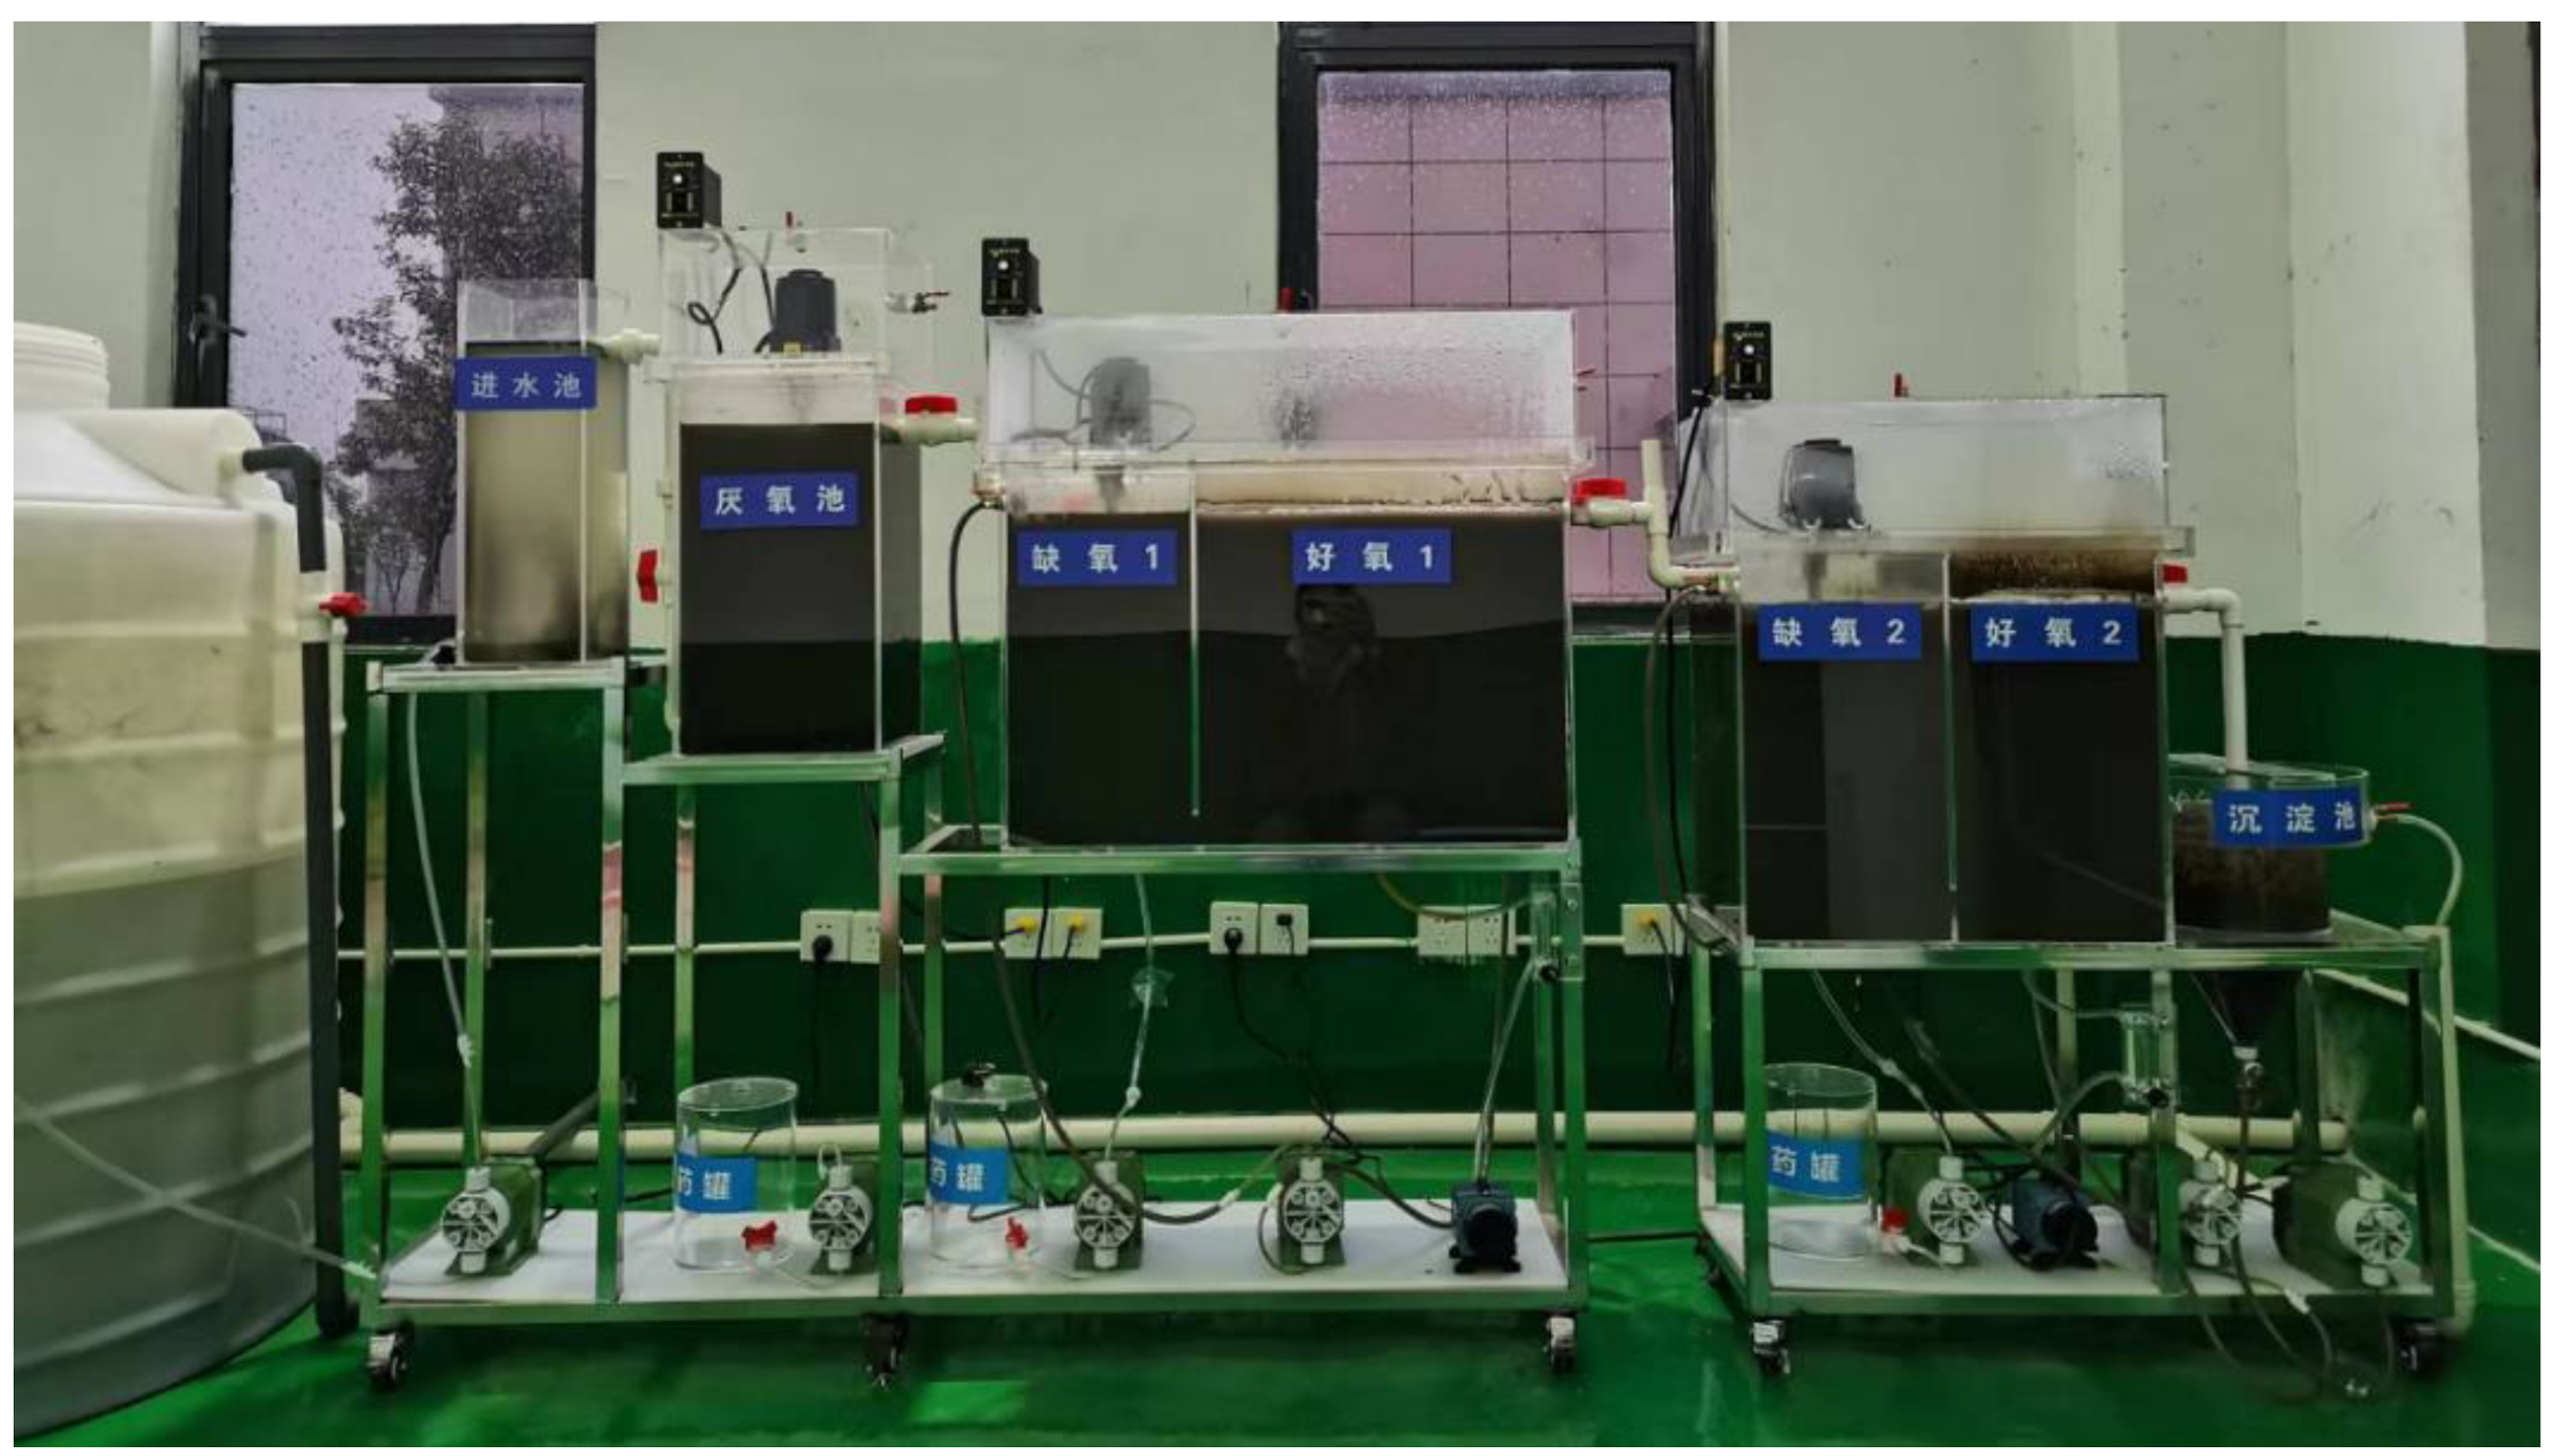
2.1. Bioreactors and Experimental Arrangement
2.2. Inoculated Sludge and Wastewater Source
2.3. Chemical Analysis Methods
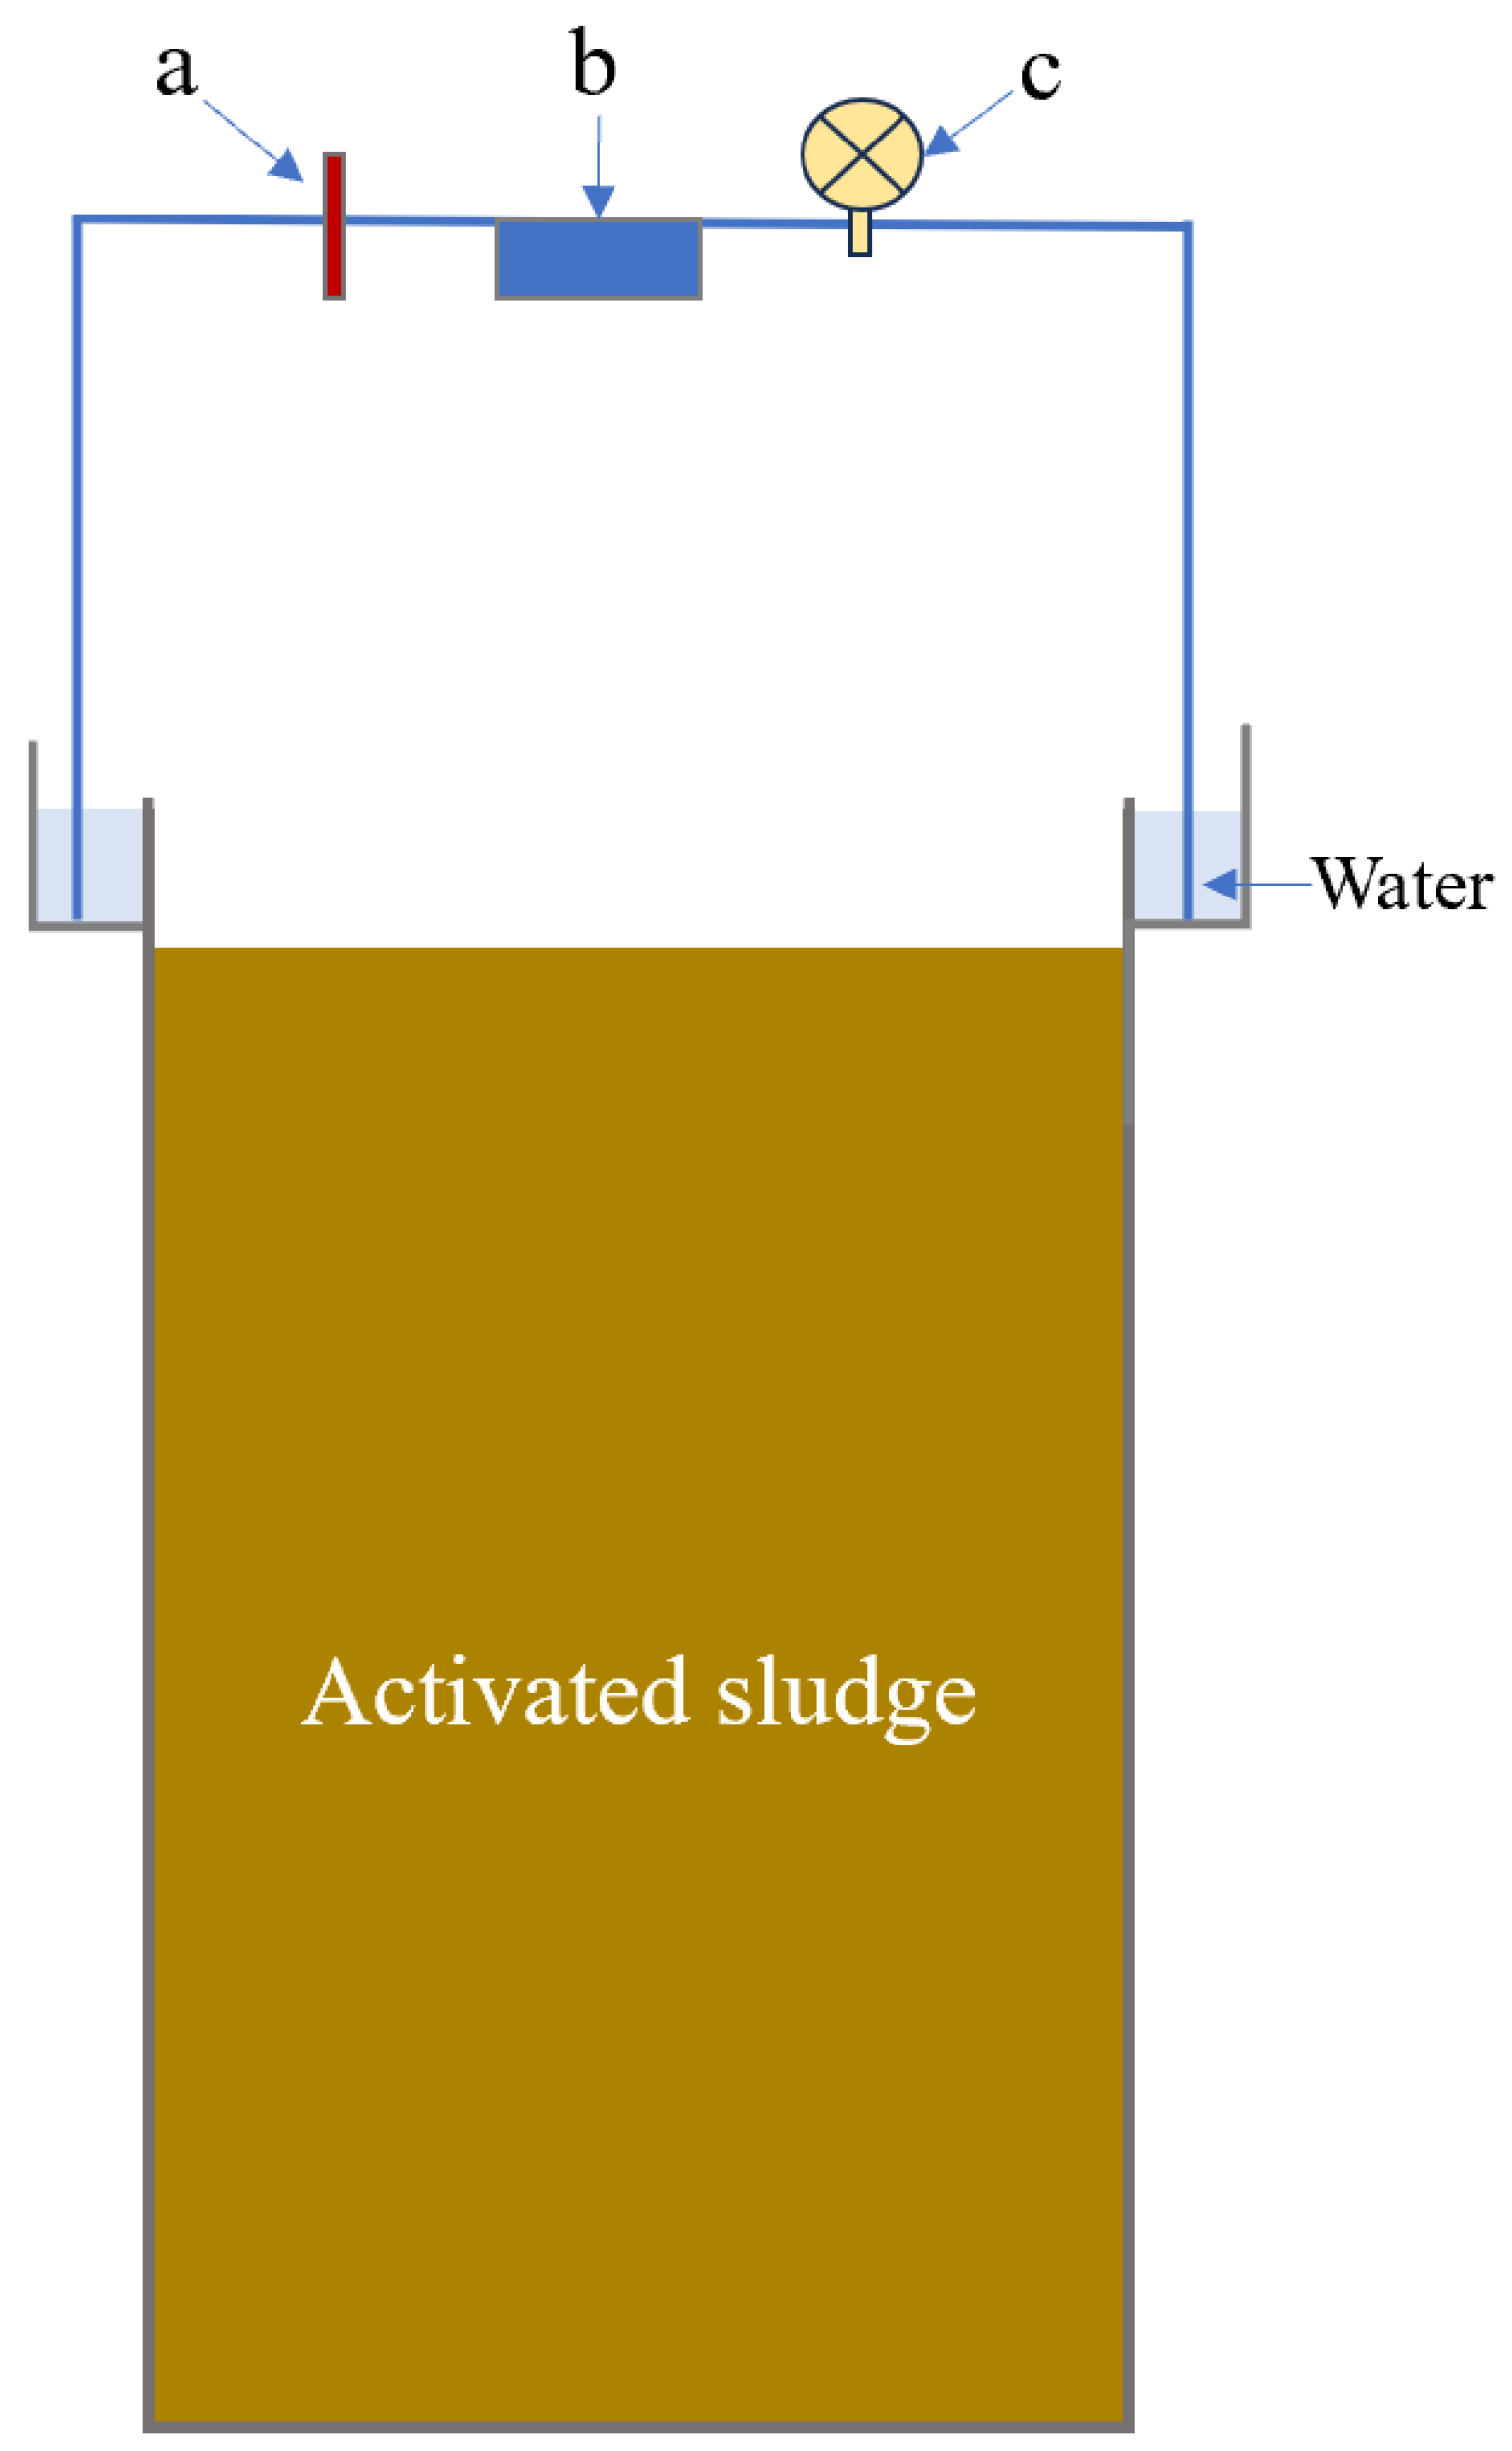
2.4. Greenhouse Gas Collection and Measurement
2.5. High-Throughput Sequencing Analysis
3. Results and Discussion
3.1. Nutrient Removal Performance of A-MAO Process
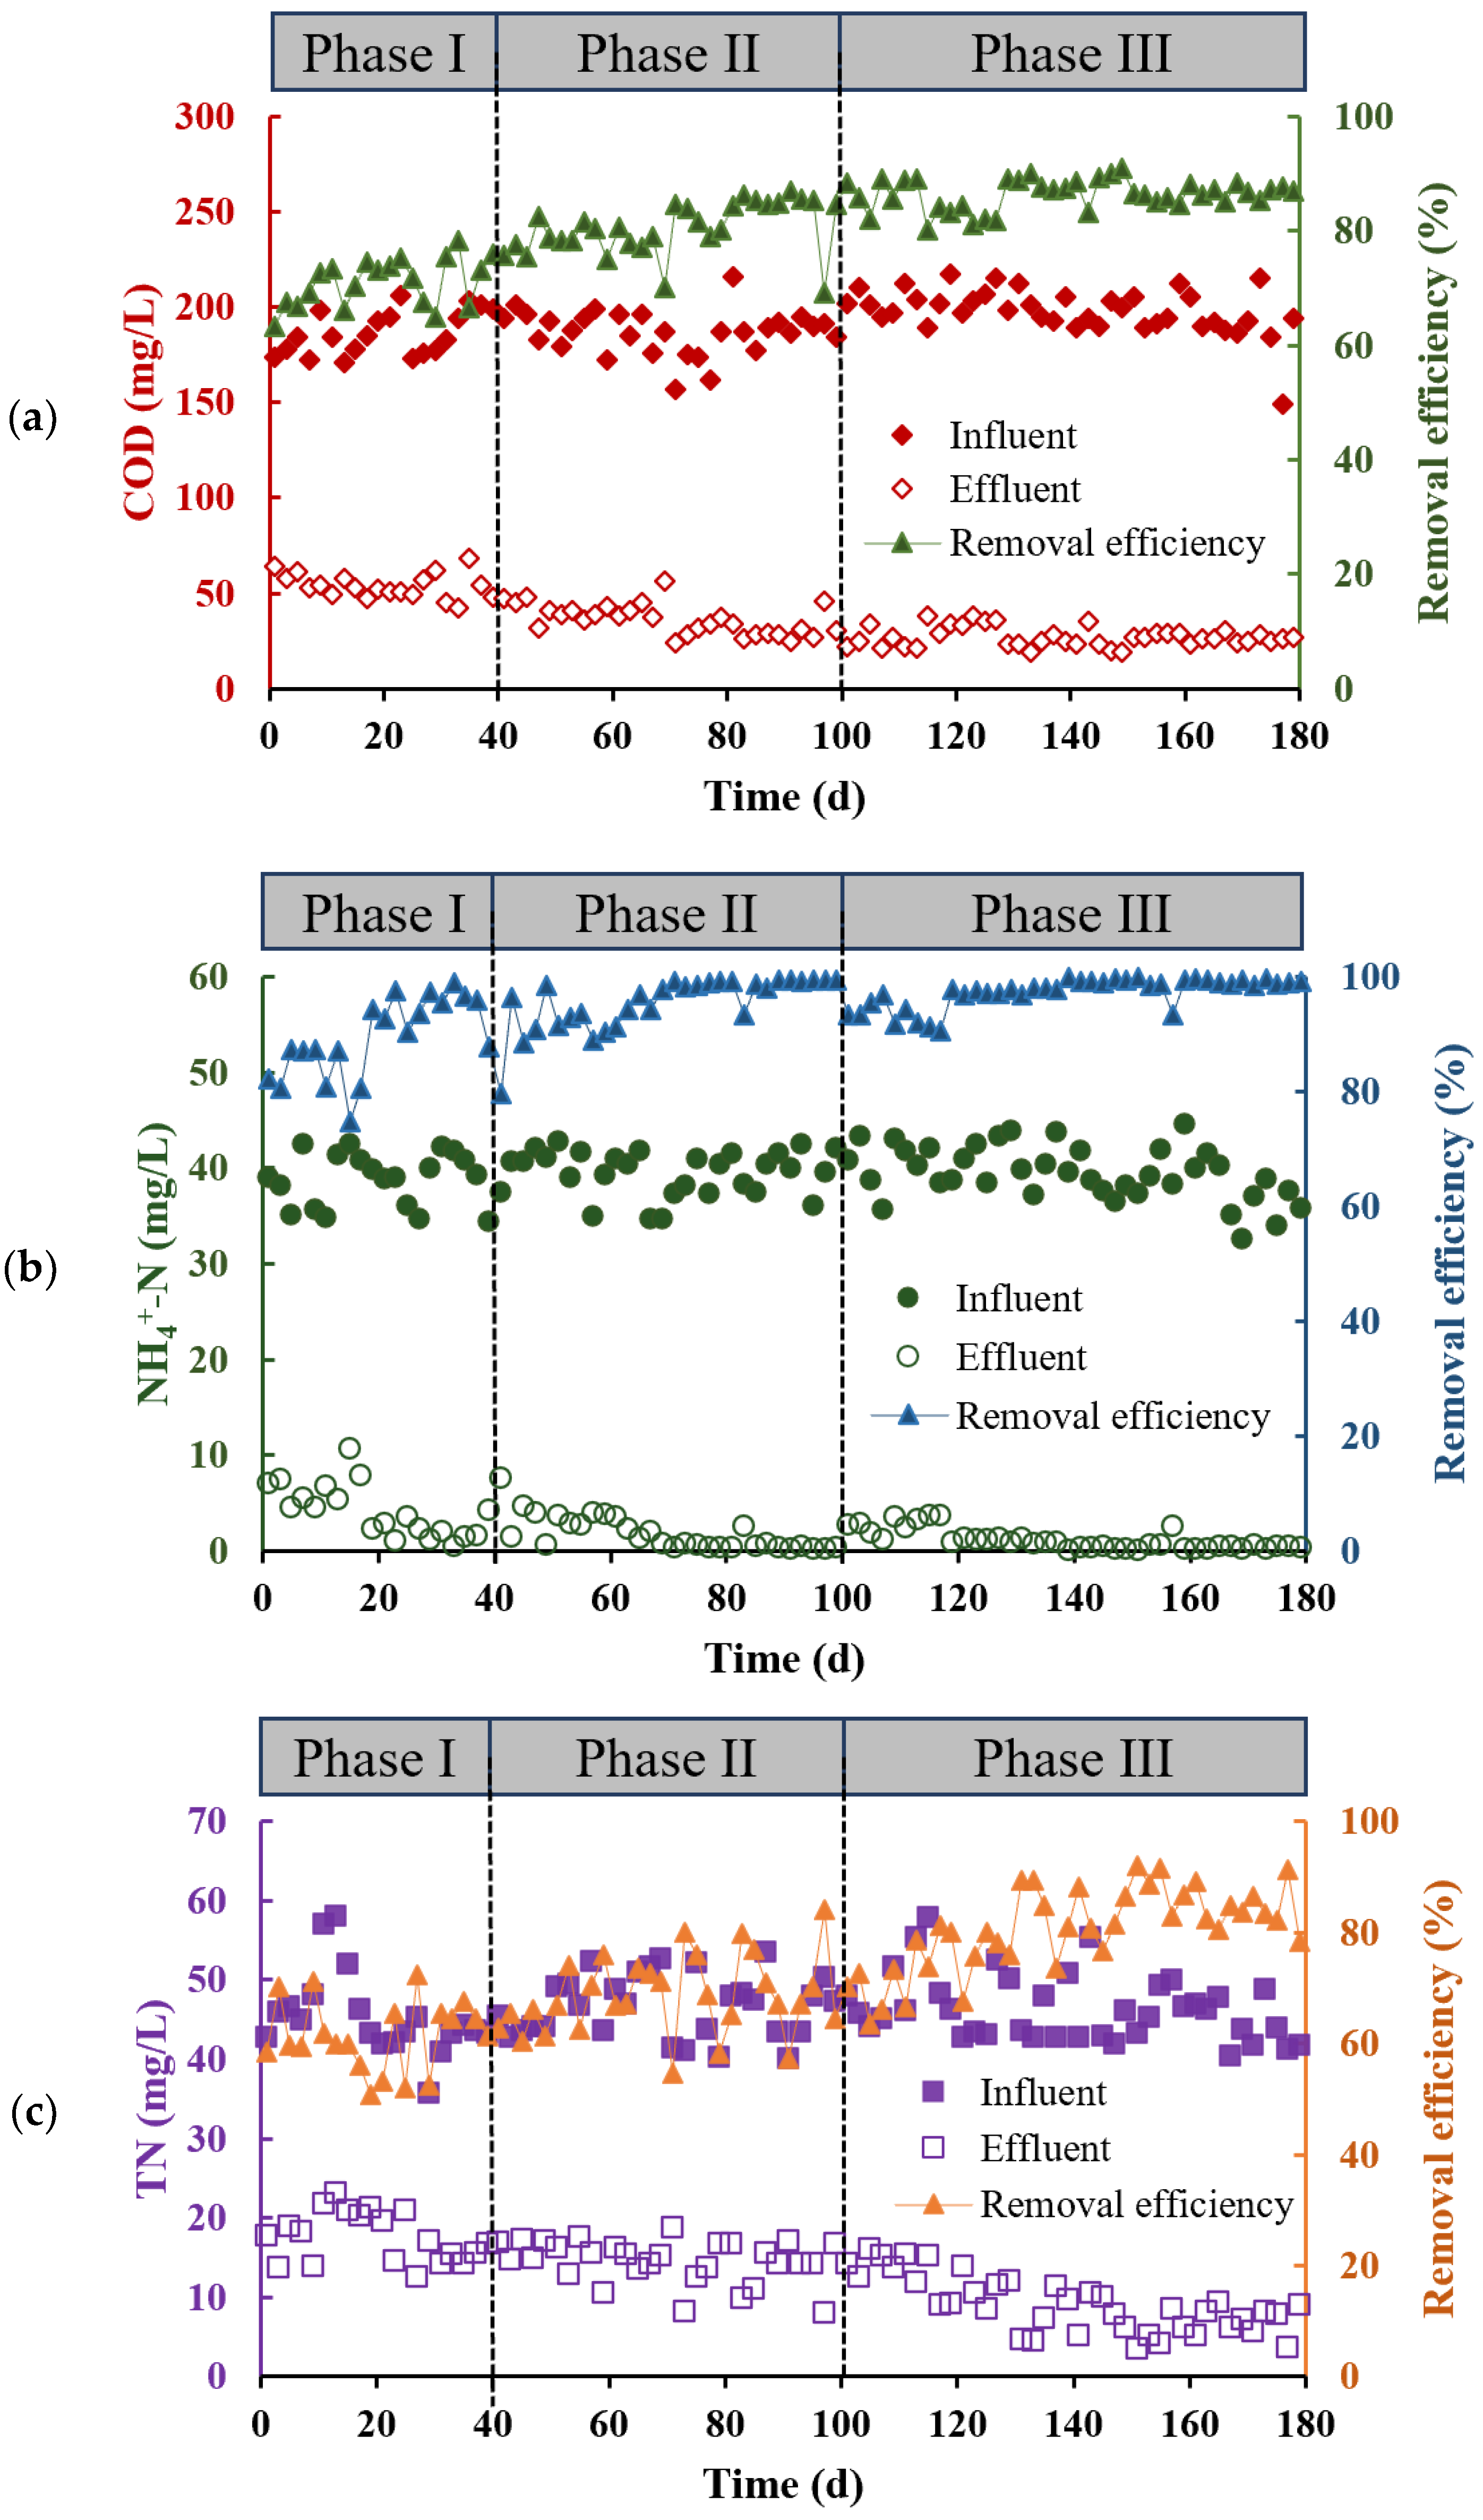
3.1.1. Overall Performance of Organics and Nitrogen Removal
3.1.2. Nutrient Removal Efficiency in Different Units
3.2. Greenhouse Gas Emissions
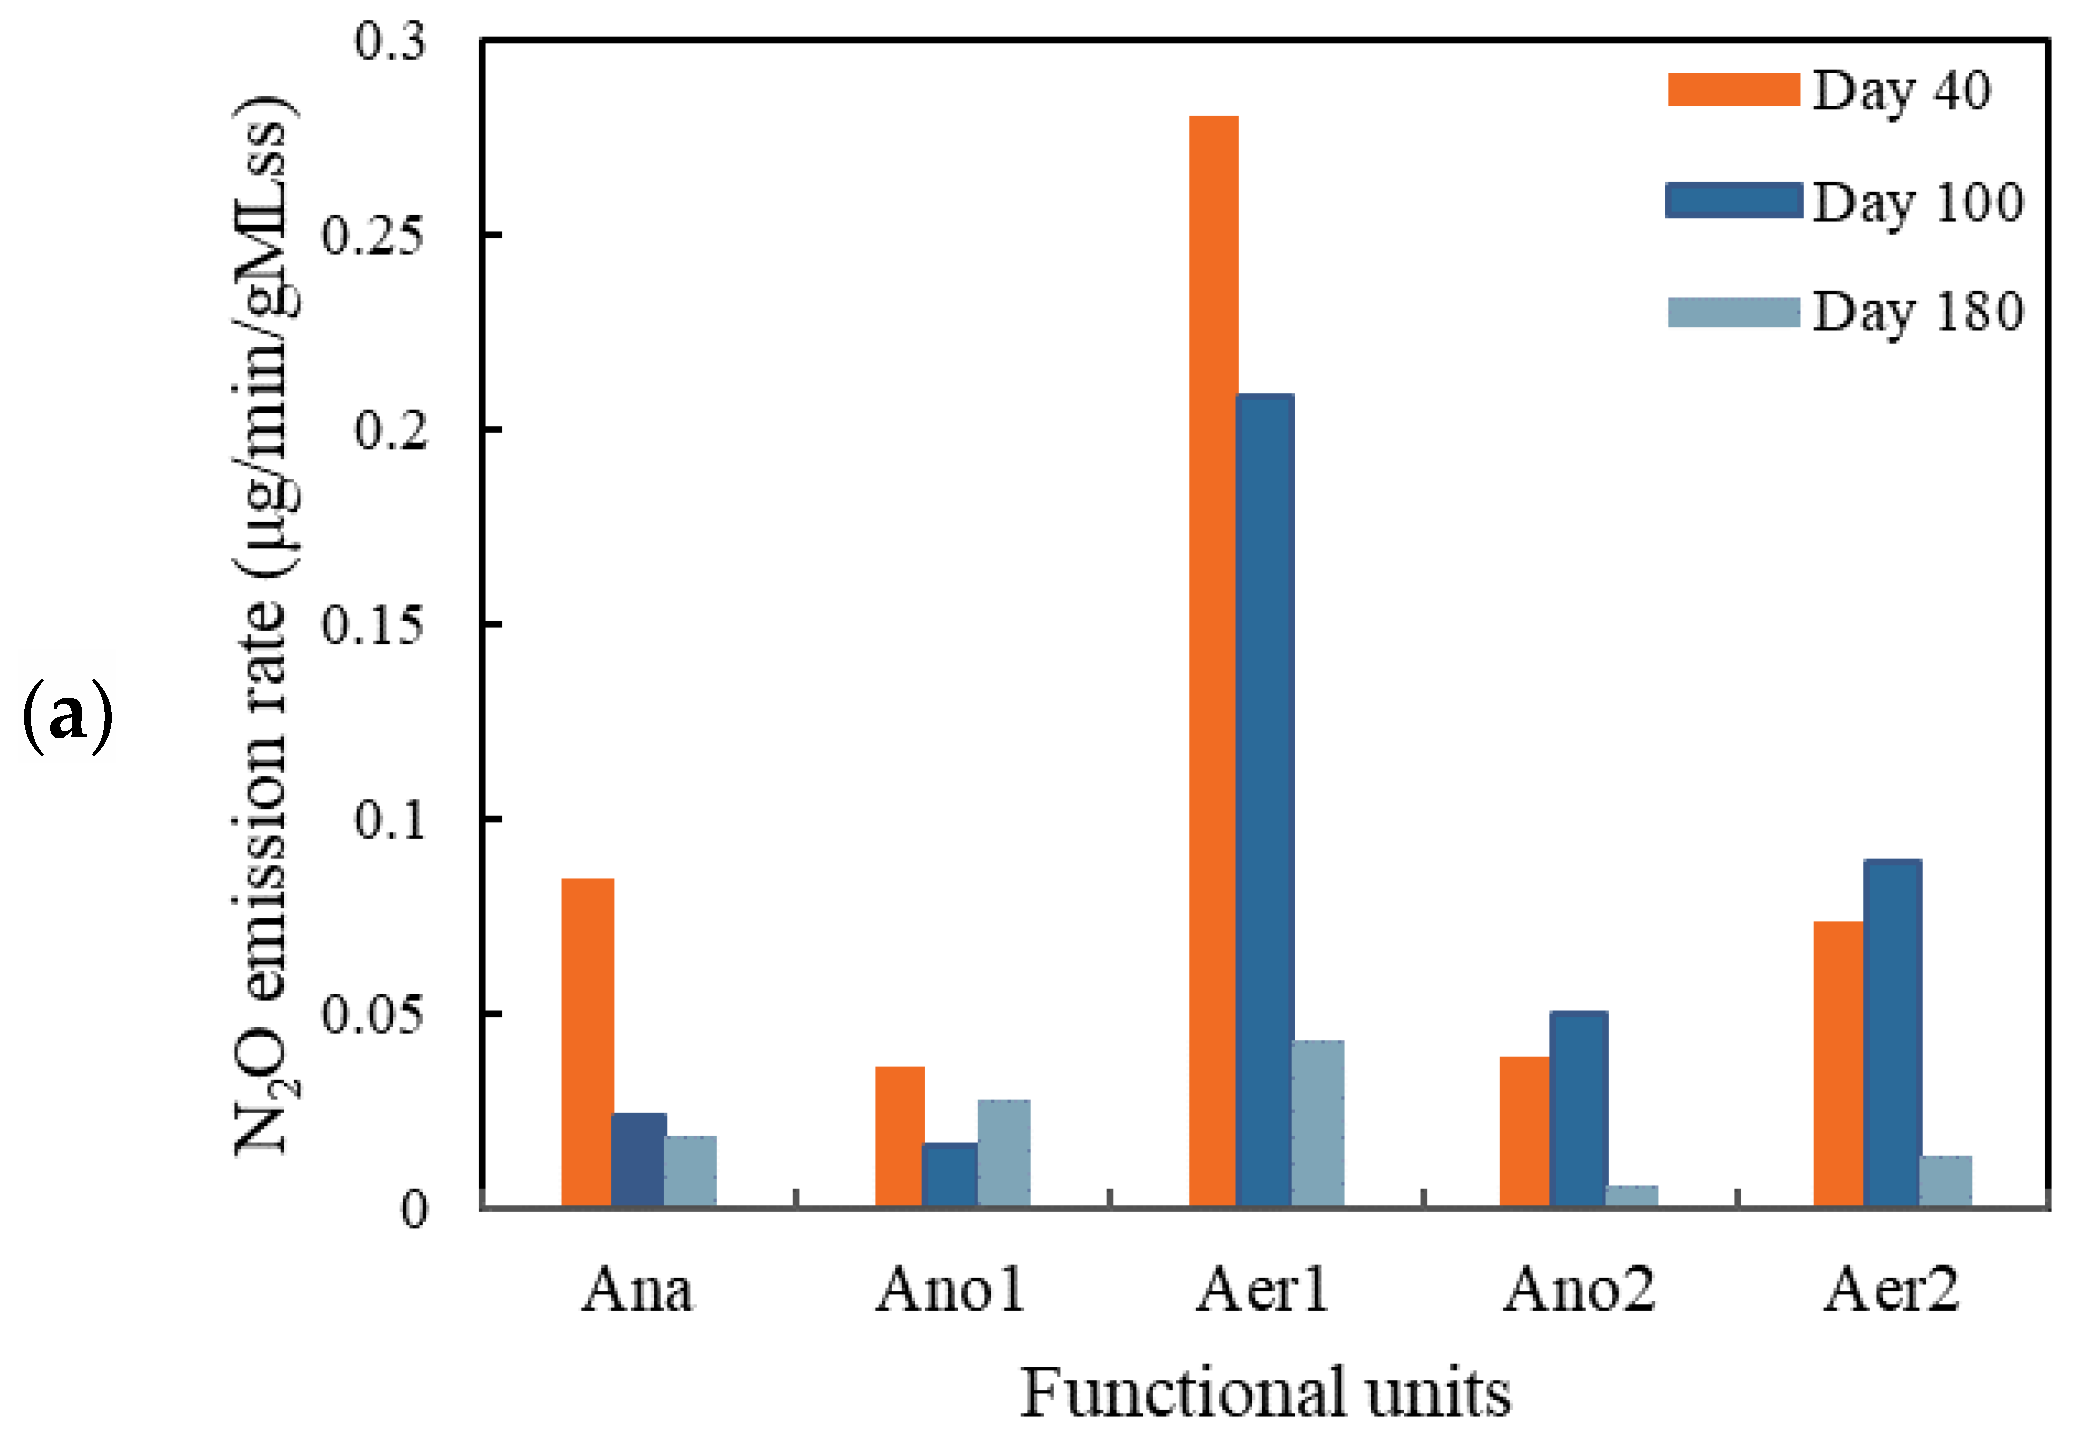
3.2.1. N2O Emission
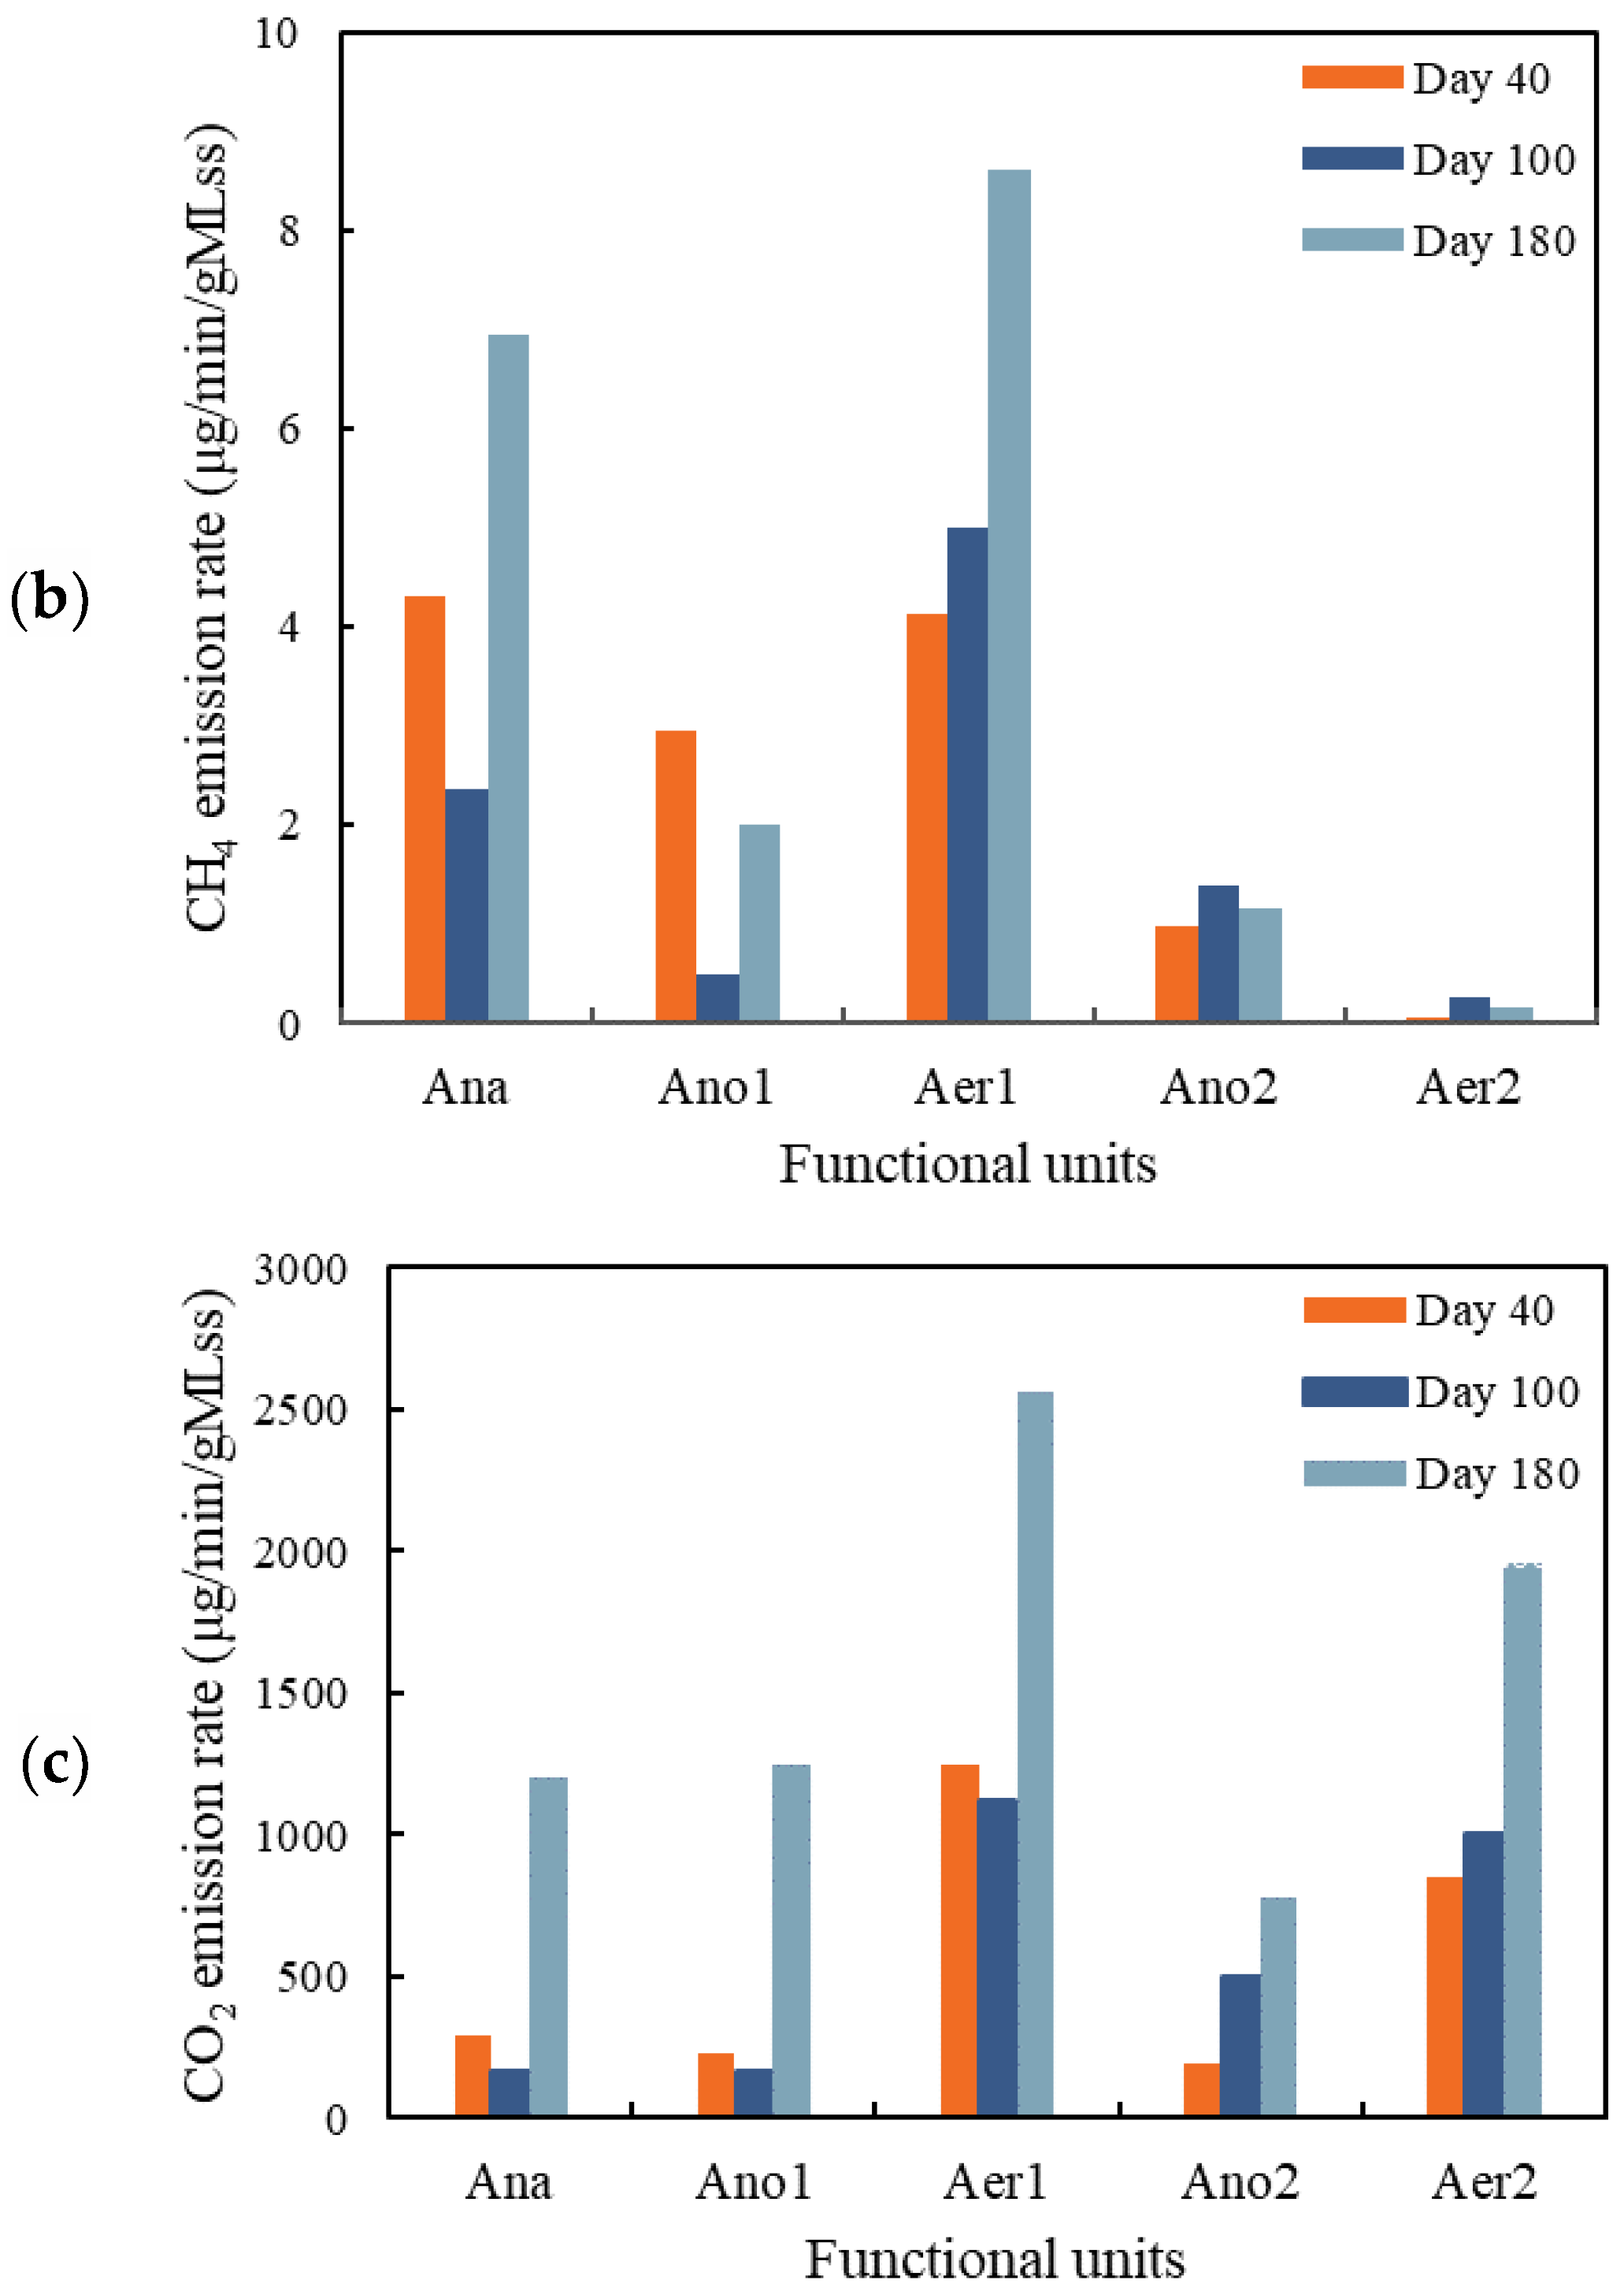
3.2.2. CH4 Emission
3.2.3. CO2 Emission
3.3. Microbial Community Structure Analysis
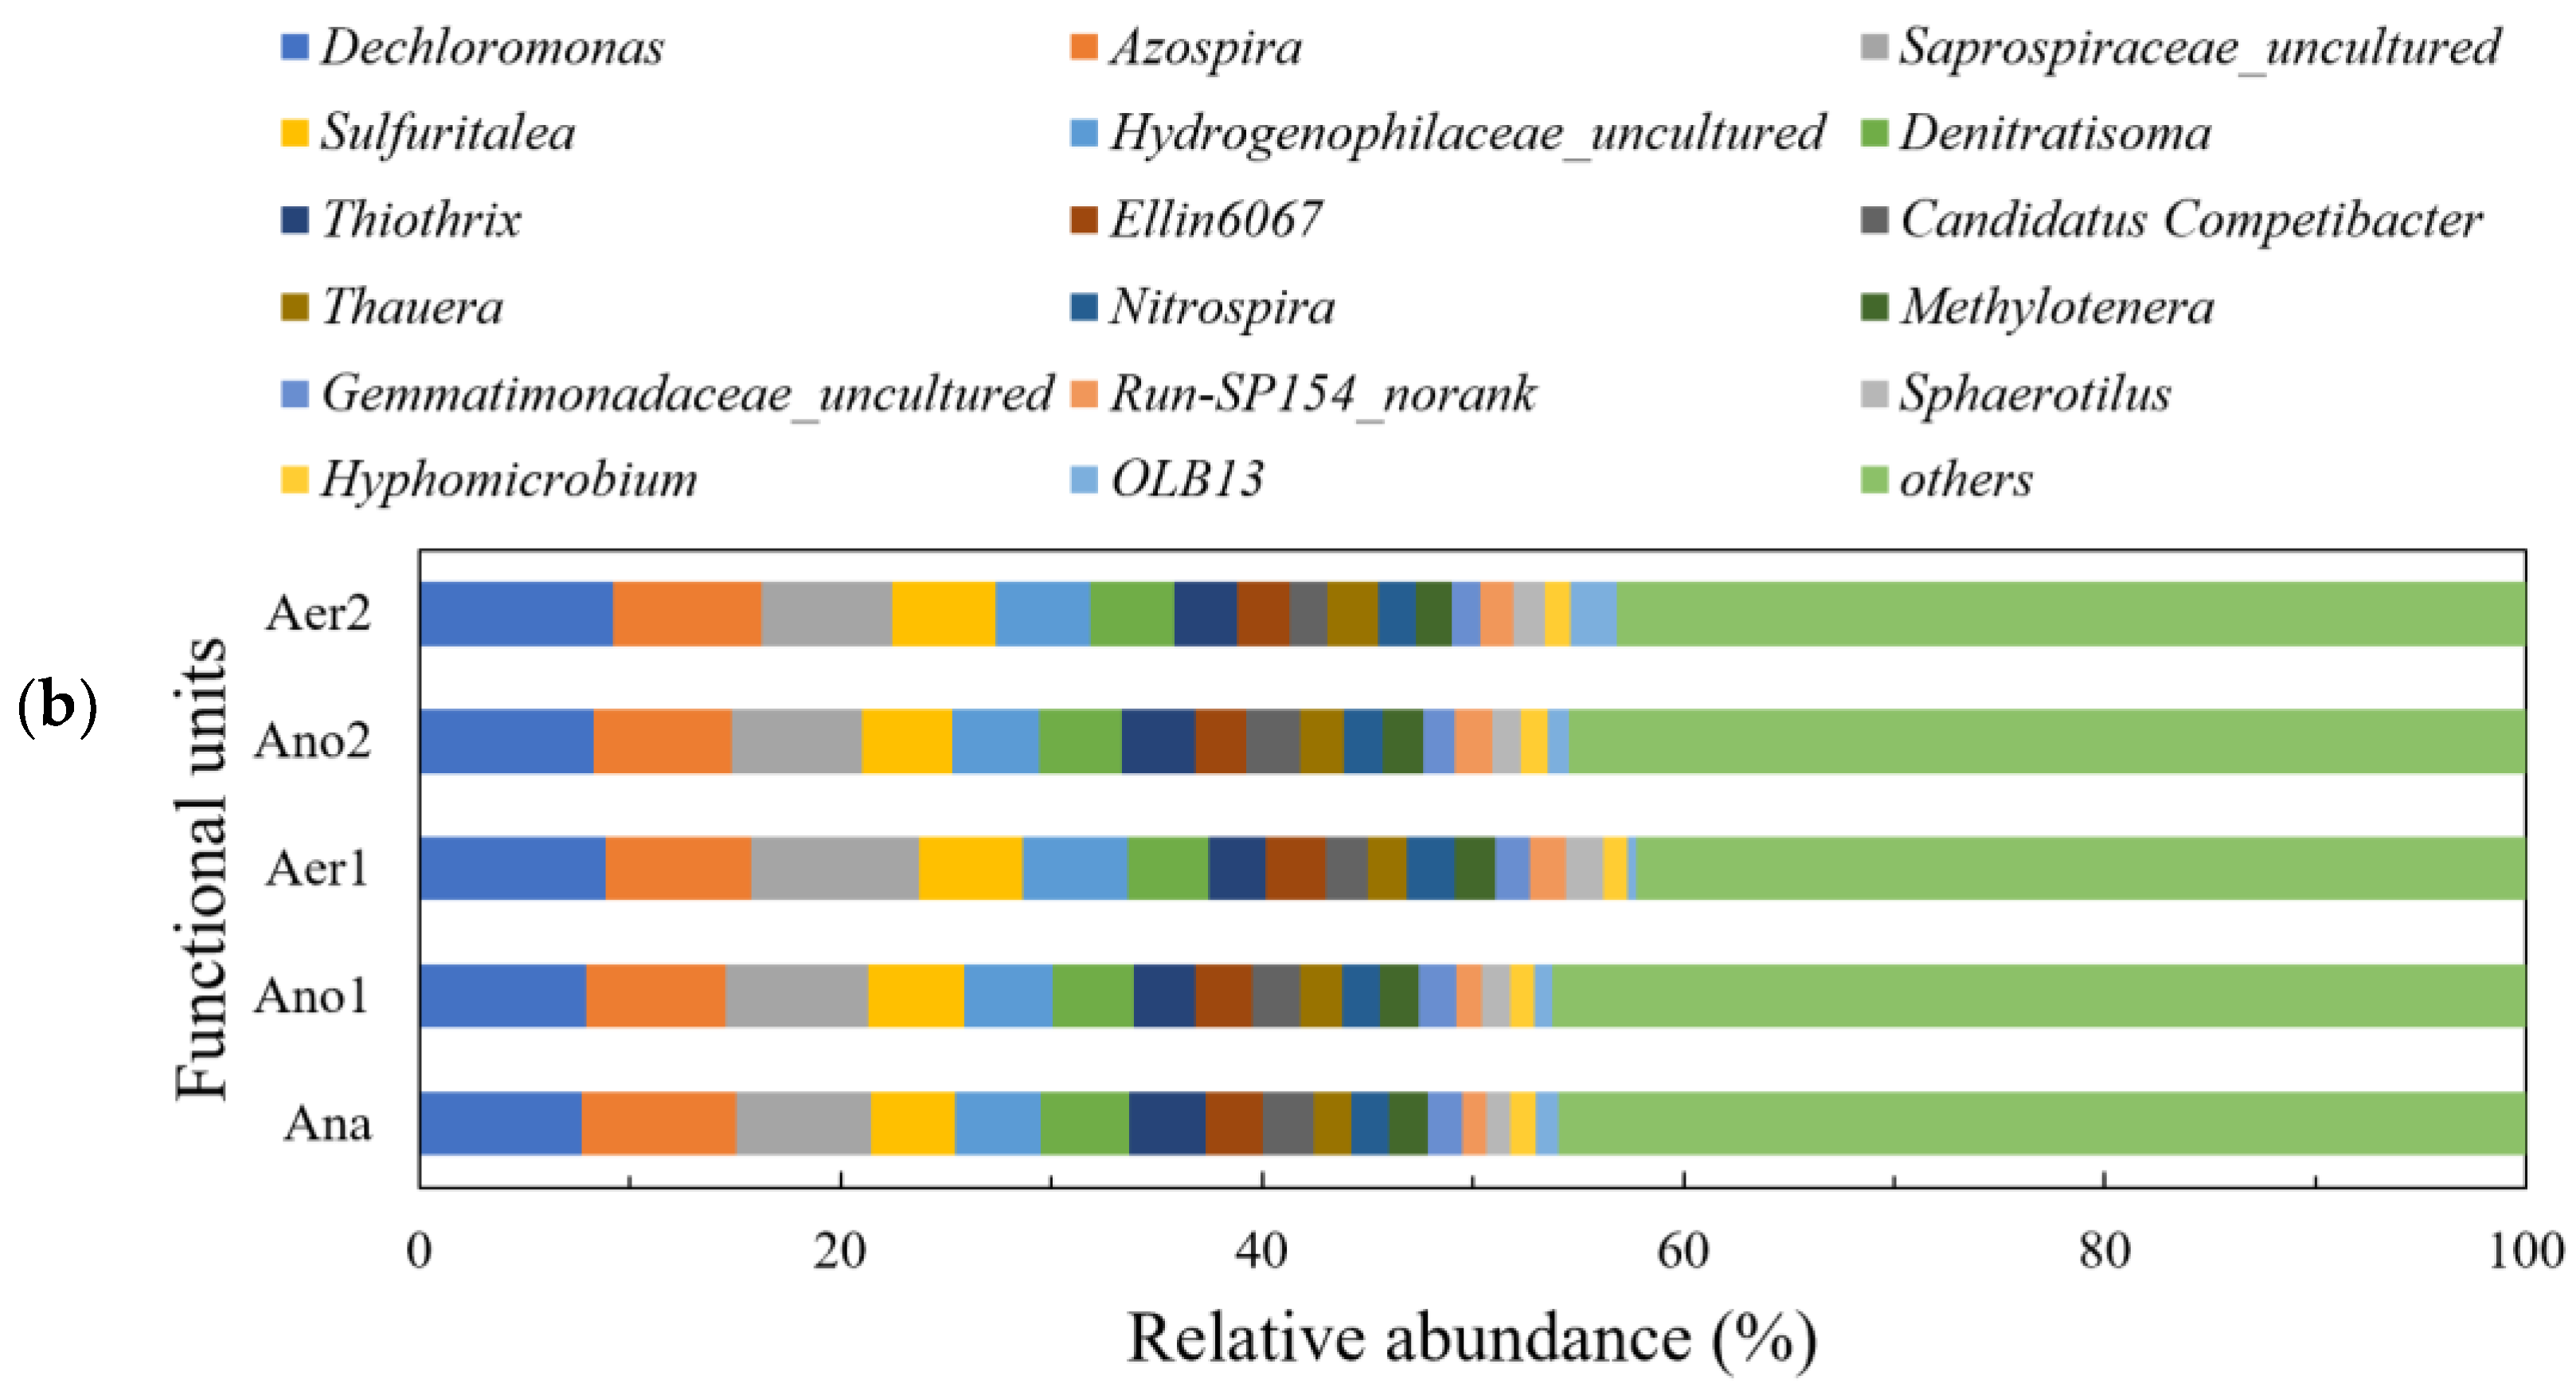
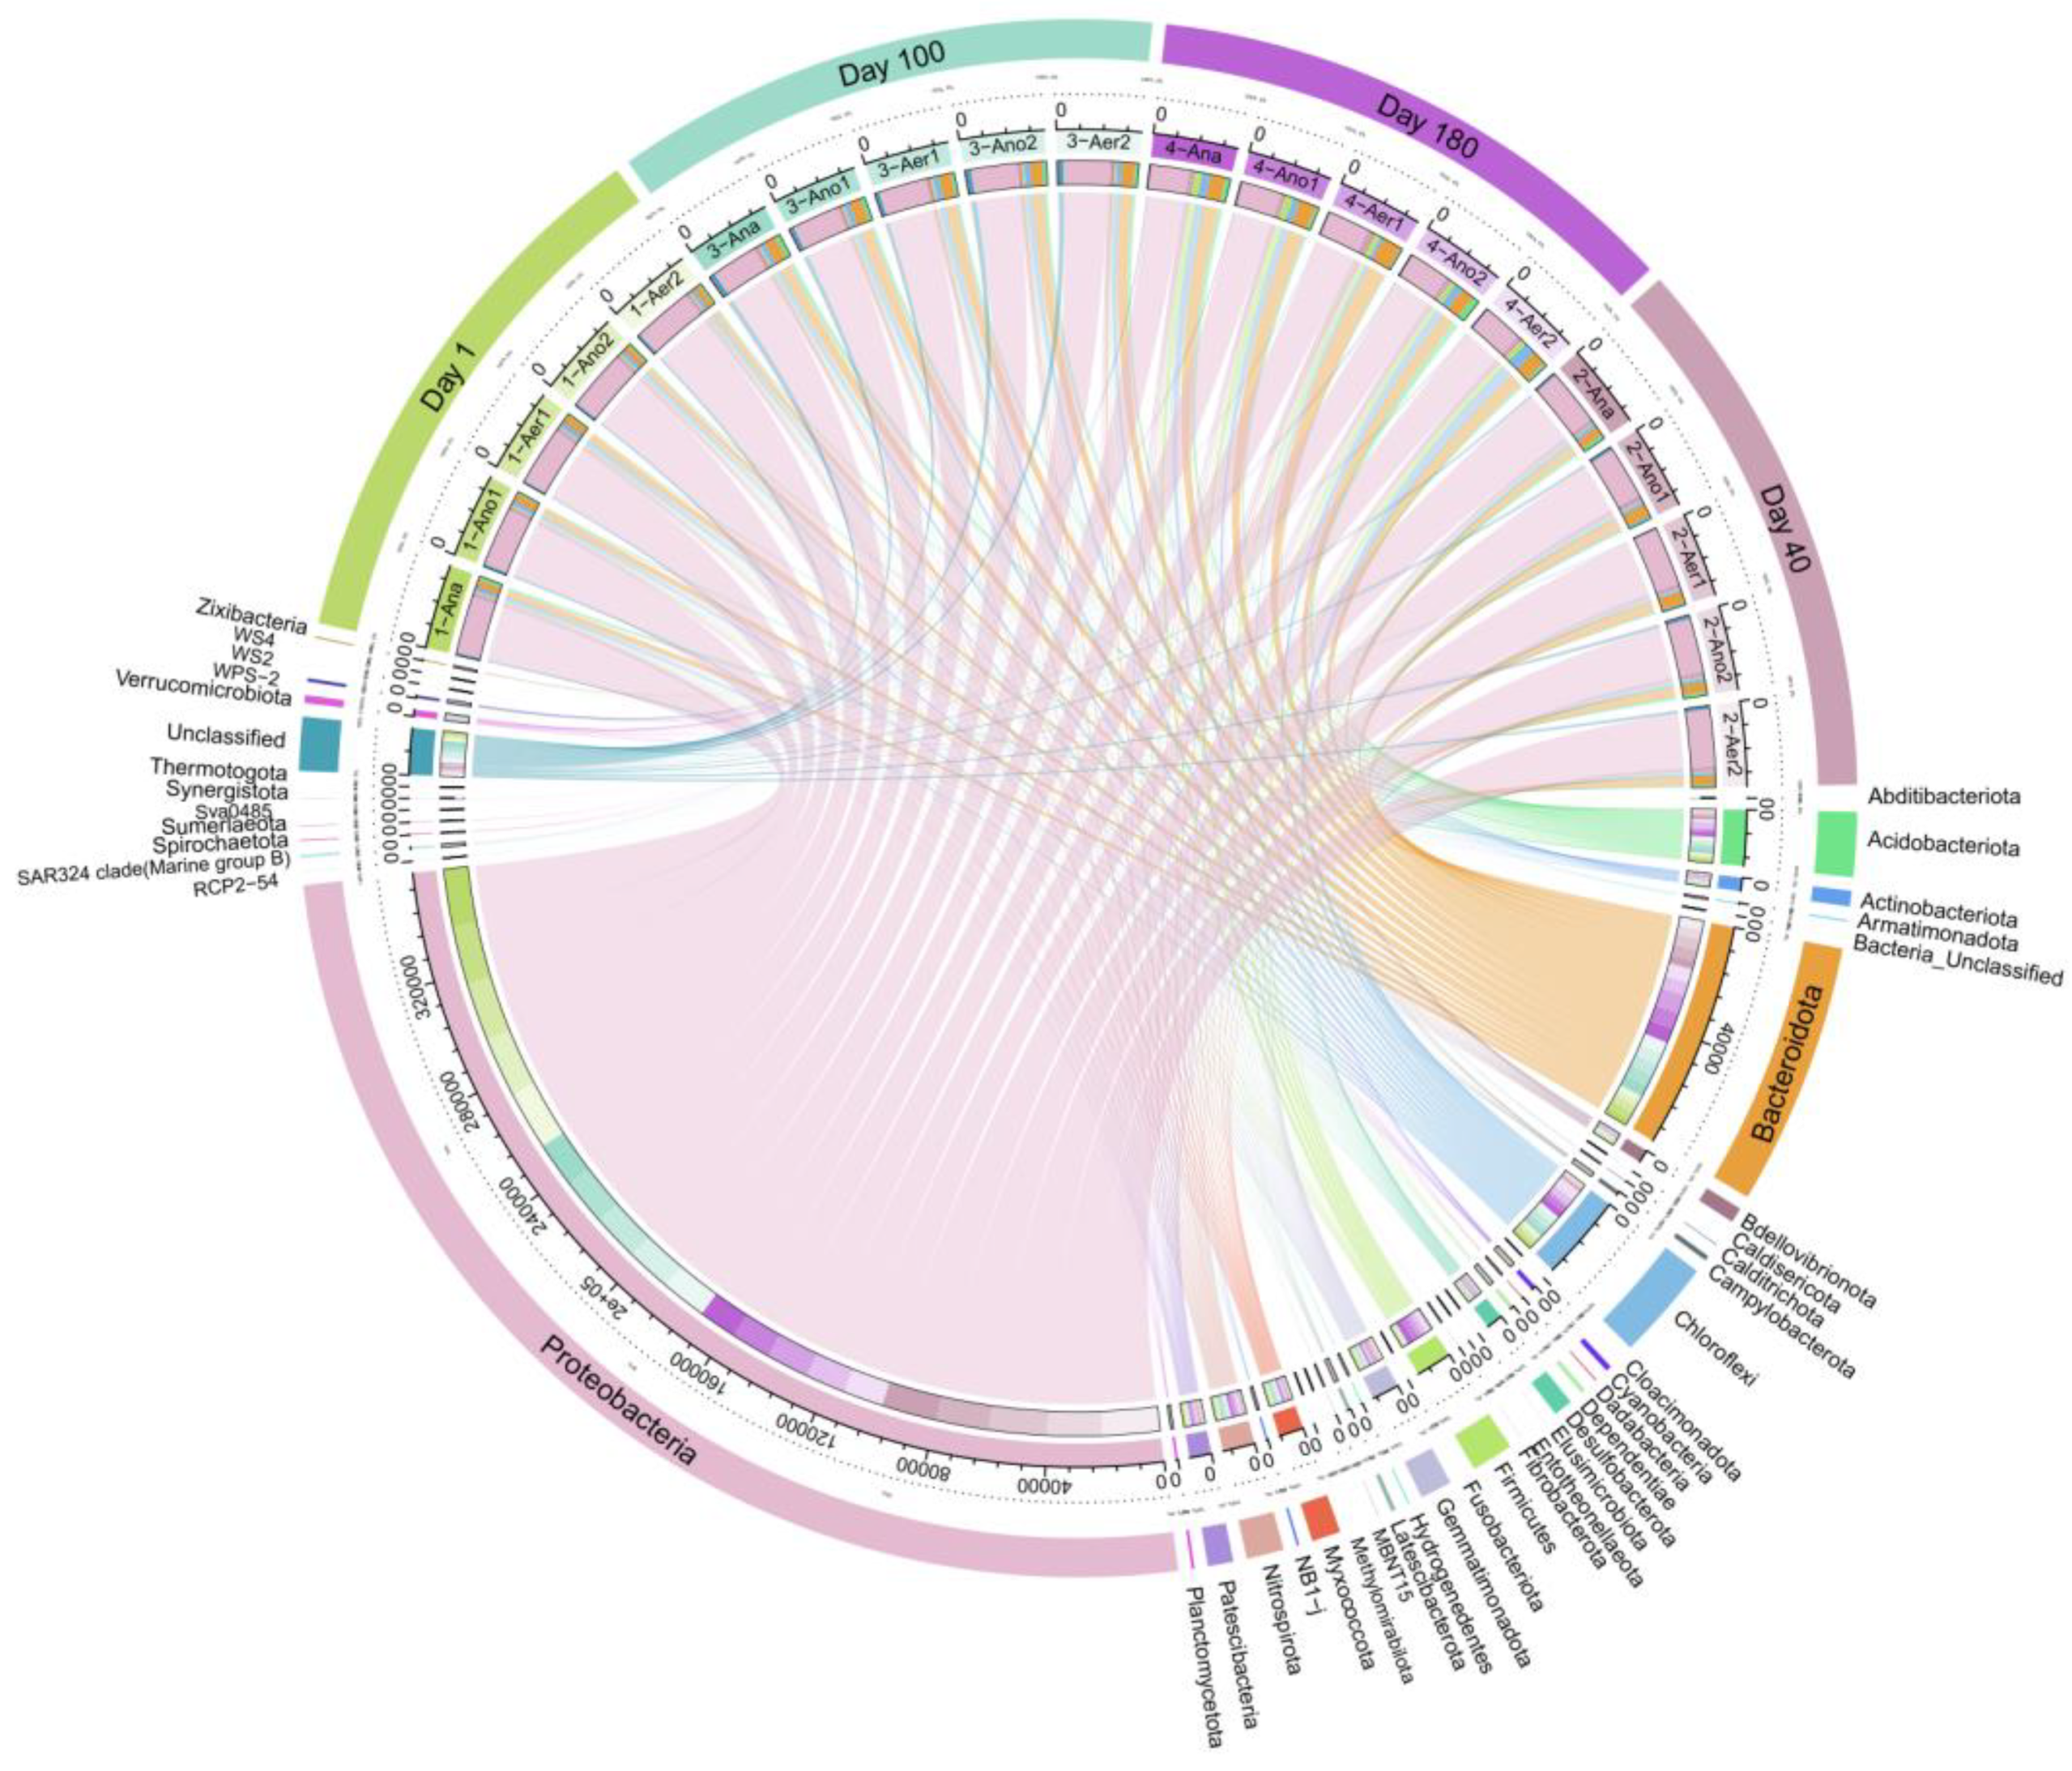
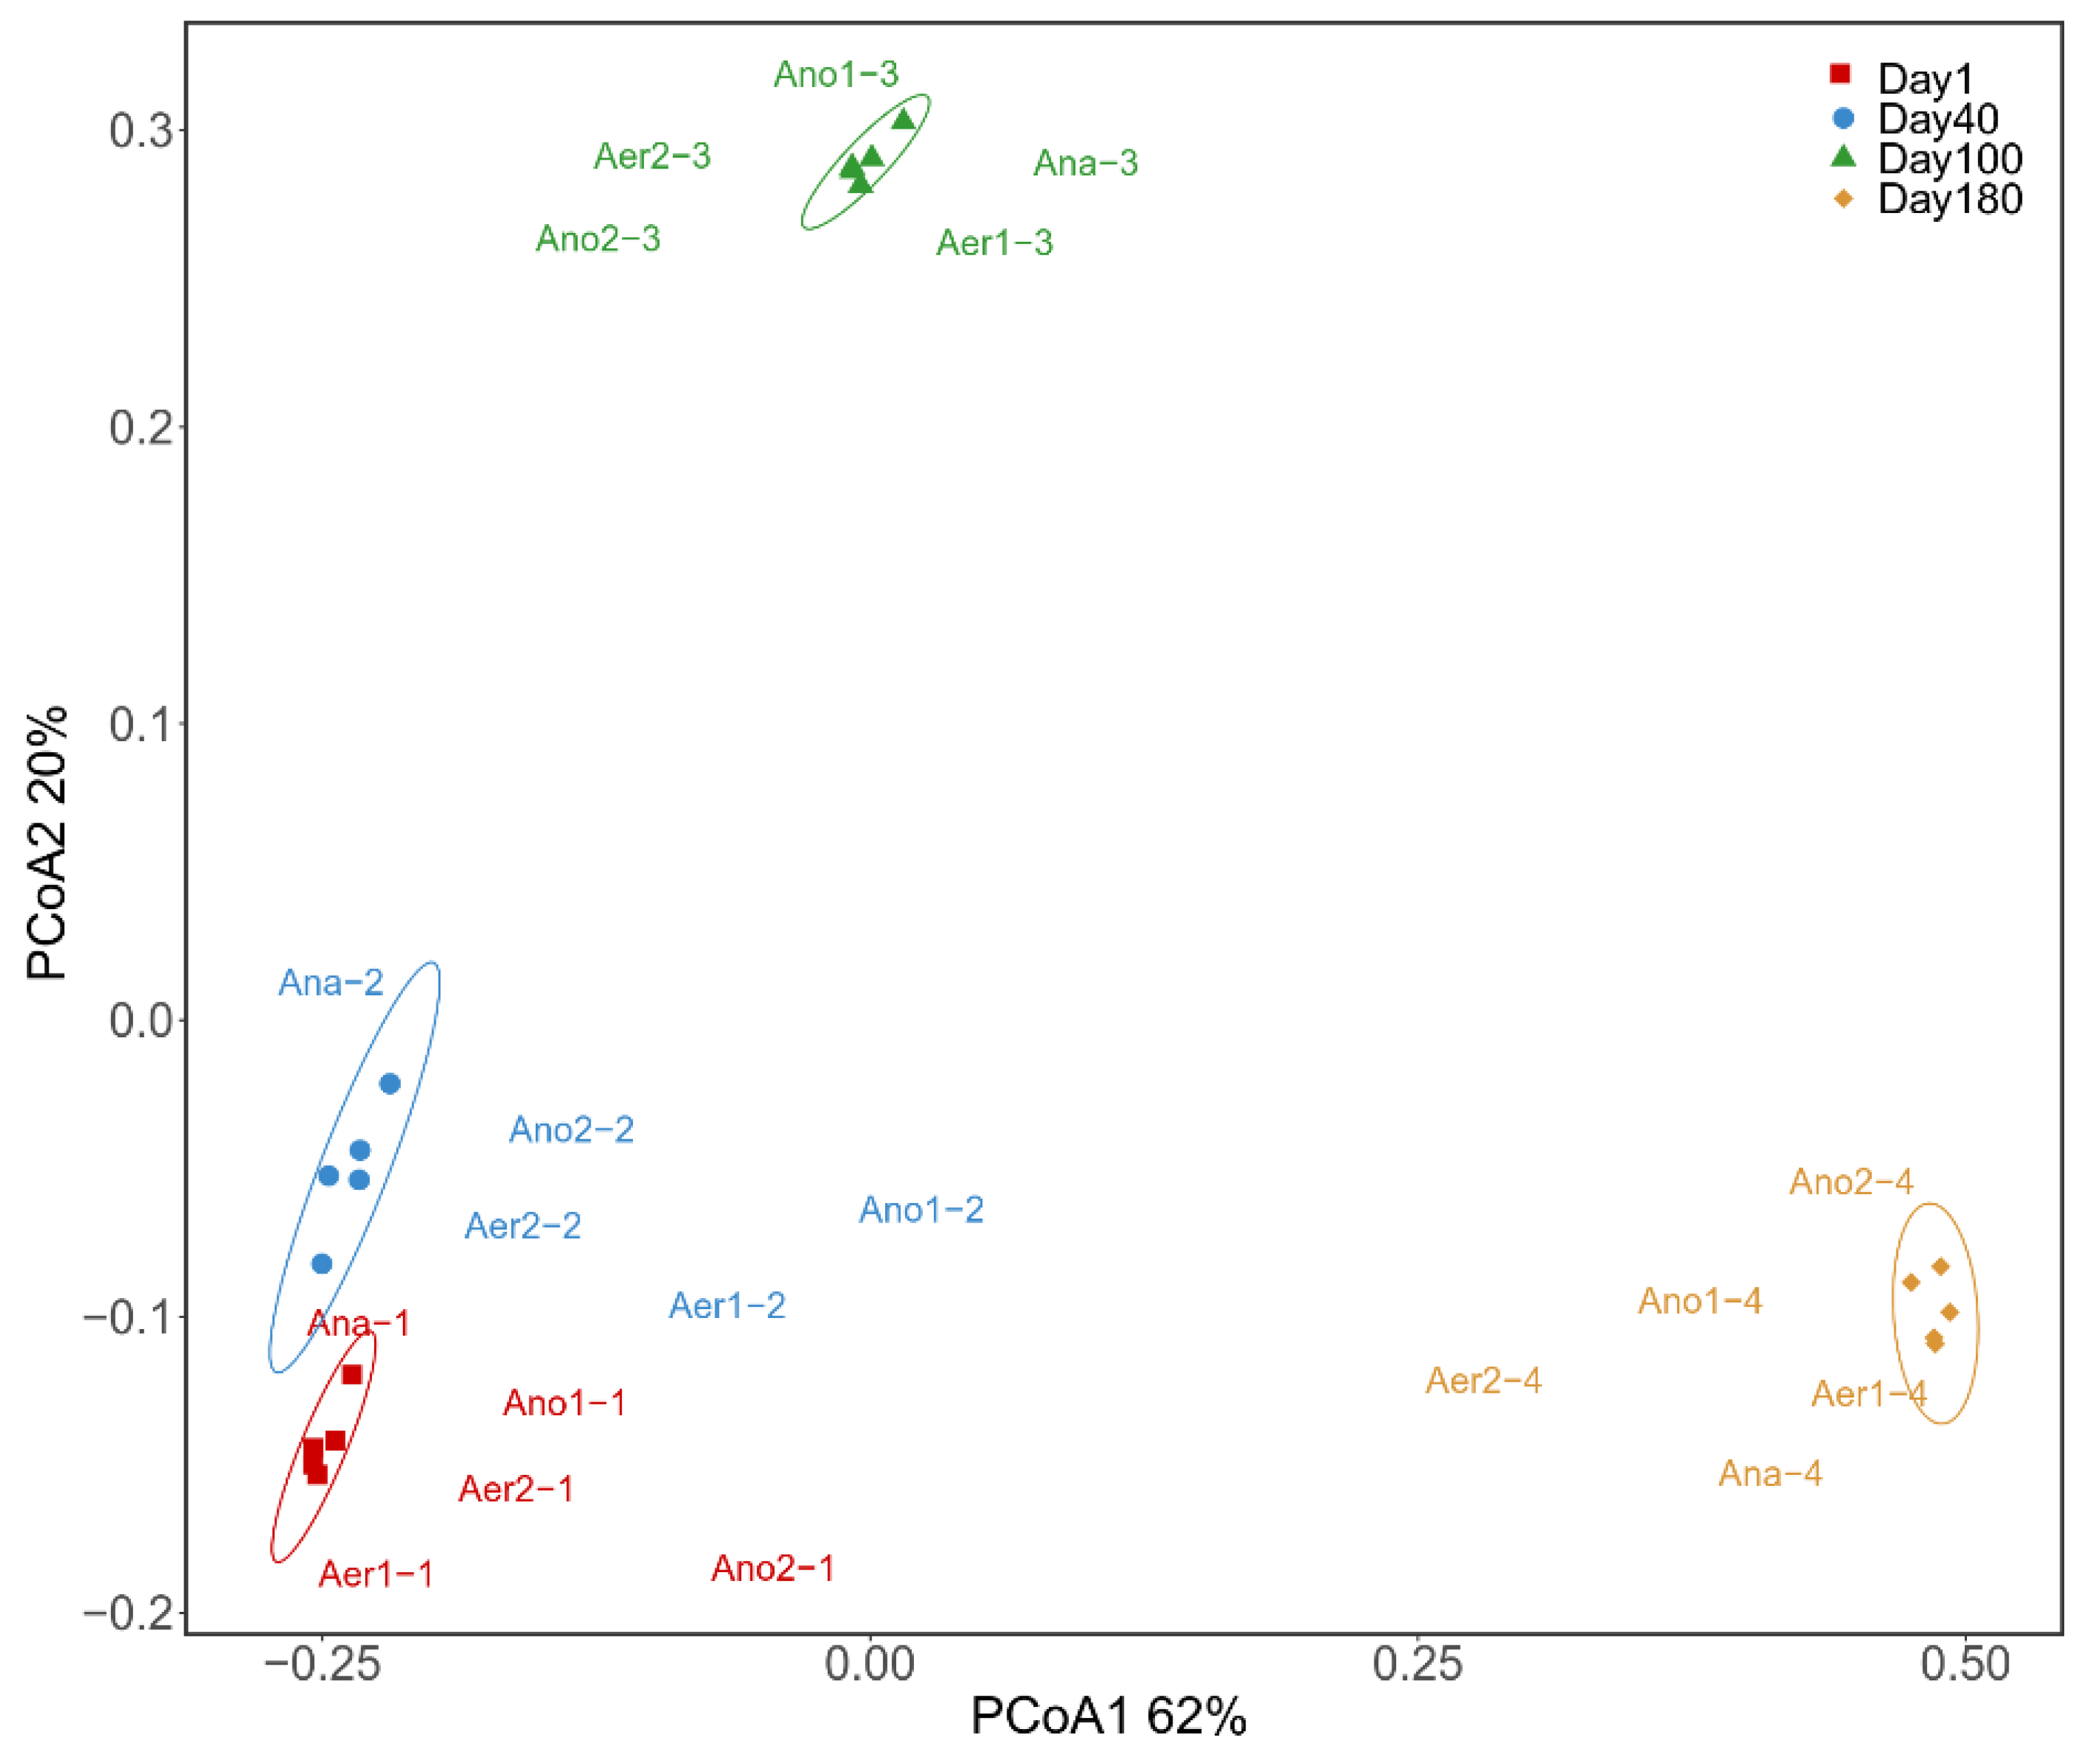
3.3.1. Microbial Diversity and Community Composition
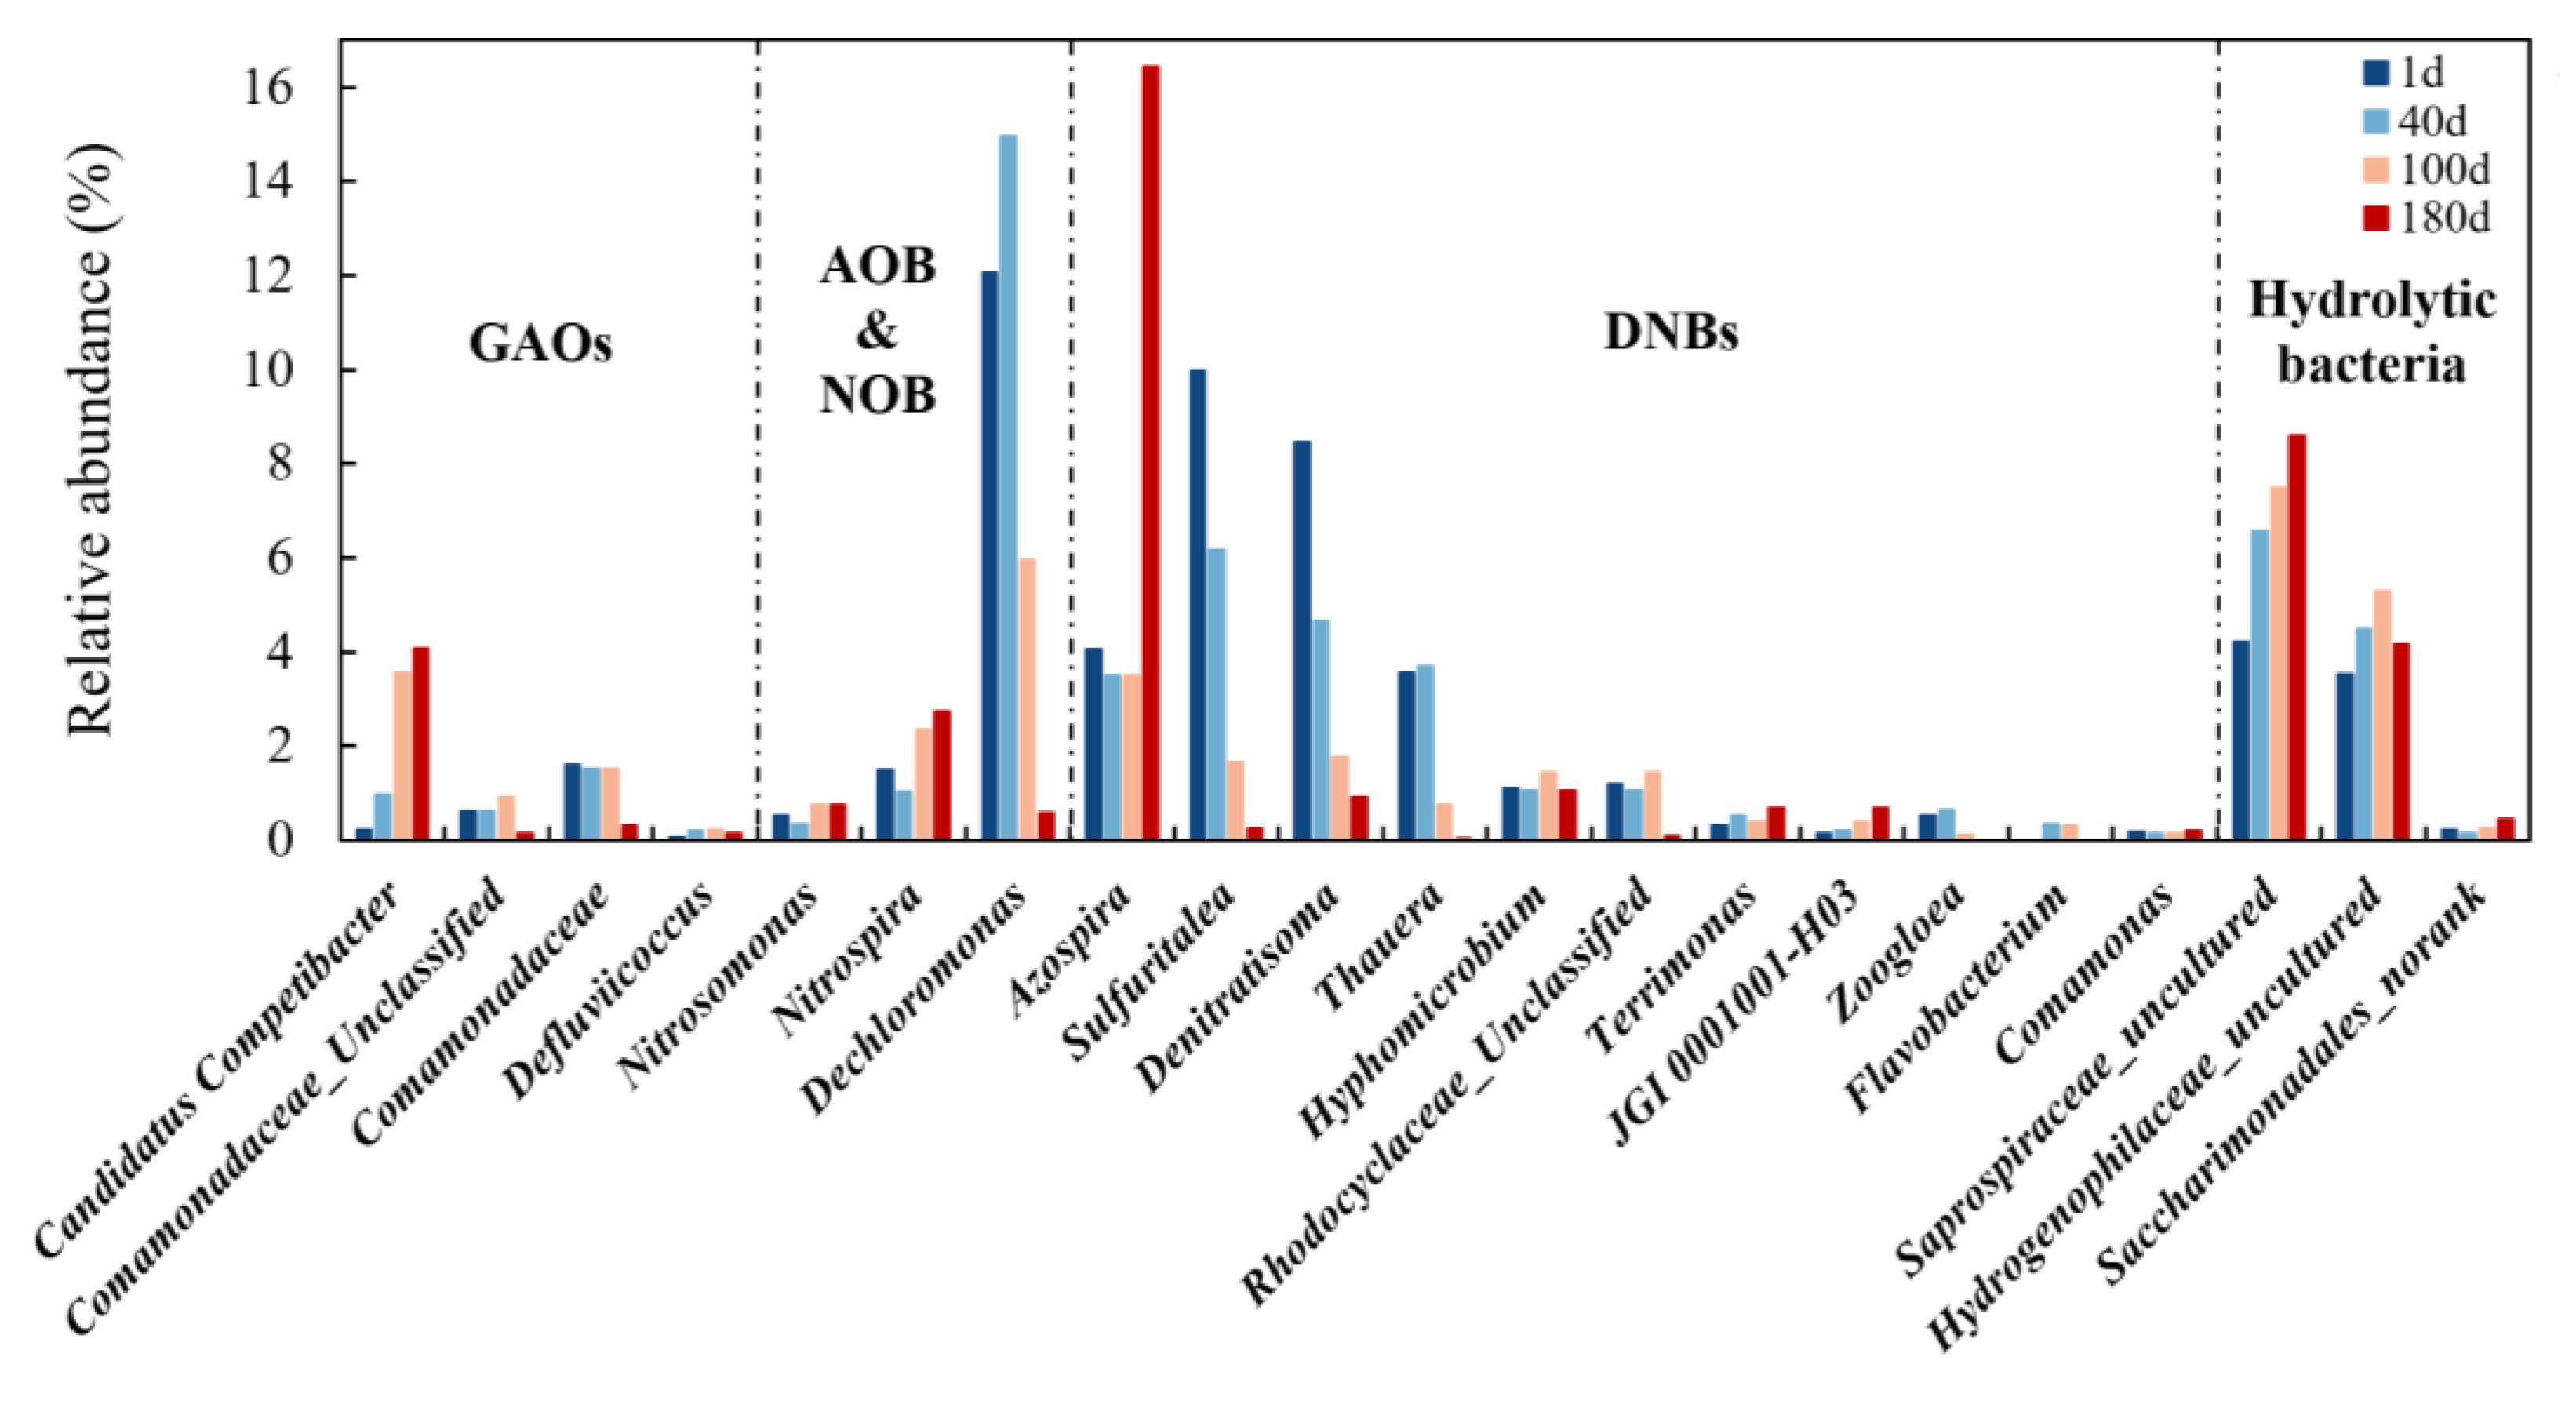
3.3.2. Dynamic Change of Functional Microorganism
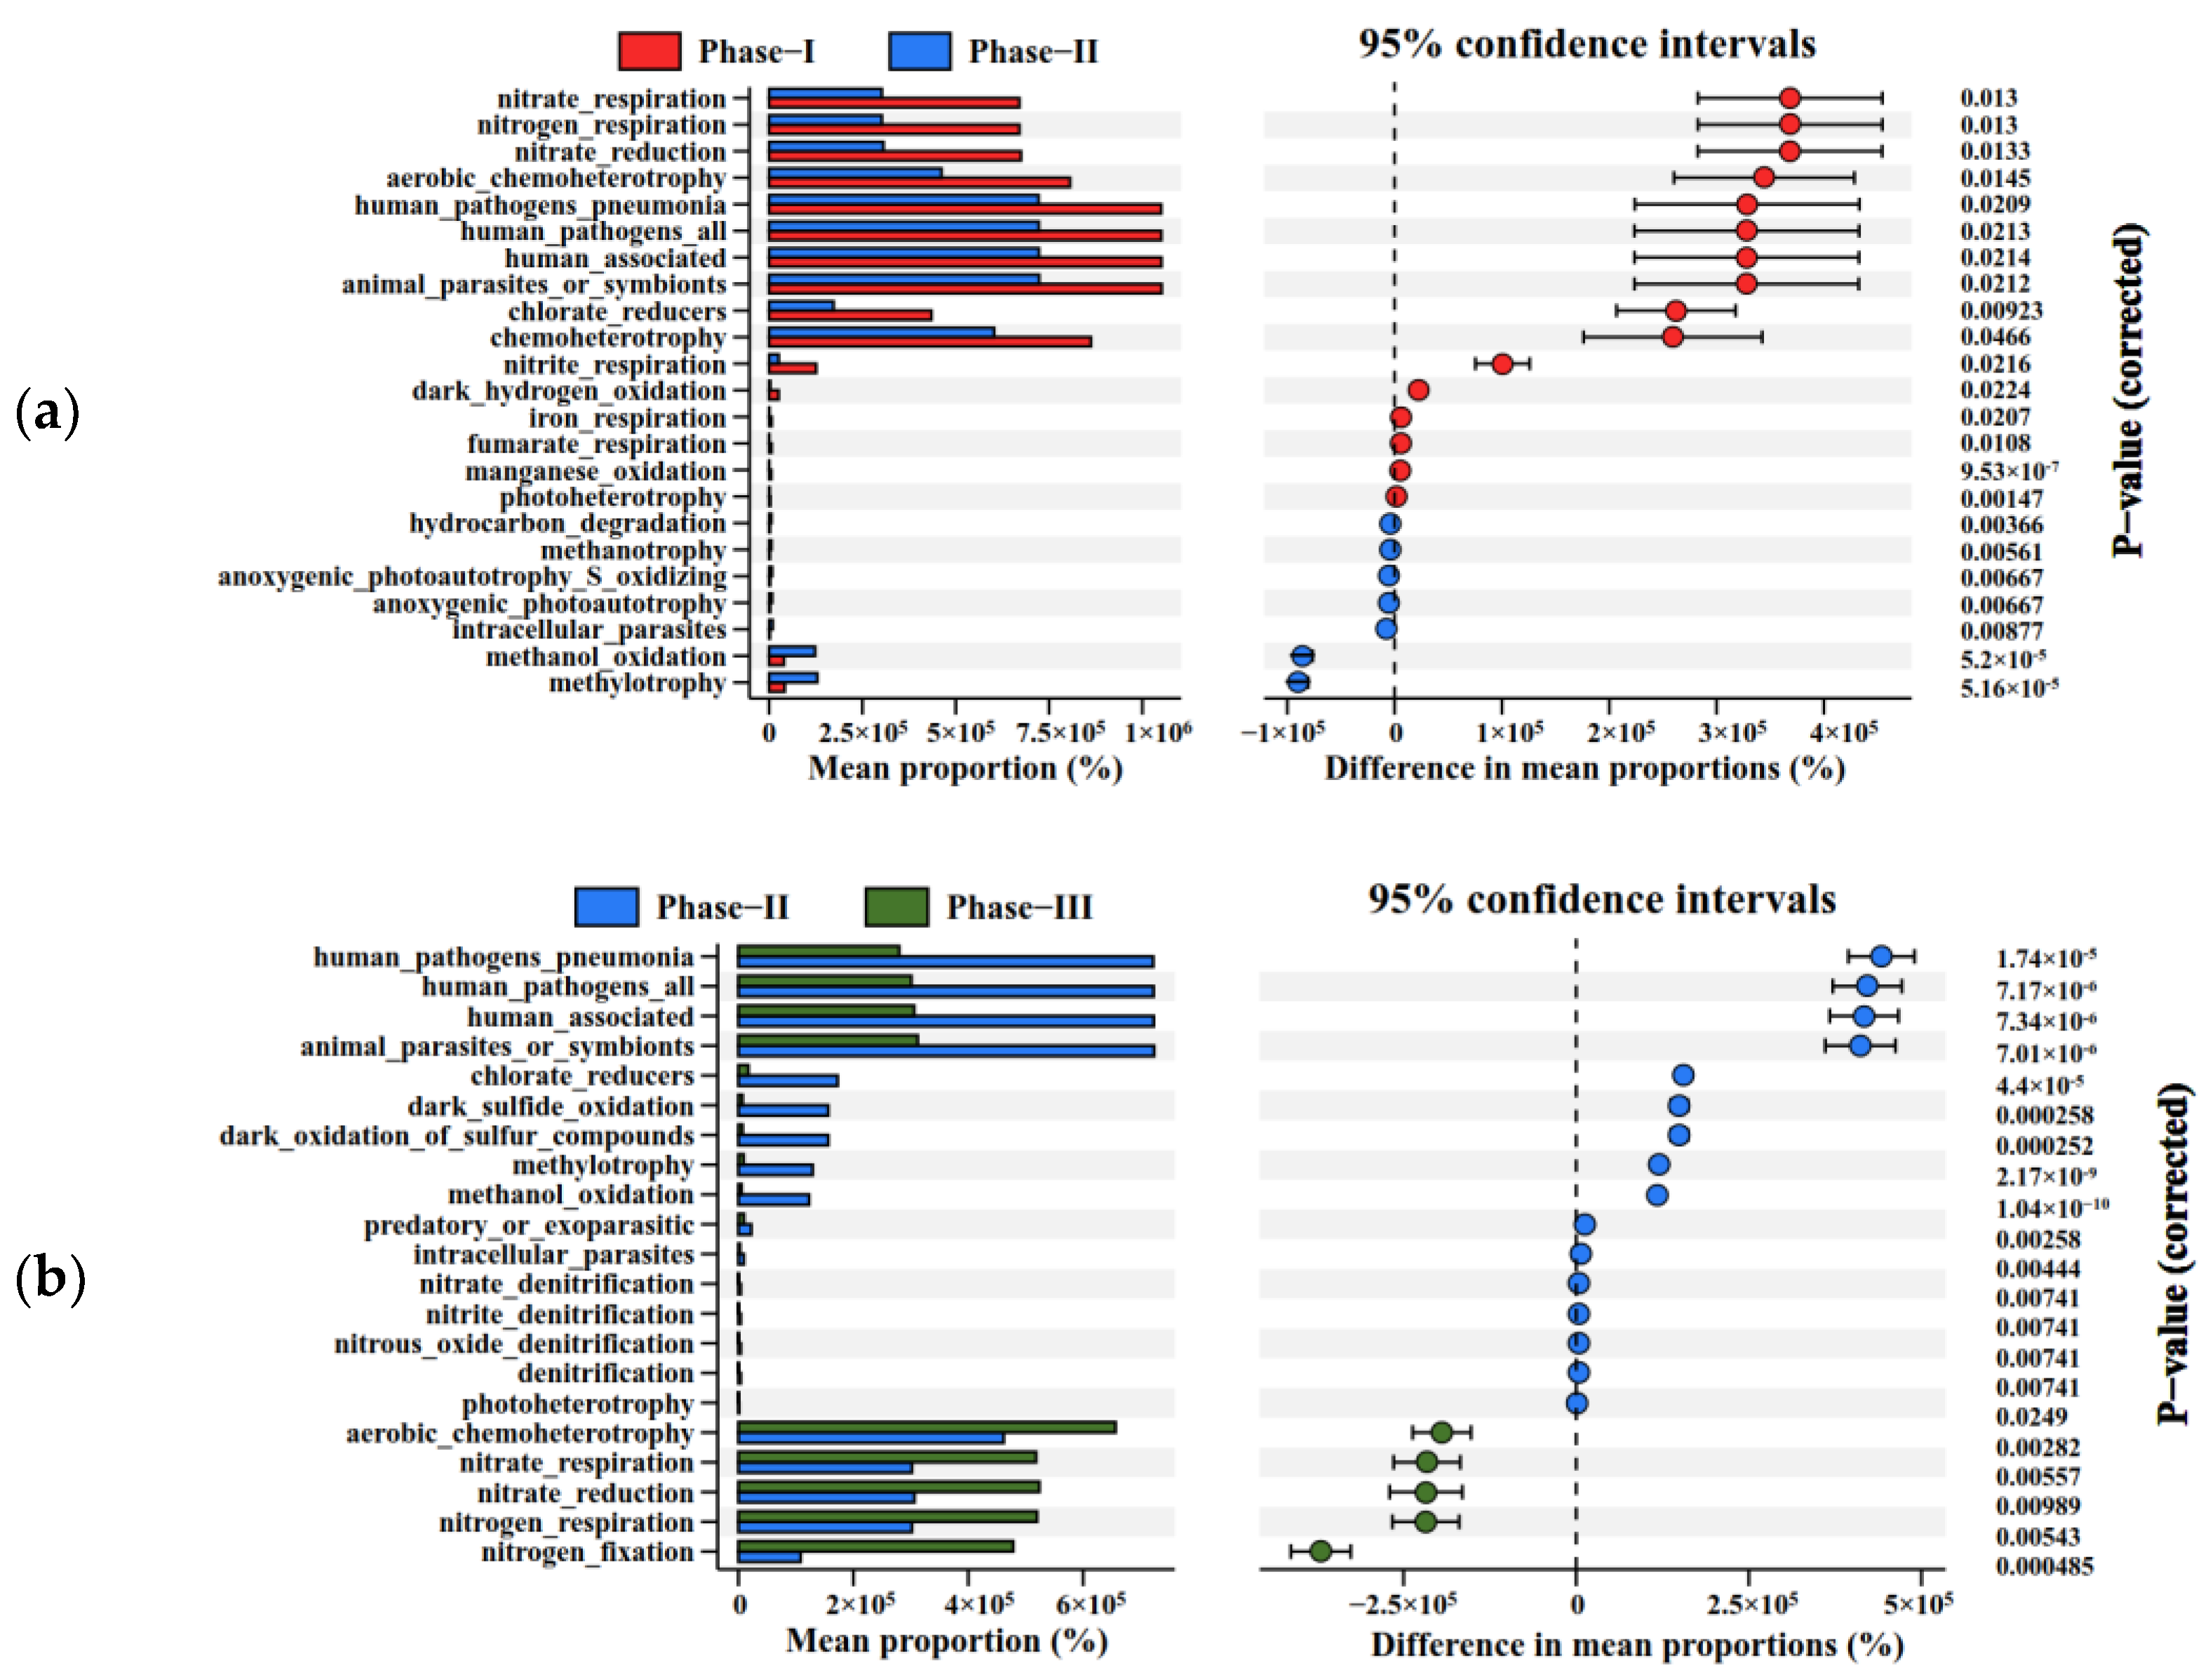
3.3.3. Significant Differences of Microbial Communities and Metabolic Functions
4. Conclusions
Author Contributions
Funding
Institutional Review Board Statement
Informed Consent Statement
Data Availability Statement
Conflicts of Interest
References
- Li, J.; Wang, Y.; Liu, J.; Peng, Y.; Zhang, L.; Lin, J. Intensified nitrogen removal by endogenous denitrification in a full-scale municipal wastewater treatment plant. Environ. Res. 2022, 205, 112564. [Google Scholar] [CrossRef]
- Zhou, S.; Zhang, Y.; Huang, T.; Liu, Y.; Fang, K.; Zhang, C. Microbial aerobic denitrification dominates nitrogen losses from reservoir ecosystem in the spring of Zhoucun reservoir. Sci. Total Environ. 2019, 651, 998–1010. [Google Scholar] [CrossRef]
- Wang, X.-H.; Wang, X.; Huppes, G.; Heijungs, R.; Ren, N.-Q. Environmental implications of increasingly stringent sewage discharge standards in municipal wastewater treatment plants: Case study of a cool area of China. J. Clean. Prod. 2015, 94, 278–283. [Google Scholar] [CrossRef]
- Carrera, J.; Vicent, T.; Lafuente, J. Effect of influent COD/N ratio on biological nitrogen removal (BNR) from high-strength ammonium industrial wastewater. Process Biochem. 2004, 39, 2035–2041. [Google Scholar] [CrossRef]
- Yan, F.; Peng, Y.; Wang, B.; Liu, B.; Li, X. A continuous plug-flow anaerobic/aerobic/anoxic/aerobic (AOAO) process treating low COD/TIN domestic sewage: Realization of partial nitrification and extremely advanced nitrogen removal. Sci. Total Environ. 2021, 771, 145387. [Google Scholar] [CrossRef]
- Huang, W.; Gong, B.; Wang, Y.; Lin, Z.; He, L.; Zhou, J.; He, Q. Metagenomic analysis reveals enhanced nutrients removal from low C/N municipal wastewater in a pilot-scale modified AAO system coupling electrolysis. Water Res. 2020, 173, 115530. [Google Scholar] [CrossRef]
- Yan, X.; Li, L.; Liu, J. Characteristics of greenhouse gas emission in three full-scale wastewater treatment processes. J. Environ. Sci. 2014, 26, 256–263. [Google Scholar] [CrossRef]
- Polruang, S.; Sirivithayapakorn, S.; Prateep Na Talang, R. A comparative life cycle assessment of municipal wastewater treatment plants in Thailand under variable power schemes and effluent management programs. J. Clean. Prod. 2018, 172, 635–648. [Google Scholar] [CrossRef]
- Zhang, Q.; Nakatani, J.; Wang, T.; Chai, C.; Moriguchi, Y. Hidden greenhouse gas emissions for water utilities in China’s cities. J. Clean. Prod. 2017, 162, 665–677. [Google Scholar] [CrossRef]
- Chu, H.; Liu, X.; Ma, J.; Li, T.; Fan, H.; Zhou, X.; Zhang, Y.; Li, E.; Zhang, X. Two-stage anoxic-oxic (A/O) system for the treatment of coking wastewater: Full-scale performance and microbial community analysis. Chem. Eng. J. 2021, 417, 129204. [Google Scholar] [CrossRef]
- Ding, S.; Bao, P.; Wang, B.; Zhang, Q.; Peng, Y. Long-term stable simultaneous partial nitrification, anammox and denitrification (SNAD) process treating real domestic sewage using suspended activated sludge. Chem. Eng. J. 2018, 339, 180–188. [Google Scholar] [CrossRef]
- Zubrowska-Sudol, M.; Walczak, J. Enhancing combined biological nitrogen and phosphorus removal from wastewater by applying mechanically disintegrated excess sludge. Water Res. 2015, 76, 10–18. [Google Scholar] [CrossRef]
- Huang, X.; Dong, W.; Wang, H.; Feng, Y.; Sun, F.; Zhou, T. Sludge alkaline fermentation enhanced anaerobic- multistage anaerobic/oxic (A-MAO) process to treat low C/N municipal wastewater: Nutrients removal and microbial metabolic characteristics. Bioresour. Technol. 2020, 302, 122583. [Google Scholar] [CrossRef]
- Hu, Z.; Zhang, J.; Li, S.; Xie, H.; Wang, J.; Zhang, T.; Li, Y.; Zhang, H. Effect of aeration rate on the emission of N2O in anoxic–aerobic sequencing batch reactors (A/O SBRs). J. Biosci. Bioeng. 2010, 109, 487–491. [Google Scholar] [CrossRef]
- Cui, J.; Glatzel, S.; Bruckman, V.J.; Wang, B.; Lai, D.Y.F. Long-term effects of biochar application on greenhouse gas production and microbial community in temperate forest soils under increasing temperature. Sci. Total Environ. 2021, 767, 145021. [Google Scholar] [CrossRef]
- Wang, H.; Chen, N.; Feng, C.; Deng, Y. Insights into heterotrophic denitrification diversity in wastewater treatment systems: Progress and future prospects based on different carbon sources. Sci. Total Environ. 2021, 780, 146521. [Google Scholar] [CrossRef]
- Huang, X.; Dong, W.; Wang, H.; Jiang, S. Biological nutrient removal and molecular biological characteristics in an anaerobic-multistage anaerobic/oxic (A-MAO) process to treat municipal wastewater. Bioresour. Technol. 2017, 241, 969–978. [Google Scholar] [CrossRef]
- Hu, Z.; Zhang, J.; Xie, H.; Li, S.; Zhang, T.; Wang, J. Identifying sources of nitrous oxide emission in anoxic/aerobic sequencing batch reactors (A/O SBRs) acclimated in different aeration rates. Enzym. Microb. Technol. 2011, 49, 237–245. [Google Scholar] [CrossRef]
- Itokawa, H.; Hanaki, K.; Matsuo, T. Nitrous oxide production in high-loading biological nitrogen removal process under low cod/n ratio condition. Water Res. 2001, 35, 657–664. [Google Scholar] [CrossRef]
- Beun, J.J.; Dircks, K.; Van Loosdrecht, M.C.M.; Heijnen, J.J. Poly-β-hydroxybutyrate metabolism in dynamically fed mixed microbial cultures. Water Res. 2002, 36, 1167–1180. [Google Scholar] [CrossRef]
- Wang, J.; Zhang, J.; Xie, H.; Qi, P.; Ren, Y.; Hu, Z. Methane emissions from a full-scale A/A/O wastewater treatment plant. Bioresour. Technol. 2011, 102, 5479–5485. [Google Scholar] [CrossRef]
- Daelman, M.R.J.; Van Voorthuizen, E.M.; Van Dongen, L.G.J.M.; Volcke, E.I.P.; Van Loosdrecht, M.C.M. Methane and nitrous oxide emissions from municipal wastewater treatment-results from a long-term study. Water Sci. Technol. 2013, 67, 2350–2355. [Google Scholar] [CrossRef]
- Lloyd, D.; Boddy, L.; Davies, K.J. Persistence of bacterial denitrification capacity under aerobic conditions: The rule rather than the exception. FEMS Microbiol. Lett. 1987, 1, 185–190. [Google Scholar] [CrossRef]
- Wang, Y.; Shen, L.; Wu, J.; Zhong, F.; Cheng, S. Step-feeding ratios affect nitrogen removal and related microbial communities in multi-stage vertical flow constructed wetlands. Sci. Total Environ. 2020, 721, 137689. [Google Scholar] [CrossRef]
- Zhou, T.; Liu, J.; Lie, Z.; Lai, D.Y.F. Effects of applying different carbon substrates on nutrient removal and greenhouse gas emissions by constructed wetlands treating carbon-depleted hydroponic wastewater. Bioresour. Technol. 2022, 357, 127312. [Google Scholar] [CrossRef]
- Karanasios, K.A.; Vasiliadou, I.A.; Pavlou, S.; Vayenas, D.V. Hydrogenotrophic denitrification of potable water: A review. J. Hazard. Mater. 2010, 180, 20–37. [Google Scholar] [CrossRef]
- Rani, S.; Koh, H.W.; Rhee, S.K.; Fujitani, H.; Park, S.J. Detection and Diversity of the Nitrite Oxidoreductase Alpha Subunit (nxrA) Gene of Nitrospina in Marine Sediments. Microb. Ecol. 2017, 73, 111–122. [Google Scholar] [CrossRef]
- Yao, Q.; Peng, D.-C. Nitrite oxidizing bacteria (NOB) dominating in nitrifying community in full-scale biological nutrient removal wastewater treatment plants. AMB Express 2017, 7, 25. [Google Scholar] [CrossRef]
- Chen, Y.; Zhao, Z.; Peng, Y.; Li, J.; Xiao, L.; Yang, L. Performance of a full-scale modified anaerobic/anoxic/oxic process: High-throughput sequence analysis of its microbial structures and their community functions. Bioresour. Technol. 2016, 220, 225–232. [Google Scholar] [CrossRef]
- Yang, Y.; Zhang, S.; Yang, A.; Li, J.; Zhang, L.; Peng, Y. Enhancing the nitrogen removal of anammox by treating municipal wastewater with sludge fermentation products in a continuous flow reactor. Bioresour. Technol. 2020, 310, 123468. [Google Scholar] [CrossRef]
- Du, R.; Peng, Y.; Cao, S.; Wang, S.; Wu, C. Advanced nitrogen removal from wastewater by combining anammox with partial denitrification. Bioresour. Technol. 2015, 179, 497–504. [Google Scholar] [CrossRef]
- Fan, Z.; Zeng, W.; Wang, B.; Guo, Y.; Meng, Q.; Peng, Y. Microbial community at transcription level in the synergy of GAOs and Candidatus Accumulibacter for saving carbon source in wastewater treatment. Bioresour. Technol. 2020, 297, 122454. [Google Scholar] [CrossRef]
- Weber, K.; Achenbach, L.A.; Coates, J.D.; Weber, K.A.; Achenbach, L.A.; Coates, J.D. Microbes pumping iron: Anaerobic microbial iron oxidation and reduction. Nat. Rev. Microbiol. 2006, 4, 752–764. [Google Scholar] [CrossRef]
- Park, H.J.; Kwon, J.H.; Yun, J.; Cho, K.S. Characterization of nitrous oxide reduction by Azospira sp. HJ23 isolated from advanced wastewater treatment sludge. J. Environ. Sci. Health Part A 2020, 55, 1459–1467. [Google Scholar] [CrossRef]
- Rubio-Rincón, F.J.; Lopez-Vazquez, C.M.; Welles, L.; van Loosdrecht, M.C.M.; Brdjanovic, D. Cooperation between Candidatus Competibacter and Candidatus Accumulibacter clade I, in denitrification and phosphate removal processes. Water Res. 2017, 120, 156–164. [Google Scholar] [CrossRef]
- Liberti, L.; Lopez, A.; Notarnicola, M.; Barnea, N.; Pedahzur, R.; Fattal, B. Comparison of advanced disinfecting methods for municipal wastewater reuse in agriculture. Water Sci. Technol. 2000, 42, 215–220. [Google Scholar] [CrossRef]
- Jiao, Y.N.; Zhou, Z.C.; Chen, T.; Wei, Y.Y.; Zheng, J.; Gao, R.X.; Chen, H. Biomarkers of antibiotic resistance genes during seasonal changes in wastewater treatment systems. Environ. Pollut. 2018, 234, 79–87. [Google Scholar] [CrossRef]
- Anh, H.; Nguyen, S.O. Effect of antibiotic cocktail exposure on functional disturbance of nitrifying microbiome. J. Hazard. Mater. 2023, 455, 131571. [Google Scholar] [CrossRef]


| Parameter | Range | Average |
|---|---|---|
| COD (mg/L) | 168–217 | 191.8 |
| NH4+-N (mg/L) | 34.6–48.7 | 41.5 |
| NO3−-N (mg/L) | 0–4.2 | 0.6 |
| TN (mg/L) | 35.7–58 | 46.6 |
| pH | 6.7–8.3 | 7.2 |
| T/℃ | 11–25 | 17 |
Disclaimer/Publisher’s Note: The statements, opinions and data contained in all publications are solely those of the individual author(s) and contributor(s) and not of MDPI and/or the editor(s). MDPI and/or the editor(s) disclaim responsibility for any injury to people or property resulting from any ideas, methods, instructions or products referred to in the content. |
© 2024 by the authors. Licensee MDPI, Basel, Switzerland. This article is an open access article distributed under the terms and conditions of the Creative Commons Attribution (CC BY) license (https://creativecommons.org/licenses/by/4.0/).
Share and Cite
Xie, Y.; Zhang, W.; Jiang, J.; Li, Y.; Tong, L.; Yang, G. A Continuous Plug-Flow Anaerobic-Multistage Anoxic/Aerobic Process Treating Low-C/N Domestic Sewage: Nutrient Removal, Greenhouse Gas Emissions, and Microbial Community Analysis. Sustainability 2024, 16, 3993. https://doi.org/10.3390/su16103993
Xie Y, Zhang W, Jiang J, Li Y, Tong L, Yang G. A Continuous Plug-Flow Anaerobic-Multistage Anoxic/Aerobic Process Treating Low-C/N Domestic Sewage: Nutrient Removal, Greenhouse Gas Emissions, and Microbial Community Analysis. Sustainability. 2024; 16(10):3993. https://doi.org/10.3390/su16103993
Chicago/Turabian StyleXie, Yuting, Wenlong Zhang, Jie Jiang, Yi Li, Linlin Tong, and Guangyu Yang. 2024. "A Continuous Plug-Flow Anaerobic-Multistage Anoxic/Aerobic Process Treating Low-C/N Domestic Sewage: Nutrient Removal, Greenhouse Gas Emissions, and Microbial Community Analysis" Sustainability 16, no. 10: 3993. https://doi.org/10.3390/su16103993