
Can Digital Economy Development Facilitate Corporate ESG Performance?


1
College of Computer and Information Science, Qinghai University of Science and Technology, Xining 810016, China
2
Department of Computer Technology and Applications, Qinghai University, Xining 810016, China
3
School of Marxism, Beijing Normal University, Beijing 100875, China
4
NUS Business School & The Logistics Institute-Asia Pacific, National University of Singapore, Singapore 119613, Singapore
5
School of Economics and Business Administration, Central China Normal University, Wuhan 430079, China
*
Author to whom correspondence should be addressed.
Sustainability 2024, 16(10), 3956; https://doi.org/10.3390/su16103956
Submission received: 20 February 2024
/
Revised: 24 March 2024
/
Accepted: 7 May 2024
/
Published: 9 May 2024
Abstract
:As ESG (environmental, social, and corporate governance) is consistent with the spirit of sustainable development, it is useful to elevate ESG performance to realize the sustainable development of enterprise and society. Using the data of Chinese A-share listed firms in the period of 2011 to 2019, this paper takes the National Big Data Comprehensive Pilot Zone policy as a quasi-natural experiment and uses the difference-in-differences method to assess the effect of digital economy development on ESG performance. This paper reveals the following: (1) the digital economy can facilitate ESG performance; (2) digitalization of the economy helps enterprises to propel digital transformation, which in turn lifts ESG performance; (3) digital economy development has a deeper impact on private enterprises, especially for those in China’s capital cities; and (4) digital economy development moderates the inhibiting effect of ESG performance on corporate financial constraints. The findings of this paper indicate that digitalization of the economy can help to achieve sustainable development.
1. Introduction
ESG is a keenly discussed topic, with global warming, climate change, and extreme weather receiving their fair share of attention worldwide. Likewise, the concept of sustainable development, which coordinates economic development and environmental protection, has also received much discussion. Following the adoption of the United Nations’ Sustainable Development Goals, China put forth a slew of environment-related regulations to support sustainable development. These regulations can be classified into four strands: laws and regulations [1], market incentives [2], enforcement [3,4], and public participation [5,6]. However, due to the implementation challenges imposed by time and location, these policies could not translate into the promotion of sustainable development.
Social inclusion and economic growth are key drivers in promoting sustainable development [7]. The notion of sustainable development aligns with the ethos of ESG. Today, corporate stakeholders emphasize ESG performance, taking the latter as a core standard for measuring an enterprise’s capacity for sustainable development. ESG performance not only contributes to the sustainable development of enterprises and society, but also impacts firm performance. In this regard, studies suggest that firms with better ESG ratings will have lower financing constraints [8,9], lower firm risk [10], and, consequently, greater enterprises value [11]. Thus, improving ESG performance is imperative.
The digital economy is another widely discussed topic. For instance, the 2016 G20 Hangzhou Summit advocated the G20 Digital Economy Development and Cooperation Initiative. This is the first digital economy policy document that was endorsed by the G20 leaders, making the digital economy a key topic and an important consideration for global economic and trade cooperation. In the case of China, digital economy development has made good progress. According to the China Digital Economy Development Report (2022), the mean annual growth rate of China’s digital economy has reached 15.9% since 2012, which is much higher than the average growth rate of GDP for the same period. In 2021, China’s digital economy was valued at CNY 45.5 trillion, accounting for 39.8% of China’s GDP. At the same time, the scales of digital industrialization and industrial digitization were CNY 8.35 and 37.18 trillion, respectively, accounting for 7.3% and 32.5% of the nation’s GDP, respectively. Thus, the digital economy has become a pillar of economic growth for China. More importantly, as a new market structure, the digital economy has created conditions for narrowing the development gap in China and other nations.
The literature has explored the effects of digital economy development. At the macro level, the digital economy promotes economic development [12,13] and total factor productivity [14] and increases the income of non-city dwellers [15], but will exaggerate the uncertainty in job markets and income inequality [16] and reduce the employment share of low-skilled workers [17]. At the micro level, the digital economy promotes corporate innovation [18], facilitates business investment efficiency [19], and reduces financing challenges [20]. According to the research examining the relationship between the digital economy and sustainable development, the digital economy helps to reduce carbon emission intensity [21] and promote energy transition [22], as well as to promote green innovation in enterprises [23]; these factors can contribute to sustainable development. However, some studies draw different conclusions; for example, Bano et al. [24] find that the digital economy can impact renewable energy consumption negatively, and Shvakov and Petrova [25] even suggest an inhibiting effect of the digital economy on the green economy. Therefore, the question is whether the digital economy can promote corporate ESG performance. What is the mechanism behind this impact? Will this effect differ according to enterprise characteristics? As listed firms are key to economic growth, their ESG performance should contribute to the sustainable development of society; answering these questions can help increase enterprises’ long-term value, promote the coordination of economic performance and social responsibility, and boost sustainable development.
Drawing on the data of Chinese listed companies from 2011 to 2019, this paper takes the National Big Data Comprehensive Pilot Zone (NBDCPZ) policy as a quasi-natural experiment and employs the difference-in-differences (DID) method to explore the relationship between digital economy development and ESG performance. Our paper makes three contributions. The literature investigates the impact of the digital economy on sustainable development, focusing mainly on its effect on environment protection [21,22,23]; as ESG refers to enterprise performance in terms of environment protection, social inclusion, and corporate governance, it can be used to evaluate enterprises’ sustainable development ability more comprehensively. However, few studies explore the relationship between the digital economy and ESG performance; this paper expands on related research on sustainable development and provides valuable research insights. Some studies have directly examined the relationship between the digital economy and ESG; for example, Zhai et al. [26] find that the digital economy promotes ESG performance by encouraging innovation, improving corporate governance, and reducing information asymmetry. Zhou and Liu [27] suggest that the digital economy can promote energy efficiency, which can then facilitate ESG performance. Asif et al. [28] also find a positive impact of the digital economy on ESG. In addition to these mechanisms, this paper finds another avenue by which the digital economy facilitates ESG performance. Also, this paper analyzes the moderating role of the digital economy on the effect of ESG performance on financing constraints, which attests the importance of digital economy development. This paper also takes greenwashing behavior into consideration to augment the robustness of the findings.
2. Research Hypotheses
The traditional goal of enterprises is to maximize profit. Neoclassical theory indicates that ESG cannot increase the economic performance of enterprises, and, as ESG practices have strong externalities, it will even hinder the achievement of the profit maximization goal [29]. However, stakeholder theory suggests that ESG gradually shifts enterprises’ goal from maximizing profit to coordinating economic value and social value, which can better balance the interests of owners, managers, employees, suppliers, and consumers; moreover, if companies can gain more trust in uncertain environments, their long-term value will be enhanced. Also, according to signaling theory, enterprises with better ESG performance convey information concerning the fulfilment of social responsibilities to the public, meaning they can shape reliable corporate images and obtain more trust from the public, which can also contribute to their long-term value.
Nowadays, enterprises are not incentivized to promote their ESG performance on their own [30]. Indeed, improving ESG performance requires financial inputs, so implementing an ESG strategy can conflict with the profit maximization goal, which will impede ESG development. At the same time, there is information asymmetry between enterprises and investors. Lessening information asymmetry is needed to make the ESG rating of enterprises more acceptable. The disclosure of ESG information requires management inputs, and enterprises may be reluctant to disclose such information; nevertheless, third-party rating agencies need such information to measure ESG performance, which will hinder ESG development.
Digital economy is an economic development model based on the development and large-scale application of emerging digital technologies. Embedding these digital technologies into the manufacturing process can lift the efficiency of resource allocation, reducing production costs. Also, the use of digital technologies can alter the organizational structure of enterprises [31], making it flatter, affording more efficient information flow within the enterprise, which can improve management efficiency and reduce management costs. Finally, the digital economy transforms how information is diffused, leveraging big data and good internet connectivity to expedite access to corporate information, effectively reducing the extent of information asymmetry. Therefore, enterprises will be motivated to improve their ESG performance, as the digital economy can lower costs of production.
At the core of digital economy development is digital transformation. The digital economy has characteristics which hasten the exchange of information and digital technology. Enterprises can benefit from digital transformation to realize digital empowerment and improve the allocative efficiency of data. Such enterprises are more likely to transform digitally when operating at a high level of digital economy development. Digital talent, as identified by Nair [32], is a critical element when measuring the level of digital economy development. Regions where the digital economy development level is higher will possess more digital talent, and enterprises can benefit by exploiting these resources to achieve the needed digital transformation. Already, studies suggest that digital transformation assists in CO2 emissions reductions in enterprises [33,34], lifting ESG performance. Digital transformation can also enhance green total factor productivity [35] and promote green innovation in enterprises [36], aiding economic development and environmental protection and indirectly lifting ESG performance.
Therefore, this paper posits the following hypotheses:
H1.
Digital economy development promotes ESG performance.
H2.
Digital economy development enhances enterprise digital transformation, which in turn improves ESG performance.
3. Materials and Methods
3.1. Sample Selection and Data Source
As the NBDCPZ policy was first launched in Guizhou in 2015 and then in other cities in 2016, this paper selects Chinese A-share listed companies in the period from 2011 to 2019 as the initial research sample, so as to include 4 years before and 3 years after the policy as the research period to assess the impact of the policy on ESG performance. Recognizing the severity of the impact of the COVID-19 pandemic on business, this paper excludes the year 2020 and beyond from the research frame. Next, the initial research sample is refined as follows: (1) exclude ST and PT trading status companies; (2) exclude firms with missing data; (3) winsorize all continuous variables at the 1st and 99th percentile. The final research sample contains 7084 firm-year observations.
Regarding the data source, this paper collected information on the NBDCPZ policy from the website of The State Council of China. ESG data were elicited from Bloomberg’s ESG database. The data on firm and city characteristics were extracted from the CSMAR database and the China City Statistical Yearbook. The missing values of the city characteristics were substituted using interpolation.
3.2. Empirical Model and Variables
This paper adopts the NBDCPZ policy as a quasi-natural experiment to explore the effect of digital economy development on ESG performance. As the DID method introduces a policy dummy variable to classify cities into experimental cities and control cities and introduces a year dummy variable to divide the research period into the years before and after the policy, it is commonly used to estimate the net impact of policy. Therefore, we apply the DID method on the empirical model as shown:
where the subscripts i, t, k, and j denote the firm, year, city, and industry, respectively.
The dependent variable, ESGi,t, refers to Bloomberg’s ESG score of firm i in year t, which ranges from 0 to 100. A high ESG score indicates better ESG performance. The independent variable, Treatk × Postt, indicates whether city k implemented the NBDCPZ policy in year t. If the city implemented the policy in year t, then Treatk × Postt equals 1; otherwise, it equals 0. Specifically, Treatk denotes whether city k implemented the NBDCPZ policy during the research period. If city k implemented the policy during the research period, then Treatk equals 1; otherwise, it equals 0. Likewise, Postt,k denotes whether year t is after the launch year of the NBDCPZ policy in city k. If the year is after the launch year in the city, then Postt,k equals 1; otherwise, it equals 0. Variable X′ denotes control variables at the firm and city levels. The firm-level control variables include the leverage (Lev. total liabilities/total assets), firm size (Size. Ln (total assets)), return on assets (Roa. net profit/total assets), Tobin’s q (Tobin. company market value/replacement cost of assets), operating cash flow (Cash. operating cash flow/total assets), shareholding concentration (Concen. shareholding ratio of the biggest shareholder), ratio of independent directors (Top. number of independent directors/size of board), company age (Lnage. Ln(age of company + 1)), and book-to-market ratio (Bmr. company book value/company market value). The city-level control variables include the GDP (Degdp. This paper uses the CPI to deflate the nominal GDP and then take the natural logarithm), GDP per capita (Deavegdp. This paper uses CPI to deflate the nominal GDP per capita and then take the natural logarithm), degree of government intervention (Intervene. local finance budget expenditure/GDP), and industry structure (Structure. added value of the tertiary industry/GDP). The terms δi and μj,t represent the firm’s fixed effect and industry-year fixed effect, respectively; εi,t is the random error term. Table 1 shows the descriptive statistics of the main variables found in Model (1).
4. Results
4.1. Benchmark Regression
Table 2 contains the output of the baseline regression. The columns represent the results under different sets of controls. Column (1) shows the results of the base model with no controls. Column (2) includes the control variables built on Column (1). Compared to Columns (1) and (2), Columns (3) and (4) include the firm fixed effect and year fixed effect, respectively, to control for individual and yearly variances. These two columns also cluster the standard errors at the city level. Our preferred specification and benchmark regression results are shown in Column (5), which contains the industry year fixed effect instead of the year fixed effect to capture the time-variant factors at the industry level. The coefficients of Treat × Post for all columns in Table 2 are positively significant, implying that the NBDCPZ policy promotes ESG performance, i.e., Hypothesis H1 is supported.
4.2. Robustness Check
4.2.1. Test for Parallel Trends
The parallel trends assumption is essential when applying the DID approach. In order to test the parallel trend assumption and identify the dynamic effect of the NBDCPZ policy on ESG performance, this paper follows Jacobson et al. [37] and adopts an event study method. The empirical model is as follows:
In Model (2), τ identifies the time when the NBDCPZ policy was launched, and τ ∈ [−5,3]. τ = 0 refers to the starting year of the NBDCPZ policy, τ = 1 denotes a year after this policy, and τ = −1 denotes one year before this policy. Our paper treats τ = −1 as the comparison group, so βτ indicates the ESG performance gap compared to a year before the policy launch.
Figure 1 shows the results of the event study. Before the launch of the NBDCPZ policy, the coefficients of βτ were statistically insignificant, which supports the parallel trend assumption. After the policy launch, the coefficients of βτ were positively significant, which suggests a positive impact of the NBDCPZ policy on ESG performance. Also, the coefficients of βτ had an increasing trend after the policy in spite of a slight decrease in τ = 3, indicating that the promotion effect of this policy became more transparent over time.
- Notes: Based on the event study method, this paper plots the coefficients and 95% confidence interval of Model (2) in Figure 1.
4.2.2. Goodman–Bacon Decomposition
Baker et al. [38] point out that the estimator in the staggered DID method can be biased when controlling for two-way fixed effects (TWFEs). The staggered DID estimator is the weighted average of four DID estimators, and these estimators have treatment effect heterogeneity, which can cause the bad treatment group problem or even the negative weights problem. Following Goodman–Bacon [39], we decomposed the staggered DID estimator into four DID estimators to identify the weights and coefficients; the results are displayed in Figure 2. The total weight of the bad treatment group, including “Later Treatment vs. Earlier Comparison” and “Treatment vs. Already Treated”, is 5.6%, which does not significantly impact our findings. Although the coefficient of “Earlier Treatment vs. Later Comparison” is negative, its weight is 0.3%, which also does not significantly impact the findings. Therefore, the results of Goodman–Bacon decomposition indicate the robustness of the baseline results.
- Notes: There are four comparison types, including “Earlier Treatment vs. Later Comparison”, “Later Treatment vs. Earlier Comparison”, “Treatment vs. Never Treated” and “Treatment vs. Already Treated”. The weights are 0.3%, 0.3%, 94.1%, and 5.3%, respectively. The coefficients are −1.937, −0.165, 0.669, and 3.275, respectively.
4.2.3. Instrument Variable Method
To mitigate the endogeneity issue, we applied the instrument variable method and used the number of post offices in 1984 as the instrument variable. An effective instrument variable should meet both relevance and exogeneity requirements. The local telecommunications infrastructure in the past can form the basis for digital economy development, satisfying the relevance requirement. As for the exogeneity requirement, the number of post offices in 1984 belongs to historical data, which cannot be correlated with ESG performance. As the number of post offices in 1984 is constant with time, we constructed the interaction term between Post and the number of post offices in 1984 as the instrument variable for Treat × Post. The results can be found in Column (1) of Table 3. The Kleibergen–Paap rk Wald F statistic exceeds 16.38, which is the critical value at the 10% significance level [40], suggesting that there is no issue with weak instruments. The coefficient of Treat × Post is significant, which is consistent with the baseline results.
4.2.4. Controlling for Lag Effect of Policy
As the NBDCPZ policy was first launched in Guizhou in September 2015 and then in the other cities in October 2016, all in the last quarter of the year, the impact of the NBDCPZ policy on ESG performance was only felt a year later. Therefore, to control for the lag effect of the policy, we put the dependent variable ESG one period ahead and then conducted the baseline regression using Model (1). The results are shown in Column 2 of Table 3. The coefficient of Treat × Post is positively significant, attesting to the robustness of the baseline results.
4.2.5. DID Based on Propensity Score Matching (PSM-DID)
As the characteristics of the cities implementing the NBDCPZ policy and those that did not were variable, the baseline results may be biased. Therefore, we used the propensity score matching (PSM) method to identify and match similar control cities for each city implementing the NBDCPZ policy. Specifically, we employed the radius matching approach and used city-level characteristics, including Degdp, Deavegdp, Intervene, and Structure, as covariates. The results can be found in Column (3) of Table 3. Here, the coefficient of Treat × Post is positively significant, indicating the promotional effect of the NBDCPZ policy on ESG performance, which concurs with the baseline results.
4.2.6. Changing Dependent Variable
Next, we changed the dependent variable and used the Huazheng ESG rating to measure ESG performance in order to check for the robustness of the baseline results. As the Huazheng ESG rating has nine classes, ranging from AAA to C, this paper assigns a score of 1 to 9 to these rating classes. As the Huazheng ESG rating is published quarterly, we take the median of the ESG rating in one year to measure ESG performance to avoid the influence of extreme values. The results can be found in Column (4) of Table 3. The coefficient of Treat × Post is positively significant, indicating the robustness of the baseline results.
4.2.7. Changing Independent Variable
To check on the robustness of the baseline results, we changed the independent variables and constructed an evaluation index system to measure the regional digital economy development level. Following Tu et al. [41], this paper further includes a digital economy innovation ability dimension in the evaluation index system; as the digital economy is formed with the development and application of digital technologies, innovation ability is important when measuring the digital economy development level. Table 4 shows the digital economy development evaluation index system.
After constructing the evaluation index system, we needed to assign weights to the indicators. There are two main weighting methods: subjective weighting and objective weighting. The subjective weighting method weights the indicators according to human judgment and the relative importance of the indicators. The objective weighting method assigns weights to the indicators based on the intrinsic information of the original data. As the subjective weighting method can incur human errors when assigning weights, we used the entropy method, a form of objective weighting method, to assign the weights, as shown in Table 4.
Using the digital economy development evaluation index system and the entropy method, we obtain the digital economy development index (DEDI) to replace the independent variable. The results can be found in Column (5) of Table 3. The coefficient of DEDI is positively significant, i.e., regional digital economy development lifts ESG performance.
4.3. Placebo Tests
The baseline results and event study results suggest that the NBDCPZ policy facilitates ESG performance. Therefore, to validate this finding, we conducted placebo tests on the implementing year level and implementing city level.
4.3.1. Placebo Test at the Implementing Year Level
We assumed that the NBDCPZ policy occurred 1–4 years prior, as shown by Model (1), which includes Pren × Treat. Therefore, to conduct the placebo test at the implementing year level, we set n = [1,4]. Pren equals 1 if the year is between the beginning year of the policy and n years before the beginning year; otherwise, it equals 0. If the coefficient of Pren × Treat is insignificant, then it is safe to assume that there is no early response to the NBDCPZ policy and that other national-level policies launched before the start year of the policy do not overlap. Otherwise, the validity of baseline results is in question. Table 5 contains the results. The coefficients of Pren × Treat in all the columns are insignificant, while the coefficients of Treat × Post in all columns are significant, which satisfies the placebo test.
4.3.2. Placebo Test at the Implementing City Level
Following Chetty et al. [42], we randomly selected and included cities in the NBDCPZ (six cities in 2015 and 51 cities in 2016, as stated in the original document). These city points were then matched to the firm and city characteristics data. We performed the baseline regression using Model (1) for the placebo test at the implementing city level. The random selection process was repeated 500 times. If these coefficients are significantly different from the baseline results, then it implies that there is no disturbance from other policies implemented in the same period as the NBDCPZ policy. If not, the validity of the baseline results is in doubt. Figure 3 shows the kernel density curve of the coefficients found by repeating the random selection process 500 times and the scatterplot of their corresponding p-values. Despite four coefficients being greater than 0.99, which is the baseline result, the coefficients are in the interval [−1.40, 0.99]. The coefficients are mostly Gaussian with a mean of 0, and p > 0.1. Thus, the results satisfy the placebo test.
4.4. Mechanism
The previous analysis found that regional digital economy development promotes ESG performance. This section discusses the mechanism by which regional digital economy development affects the ESG performance of enterprises. We use enterprise digital transformation as the mediating variable to study how digital economy development affects ESG performance.
Following Wu and Lu [43], we applied content analysis to measure corporate digital transformation. Specifically, we firstly constructed a word bank related to enterprise digital transformation, including terms such as “Big Data”, “Cloud Computing” and “E-commerce”, and then searched these terms from the Management Discussion and Analysis (MD&A) section in the annual reports of listed companies. We used the logarithm of the sum of word frequency and 1 as a proxy for the digital transformation degree. The annual reports of the listed companies are from the Wind database. The results are shown in Column (1) of Table 6. The coefficient of Treat × Post is significantly positive, implying that digital economy development promotes enterprise digital transformation, which can then facilitate ESG performance. Thus, Hypothesis H2 is supported.
Due to the difficulty in measuring the digital transformation degree, we followed Li and Zhao [44] and used the proportion of digital transformation intangible assets in the total intangible assets as another proxy for the digital transformation degree. In short, if the details of intangible assets include keywords related to digital transformation, such as “Software”, “Internet”, and “Management Systems”, then the intangible assets are classified as digital transformation intangible assets. The results are shown in Column (2) of Table 6. The coefficient of Treat × Post is significantly positive, which affirms the mediating role of digital transformation in the digital economy on ESG performance.
4.5. Heterogeneity Analysis
4.5.1. Heterogeneity of Enterprise Ownership
To test the heterogeneity of enterprise ownership, we divided the enterprises found in the research sample into state-owned and private sector businesses. We then applied regression on the sub-samples. The outputs are shown in Columns (3) and (4) of Table 6. Our findings show that regional digital economy development facilitates the ESG performance of private enterprises, but its impact on the ESG performance of state-owned enterprises is insignificant. A plausible explanation is that state-owned enterprises are generally large, with complex governance structures, and their decision-making processes are also a black box. Consequently, determining whether to implement an ESG strategy cannot only depend on regional digital economy development. Unlike private sector enterprises, state-owned enterprises can be shielded from market competition. Thus, they lack internal motivation to lift their ESG performance if they do not see the need to highlight an environmentally friendly and socially responsible image. However, private enterprises face stiffer competition. Therefore, they need to differentiate themselves by improving their ESG performance.
4.5.2. Heterogeneity of City Hierarchy
To test the heterogeneity of city hierarchy, we divided the research sample into enterprises located in capital cities and enterprises located in non-capital cities. We then applied regression on the sub-sample. As the city of Shenzhen is a special economic zone, this paper includes Shenzhen under capital cities. The results can be found in Columns (5) and (6) of Table 6. Our findings show that regional digital economy development can effectively promote the ESG performance of enterprises in capital cities, but its impact on the ESG performance of enterprises in non-capital cities is insignificant. One explanation for this is that Chinese government policies lean towards capital cities, and enterprises located in the capital cities are more likely to benefit from the digital economy development policy. Also, the resource endowments in non-capital cities are relatively backward, and enterprises there require more resource input when implementing their ESG strategies. Thus, though some non-capital cities are included in the NBDCPZ, the ESG performance of enterprises in these cities did not improve significantly.
4.6. Other Analysis
4.6.1. Moderating Effect of Digital Economy Development
As the literature suggests that ESG performance can effectively lessen corporate financial challenges [8,9], we looked at the moderating role of digital economy development in ESG performance on corporate financial constraints, using the following empirical model:
In Model (3), the dependent variable FC refers to corporate financial constraints. The other variables and controls are the same as Model (1). As the Kaplan–Zingales (KZ) index and the Whited–Wu (WW) index contain many endogenous variables related to finance, such as cash flow and leverage, we follow Hadlock and Pierce [45] and use the Scale–Age (SA) index as an indicator of corporate financial constraints to address endogeneity issues. The results are shown in Column (1) of Table 7. The coefficient of ESG × Treat × Post is positively significant, indicating that the NBDCPZ policy reinforces the inhibiting effect of ESG performance on corporate financial constraints. Also, replacing Treat × Post with DEDI, as shown in Column (2) of Table 7, the change is insignificant.
4.6.2. Effect of Greenwashing
Without a doubt, enterprises can greenwash their ESG performance to shape environmentally friendly and socially responsible images, differentiating themselves from competition [46]. However, the greenwashing behavior can complicate the impact of digital economy development on ESG performance. Therefore, we followed Yu et al. [47] to measure the peer-relative greenwashing score (GWS) as follows:
The first term of the above equation denotes the normalized measure of a firm’s position relative to its peers in the distribution of the Bloomberg ESG disclosure score. The second term denotes the normalized measure of a firm’s position relative to its peers in the distribution of the Huazheng ESG performance score. If the greenwashing score is positive, then the enterprise may deliberately exaggerate its ESG performance [48]. This paper includes GWS in Model (1) to control for the impact of greenwashing behavior, as shown by the results in Column (3) of Table 7. The coefficient of Treat × Post is positively significant, suggesting that the NBDCPZ policy can effectively promote ESG performance, even after considering the impact of greenwashing. Also, replacing Treat × Post with DEDI, we find that the finding remains unchanged, as highlighted in Column (4) of Table 7.
5. Discussion
Digital economy development and sustainable development are two widely discussed topics of late. Promoting ESG performance is a critical pathway to attain sustainable development. Governments and enterprises must harmonize effort to realize this. This paper takes the NBDCPZ policy as a quasi-natural experiment, using the data of Chinese listed companies from 2011 to 2019 and the difference-in-differences method to assess the impact of digital economy development on corporate ESG performance. We found that the digital economy can effectively lift ESG performance. This conclusion is robust, as evidenced by the robustness checks and placebo tests. Also, digital transformation is a channel for reaching this goal. Further, promoting the effect of digital economy development on ESG performance works better for private enterprises and enterprises in capital cities. Additionally, digital economy development moderates the inhibiting impact of ESG performance on the financial constraints of enterprises. Thus, digital economy development can help enterprises and society to realize sustainable development.
This paper has two main limitations. Firstly, the channel by which economy digitalization facilitates ESG performance is complex. Existing papers have suggested some possible impact mechanisms, including encouragement of innovation, promotion of corporate governance, reductions in information asymmetry [26], and promotion of energy efficiency [27]; we found that the digital economy facilitates ESG performance by promoting the digital transformation of enterprises, but the impact mechanism behind the promotion effect of the digital economy on ESG still needs further investigation. Future studies can examine the relationship between economy digitalization and ESG in terms of other possible channels in order to open the black box of the promotion effect of economy digitalization on ESG. Secondly, this paper uses the NBDCPZ policy to investigate the relationship between the digital economy and ESG, as this policy focuses on digital infrastructure construction; however, digital infrastructure is only one aspect of digital economy development. This paper also uses the evaluation index system to measure the digital economy development level; the results can be more comprehensive, but the index system can be also improved due to data constraints. Future studies can collect more data on regional digital economy development to measure the digital economy more reasonably and accurately.
6. Conclusions
This paper offers several policy recommendations at the macro and micro levels. In terms of policy recommendations at the macro level, policymakers should pay more heed to digital infrastructure, such as 5G, big data, and artificial intelligence. Digital infrastructure is the basis for developing a digital economy, and policymakers should invest more in digital infrastructure to increase broadband coverage and network speed and enhance its stability and security to realize digital economy development. Policymakers should also focus more on areas with an underdeveloped digital economy to prevent a digital divide, thereby promoting ESG performance and sustainable development. At the same time, information technology is an important component in the development of the digital economy, and application of digital technologies in the production process can improve the production efficiency, contributing to the sustainable development of enterprises. For example, autonomous driving technology can realize unmanned and roboticized operations in the logistics field, such as loading and unloading, transporting, and receiving goods, which can promote cost reductions and energy efficiency. Therefore, policymakers should encourage deeper industry–academic collaboration; formulate and implement effective strategies to support modern service industries, whose technology levels are relatively high; and promote innovation in this space to facilitate the development of advanced human-centric technologies. Policymakers can also render more financial support to nurture human capital in the digital economy, including investment in universities and research institutions to improve the quantity and quality of digital talents, which help to promote digital economy development and thus facilitate ESG performance and the achievement of sustainable development. As for policy recommendations at the micro level, enterprises can benefit from regional digital economy development. Thus, they should actively carry out digital transformation. Although digital transformation consumes corporate resources, the payback is evident in their ESG performance. As such, digital transformation is pivotal for the sustainable development of enterprises. That being said, enterprises should also focus on social responsibility by investing deeply in environmental protection and corporate governance in the search of a brighter future for planet Earth.
Author Contributions
Conceptualization original draft preparation, J.K.; Methodology & investigation, Y.C.; Writing—review & editing, M.G. All authors have read and agreed to the published version of the manuscript.
Funding
This work is funded by the Natural Science Foundation of Qinghai Province (Grant No. 2023-QLGKLYCZX-026) and the Construction Program of Doctoral Thesis Extended Project for New Teachers at Qinghai University of Science and Technology, Qinghai University (Grant No. 202302lwys017). This paper does not reflect an official statement nor opinion from any organization.
Institutional Review Board Statement
Not applicable.
Informed Consent Statement
Not applicable.
Data Availability Statement
Data is available on reasonable request.
Conflicts of Interest
The authors declare no conflict of interest.
References
- Zhang, Q.; Yu, Z.; Kong, D. The real effect of legal institutions: Environmental courts and firm environmental protection expenditure. J. Environ. Econ. Manag. 2019, 98, 102254. [Google Scholar] [CrossRef]
- Wang, H.; Chen, Z.; Wu, X.; Nie, X. Can a carbon trading system promote the transformation of a low-carbon economy under the framework of the porter hypothesis?—Empirical analysis based on the PSM-DID method. Energy Policy 2019, 129, 930–938. [Google Scholar] [CrossRef]
- Chen, Y.; Jin, G.Z.; Kumar, N.; Shi, G. The promise of Beijing: Evaluating the impact of the 2008 Olympic Games on air quality. J. Environ. Econ. Manag. 2013, 66, 424–443. [Google Scholar] [CrossRef]
- Li, X.; Qiao, Y.; Zhu, J.; Shi, L.; Wang, Y. The “APEC blue” endeavor: Causal effects of air pollution regulation on air quality in China. J. Clean. Prod. 2017, 168, 1381–1388. [Google Scholar] [CrossRef]
- Tu, Z.; Hu, T.; Shen, R. Evaluating public participation impact on environmental protection and ecological efficiency in China: Evidence from PITI disclosure. China Econ. Rev. 2019, 55, 111–123. [Google Scholar] [CrossRef]
- Tu, M.; Zhang, B.; Xu, J.; Lu, F. Mass media, information and demand for environmental quality: Evidence from “Under the Dome”. J. Dev. Econ. 2020, 143, 102402. [Google Scholar] [CrossRef]
- Wang, K.; Li, T.; San, Z.; Gao, H. How does corporate ESG performance affect stock liquidity? Evidence from China. Pac.-Basin Financ. J. 2023, 80, 102087. [Google Scholar] [CrossRef]
- Pástor, Ľ.; Stambaugh, R.F.; Taylor, L.A. Sustainable investing in equilibrium. J. Financ. Econ. 2021, 142, 550–571. [Google Scholar] [CrossRef]
- Ng, A.C.; Rezaee, Z. Business Sustainability Performance and cost of equity capital. J. Corp. Financ. 2015, 34, 128–149. [Google Scholar] [CrossRef]
- Albuquerque, R.; Koskinen, Y.; Zhang, C. Corporate Social Responsibility and firm risk: Theory and empirical evidence. Manag. Sci. 2019, 65, 4451–4469. [Google Scholar] [CrossRef]
- Friede, G.; Busch, T.; Bassen, A. ESG and Financial Performance: Aggregated evidence from more than 2000 empirical studies. J. Sustain. Financ. Invest. 2015, 5, 210–233. [Google Scholar] [CrossRef]
- Hanclova, J.; Doucek, P.; Fischer, J.; Vltavska, K. Does ICT capital affect economic growth in the EU-15 and EU-12 countries? J. Bus. Econ. Manag. 2014, 16, 387–406. [Google Scholar] [CrossRef]
- Pradhan, R.P.; Arvin, M.B.; Nair, M.; Bennett, S.E.; Bahmani, S. Short-term and long-term dynamics of venture capital and economic growth in a Digital Economy: A Study of European countries. Technol. Soc. 2019, 57, 125–134. [Google Scholar] [CrossRef]
- Rehman, N.U.; Nunziante, G. The effect of the digital economy on Total Factor Productivity in European regions. Telecommun. Policy 2023, 47, 102650. [Google Scholar] [CrossRef]
- Tao, J.; Wang, Z.; Xu, Y.; Zhao, B.; Liu, J. Can the digital economy boost rural residents’ income? Evidence from China based on the spatial Durbin model. Econ. Anal. Policy 2024, 81, 856–872. [Google Scholar] [CrossRef]
- Zhang, Y.; Qu, Y. Has the digital economy improved the consumption of poor and subsistence households? China Econ. Rev. 2024, 83, 102083. [Google Scholar] [CrossRef]
- Graetz, G.; Michaels, G. Robots at work. Rev. Econ. Stat. 2018, 100, 753–768. [Google Scholar] [CrossRef]
- Liu, J.; Chen, Y.; Liang, F.H. The effects of digital economy on breakthrough innovations: Evidence from Chinese listed companies. Technol. Forecast. Soc. Change 2023, 196, 122866. [Google Scholar] [CrossRef]
- Huo, P.; Wang, L. Digital economy and business investment efficiency: Inhibiting or facilitating? Res. Int. Bus. Financ. 2022, 63, 101797. [Google Scholar] [CrossRef]
- Li, Q.; Chen, H.; Chen, Y.; Xiao, T.; Wang, L. Digital economy, financing constraints, and corporate innovation. Pac.-Basin Financ. J. 2023, 80, 102081. [Google Scholar] [CrossRef]
- Chang, H.; Ding, Q.; Zhao, W.; Hou, N.; Liu, W. The digital economy, industrial structure upgrading, and carbon emission intensity—Empirical evidence from China’s provinces. Energy Strategy Rev. 2023, 50, 101218. [Google Scholar] [CrossRef]
- Shahbaz, M.; Wang, J.; Dong, K.; Zhao, J. The impact of digital economy on energy transition across the globe: The mediating role of government governance. Renew. Sustain. Energy Rev. 2022, 166, 112620. [Google Scholar] [CrossRef]
- Hunjra, A.I.; Zhao, S.; Goodell, J.W.; Liu, X. Digital Economy Policy and corporate low-carbon innovation: Evidence from a quasi-natural experiment in China. Financ. Res. Lett. 2024, 60, 104910. [Google Scholar] [CrossRef]
- Bano, S.; Liu, L.; Khan, A. Dynamic influence of aging, Industrial Innovations, and ICT on tourism development and renewable energy consumption in BRICS economies. Renew. Energy 2022, 192, 431–442. [Google Scholar] [CrossRef]
- Shvakov, E.E.; Petrova, E.A. Newest trends and future scenarios for a Sustainable Digital Economy Development. In Scientific and Technical Revolution: Yesterday, Today and Tomorrow; Springer: Berlin/Heidelberg, Germany, 2020; pp. 1378–1385. [Google Scholar]
- Zhai, C.; Ding, X.; Zhang, X.; Jiang, S.; Zhang, Y.; Li, C. Assessing the effects of Urban Digital Infrastructure on corporate environmental, social and governance (ESG) performance: Evidence from the Broadband China policy. Systems 2023, 11, 515. [Google Scholar] [CrossRef]
- Zhou, H.; Liu, J. Digitalization of the economy and resource efficiency for meeting the ESG goals. Resour. Policy 2023, 86, 104199. [Google Scholar] [CrossRef]
- Asif, M.; Searcy, C.; Castka, P. ESG and industry 5.0: The role of technologies in enhancing ESG disclosure. Technol. Forecast. Soc. Change 2023, 195, 122806. [Google Scholar] [CrossRef]
- Bénabou, R.; Tirole, J. Individual and corporate social responsibility. Economica 2009, 77, 1–19. [Google Scholar] [CrossRef]
- Cai, C.; Tu, Y.; Li, Z. Enterprise digital transformation and ESG performance. Financ. Res. Lett. 2023, 58, 104692. [Google Scholar] [CrossRef]
- Lange, S.; Pohl, J.; Santarius, T. Digitalization and energy consumption. Does ICT reduce energy demand? Ecol. Econ. 2020, 176, 106760. [Google Scholar] [CrossRef]
- Nair, K. Overcoming today’s digital talent gap in organizations worldwide. Dev. Learn. Organ. Int. J. 2019, 33, 16–18. [Google Scholar] [CrossRef]
- Shang, Y.; Raza, S.A.; Huo, Z.; Shahzad, U.; Zhao, X. Does enterprise digital transformation contribute to the carbon emission reduction? Micro-level evidence from China. Int. Rev. Econ. Financ. 2023, 86, 1–13. [Google Scholar] [CrossRef]
- Zhang, C.; Fang, J.; Ge, S.; Sun, G. Research on the impact of enterprise digital transformation on carbon emissions in the manufacturing industry. Int. Rev. Econ. Financ. 2024, 92, 211–227. [Google Scholar] [CrossRef]
- Lyu, Y.; Xiao, X.; Zhang, J. Does the digital economy enhance green total factor productivity in China? The evidence from a national big data comprehensive pilot zone. Struct. Chang. Econ. Dyn. 2024, 69, 183–196. [Google Scholar] [CrossRef]
- Tang, M.; Liu, Y.; Hu, F.; Wu, B. Effect of digital transformation on enterprises’ green innovation: Empirical evidence from listed companies in China. Energy Econ. 2023, 128, 107135. [Google Scholar] [CrossRef]
- Jacobson, L.S.; LaLonde, R.J.; Sullivan, D.G. Earnings losses of displaced workers. Am. Econ. Rev. 1993, 83, 685–709. [Google Scholar]
- Baker, A.C.; Larcker, D.F.; Wang, C.C.Y. How much should we trust staggered difference-in-differences estimates? J. Financ. Econ. 2022, 144, 370–395. [Google Scholar] [CrossRef]
- Goodman-Bacon, A. Difference-in-differences with variation in treatment timing. J. Econom. 2021, 225, 254–277. [Google Scholar] [CrossRef]
- Stock, J.H.; Yogo, M. Testing for weak instruments in Linear IV regression. Identif. Inference Econom. Models 2005, 80–108. [Google Scholar] [CrossRef]
- Tu, Z.; Kong, J.; Sun, L.; Liu, B. Can the digital economy reduce the rural-urban income gap? Sustainability 2024, 16, 938. [Google Scholar] [CrossRef]
- Chetty, R.; Looney, A.; Kroft, K. Salience and taxation: Theory and evidence. Am. Econ. Rev. 2009, 99, 1145–1177. [Google Scholar] [CrossRef]
- Wu, K.; Lu, Y. Corporate digital transformation and financialization: Evidence from Chinese listed firms. Financ. Res. Lett. 2023, 57, 104229. [Google Scholar] [CrossRef]
- Li, P.; Zhao, X. The impact of digital transformation on corporate supply chain management: Evidence from listed companies. Financ. Res. Lett. 2024, 60, 104890. [Google Scholar] [CrossRef]
- Hadlock, C.J.; Pierce, J.R. New evidence on measuring financial constraints: Moving Beyond the KZ Index. Rev. Financ. Stud. 2010, 23, 1909–1940. [Google Scholar] [CrossRef]
- Du, X. How the Market Values Greenwashing? Evidence from China. J. Bus. Ethics 2014, 128, 547–574. [Google Scholar] [CrossRef]
- Yu, E.P.; Luu, B.V.; Chen, C.H. Greenwashing in environmental, social and governance disclosures. Res. Int. Bus. Financ. 2020, 52, 101192. [Google Scholar] [CrossRef]
- Lin, X.; Zhu, H.; Meng, Y. ESG greenwashing and equity mispricing: Evidence from China. Financ. Res. Lett. 2023, 58, 104606. [Google Scholar] [CrossRef]
Figure 1.
Test for parallel trends.
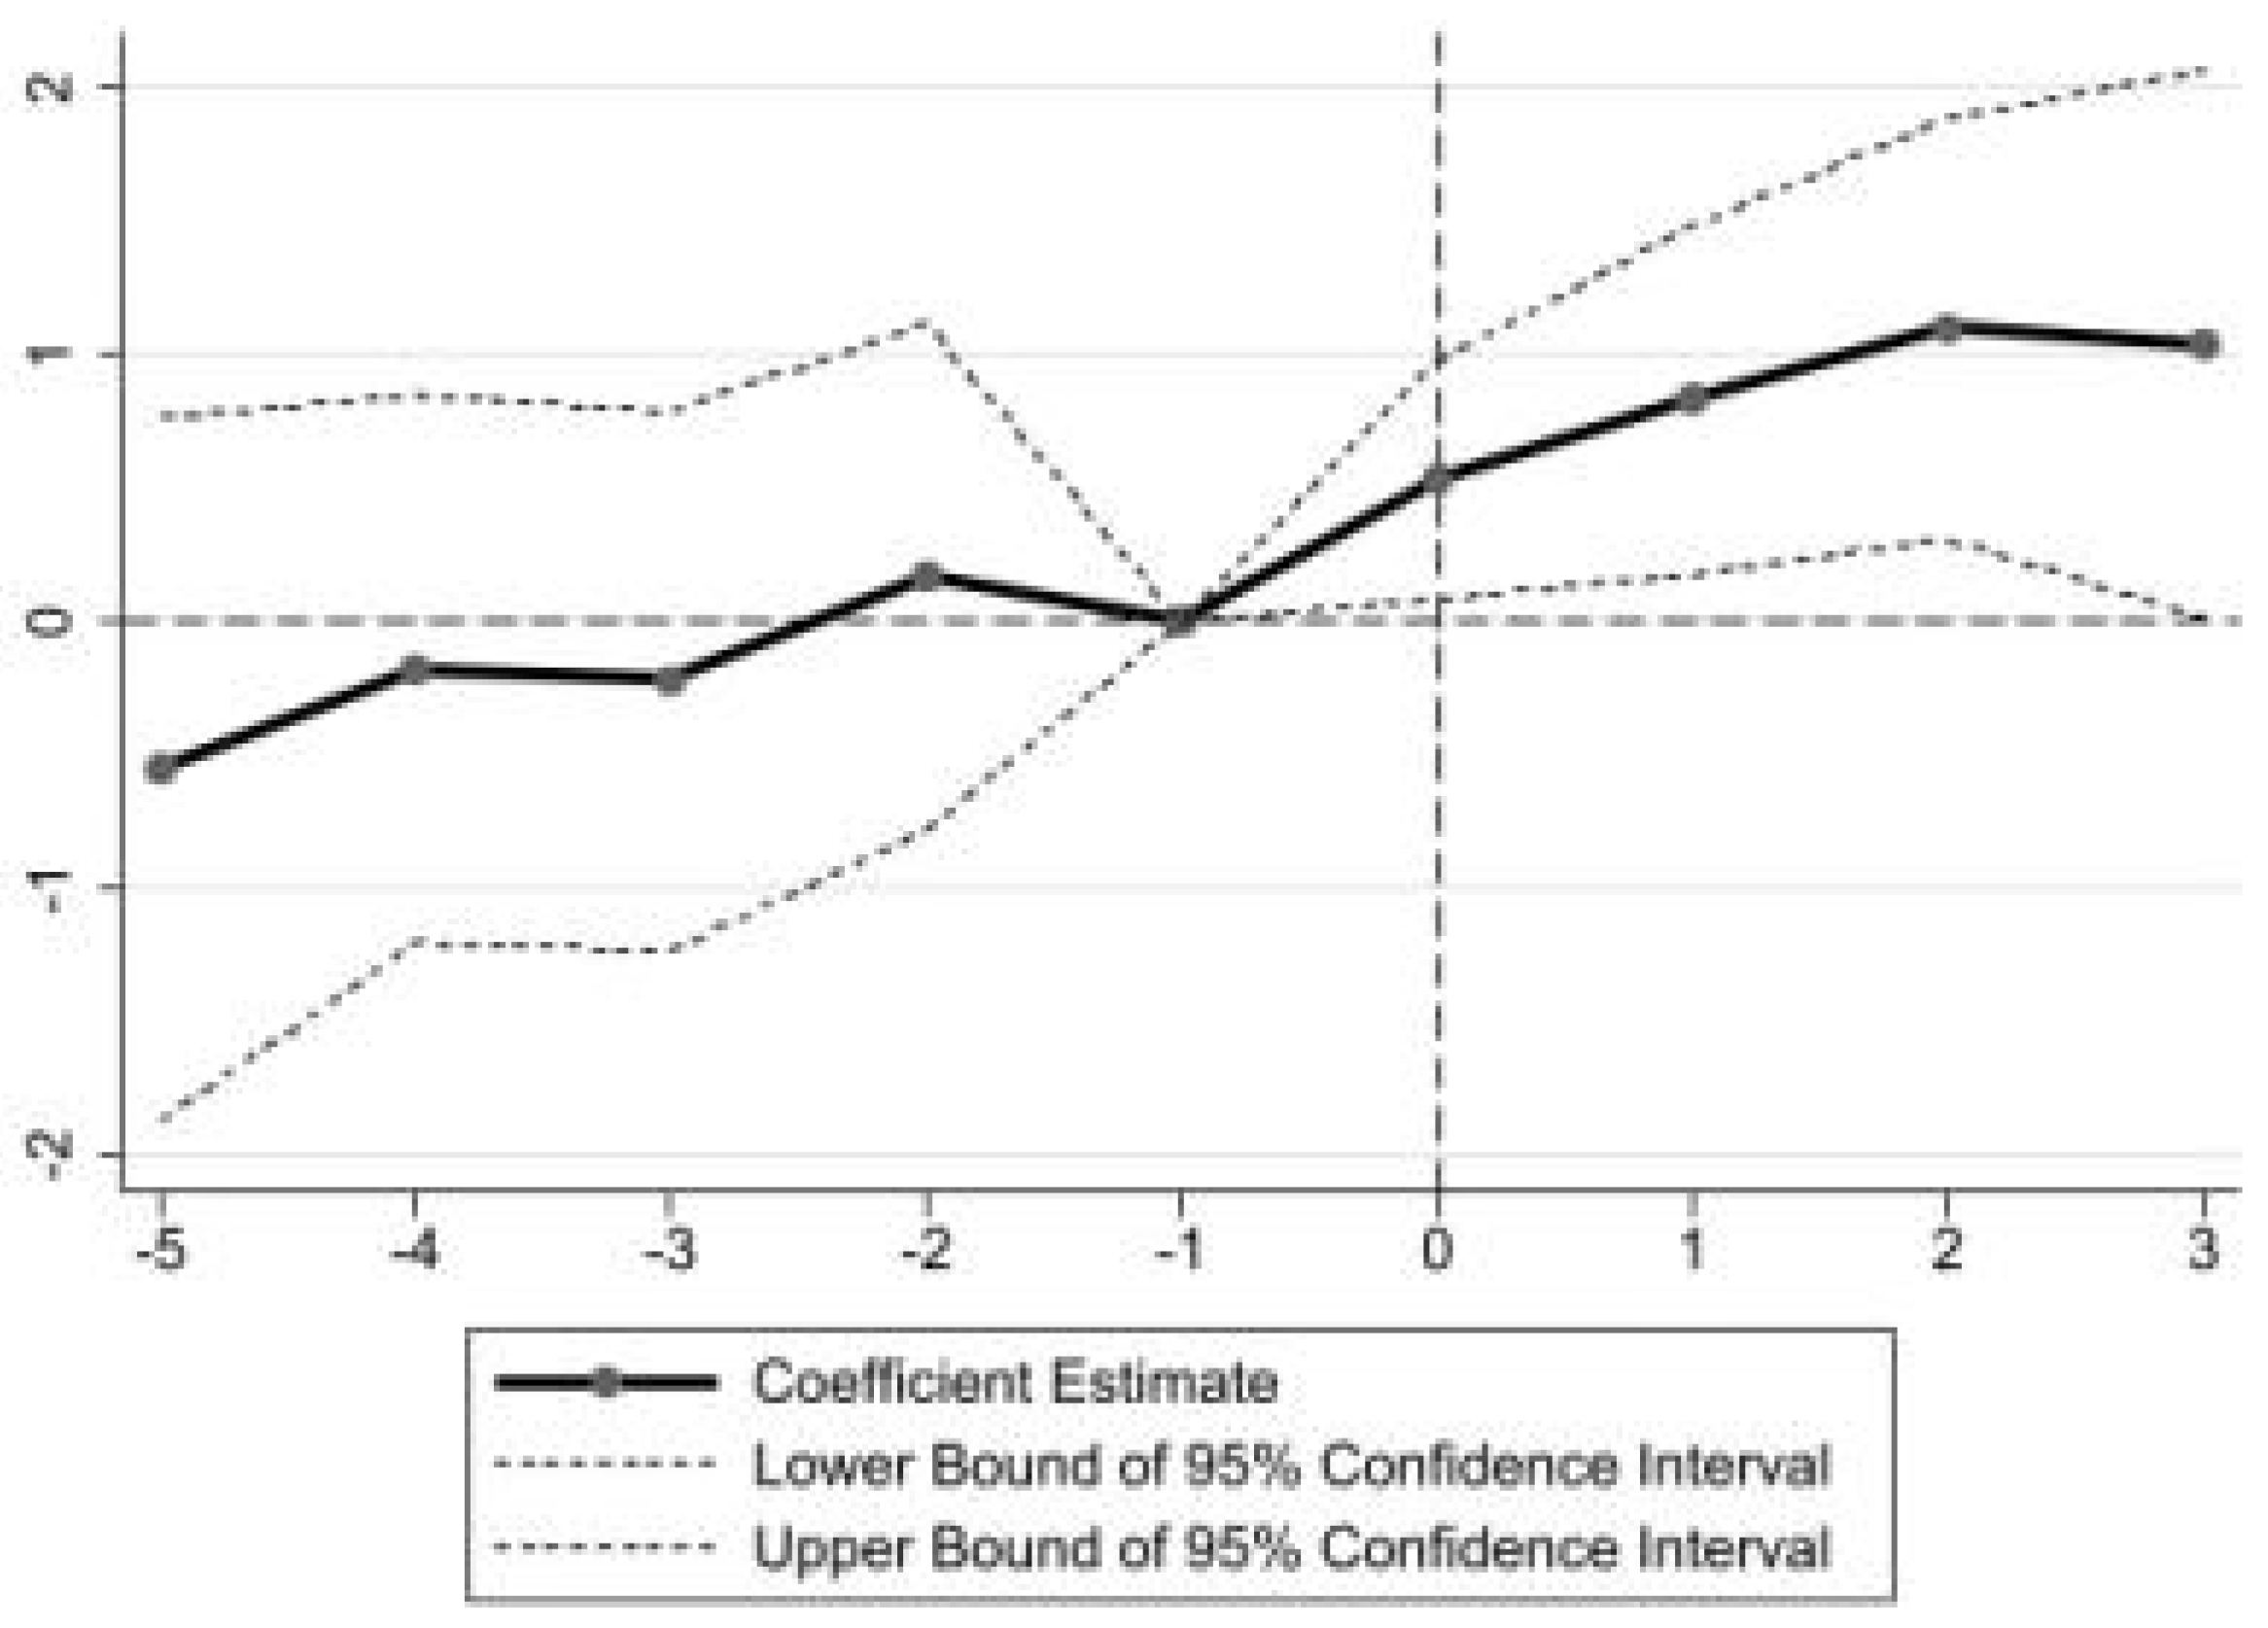
Figure 2.
Goodman–Bacon decomposition results.

Figure 3.
Placebo test at the implementing city level.


Table 1.
Descriptive statistics of the main variables.
| Variable | N | Mean | SD | Min | Max |
|---|---|---|---|---|---|
| ESG | 7084 | 27.92 | 8.53 | 7.85 | 65.78 |
| Lev | 7084 | 0.50 | 0.21 | 0.07 | 0.94 |
| Size | 7084 | 23.38 | 1.59 | 20.57 | 29.10 |
| Roa | 7084 | 0.05 | 0.05 | −0.16 | 0.22 |
| Tobin | 7084 | 1.88 | 1.22 | 0.86 | 7.73 |
| Cash | 7084 | 0.05 | 0.07 | −0.17 | 0.25 |
| Concen | 7084 | 37.23 | 16.29 | 7.84 | 77.27 |
| Top | 7084 | 0.38 | 0.05 | 0.33 | 0.57 |
| Lnage | 7084 | 2.41 | 0.67 | 0.69 | 3.40 |
| Bmr | 7084 | 0.67 | 0.26 | 0.13 | 1.16 |
| Degdp | 7084 | 17.94 | 1.02 | 15.35 | 19.39 |
| Deavegdp | 7084 | 11.42 | 0.73 | 9.6 | 12.87 |
| Intervene | 7084 | 0.16 | 0.05 | 0.08 | 0.31 |
| Structure | 7084 | 0.55 | 0.14 | 0.28 | 0.84 |
Table 2.
Results of baseline regression.
| (1) | (2) | (3) | (4) | (5) | |
|---|---|---|---|---|---|
| Variable | ESG | ESG | ESG | ESG | ESG |
| Treat × Post | 7.515 *** | 5.517 *** | 0.652 * | 0.833 *** | 0.989 ** |
| (0.217) | (0.222) | (0.379) | (0.319) | (0.422) | |
| Constant | 26.050 *** | −34.800 *** | 27.714 *** | 22.422 | −4.854 |
| (0.108) | (2.509) | (0.094) | (20.187) | (21.096) | |
| Observations | 7084 | 7084 | 7006 | 7006 | 6937 |
| Adjusted R2 | 0.145 | 0.376 | 0.833 | 0.834 | 0.841 |
| Control variables | No | Yes | No | Yes | Yes |
| Year FE | No | No | Yes | Yes | No |
| Year × Industry FE | No | No | No | No | Yes |
| Firm FE | No | No | Yes | Yes | Yes |
| Clustering at the city level | No | No | Yes | Yes | Yes |
Notes: Standard errors are in parentheses. ***, **, * denote significance at 1%, 5%, and 10% levels, respectively.
Table 3.
Robustness check.
| (1) | (2) | (3) | (4) | (5) | |
|---|---|---|---|---|---|
| Variable | ESG | F.ESG | ESG | Median | ESG |
| Treat × Post | 0.815 * | 0.792 ** | 1.285 ** | 0.085 * | |
| (0.446) | (0.360) | (0.620) | (0.045) | ||
| DEDI | 6.344 * | ||||
| (3.386) | |||||
| Constant | −17.136 | −29.675 | −3.130 | −7.557 | |
| (28.659) | (26.283) | (2.280) | (20.673) | ||
| Observations | 6672 | 5787 | 4387 | 15,915 | 6937 |
| Centered R2 | 0.014 | ||||
| Adjusted R2 | 0.851 | 0.815 | 0.615 | 0.841 | |
| KP-Wald F statistic | 39.274 |
Notes: Standard errors are in parentheses. **, * denote significance at 5%, and 10% levels, respectively.
Table 4.
Evaluation index system for digital economy development.
| Dimension | Indicator | Sign | Weight |
|---|---|---|---|
| Digital economy Innovation ability | Digital economy-related invention patent application | + | 5.68% |
| Digital economy-related invention patent authorization | + | 12.28% | |
| Digital economy-related utility model patent application | + | 3.29% | |
| Digital economy-related utility model patent authorization | + | 3.57% | |
| Digital economy Development | Percentage of internet users | + | 13.24% |
| Percentage of ICT employment | + | 12.46% | |
| Telecommunications services revenue per capita | + | 22.96% | |
| Percentage of mobile phone users | + | 10.77% | |
| Digital finance Inclusion Development | Coverage breadth | + | 5.10% |
| Usage depth | + | 5.25% | |
| Digitization level | + | 5.39% |
Notes: This paper collects data on the digital economy innovation ability from the Chinese Research Data Services Platform. The data concerning digital economy internet development is from the China City Statistical Yearbook (2012–2020). The data on digital financial inclusion development is from the Peking University Digital Financial Inclusion Index, which is measured by the Institute of Digital Finance of Peking University and Ant Financial Services Group. “+” denotes that the indicator is positive.
Table 5.
Placebo test at the implementing year level.
| (1) | (2) | (3) | (4) | |
|---|---|---|---|---|
| Variable | ESG | ESG | ESG | ESG |
| Treat × Post | 1.048 * | 1.185 ** | 1.212 ** | 1.408 ** |
| (0.533) | (0.540) | (0.579) | (0.694) | |
| Treat × Pre1 | 0.191 | |||
| (0.488) | ||||
| Treat × Pre2 | 0.393 | |||
| (0.343) | ||||
| Treat × Pre3 | 0.326 | |||
| (0.356) | ||||
| Treat × Pre4 | 0.491 | |||
| (0.458) | ||||
| Constant | −4.047 | −3.784 | −4.835 | −5.516 |
| (21.655) | (21.363) | (21.051) | (20.922) | |
| Observations | 6937 | 6937 | 6937 | 6937 |
| Adjusted R2 | 0.841 | 0.841 | 0.841 | 0.841 |
Notes: Standard errors are in parentheses. **, * denote significance at 5%, and 10% levels, respectively.
Table 6.
Results of mechanism testing and heterogeneity analysis.
| (1) | (2) | (3) | (4) | (5) | (6) | |
|---|---|---|---|---|---|---|
| State-Owned Enterprise | Private Enterprise | Capital City | Non-Capital City | |||
| Variable | Transform_1 | Transform_2 | ESG | ESG | ESG | ESG |
| Treat × Post | 0.066 * | 0.001 ** | 0.770 | 1.252 *** | 1.519 ** | 0.794 |
| (0.037) | (0.001) | (0.616) | (0.414) | (0.581) | (0.737) | |
| Constant | −2.496 | 0.036 | −25.516 | −18.819 | −30.822 | −40.900 |
| (2.363) | (0.033) | (27.058) | (29.306) | (39.587) | (26.697) | |
| Observations | 6929 | 5433 | 3442 | 3052 | 4192 | 2582 |
| Adjusted R2 | 0.755 | 0.868 | 0.850 | 0.824 | 0.852 | 0.819 |
Notes: Standard errors are in parentheses. ***, **, * denote significance at 1%, 5%, and 10% levels, respectively.
Table 7.
Other analysis.
| (1) | (2) | (3) | (4) | |
|---|---|---|---|---|
| Variable | FC | FC | ESG | ESG |
| ESG × Treat × Post | 0.001 *** | |||
| (0.000) | ||||
| ESG × DEDI | 0.006 *** | |||
| (0.001) | ||||
| Treat × Post | 0.840 * | |||
| (0.490) | ||||
| GWS | 1.618 *** | 1.624 *** | ||
| (0.089) | (0.090) | |||
| DEDI | 7.762 * | |||
| (4.688) | ||||
| Constant | −5.940 *** | −5.601 *** | −29.492 | −33.419 |
| (0.372) | (0.469) | (21.305) | (21.412) | |
| Observations | 7006 | 7006 | 4836 | 4836 |
| Adjusted R2 | 0.978 | 0.976 | 0.876 | 0.876 |
Notes: Standard errors are in parentheses. ***, * denote significance at 1% and 10% levels, respectively.
Disclaimer/Publisher’s Note: The statements, opinions and data contained in all publications are solely those of the individual author(s) and contributor(s) and not of MDPI and/or the editor(s). MDPI and/or the editor(s) disclaim responsibility for any injury to people or property resulting from any ideas, methods, instructions or products referred to in the content. |
© 2024 by the authors. Licensee MDPI, Basel, Switzerland. This article is an open access article distributed under the terms and conditions of the Creative Commons Attribution (CC BY) license (https://creativecommons.org/licenses/by/4.0/).
Share and Cite
MDPI and ACS Style
Kong, J.; Goh, M.; Cao, Y. Can Digital Economy Development Facilitate Corporate ESG Performance? Sustainability 2024, 16, 3956. https://doi.org/10.3390/su16103956
AMA Style
Kong J, Goh M, Cao Y. Can Digital Economy Development Facilitate Corporate ESG Performance? Sustainability. 2024; 16(10):3956. https://doi.org/10.3390/su16103956
Chicago/Turabian StyleKong, Jiayang, Mark Goh, and Yu Cao. 2024. "Can Digital Economy Development Facilitate Corporate ESG Performance?" Sustainability 16, no. 10: 3956. https://doi.org/10.3390/su16103956
Note that from the first issue of 2016, this journal uses article numbers instead of page numbers. See further details here.