Article

Study on the Correlation between Ecological Service Value and Ecological Risk of Typical Mountain-Oasis-Desert Ecosystems: A Case Study of Aksu City in Northwest China

1
College of Geography and Remote Sensing Science, Xinjiang University, Urumqi 830046, China
2
Key Laboratory of Oasis Ecology, Ministry of Education, Xinjiang University, Urumqi 830046, China
*
Author to whom correspondence should be addressed.
Sustainability 2024, 16(10), 3915; https://doi.org/10.3390/su16103915
Submission received: 7 April 2024 / Revised: 4 May 2024 / Accepted: 6 May 2024 / Published: 7 May 2024
(This article belongs to the Section Sustainable Urban and Rural Development)

Abstract

:
Aksu City, located in the southern region of Xinjiang, China, holds the position of being the fifth largest city in Xinjiang. It holds significant ecological importance as a vital functional region for the management of desertification in China. To safeguard the ecological security of Xinjiang and preserve the ecological stability of Aksu City, it is crucial to examine the relationship between ecological service value and ecological risk, as well as the geographical and temporal changes in land use characteristics in Aksu City. This study examines the evolutionary characteristics and spatial correlation between ecological service value and ecological risk in Aksu City, using Aksu City as a case study. The analysis is based on five periods of land use data from 2000, 2005, 2010, 2015, and 2020. The study revealed the spatial and temporal patterns of landscape ecological risk and ecosystem service value in Aksu City from 2000 to 2020 using the landscape pattern index, ecological service value estimation, and ecological risk index. In addition, the study explored the interrelationship between ecological service value and ecological risk. The findings indicated that: (1) Bare land constituted the predominant land use category in Aksu City, accounting for over 81% of the total land use transfer over a 20-year period, encompassing a total area of 459.83 km2. (2) The total ecological service value (ESV) in the area experienced a decline of CNY 3.41 × 10⁸ within the study’s time frame, exhibiting a decrease rate of 6.73%. Notably, grass and shrubland emerged as the primary contributor to the ESV, accounting for 33.25% of the total. (3) The ecological risk index (ERI) in Aksu City, within the period of 2000–2020, showed an increase in the interval from 0.2686 to 0.2877. The results indicated a decline in the overall ecological condition. The ecological risk level in Aksu City from 2000 to 2020 was dominated by lower and medium ecological risks. (4) Moran’s I values in Aksu City between 2000 and 2020 ranged from 0.428 to 0.443, which suggested a positive spatial correlation between ESV and ERI in the study area. The primary factor contributing to the heightened ecological risk in the study region was predominantly attributed to human activities such as urban expansion, agricultural production, and overgrazing.

1. Introduction

Ecosystems have a crucial role in connecting human beings with the environment, and their provision of services and generation of natural capital are essential for the proper functioning of the planet’s life support systems [1]. The services offered by ecosystems are presently experiencing a downward trajectory as a result of the effects of human demands and climate change in recent decades [2]. The vanishing of ecosystems in certain regions is having a detrimental influence on human welfare [3,4]. Hence, the scientific evaluation of ecosystems, objective judgments, and the promotion of sustainable development have emerged as prominent subjects in ecological research [5,6,7,8,9]. Ecosystem service function evaluation and ecological risk evaluation are significant forms of ecological assessment that exhibit strong correlations with ecological safety evaluation [10]. The integration of ecoservice and ecological risk evaluation can enhance the provision of decision support for the preservation of ecological environments [11]. The concept of ecological service function serves as the foundation for decision making related to ecological protection [12], ecological function zoning [13], and ecological compensation [14]. This function is evident in the dynamic changes that occur in space and time, which are strongly linked to both ecological structure and ecological function [15,16,17].
By contrast, the concept of ecological service value refers to a quantitative evaluation of the ecological service system. It serves as a point of reference for the general public and decision makers, offering definite and observable values that play a crucial role in ecological governance [1]. Currently, there are two main approaches to assessing the ecosystem service value (ESV): one based on equivalence factors of value per unit area [1,18], and the other based on functional prices per unit of service [19]. The former is usually more intuitive and is suitable for assessing ESV at regional and global scales. The method of equivalent factor based on unit area value is currently extensively employed in China for calculating and accounting for the value of ecosystem services [20,21,22].
Ecological risk index (ERI) evaluation involves forecasting future changes and developments in the ecological environment. It serves as a foundation for risk control and assesses the ecological safety of an area from a different perspective [23]. Ecological risk index (ERI) assessment is applied to guide decision-making processes to support ecosystem-based management and prioritize risk factors [23]. ERI evaluations successfully guide the optimization and management of regional landscape patterns and offer decision support for integrated regional risk prevention. The landscape index method and the risk “source–sink” approach are the two primary methods of evaluation [24].
ESV and ERI are important types of ecological evaluation. At this juncture, assessment, including both aspects, has transitioned from a state of relative autonomy to one of integration. When applied in combination, they can more successfully connect ecological changes to human wellbeing, improving the case for local ecological protection in policy making. Notably, the evaluation of ecological risks based on the provision of ecosystem services has emerged as a burgeoning area of focus and research trajectory [25]. Previous research has demonstrated a correlation between the value of ecological services and ecological risk, indicating that alterations in ecological risk would result in corresponding changes in ecological services to a certain degree [26]. Conducting research on the correlation between the value of ecological services and ecological risk can enhance the promptness and thoroughness of evaluating ecological risks [27], contributing to establishing a theoretical foundation for optimizing the geographical distribution of ecological resources.
The mountain-oasis-desert ecosystem is a typical ecosystem in northwestern China; this ecosystem is fragile and easily affected by land use and land cover changes [28]. Currently, there is a limited body of research that specifically examines the relationship between the value of ecosystem services and the ecological risk associated with typical mountain-oasis-desert systems in arid regions. In their study, Li, J. et al. [25] examined the correlation between the value of ecosystem services and ecological risk, as well as the spatial and temporal variations in the coastal region of Binhai City. Similarly, Qiao, B. et al. [29] investigated the association between the value of ecosystem services and ecological risk in the Qilian Mountain National Park, located in the Qinghai-Tibetan alpine zone.
Given the aforementioned circumstances, this study focuses on Aksu City as the subject of research. We chose Aksu City as the study area because it is situated at the northern boundary of the Taklamakan Desert, which is the second largest mobile desert globally. The northern section of Aksu City is located on the western slopes of the southern Tien Shan Mountains. The central part of the city is supported by an oasis that receives its water supply from the Tien Shan Mountains situated in the north. As a result, Aksu City shows the distinctive characteristics of a typical mountain-oasis-desert system.
A comprehensive study of the changes in the value of ecological services and ecological risks in the area and the relationship between them is crucial for improving the ecological environment of oasis cities and advancing the sustainable growth of their economies. In view of this, the aims of the study were to (1) analyze the spatial and temporal patterns of land use in Aksu City between 2000 and 2020 using the land use transfer matrix model; (2) analyze the relationship between the value of ecological services and ecological risk in the region during the same period; and (3) provide recommendations for local development based on the level of concentration of ecological service value and ecological risk.

2. Materials and Methods
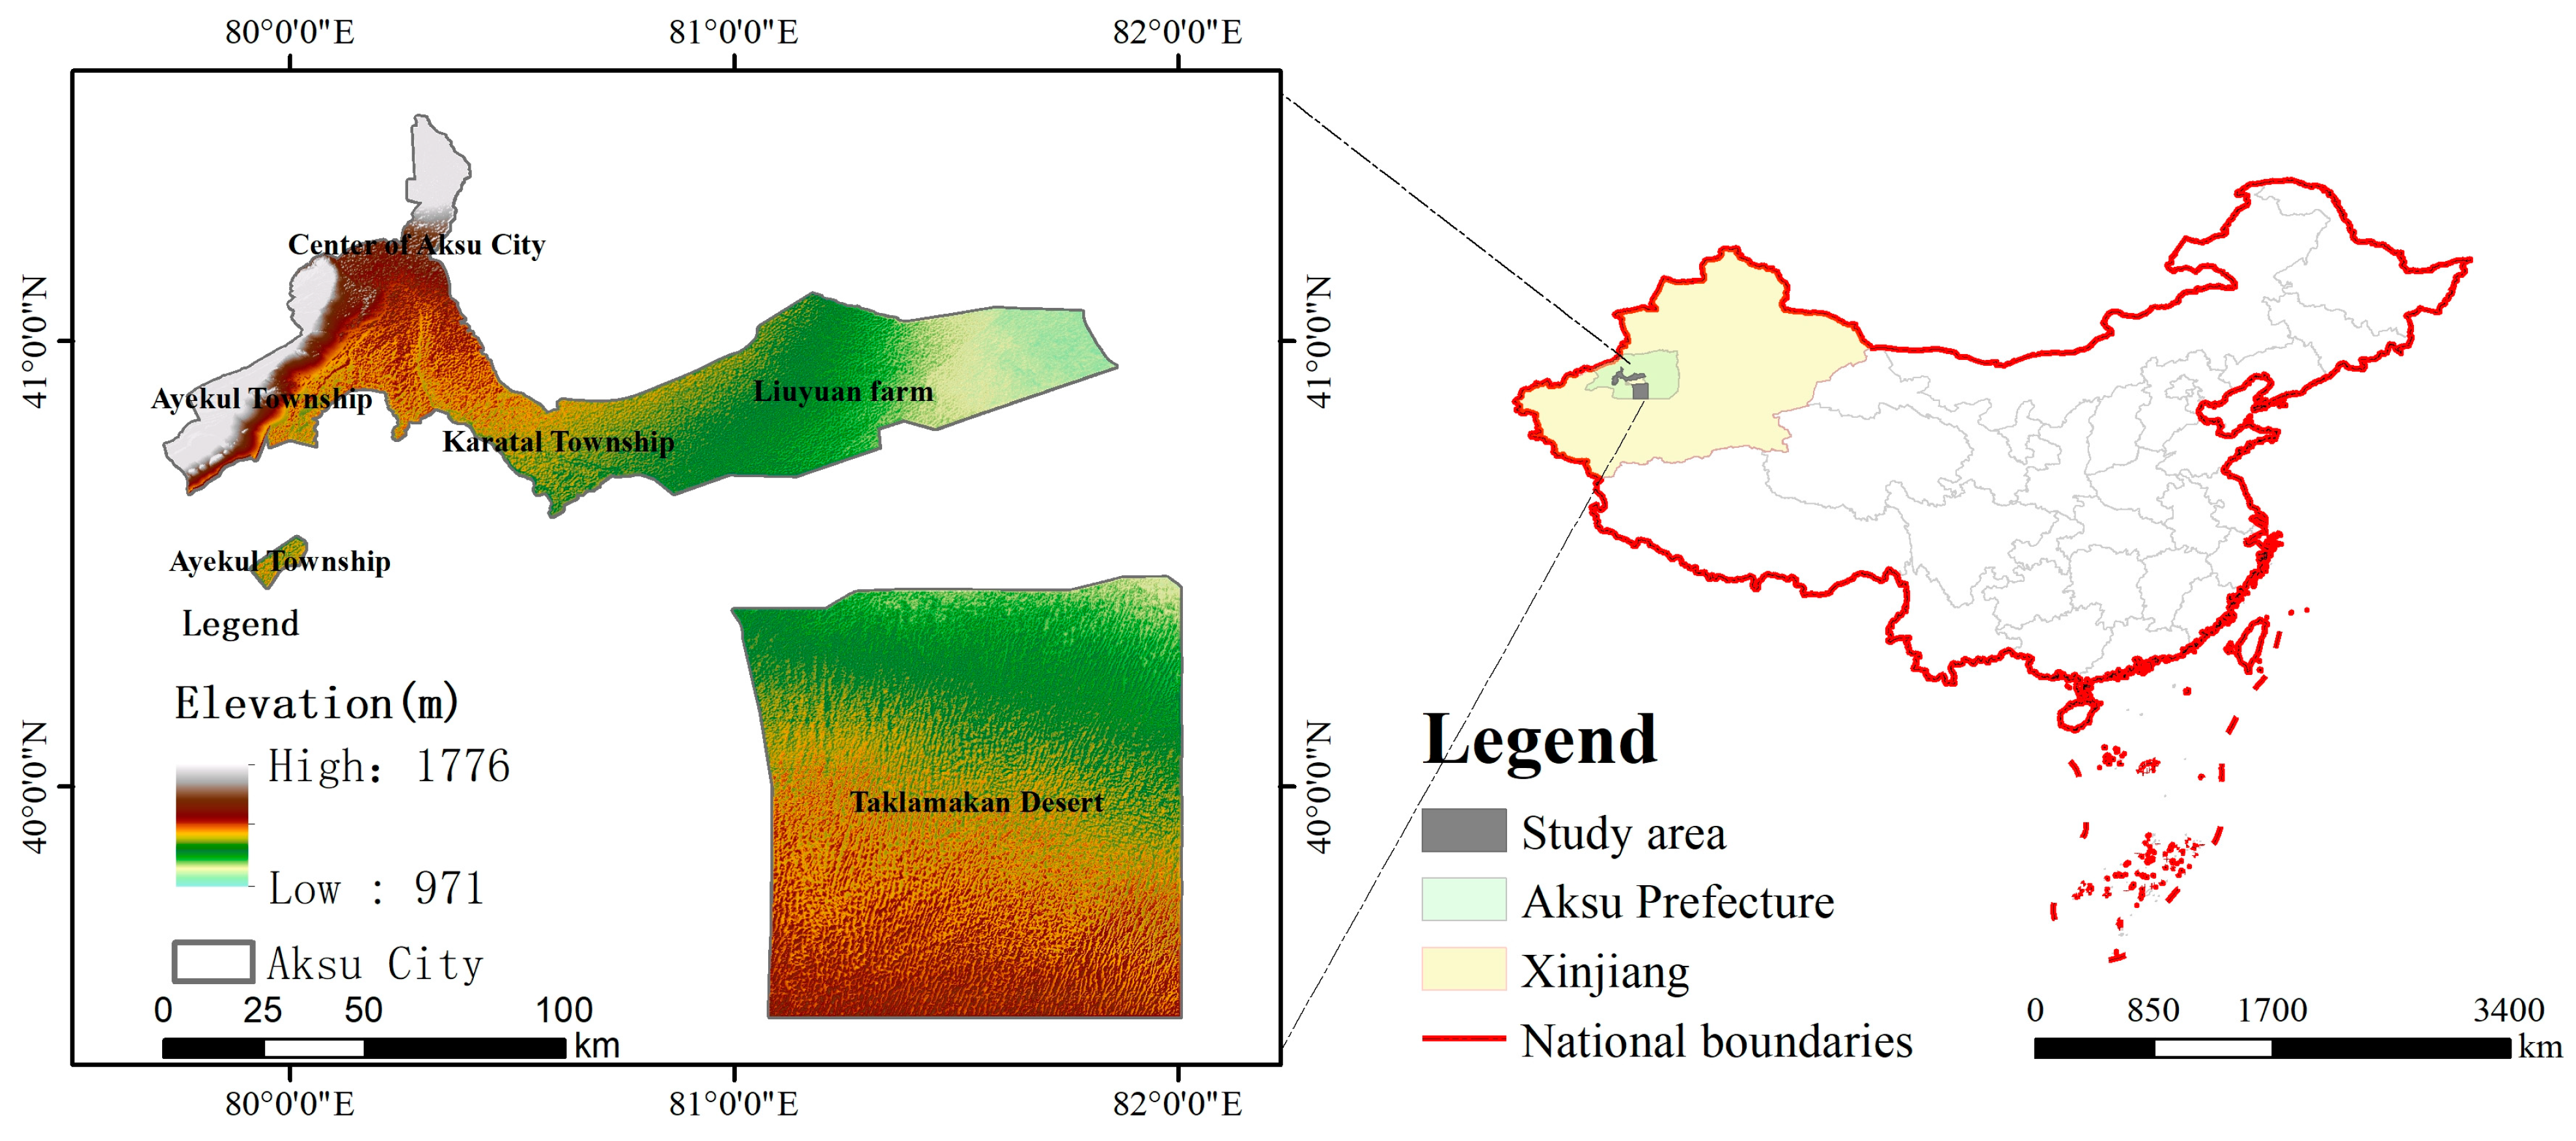
2.1. Study Area

Aksu City (79°43′–82°01′ E, 39°29′–41°30′ N) situated in the Xinjiang Uygur Autonomous Region of China, has a total area of 14,400 km2 (Figure 1). The terrain is predominantly flat, with the northwest consisting of the low mountainous region of the Yingan Mountains. The central area is characterized by a flood-prone alluvial plain, while the southern desert area is situated at the northern boundary of the Taklamakan Desert. The research site has a warm-temperate continental arid climate, characterized by an average annual precipitation ranging from 60 to 90 mm and an average annual evapotranspiration ranging from 1643 to 2202 mm. The disparity in precipitation levels within the region is more evident since precipitation is predominantly concentrated in the western and northern regions of Aksu City, while the southern arid areas have less precipitation. The Aksu River passes through the central part of the study area, and the Aksu River, Palace Lake, and Dolang Reservoir are important sources of water in the study area. The research area has a higher frequency of natural catastrophes, mostly manifesting as wind, hail, drought, floods, earthquakes, mudslides, and landslides in the western mountainous regions during the summer season. Aksu City is characterized by abundant illumination, an extended period of freezing temperatures, and significant daily temperature fluctuations. It serves as an essential regional center for food production in China. Its production of long-staple cotton constitutes over 90% of China’s total production, and it is known as the “the birthplace of long-staple cotton”. As of 2022, the total population of Aksu City was 705,000; in 2022, Aksu City achieved a gross domestic product (GDP) of CNY 32.372 billion. Aksu Industrial Park is mainly located on the east and west sides of Aksu City center, with chemical and textile industries as the main industries, and it is the main distribution location of Aksu City’s industries.

2.2. Data Sources and Processing

2.2.1. Data Sources

The study area utilized land use data from the Resource and Environment Science and Data Center of the Chinese Academy of Sciences for five periods, including 2000, 2005, 2010, 2015, and 2020, with a spatial resolution of 30 m. (See Table 1). The administrative boundaries were determined using data from the Resource and Environment Science and Data Center of the Chinese Academy of Sciences. The socio-economic data sources included the 2000–2020 National Compendium of Cost and Benefit Information of Agricultural Products, Aksu City Statistical Bulletin from previous years, and compilations of relevant information.

2.2.2. Data Processing

We classified the study area into six different land use types: cropland, forest, grass and shrubland, waterbody, impervious, and bare land [30].
A total of 3706 assessment cells were obtained by re-sampling the land use of the research region using ArcGIS 10.2 software. We achieved this by selecting a fishnet measuring 2 km. Over the last two decades, assessment cells [29] have been employed to assess the worth of ecological services and ecological threats within the designated research region. Furthermore, the technique of Kriging interpolation [31] was employed to elucidate the spatial and temporal manifestations of these variables. This strategy successfully accomplished the micro-reconstruction of land use data.

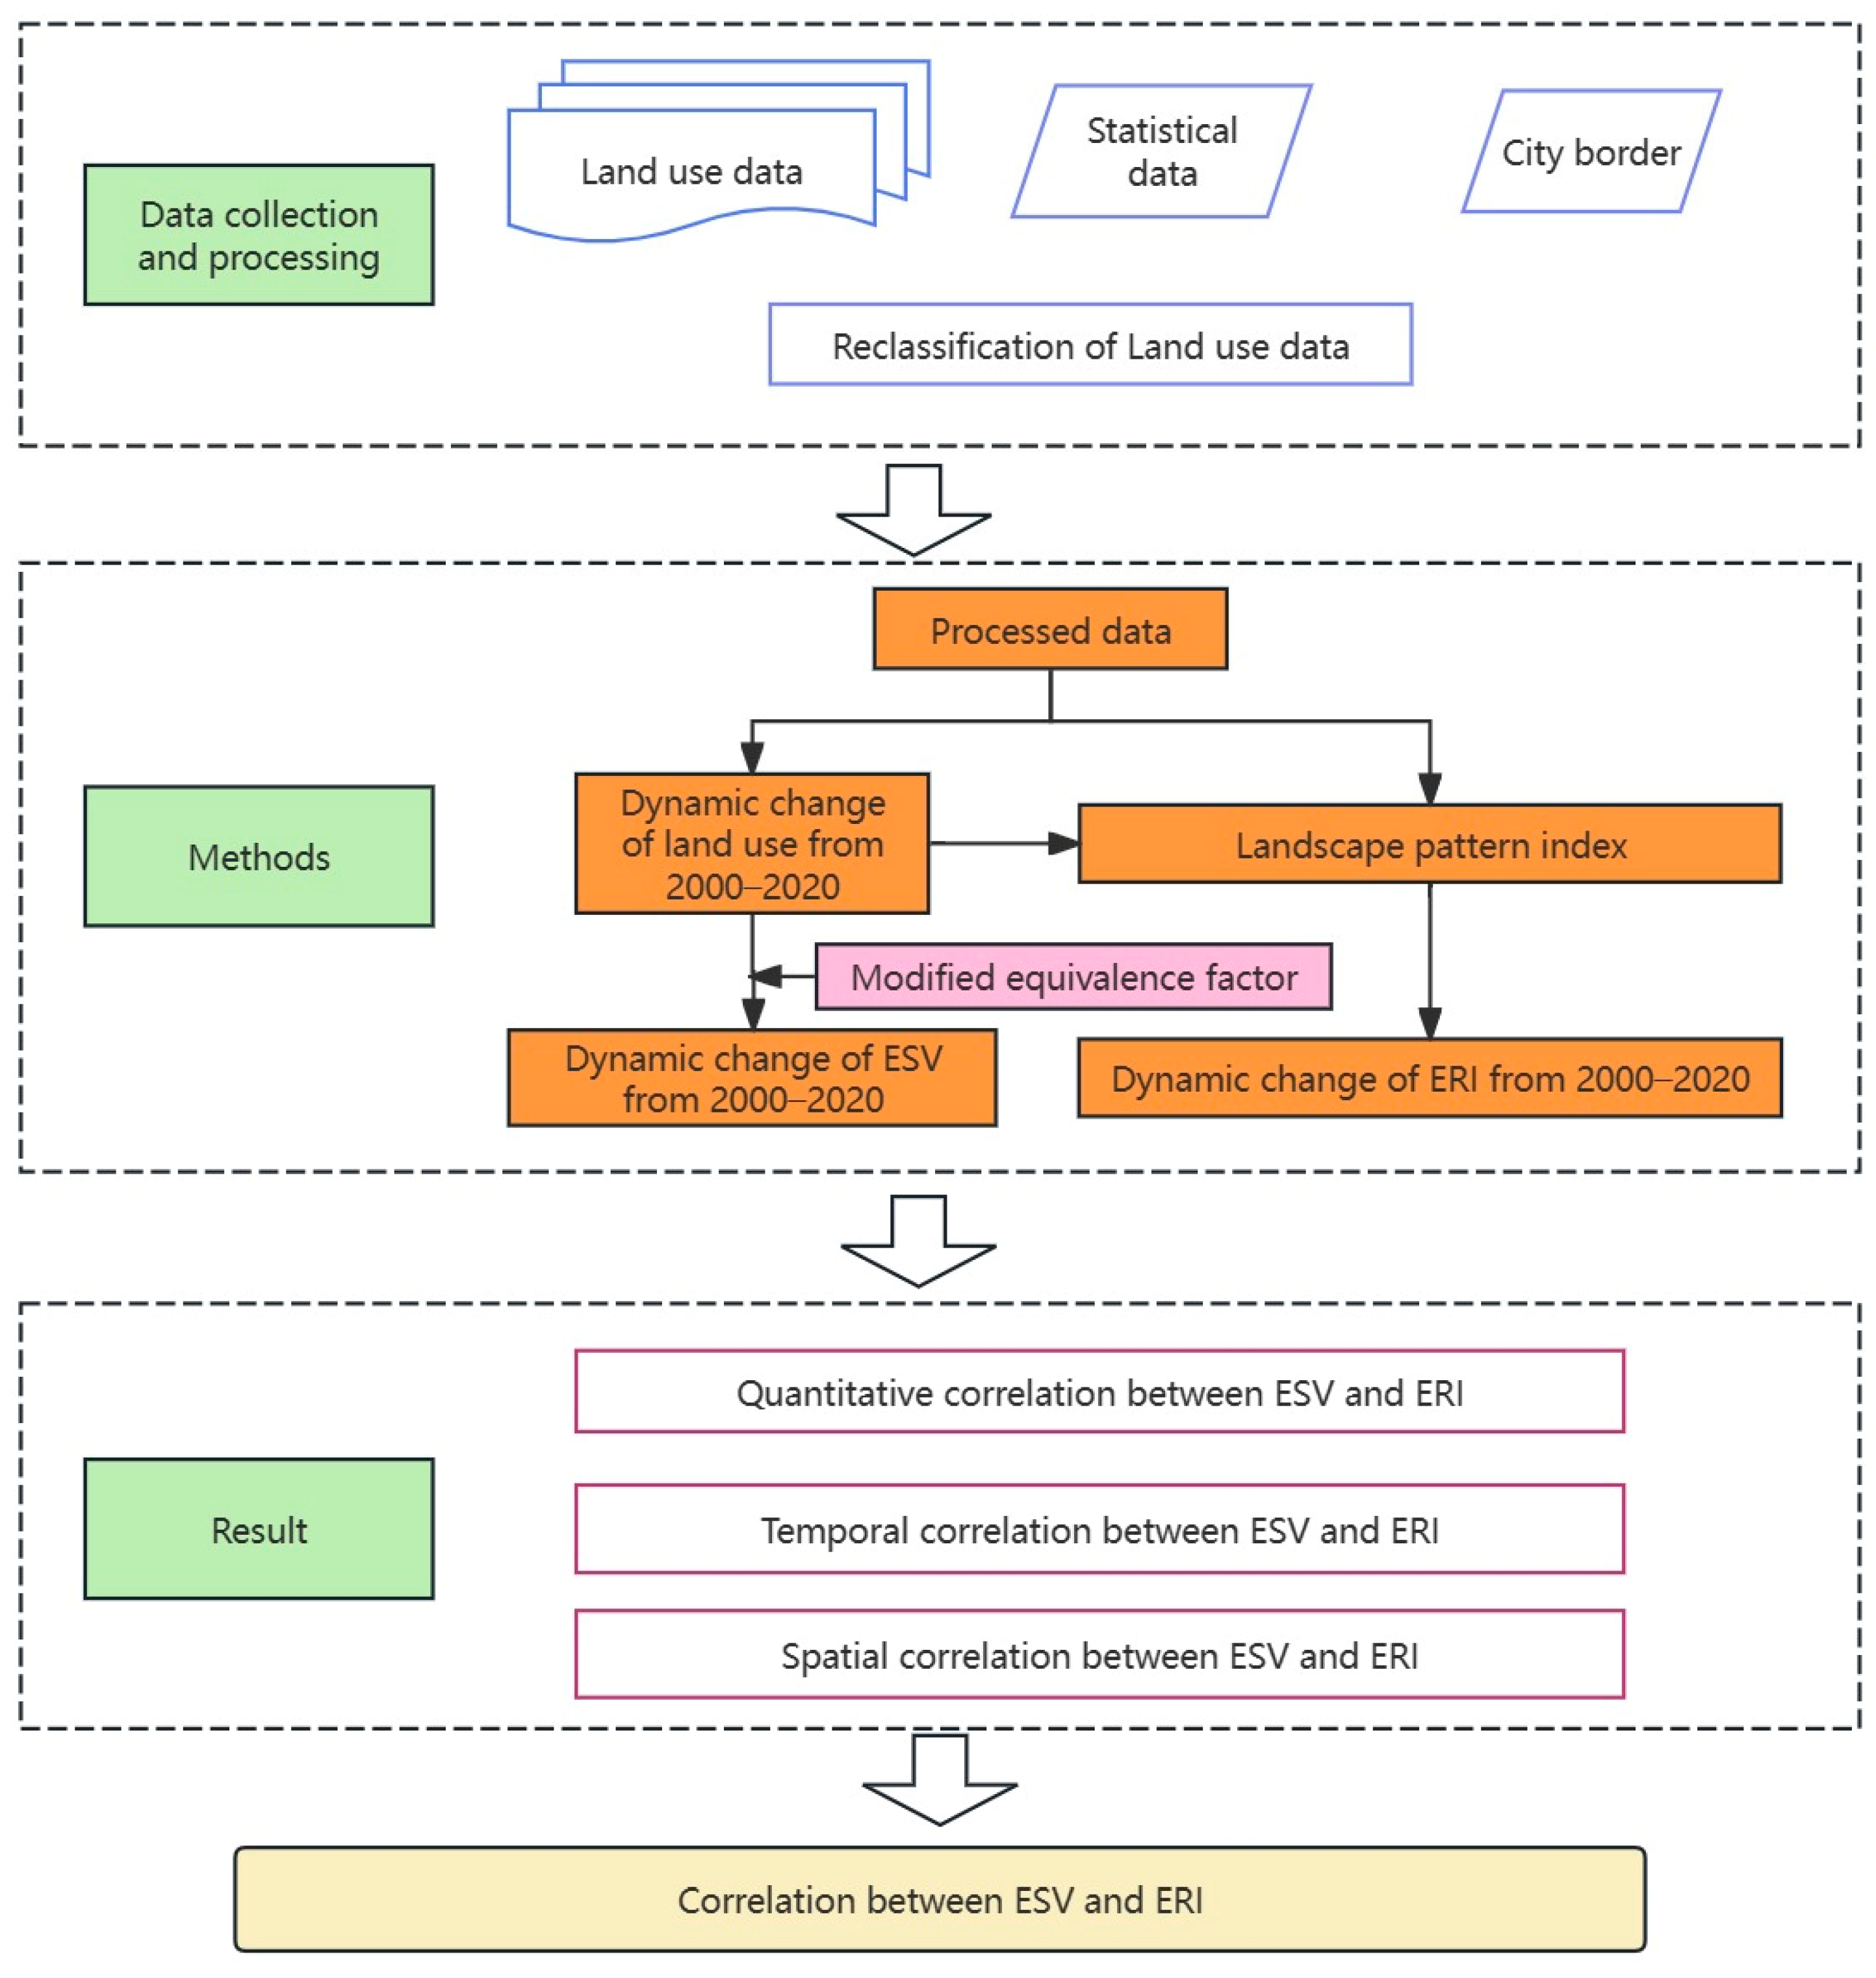
2.3. Method of Analysis

2.3.1. Models for Estimating the Value of Ecological Services

In this study, we chose to evaluate the worth of ecological services using the value equivalent factor per unit area method [1,18]. We utilized the improved system service value equivalent factor table [20] as our point of reference. We defined the net profit of food production in farmland ecosystems per unit area (1 hm2) as the standard equivalent value of one standard equivalent factor for the value of ecological services; the ecological value of constructed land was not taken into account [32]. The average square value of each land use type inside each grid cell was determined using the gridded land use data and adjusted accordingly based on the proportional weights.
E S V i = A i × V C i
E S V = i E S V i
where E S V and E S V i represent the total service value and the service value of the i th land use type, respectively, A i represents the land area of the i th type, and V C i is the service value coefficient, which represents the service value of the unit area of the i th land use type.
The standard equivalent value was calculated from one-seventh of the national average grain price in the current year [33]. The data on grain production and grain prices used in this study were obtained from the compilation of national agricultural cost and benefit statistics from previous years as well as the statistical yearbook of Aksu City. After accomplishing the necessary calculations and making the appropriate adjustments, the final standard equivalent value was found to be 1391.41 CNY/hm2.

2.3.2. Landscape Ecological Risk Index Accounting Model

According to prior research [34,35], this study developed a comprehensive landscape ecological risk index (ERI) for the study area. The ERI was based on various landscape disturbance, fragmentation, separation, detachment, and vulnerability indices, which were derived from the proportional distribution of different land use types within the study area. The landscape index was calculated using Fragatsts 4.2 in order to obtain the ecological risk index (ERI) for each assessment unit. This ERI was subsequently utilized to assess the ecological risk associated with Aksu City [36,37]. The formulas for the calculation are:
E R I k = i = 1 n A k i A k × E i × V i
E i = a C i + b S i + c F i
where E R I k represents the landscape ecological risk index of the k th cell, A k i is the area of the ith type of landscape in a single cell, A k is the total area of the k th type of cells, E i is the landscape disturbance index; V i is the landscape fragility index; C i is the landscape fragmentation index; S i is the landscape separation index; F i is the landscape dominance index; and a , b , and c respectively represent the weights of the corresponding landscape indices, with reference to previous studies [35,38], a + b + c = 1 , and a , b , and c are 0.5, 0.3, and 0.2, respectively [25].

2.3.3. Bivariate Autocorrelation Model

The biscalar spatial autocorrelation model [39] is a statistical model employed for analyzing the geographic correlation between two variables. The aforementioned model takes into account the spatial distribution of two variables and measures the extent of their relationship by computing their spatial autocorrelation. This study employed a bivariate spatial analysis model to examine the spatial correlation properties of ecosystem service values and ecological risks. The global autocorrelation coefficient (Moran’s I index) was utilized as an indicator of the overall spatial correlation and variation.
I sr = n i = 1 n j = 1 n W i j ( y i , s y ¯ s σ s ) ( y i , r y ¯ r σ r ) ( n 1 ) i = 1 n j = 1 n W i j
where I s r is the bivariate global autocorrelation coefficient of ecosystem service value s and ecological risk index r per unit area; y i , s and y i , r are the ecosystem service value and ecological risk index per unit area of the i th evaluation plot; σ r and σ s are the variances; and W i j is the spatial weight value.
The LISA approach was used to conduct a local spatial autocorrelation analysis [40], which provided a detailed description of the spatial correlation between different areas of the research area. This analysis allowed for the identification of local clustering and distinct effects. The study area can be categorized into five groups according to the correlation: high service value-high ecological risk (H–H), low service value-high ecological risk (L–H), high service value-low ecological risk (H–L), low service value-low ecological risk (L–L), and not significant (N) [29]. The following is the technology roadmap for this research. (See Figure 2).

3. Results and Analysis

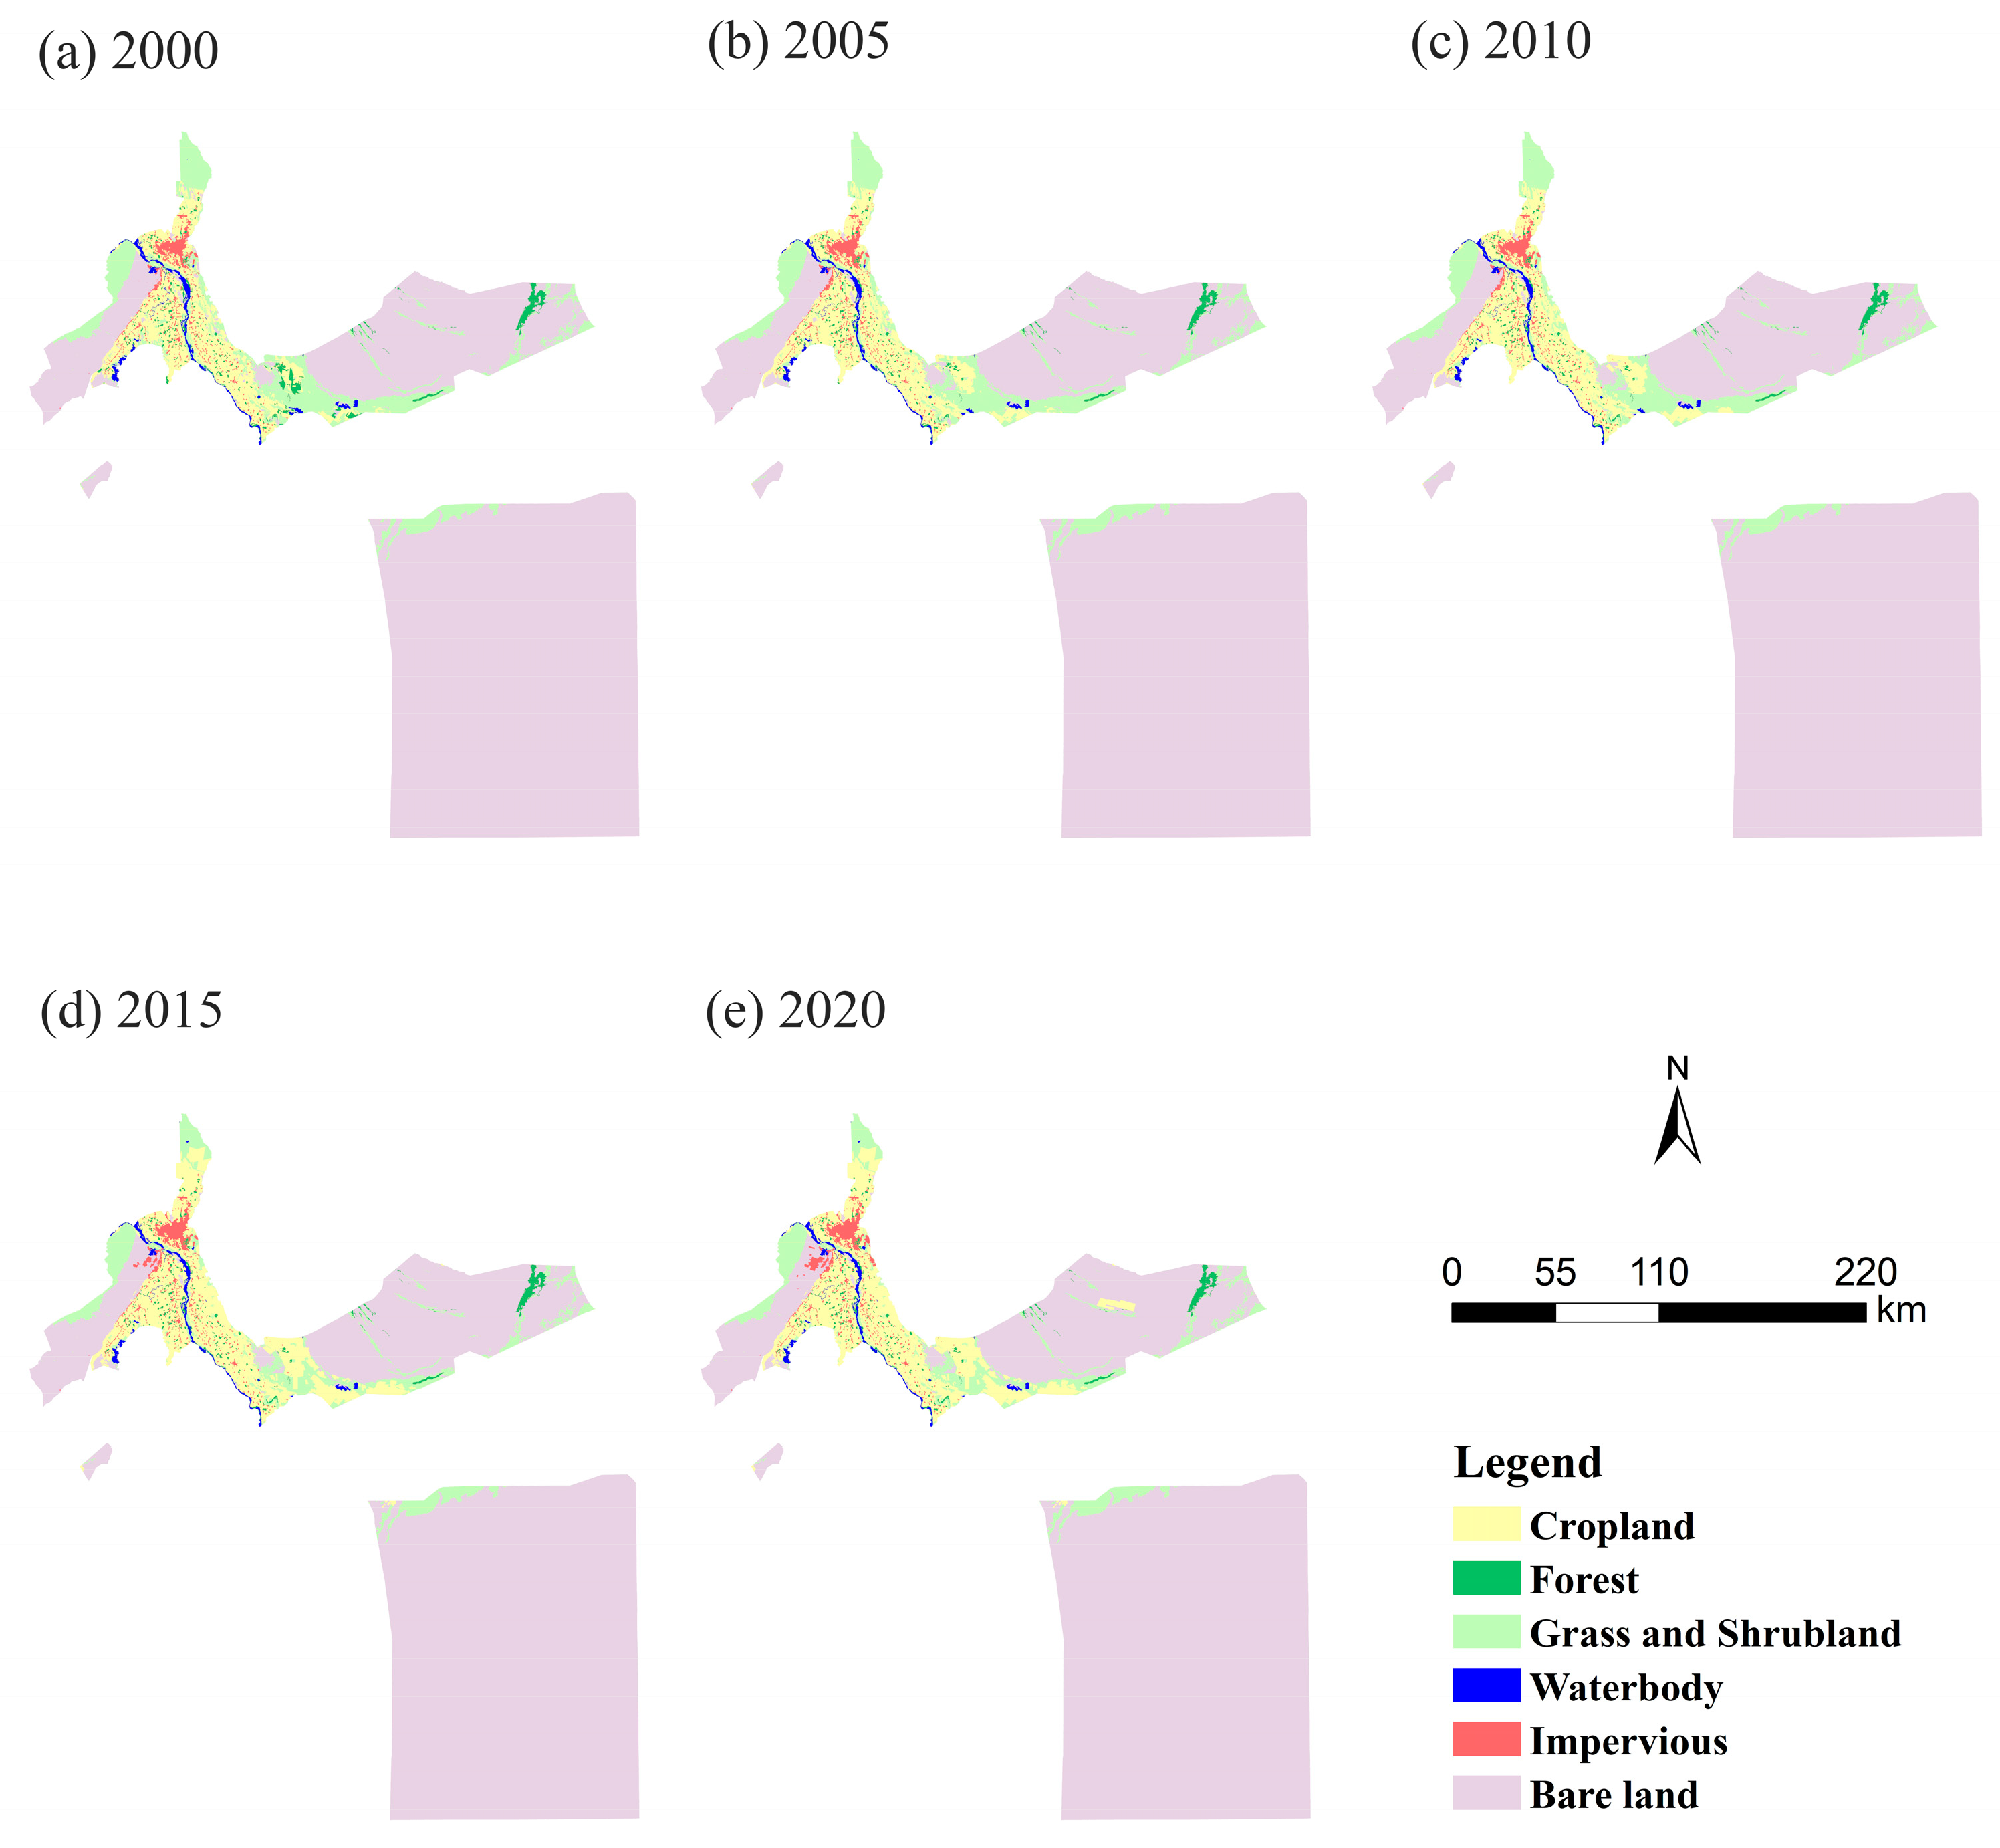
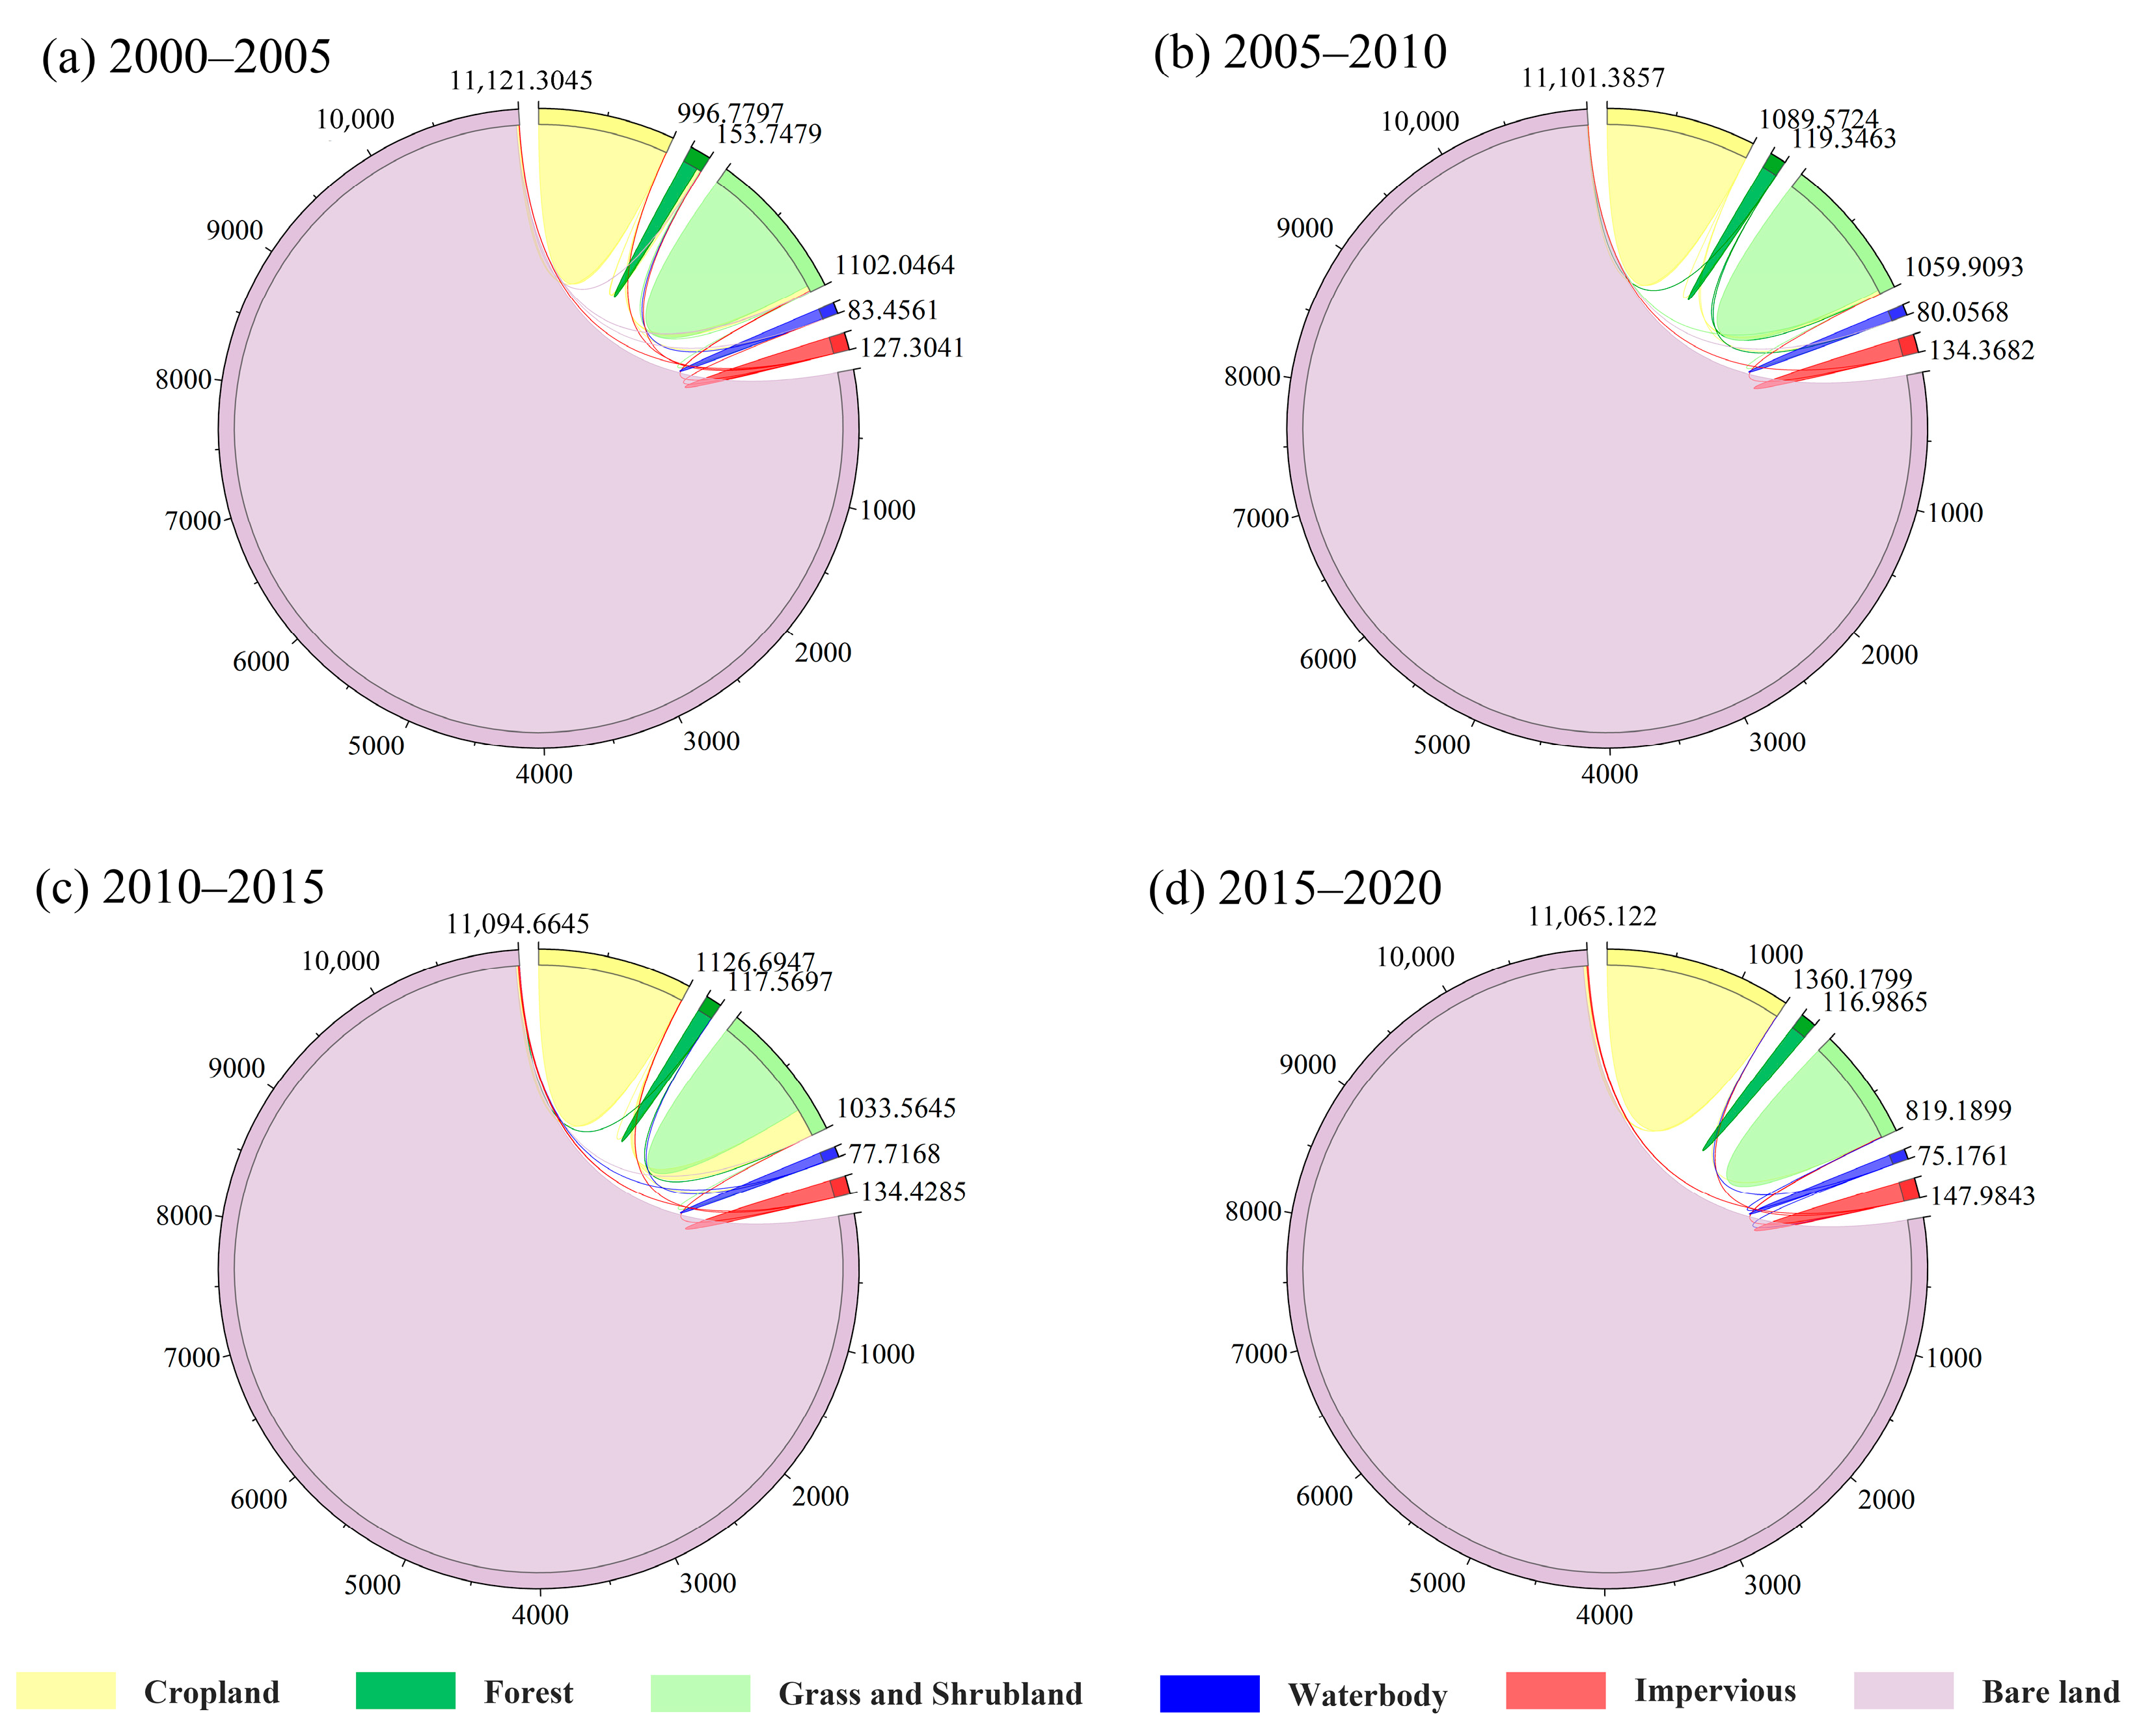
3.1. Characteristics of Changes in Land Use Types

The distribution pattern of land use in Aksu City exhibited a centralized distribution pattern along with a local staggered distribution (Figure 3). In 2000, 2005, 2010, 2015, and 2020, Aksu City recorded bare land areas of 11,121.29 km2, 11,101.38 km2, 11,094.66 km2, 11,065.11 km2, and 11,026.69 km2, respectively. These areas accounted for 81.87%, 81.72%, 81.67%, 81.45%, and 81.17% of the total land area, respectively. The bare land was primarily located in the pre-mountain desert region in the north and the desert region in the south of the study area. According to the Köppen climate classification, Aksu City is a cold desert climate (BWK) [41]. Specifically, Aksu City, being one of the cities located further away from the sea in China, experiences less influence from the eastern monsoon. Consequently, bare land emerged as the predominant land cover in the local area, constituting the primary component of the cold desert climate [41]. The cropland in Aksu City in 2020 totalled 1388.15 km2, representing 10.22% of the city’s total area. This made it the second-largest land use category in the city. The forest area was 116.99 km2, accounting for 0.86% of the city’s total area. The waterbody area was 75.72 km2, representing 0.56% of the city’s total area. Despite its limited size, the waterbody holds significant ecological value for a desert-dominated metropolis, as water plays a vital role in shaping the city’s dynamics [42].
The land use change transfer matrix, as shown in Figure 4, provided insight into the transfer patterns among various land use categories in Aksu City. Over the last two decades (2000–2020), the total area of land use transfer in Aksu City amounted to 459.83 km2. Regarding specific transfers out, the largest area of grass and shrubland transferred out was 300.63 km2. Among these, the largest area was converted from grassland to cropland, totaling 282.24 km2; the area transferred to impervious was the second most, amounting to 9.04 km2; followed by forest, waterbody, and bare land, amounting to 2.93 km2, 2.16 km2, and 4.26 km2, respectively; and the areas transferred from cropland, forest, waterbody, impervious, and bare land were 6.42 km2, 40.50 km2, 10.82 km2, and 0.03 km2, respectively. Cropland is the key to maintaining national food security and economic security [43]. Aksu City, as an important grain-producing region in southern Xinjiang, adheres to the red line of cropland, so its cropland area has changed little, with a transferred area of only 6.42 km2. The total area of bare land that was transferred amounted to 101.43 km2. Among this, the majority, 76.22 km2, was allocated to cropland, while construction land accounted for 21.18 km2.

3.2. Spatial and Temporal Characteristics of the Value of Ecological Services

3.2.1. Calculation of the Value of Ecosystem Services

The standard equivalent value was calculated from one-seventh of the national average grain price in the current year [33]. The data for grain production and grain prices used in this study were obtained from the compilation of national agricultural cost and benefit statistics from previous years as well as the statistical yearbook of Aksu City. After accomplishing the necessary calculations and making the appropriate adjustments [44], the final standard equivalent value was found to be 1391.41 CNY/hm2. Table 2 shows the monetary value of ecological services per unit of land area in the research region between 2000 and 2020.
The values of ecosystem services in Aksu City (Table 3) in 2000, 2005, 2010, 2015, and 2020 were CNY 50.65 × 10⁸, CNY 49.18 × 10⁸, CNY 48.81 × 10⁸, CNY 47.07 × 10⁸, and CNY 47.24 × 10⁸. Table 3 shows a fluctuating and decreasing trend, which decreased by CNY 3.41 × 10⁸, a decline rate of 6.73%. In terms of the value of services provided by each type of land, grass and shrubland provided the largest ESV. The proportion of grass and shrubland ESVs in 2000, 2005, 2010, 2015, and 2020 accounted for 36.50%, 36.15%, 35.52%, 29.19%, and 28.88% of the total ESVs in Aksu City, respectively, and it could be found that the contribution of the grassland system was on a decreasing trend, but it still occupied an important position. The contribution amount of ESV from the cropland system was above 17%, the ESV value increased from CNY 9.10 × 10⁸ in 2000 to CNY 12.67 × 10⁸ in 2020, and its contribution rate to the ESV grew from 17.96% to 26.81%. The bare land ecosystem was also an important part of the ecosystem in Aksu City, and the average percentage of its ESV in all the years was more than 19.5%, with the ESVs of bare land in 2000, 2005, 2010, 2015, and 2020 being CNY 10.06 × 10⁸, CNY 10.04 × 10⁸, CNY 10.03 × 10⁸, CNY 10.01 × 10⁸, and CNY 9.97 × 10⁸, from which it could be seen that its ESV showed a decreasing trend and reached the minimum value in 2020. In general, despite covering a small portion of the land area, grassland had the highest ecological service value among the six land types due to its high value per unit area. On the other hand, bare land had a relatively low value per unit area, but it covered a significant portion of the land area in Aksu City, resulting in its second-highest total ecological service value among the six land types. Cropland, grass and shrubland, and bare land constituted the main body of the ESV in Aksu City, so the rational development and use of these three and the optimization of land use types are of greater research significance to enhance and improve the ESV in Aksu City.

3.2.2. Spatial Distribution of the Value of Ecological Services

In order to have a better understanding of the value of ecosystem services in Aksu City and a clearer understanding of the spatial distribution pattern of ESV in Aksu City, this paper was based on the grid scale combined with the centroid assignment method, and through the natural breakpoint grading method [45], the ESV of Aksu City was divided into five grades: low value (ESV < CNY 0.27 × 10⁶), lower value (CNY 0.27 × 10⁶ ≤ ESV < CNY 2.05 × 10⁶), medium value (CNY 2.05 × 10⁶ ≤ ESV < CNY 5.12 × 10⁶), higher value (CNY 5.12 × 10⁶ ≤ ESV < CNY 10.24 × 10⁶), and high value (ESV ≥ CNY 10.24 × 10⁶). Finally, the ESV distribution pattern of the cell grids was obtained in five different periods from 2000 to 2020 as distribution maps (Figure 5). The distribution pattern of ESV in Aksu City exhibited a tendency toward “overall dispersion and local staggering” in a general sense, with distinct limits for each class region but a certain regional mixture. The city’s ecological service value was primarily characterized by lower grades, which were primarily found in the desert area in the south of Aksu City and the pre-mountain desert area in the west. These grades accounted for an average area share of 74.18% over the five periods. The average proportion of the high-value area was 1.27%, mainly concentrated in the Aksu River, Palace Lake, Dolang Reservoir, and other important waters near the distribution of strips and blocks. Water ecosystems provide a higher amount of value through climate regulation, purification of the environment, hydrological regulation, and other functions, so the regions in which they were located had a higher ESV. The average proportion of the lower value area reached 74.18%, mainly focused on the distribution in Aksu City south and east of the desert and west of the pre-mountain desert area. The land use type in these three areas was mainly bare rocky soil, bare land, desert, etc.; this type of land’s productivity level was low, ecological vulnerability was greater, and the value of the ecological services provided was low. The average proportion of the low-value area was 7.13%, primarily concentrated in the central part of Aksu City and the industrial parks located in the eastern region (excluding the peripheral grid of the image). The distribution pattern indicated that the Aksu Industrial Park underwent initial development between 2010 and 2015, followed by gradual expansion and development from 2015 to 2020 [46]. The region experienced significant impacts from human activities, resulting in simplified, less diverse, and more complex ecosystems. Consequently, ecological functions such as climate regulation, air and water purification, and biodiversity maintenance were compromised. The spatial distribution of the medium-value zone exhibited a notable degree of concentration, primarily centered inside the city center and the eastern industrial park, with the exception of the upper boundary of the image. The medium-value zone distribution was relatively concentrated, primarily in the central alluvial plain area. Arable land dominated the area, with the provision of food resources serving as its primary ecological service value.

3.3. Spatial Differentiation Characteristics of Landscape Ecological Risk

The study area’s ecological risk class was categorized into five classes using the natural breakpoint approach [45]. These classes were ranked as follows: low risk (ERI < −0.016), lower risk (−0.016 ≤ ERI < 0.42), medium risk (0.42 ≤ ERI < 0.81), high risk (0.81 ≤ ERI < 1.15), and higher risk (ERI ≥ 1.15). By counting the areas of different ecological risk classes within different years (Table 4), it was found that the area of low ecological risk class in the study area gradually decreased between 2000 and 2020, reaching a minimum value of 0.07% in 2020. The lowest value, which represented 5.23% of the overall research area, exhibited a fluctuating, decreasing trend in high ecological risk areas. The transformation of grassland and bare land into permanent farmland occurred as a result of changes in the natural environment and man-made reclamation efforts [47]. This transformation led to an increase in the area of cropland, improved the coverage rate of cropland, and enhanced the capacity for land supply and services. However, it is important to note that these areas are now more heavily impacted by human activities compared to their original state. Consequently, there has been a certain expansion of areas with higher ecological risk.
During the five periods spanning from 2000 to 2020, the ecological risk index (ERI) of the entire Aksu region (Figure 6) was mostly characterized by areas classified as lower ecological risk and medium ecological risk. These areas constituted 87.65%, 87.86%, 87.92%, 86.88%, and 86.65% of the total area within the study area, respectively. Zones with low ecological risk, higher ecological risk, and high ecological risk accounted for smaller proportions of 0.07–0.11%, 5.23–6.63%, and 6.47–6.90%, respectively. Efforts to improve the ecological security pattern of the locality primarily focused on areas with higher ecological risk and high ecological risk. These two zones were more susceptible to expansion due to human activities, which was a significant factor in the study area’s ecological security pattern.
From Table 4, it can be seen that during the period of 2000–2020, the ecological risk in Aksu City kept relatively steady in terms of the mutual transformation between the classes and generally showed a tendency to shift to higher risk classes. In each ecological risk class, the area of the lower risk zone had the largest decrease, with a decrease of −0.90%; the area of the higher risk zone had the highest increase, with an increase of 1.30%; the second largest change was in the high-risk zone, with a decrease of −0.26%; and the areas of low- and medium-risk zones experienced little change, with decreases of −0.04% and −0.02%, respectively. As the average proportion of bare land in each land use type in Aksu City reached more than 80% and was mainly desert, with greater difficulty in development and utilization, the area where ecological risk transformation occurred was more concentrated, mainly distributed in the urban construction land on both sides of the Aksu River, cropland, as well as the Liuyuan Farm area in the eastern part of Aksu City. This has resulted in overall insignificant changes in the ecological risk zones across Aksu City, resulting in little variations in specific regions.

3.4. Analysis of the Correlation between the Value of Ecosystem Services and Ecological Risk

3.4.1. Quantitative Correlation

Scatter-axis whisker plots were created to represent the relationship between the ecosystem service value and the ecological risk index in the research area during five periods. A correlation analysis was conducted to examine the relationship between the two variables. The coefficients of the ecological service value and ecological risk index, as depicted in Figure 7, did not exhibit a clear normal distribution or linear relationship, instead, they displayed a moderately positive correlation. The correlation coefficients for the years 2000, 2005, 2010, 2015, and 2020 were 0.366, 0.368, 0.380, 0.366, and 0.364, with a significance level of 0.01, respectively. These results suggested a statistically significant link between the environmental service value and the ecological risk index.

3.4.2. Temporal Correlation

Temporal correlation analysis was performed on a dataset consisting of 3706 evaluation cells. The analysis involved superimposing the results of changes in ecosystem service value and ecological risk index between two consecutive periods. This allowed for the statistical analysis of the number of evaluation cells as well as the intensity of ecological risk at each time and its influence on the changes in ecosystem service value. The findings are presented in Table 5.
According to the data presented in Table 5, it can be observed that the quantity of cells exhibiting a decline in ecological service value per unit area exceeded the quantity of cells displaying an increase in ecological service value per unit area across all ecological risk levels during the four time periods. Furthermore, a significant proportion of the total cells, exceeding 80%, maintained an unchanged ecological service value throughout the four time periods. At the lower risk level, the relationship between ecosystem service value and ecological risk intensity remained largely unchanged, accounting for 98.18% of the variation. This could be attributed to the concentration of lower risk areas in the enclaves in the southern region of Aksu City and the Gobi area in the eastern region. These areas experienced fewer human activities and external interference, resulting in a more stable overall ecosystem service value. Conversely, in higher risk areas, the response of ecosystem service value per unit remained largely unchanged and decreased, with a significant proportion of unchanged and decreased ecoservice value per unit. The response to ecological risk classes remained largely unchanged and was reduced, representing 79.46% and 17.70% of the total, respectively. Over the period from 2000 to 2020, there has been a gradual decrease in the number of changes in the response for each ecological risk class. This suggests that the ecological environment in the region is gradually stabilizing. Typically, regions with low-level ecological risk exhibit a consistent trajectory in the value of ecological services, whereas locations with high-level ecological risk tend to have a declining trend in the value of such services.

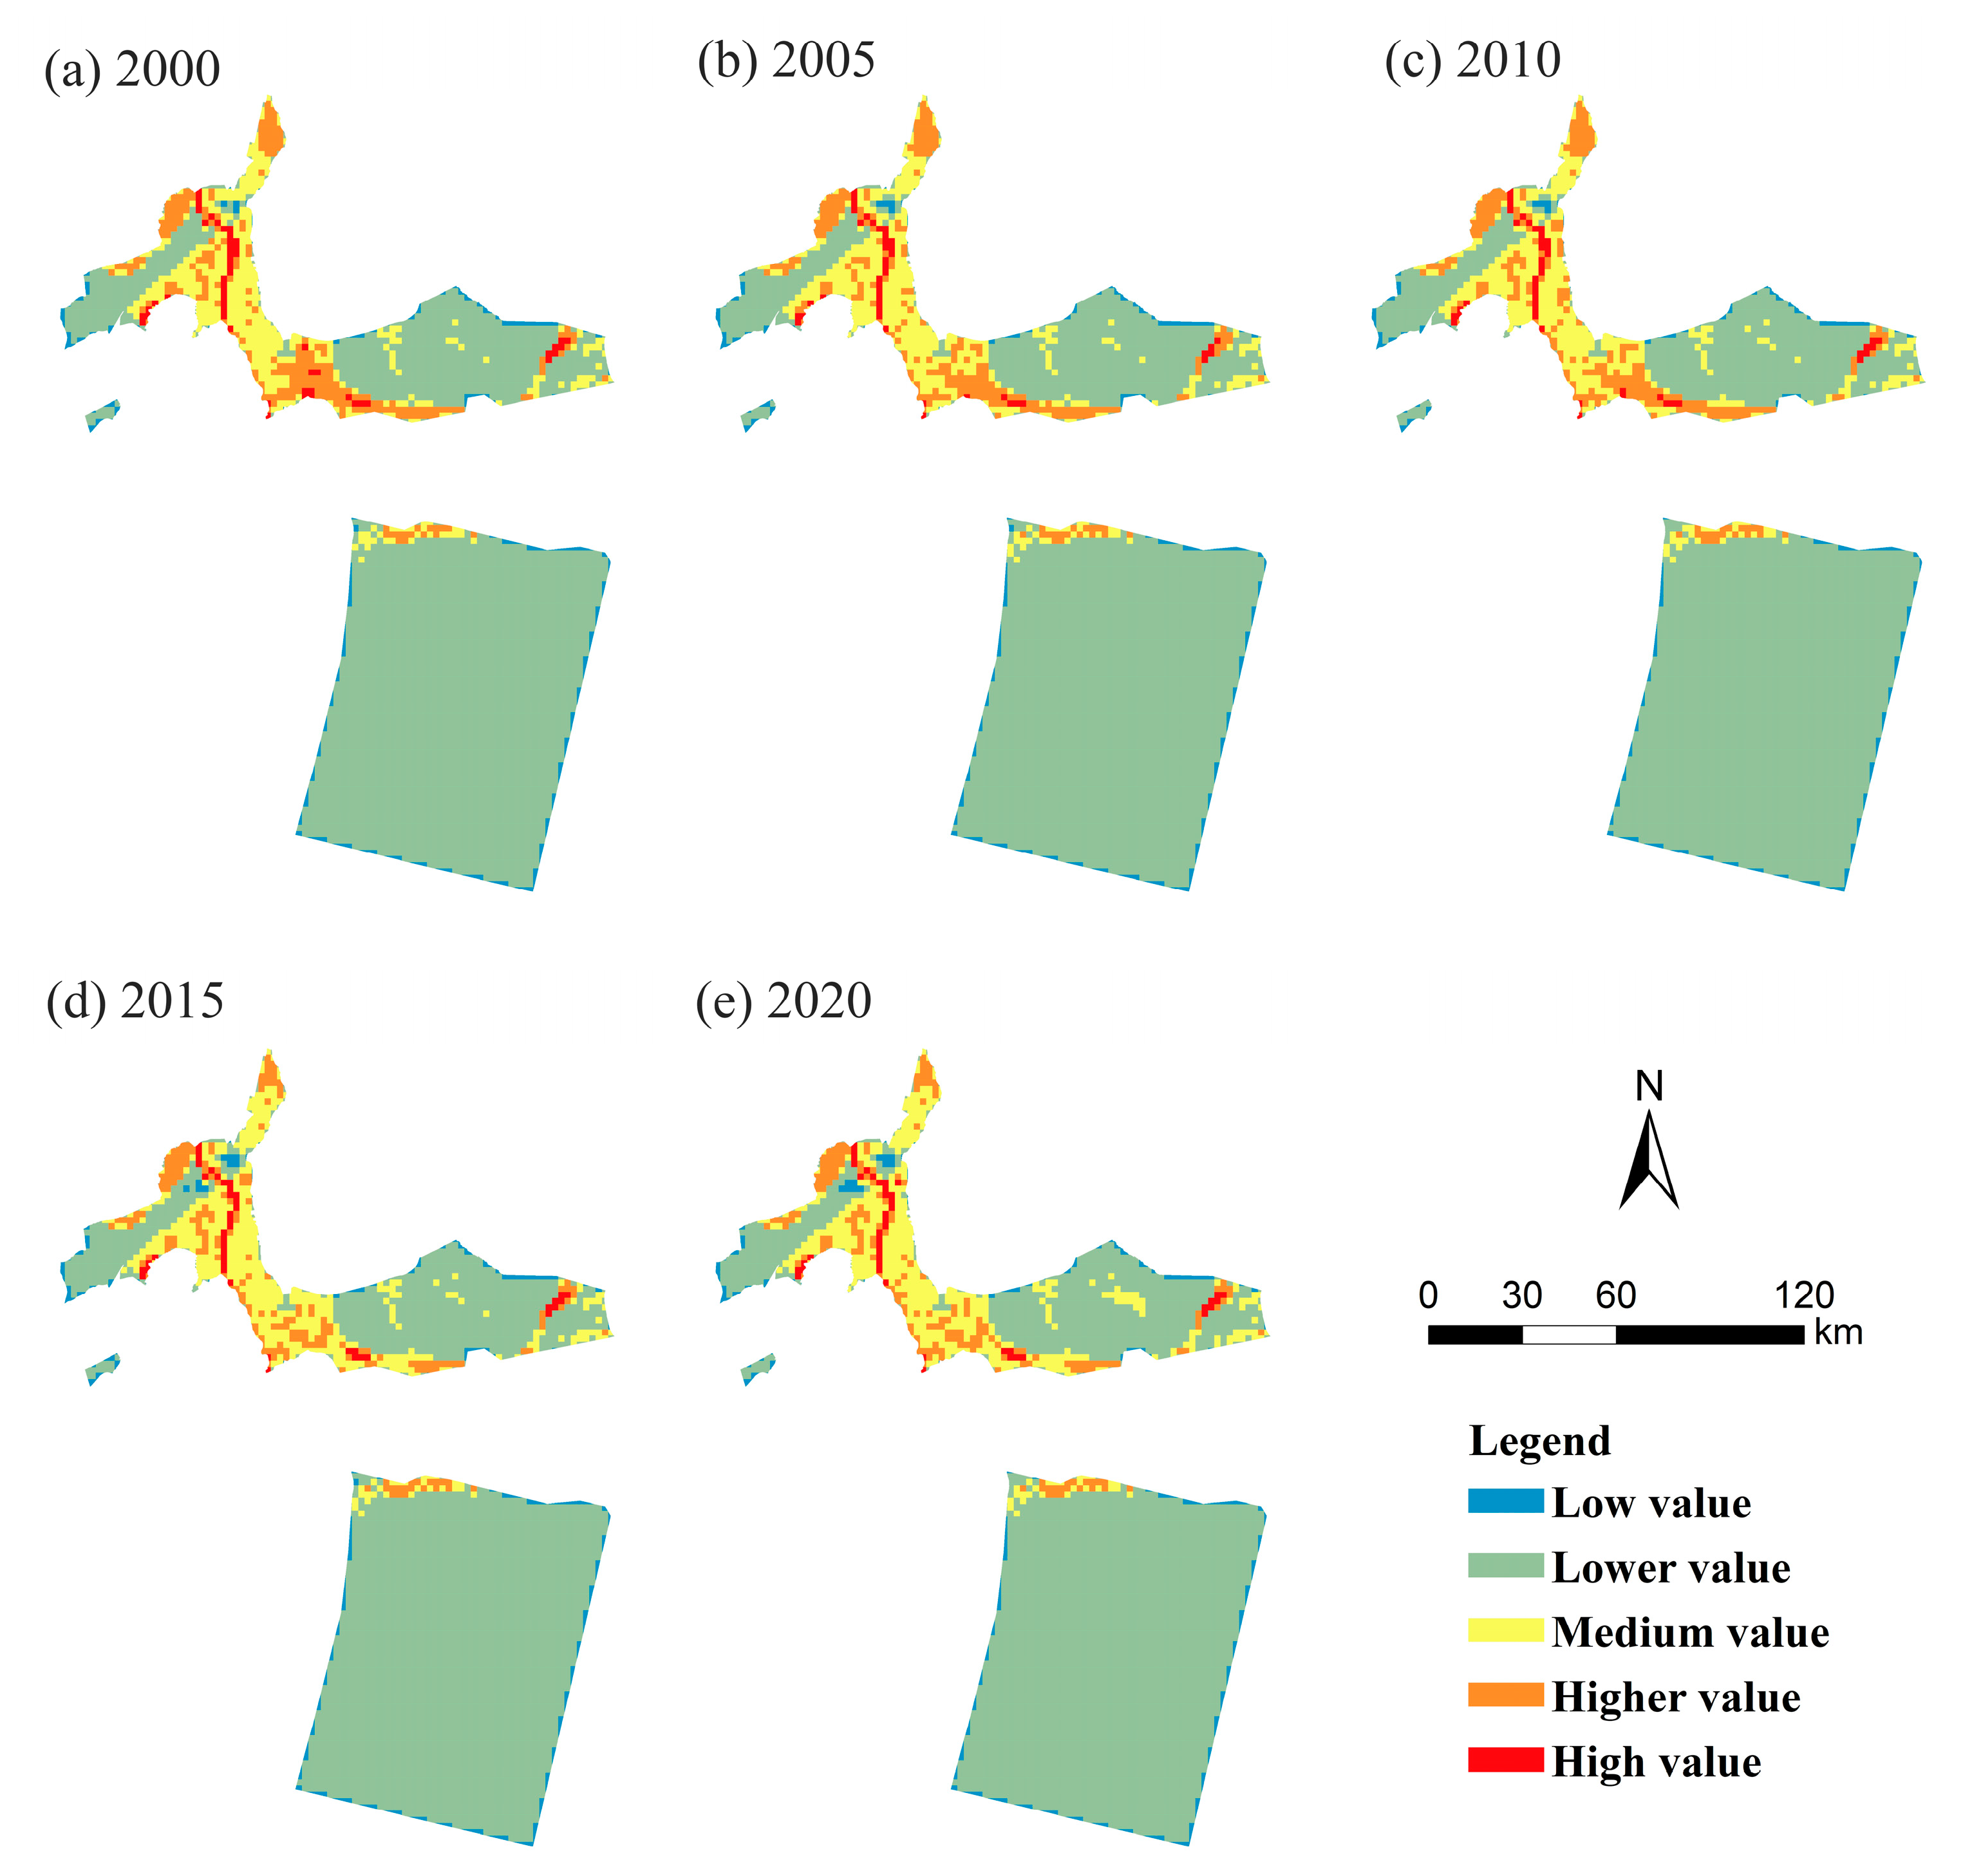
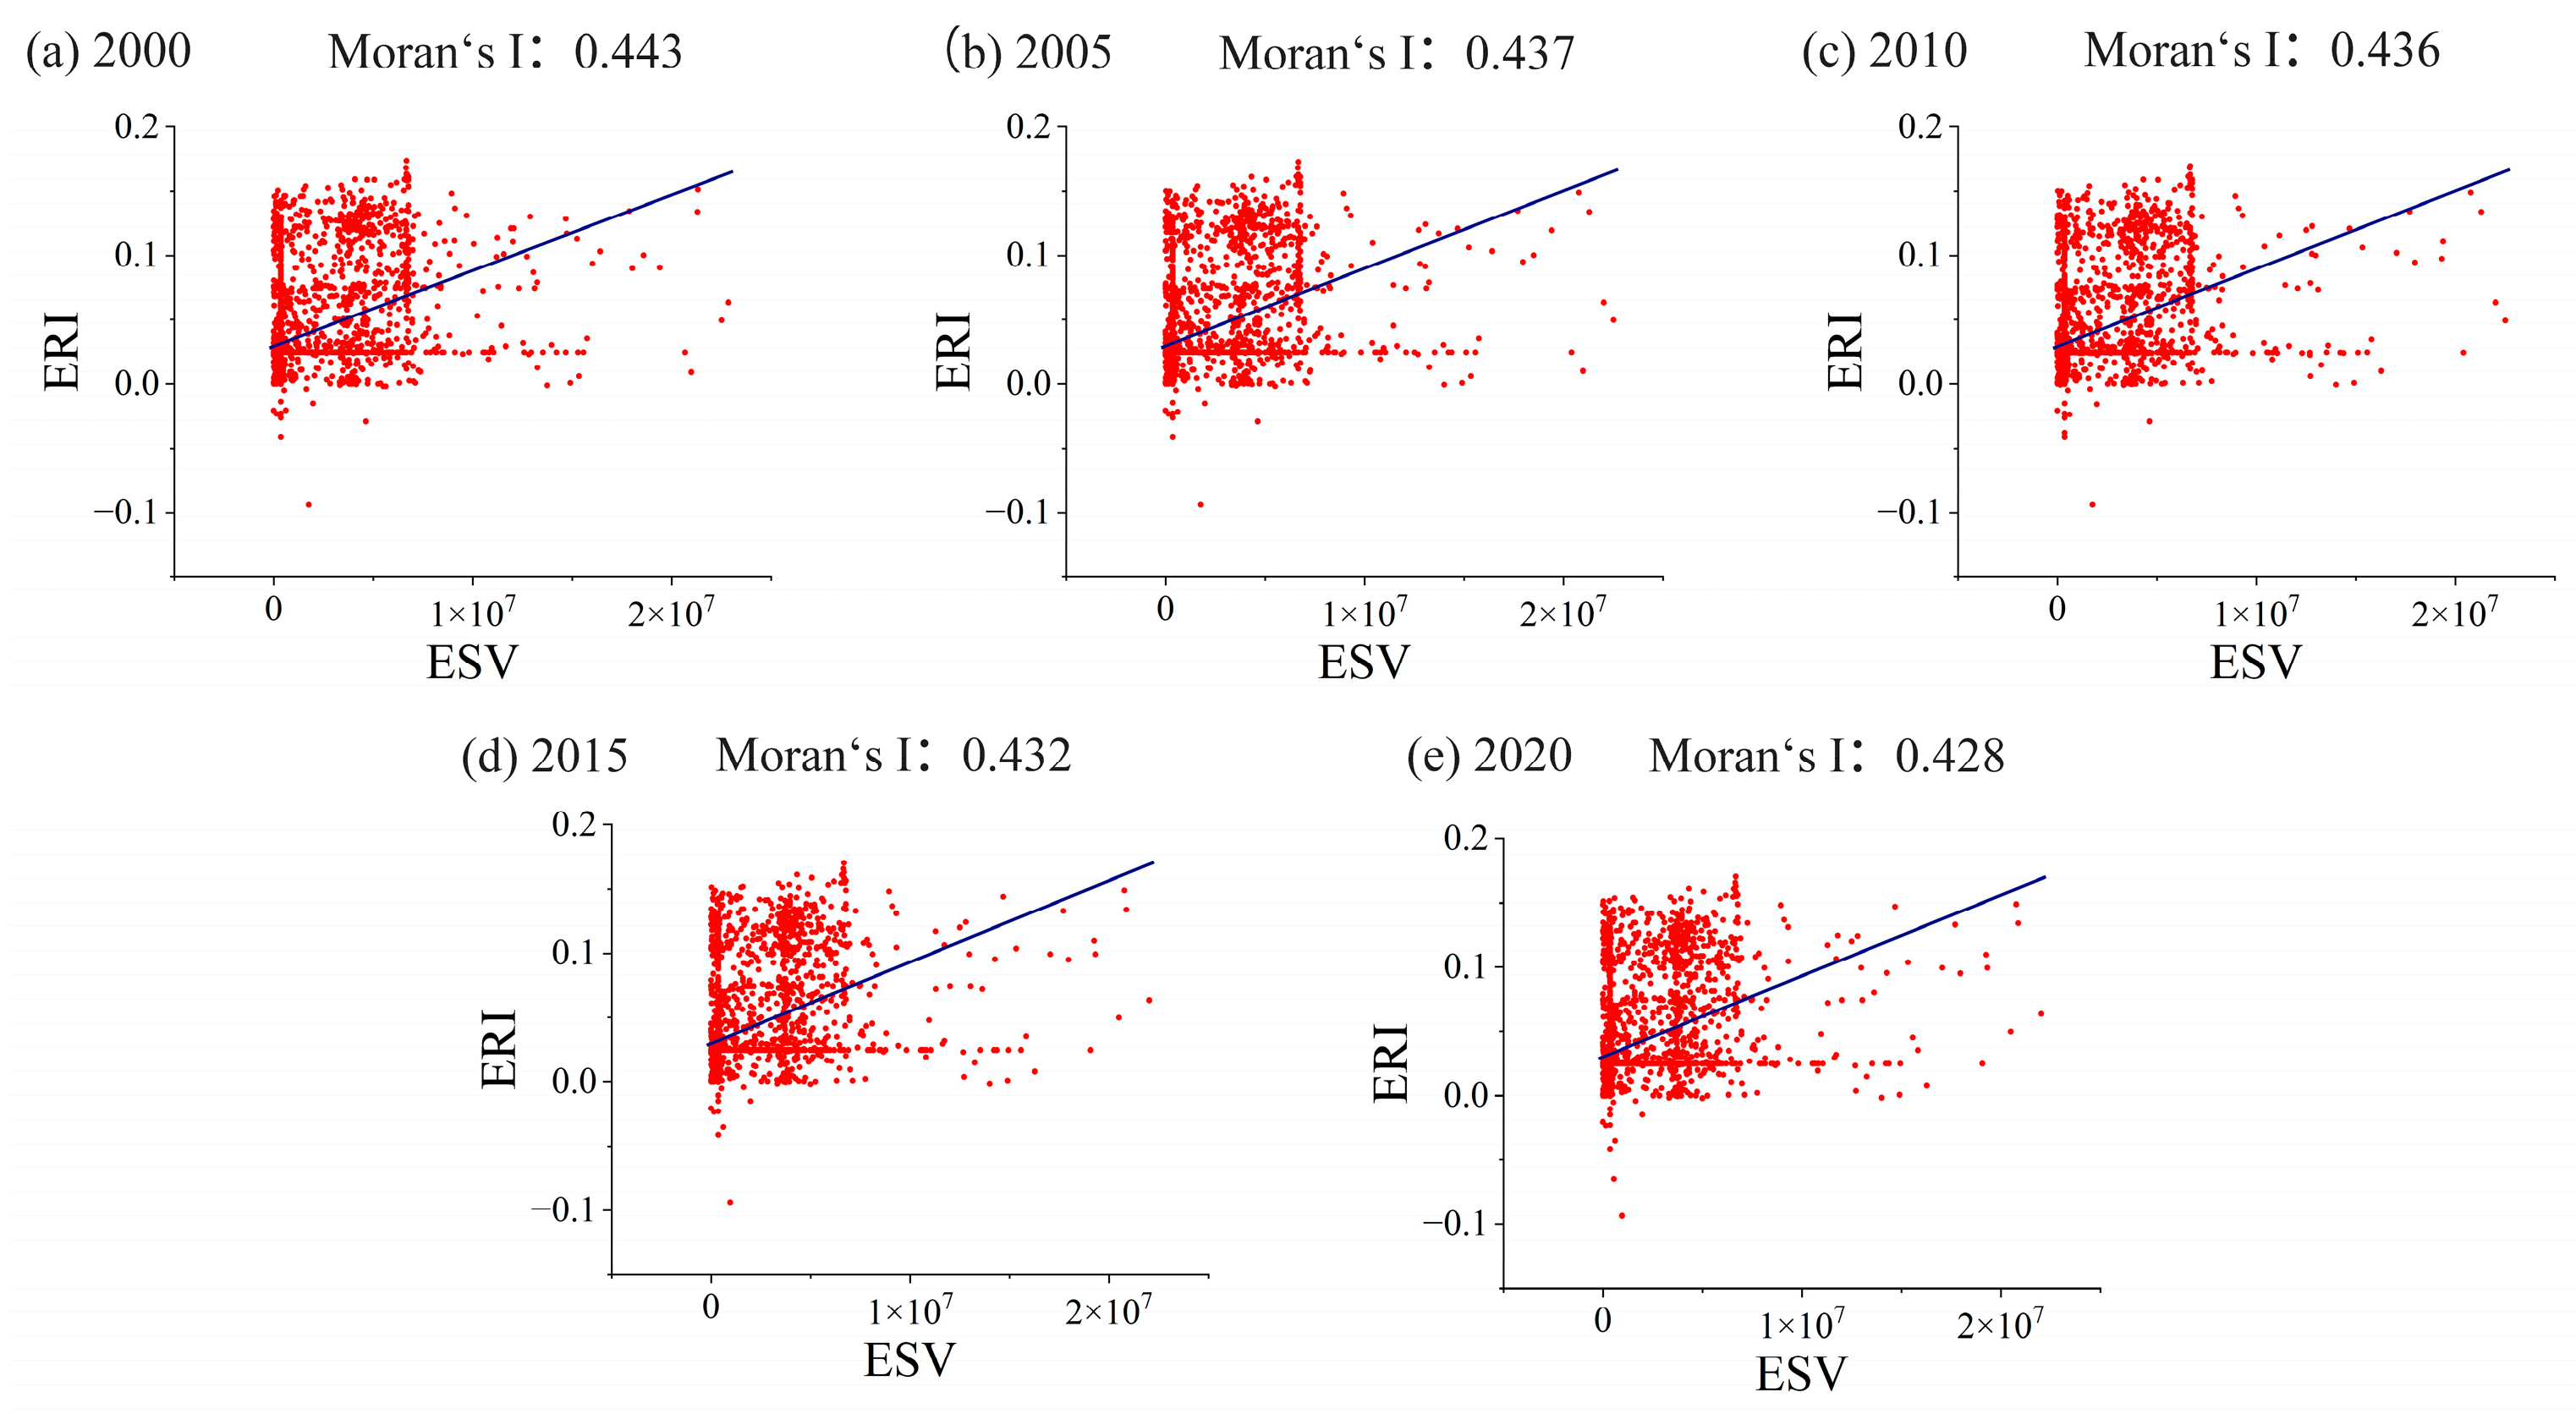
3.4.3. Spatial Correlation

The findings, as depicted in Figure 8, revealed that the Moran’s I index values for the years 2000 to 2020 were 0.443, 0.437, 0.436, 0.432, and 0.428, respectively. The results of the analysis indicated a strong positive spatial correlation between ESV (ecosystem service value) and ERI (ecological risk index) in the designated study area. This indicated a clear connection between the value of ecosystem services and the level of ecological risk. Over the period of 20 years, Moran’s I index showed a declining trend, indicating a steady reduction in the spatial aggregation of ecological risk and a decrease in the spatial heterogeneity caused by changes in the use of land.
The local spatial autocorrelation LISA map (Figure 9) revealed that the central and northern regions of the study area exhibited a stronger spatial correlation between ESV and ERI. This correlation could be categorized into five groups: high service value-high ecological risk (H–H), low service value-high ecological risk (L–H), high service value-low ecological risk (H–L), low service value-low ecological risk (L–L), and not significant (N).
The region characterized by high service value and high ecological risk was mostly concentrated in the city center of Aksu City and its adjacent townships. This zone was organized in contiguous blocks. The research area had a lower distribution of high service value-low ecological risk zones, which were dispersed throughout the entirety of the region. Areas with low service value and high ecological risk were primarily found in close proximity to areas with high service value and high ecological risk. This was due to the fact that the value of their ecological services was constrained by the convergence of high-value landscapes and their unique geographic characteristics. Consequently, the overall number of areas falling within this category was relatively small. The low service value-low ecology zone was primarily concentrated in the enclave area in the southern region of Aksu City. This area was situated in the interior of the Taklamakan Desert and had limited connectivity to the outside world. Simultaneously, the internal ecology in this area was relatively uniform and primarily composed of desert types. This characteristic contributed to the area’s relatively stable condition and low level of ecological risk. The area that lacked significance was mostly found in the southern enclave and the eastern Gobi region of the research area, constituting about 74% of the total area. This area was characterized by deserts, arid landscapes, and other unutilized terrain, which was concentrated in patches.

4. Discussion

During the period of 2000–2020, the ecological service value of Aksu City showed a decreasing trend while the ecological risk increased, but in general, the magnitude of change in both values was small, indicating that the local ecological security did not have a significant deterioration trend. Because Aksu City is located in a typical mountain-oasis-desert ecosystem in the arid zone, its land use pattern and spatial change pattern are different from those of other scholars’ studies. For example, Kang, P. et al. studied the Beijing-Tianjin-Hebei coastal plain area [48], Xu, X. et al. studied the Taihu Lake basin [49], and Xing, L. et al. studied Hubei Province, China [50], all of which are economically developed plain areas with high human activities and large land use changes. However, Aksu City is located in an inland area, showing typical characteristics of the arid zone [51], and bare land accounts for a larger part of the whole study area, resulting in a larger proportion of the area being closely related to it in terms of lower ecological risk and lower ecological service value. At the same time, the southern desert region is primarily characterized by sand, Gobi, and saline land due to its local geographical location and natural environment. This region lacks water sources and experiences fewer human activities compared to the central oasis region. Consequently, there have been minimal land use changes in this region over the past two decades.
From the analysis of the value–risk correlation agglomeration area [52], we can rationally allocate resources from the following aspects to promote the construction of the local ecological security pattern [53]:
(1)
The areas along the Aksu River and the surrounding areas are high value-high risk agglomeration areas, and in the whole mountain-oasis-desert ecosystem, the three land use types contributing to high ecological service value, namely woodland, grassland, and waterbody, account for less, so that the river and its cultivated land become the main ecological service value contributors. However, since Aksu City is the main grain-producing area in the southern border region and bears a large amount of the red line of cropland, the region has become a major ecological service contributor due to the focus on promoting green agriculture [54], leading to comprehensive land improvements being carried out in the whole region promoting the optimization of farmland ecosystems [55] and highlighting the value of the provisioning services in cropland ecosystems [56], and at the same time, guarding against the sources of risk [57], establishing a risk early-warning mechanism, preventing sudden natural disasters [58], and reinforcing the barriers of ecological security patterns [59].
(2)
Part of the high value-high risk area is intersected with the northern mountainous Gobi, which is a sandy and windy area where land fertility is depleting [60], the quality of the soil environment is declining, and there are many desertification and soil salinization phenomena; therefore, soil erosion should be controlled as much as possible in the area [61], so as to achieve the protection and rational use of soil and water resources and realize the sustainable development of the economy and society [62]. There is also a need to prevent the expansion of desertification [63], and the region’s proximity to oases and its windy weather make it susceptible to sand and dust storms, which can have an impact on the lives of townspeople.
(3)
Insignificant and low value-low risk zone: The region of concern exhibits low-value ecosystem services and a low level of ecological risk. It is the largest area within the study area and is primarily composed of a desert ecosystem. Furthermore, it is identified as an area in need of mainly ecological improvement. In order to promote local socio-economic development, it is imperative to effectively control and reduce desertification in this region. It is crucial to protect this sort of region and implement effective methods to combat desertification. This can be achieved by government support in developing vegetation in sandy areas and implementing eco-industrial projects to manage desertification [57].
(4)
The high value-low risk aggregation area has significant ecological service value per unit area and a low ecological risk rating, which makes it a crucial ecological safety zone for the study area. The region is predominantly characterized by rivers and grasslands, which play a crucial role in providing vital ecological services. The ecological service function of the region can be preserved and enhanced while mitigating ecological risks by establishing protection zones [64] and implementing other measures.
In general, human activities such as the expansion of urban areas, agricultural practices, and so on result in changes in the value of ecological services, which then in effect influence variations in ecological risk [65]. Targeted actions to control changes in ecological risk in line with the characteristics of each ecosystem region are critical for the sustainable development of mountain-oasis-desert ecosystems. Mountain-oasis-desert ecosystems have high ecosystem risk but low service value, so the protection of ecosystem service provision does not protect the ecosystem completely. Meanwhile, urban construction and production activities are carried out in this area; thus, infrastructure should be built scientifically and rationally because the oasis area has a high tendency to expand under the influence of human activities, which makes it easy to adversely affect the ecological risk pattern of the area. In addition, because the oasis area is vulnerable to desertification in this type of ecosystem, comprehensive consideration of the city’s planning and construction scale is necessary [66]. Water resources play a crucial role in the creation and development of oases, and in the development process of mountain-oasis-desert ecosystem cities, water resources must be insisted upon as the biggest stiff limitation in order to mitigate the mismatch between supply and demand for water resource regulation in oasis and desert areas [66]. To reduce the influence of human intervention on the aquatic environment, it is necessary to build drinking water source protection zones, wetland parks, and to increase the protection of waterbodies such as rivers, lakes, and reservoirs. In order to achieve the effective use of water resources, water-saving irrigation methods, such as drip irrigation, can be being promoted concurrently. The desert is another significant element of the mountain-oasis-desert ecosystem. It makes up an important part of the system and is mainly linked to the oasis region. The area where the desert and oasis connect is particularly sensitive to human activity, and it is very easy for sand dunes to encroach on the oasis. For these reasons, it is essential that, in the mountain-oasis-desert ecosystem, prevention and control of wind-sand and an integrated sand prevention system are established for the area [67].
There are also some limitations in this study. In the mountain-oasis-desert ecosystem, protection forests are usually provided within cropland in the oasis region, which is usually smaller in size and less continuous, and the area of forested land was not counted in the land classification, which ignores specific conditions in the ecosystem [68]. And the indicators of ecosystem service value and ecological risk alone do not comprehensively evaluate the ecological pattern within the region. In the future, different methods should be used to account for the value of ecological services and the ecological risk index, describing the changes in the value of ecological services and the ecological risk index based on multiple perspectives, such as social, economic, and natural aspects.

5. Conclusions

With regard to the global effort to achieve sustainable development, it is crucial to have a complete and accurate comprehension of the way ecosystems function and change. This understanding is essential for the scientific advancement of ecological environmental protection. This study focuses on Aksu City in northwest China and examines the relationship between ecological service value and ecological risk index. By exploring the correlation between the value of ecological services and ecological riskiness, the area was assessed and graded in degrees. The findings gained from this study are as follows:
(1)
The most prevalent land use type in Aksu City is bare land, which forms the primary component of the characteristic mountain-oasis-desert ecological system. The total area of bare land in Aksu City exceeds 81% of the city’s total land area. Between 2000 and 2020, the city experienced a land use transfer of 459.83 km2.
(2)
From 2000 to 2020, the general value of ecosystem services in Aksu City exhibited a consistent decline, starting at CNY 50.65 × 10⁸ and reaching CNY 47.24 × 10⁸. This decline was relatively stable, with an average annual decline rate of 0.34%.
(3)
The ERI index of Aksu City during the designated study period exhibited a fluctuating upward trend, which indicated that the ecological security situation has a tendency to deteriorate. The study area exhibited a continuous and concentrated distribution of higher risk and high-risk locations, a random distribution of low-risk and medium-risk areas, and a piecemeal distribution of lower risk areas.
(4)
There exists a positive spatial correlation between the ecological service value (ESV) and ecological risk index (ERI) in Aksu City. Additionally, there was an observed in-crease in the area of high-value and high-risk zones between 2000 and 2020. These zones were primarily concentrated in urban construction land and cultivated land within the study area.

Author Contributions

Conceptualization, W.L. and Y.M.; methodology, W.L. and Y.M.; software, W.L.; validation, W.L. and Y.M.; formal analysis, W.L.; investigation, W.L.; resources, W.L.; data curation, W.L.; writing—original draft preparation, W.L.; writing—review and editing, W.L.; visualization, W.L.; supervision, W.L.; project administration, Y.Z.; funding acquisition, Y.L. All authors have read and agreed to the published version of the manuscript.

Funding

This study was supported by the Basic Resource Investigate Project of the Ministry of Science and Technology: Investigation and evaluation of agricultural water resource utilization efficiency and water-saving potential in the Turpan-Hami Basin (2022xjkk1103).

Institutional Review Board Statement

Not applicable.

Informed Consent Statement

Not applicable.

Data Availability Statement

The datasets used and/or analyzed during the current study are available from the corresponding author upon reasonable request.

Acknowledgments

The authors express gratitude to the anonymous reviewers for their helpful feedback on enhancing this research.

Conflicts of Interest

The authors declare no conflicts of interest.

References

  1. Costanza, R.; d’Arge, R.; De Groot, R.; Farber, S.; Grasso, M.; Hannon, B.; Limburg, K.; Naeem, S.; O’Neill, R.V.; Paruelo, J.; et al. The Value of the World’s Ecosystem Services and Natural Capital. Nature 1997, 387, 253–260. [Google Scholar] [CrossRef]
  2. European Commission; Joint Research Centre; Institute for Environment and Sustainability. Mapping and Assessment of Ecosystems and Their Services: Trends in Ecosystems and Ecosystem Services in the European Union between 2000 and 2010; Publications Office: Luxembourg, 2015. [Google Scholar]
  3. Reid, W.V. Millennium Ecosystem Assessment: Ecosystems and Human Well-Being; 2005; ISBN 978-1-59726-040-4. Available online: https://www.wri.org/research/millennium-ecosystem-assessment-ecosystems-and-human-well-being (accessed on 6 April 2024).
  4. Xia, S.; Liu, Y.; Yu, X.; Fu, B. Challenges in Coupling LTER with Environmental Assessments: An Insight from Potential and Reality of the Chinese Ecological Research Network in Servicing Environment Assessments. Sci. Total Environ. 2018, 633, 1302–1313. [Google Scholar] [CrossRef] [PubMed]
  5. Jiang, W.; Lü, Y.; Liu, Y.; Gao, W. Ecosystem Service Value of the Qinghai-Tibet Plateau Significantly Increased during 25 Years. Ecosyst. Serv. 2020, 44, 101146. [Google Scholar] [CrossRef]
  6. Fu, B.; Li, Y.; Wang, Y.; Zhang, B.; Yin, S.; Zhu, H.; Xing, Z. Evaluation of Ecosystem Service Value of Riparian Zone Using Land Use Data from 1986 to 2012. Ecol. Indic. 2016, 69, 873–881. [Google Scholar] [CrossRef]
  7. Zang, Z.; Zou, X.; Zuo, P.; Song, Q.; Wang, C.; Wang, J. Impact of Landscape Patterns on Ecological Vulnerability and Ecosystem Service Values: An Empirical Analysis of Yancheng Nature Reserve in China. Ecol. Indic. 2017, 72, 142–152. [Google Scholar] [CrossRef]
  8. Jacobides, M.G.; Cennamo, C.; Gawer, A. Towards a Theory of Ecosystems. Strateg. Manag. J. 2018, 39, 2255–2276. [Google Scholar] [CrossRef]
  9. Granstrand, O.; Holgersson, M. Innovation Ecosystems: A Conceptual Review and a New Definition. Technovation 2020, 90–91, 102098. [Google Scholar] [CrossRef]
  10. Sun, D.; Zhang, J.; Zhu, C.; Hu, Y.; Zhou, L. An Assessment of China’s Ecological Environment Quality Change and Its Spatial Variation. Acta Geograph. Sin. 2012, 67, 1599–1610. [Google Scholar] [CrossRef]
  11. Jia, Y.; Tang, X.; Liu, W. Spatial–Temporal Evolution and Correlation Analysis of Ecosystem Service Value and Landscape Ecological Risk in Wuhu City. Sustainability 2020, 12, 2803. [Google Scholar] [CrossRef]
  12. Li, J.; Sun, W.; Li, M.; Meng, L. Coupling Coordination Degree of Production, Living and Ecological Spaces and Its Influencing Factors in the Yellow River Basin. J. Clean. Prod. 2021, 298, 126803. [Google Scholar] [CrossRef]
  13. Xu, K.; Wang, J.; Wang, J.; Wang, X.; Chi, Y.; Zhang, X. Environmental Function Zoning for Spatially Differentiated Environmental Policies in China. J. Environ. Manag. 2020, 255, 109485. [Google Scholar] [CrossRef] [PubMed]
  14. Gao, X.; Shen, J.; He, W.; Zhao, X.; Li, Z.; Hu, W.; Wang, J.; Ren, Y.; Zhang, X. Spatial-Temporal Analysis of Ecosystem Services Value and Research on Ecological Compensation in Taihu Lake Basin of Jiangsu Province in China from 2005 to 2018. J. Clean. Prod. 2021, 317, 128241. [Google Scholar] [CrossRef]
  15. Darvill, R.; Lindo, Z. The Inclusion of Stakeholders and Cultural Ecosystem Services in Land Management Trade-off Decisions Using an Ecosystem Services Approach. Landsc. Ecol. 2016, 31, 533–545. [Google Scholar] [CrossRef]
  16. Lautenbach, S.; Kugel, C.; Lausch, A.; Seppelt, R. Analysis of Historic Changes in Regional Ecosystem Service Provisioning Using Land Use Data. Ecol. Indic. 2011, 11, 676–687. [Google Scholar] [CrossRef]
  17. Daily, G.C.; Söderqvist, T.; Aniyar, S.; Arrow, K.; Dasgupta, P.; Ehrlich, P.R.; Folke, C.; Jansson, A.; Jansson, B.-O.; Kautsky, N.; et al. The Value of Nature and the Nature of Value. Science 2000, 289, 395–396. [Google Scholar] [CrossRef] [PubMed]
  18. Xie, G.; Lu, C.; Leng, Y.; Zheng, D.; Li, S. Ecological assets valuation of the Tibetan Plateau. J. Nat. Resour. 2003, 18, 189–196. [Google Scholar] [CrossRef]
  19. Kang, N.; Hou, L.; Huang, J.; Liu, H. Ecosystem Services Valuation in China: A Meta-Analysis. Sci. Total Environ. 2022, 809, 151122. [Google Scholar] [CrossRef] [PubMed]
  20. Xie, G.; Zhang, C.; Zhang, L.; Chen, W.; Li, S. Improvement of the Evaluation Method for Ecosystem Service Value Based on Per Unit Area. J. Nat. Resour. 2015, 30, 1243–1254. [Google Scholar] [CrossRef]
  21. Xie, G.; Xiao, Y.; Zhen, L.; Lu, C. Study on ecosystem services value of food production in China. Chin. J. Eco-Agric. 2005, 13, 10–13. [Google Scholar]
  22. Xie, G.; Zhen, L.; Lu, C.; Xiao, Y.; Chen, C. Expert Knowledge Based Valuation Method of Ecosystem Services in China. J. Nat. Resour. 2008, 23, 911–919. [Google Scholar] [CrossRef]
  23. Piet, G.J.; Knights, A.M.; Jongbloed, R.H.; Tamis, J.E.; de Vries, P.; Robinson, L.A. Ecological Risk Assessments to Guide Decision-Making: Methodology Matters. Environ. Sci. Policy 2017, 68, 1–9. [Google Scholar] [CrossRef]
  24. Perrodin, Y.; Boillot, C.; Angerville, R.; Donguy, G.; Emmanuel, E. Ecological Risk Assessment of Urban and Industrial Systems: A Review. Sci. Total Environ. 2011, 409, 5162–5176. [Google Scholar] [CrossRef] [PubMed]
  25. Li, J.; Gao, M. Spatiotemporal evolution and correlation analysis of ecosystem service values and ecological risk in Binzhou. Acta Ecol. Sin. 2019, 39, 7815–7827. [Google Scholar] [CrossRef]
  26. Zhang, J.; Qin, G.; Cheng, S.; Wen, Y. Spatiotemporal Changes and Correlation Between Landscape Ecological Risk and Ecological Service Value in Hanjiang Eco-economic Belt. Bull. Soiland Water Conserv. 2023, 43, 294–306. [Google Scholar] [CrossRef]
  27. Kang, P.; Chen, W.; Wang, M. Advances in ecosystem service based ecological risk assessment. Acta Ecol. Sin. 2016, 36, 1192–1203. [Google Scholar] [CrossRef]
  28. Mamat, A.; Wang, J.; Ma, Y. Impacts of Land-Use Change on Ecosystem Service Value of Mountain–Oasis–Desert Ecosystem: A Case Study of Kaidu–Kongque River Basin, Northwest China. Sustainability 2020, 13, 140. [Google Scholar] [CrossRef]
  29. Qiao, B.; Cao, X.; Sun, W. Ecological Zoning Identification and Optimization Strategies Based on Ecosystem Service Value and Landscape Ecological Risk: Taking Qinghai Area of Qilian Mountain National Park as an Example. Acta Ecol. Sin. 2023, 43, 986–1004. [Google Scholar] [CrossRef]
  30. ICS:07.040; Current Land Use Classification. Standardization Administration of China (SAC): Beijing, China, 2017.
  31. Oliver, M.A.; Webster, R. Kriging: A Method of Interpolation for Geographical Information Systems. Int. J. Geogr. Inf. Syst. 1990, 4, 313–332. [Google Scholar] [CrossRef]
  32. Xiao, J.; Qiao, B.; Chen, H.; Shi, F.; Cao, X.; Zhu, C. Land use change and evolution of ecosystem service value in Maduo County of source region of the Yellow River. Acta Ecol. Sin. 2020, 40, 510–521. [Google Scholar] [CrossRef]
  33. Wang, Y.; Dai, E.; Yin, L.; Ma, L. Land Use/Land Cover Change and the Effects on Ecosystem Services in the Hengduan Mountain Region, China. Ecosyst. Serv. 2018, 34, 55–67. [Google Scholar] [CrossRef]
  34. Gao, B.; Li, C.; Wu, M.; Zheng, K.; Wu, Y. Landscape ecological risk assessment and influencing factors in ecological conservation area in Sichuan-Yunnan provinces, China. Chin. J. Appl. Ecol. 2021, 32, 1603–1613. [Google Scholar] [CrossRef] [PubMed]
  35. Xie, H.; Wang, P.; Huang, H. Ecological Risk Assessment of Land Use Change in the Poyang Lake Eco-Economic Zone, China. Int. J. Environ. Res. Public Health 2013, 10, 328–346. [Google Scholar] [CrossRef] [PubMed]
  36. Liu, Y.; Hou, X.; Li, X.; Song, B.; Wang, C. Assessing and Predicting Changes in Ecosystem Service Values Based on Land Use/Cover Change in the Bohai Rim Coastal Zone. Ecol. Indic. 2020, 111, 106004. [Google Scholar] [CrossRef]
  37. Xiao, R.; Lin, M.; Fei, X.; Li, Y.; Zhang, Z.; Meng, Q. Exploring the Interactive Coercing Relationship between Urbanization and Ecosystem Service Value in the Shanghai–Hangzhou Bay Metropolitan Region. J. Clean. Prod. 2020, 253, 119803. [Google Scholar] [CrossRef]
  38. Zhu, R.; Chen, S. Spatial relationship between landscape ecological risk and ecosystem service value in Fujian Province, China during 1980–2020. Chin. J. Appl. Ecol. 2022, 33, 1599–1607. [Google Scholar] [CrossRef] [PubMed]
  39. Ren, H.; Shang, Y.; Zhang, S. Measuring the Spatiotemporal Variations of Vegetation Net Primary Productivity in Inner Mongolia Using Spatial Autocorrelation. Ecol. Indic. 2020, 112, 106108. [Google Scholar] [CrossRef]
  40. Zhang, Y.; Rashid, A.; Guo, S.; Jing, Y.; Zeng, Q.; Li, Y.; Adyari, B.; Yang, J.; Tang, L.; Yu, C.-P.; et al. Spatial Autocorrelation and Temporal Variation of Contaminants of Emerging Concern in a Typical Urbanizing River. Water Res. 2022, 212, 118120. [Google Scholar] [CrossRef] [PubMed]
  41. Wang, T.; Zhou, D.; Shen, X.; Fan, G.; Zhang, H. Koppen’s climate classification map for China. J. Meteorol. Sci. 2020, 40, 752–760. [Google Scholar] [CrossRef]
  42. Makanda, K.; Nzama, S.; Kanyerere, T. Assessing the Role of Water Resources Protection Practice for Sustainable Water Resources Management: A Review. Water 2022, 14, 3153. [Google Scholar] [CrossRef]
  43. Liang, X.; Jin, X.; Han, B.; Sun, R.; Xu, W.; Li, H.; He, J.; Li, J. China’s Food Security Situation and Key Questions in the New Era: A Perspective of Farmland Protection. J. Geogr. Sci. 2022, 32, 1001–1019. [Google Scholar] [CrossRef]
  44. Hou, L.; Wu, F.; Xie, X. The Spatial Characteristics and Relationships between Landscape Pattern and Ecosystem Service Value along an Urban-Rural Gradient in Xi’an City, China. Ecol. Indic. 2020, 108, 105720. [Google Scholar] [CrossRef]
  45. Li, L.; Huang, X.; Wu, D.; Wang, Z.; Yang, H. Optimization of Ecological Security Patterns Considering Both Natural and Social Disturbances in China’s Largest Urban Agglomeration. Ecol. Eng. 2022, 180, 106647. [Google Scholar] [CrossRef]
  46. Cao, Y.; Jiang, Y.; Feng, L.; Shi, G.; He, H.; Yang, J. Identification of Territorial Spatial Pattern Conflicts in Aksu River Basin, China, from 1990 to 2020. Sustainability 2022, 14, 14941. [Google Scholar] [CrossRef]
  47. Tian, Y. Cropland-Grassland Use Conversions in the Agro-Pastoral Areas of the Tibetan Plateau: Spatiotemporal Pattern and Driving Mechanisms. Ecol. Indic. 2023, 146, 109819. [Google Scholar] [CrossRef]
  48. Kang, P.; Chen, W.; Hou, Y.; Li, Y. Linking Ecosystem Services and Ecosystem Health to Ecological Risk Assessment: A Case Study of the Beijing-Tianjin-Hebei Urban Agglomeration. Sci. Total Environ. 2018, 636, 1442–1454. [Google Scholar] [CrossRef]
  49. Xu, X.; Yang, G.; Tan, Y.; Zhuang, Q.; Li, H.; Wan, R.; Su, W.; Zhang, J. Ecological Risk Assessment of Ecosystem Services in the Taihu Lake Basin of China from 1985 to 2020. Sci. Total Environ. 2016, 554–555, 7–16. [Google Scholar] [CrossRef] [PubMed]
  50. Xing, L.; Hu, M.; Wang, Y. Integrating Ecosystem Services Value and Uncertainty into Regional Ecological Risk Assessment: A Case Study of Hubei Province, Central China. Sci. Total Environ. 2020, 740, 140126. [Google Scholar] [CrossRef] [PubMed]
  51. Du, L.; Gong, F.; Zeng, Y.; Ma, L.; Qiao, C.; Wu, H. Carbon Use Efficiency of Terrestrial Ecosystems in Desert/Grassland Biome Transition Zone: A Case in Ningxia Province, Northwest China. Ecol. Indic. 2021, 120, 106971. [Google Scholar] [CrossRef]
  52. Xu, Z.; Peng, J.; Dong, J.; Liu, Y.; Liu, Q.; Lyu, D.; Qiao, R.; Zhang, Z. Spatial Correlation between the Changes of Ecosystem Service Supply and Demand: An Ecological Zoning Approach. Landsc. Urban Plan. 2022, 217, 104258. [Google Scholar] [CrossRef]
  53. Pan, N.; Du, Q.; Guan, Q.; Tan, Z.; Sun, Y.; Wang, Q. Ecological Security Assessment and Pattern Construction in Arid and Semi-Arid Areas: A Case Study of the Hexi Region, NW China. Ecol. Indic. 2022, 138, 108797. [Google Scholar] [CrossRef]
  54. Liu, Y.; Sun, D.; Wang, H.; Wang, X.; Yu, G.; Zhao, X. An Evaluation of China’s Agricultural Green Production: 1978–2017. J. Clean. Prod. 2020, 243, 118483. [Google Scholar] [CrossRef]
  55. Bethwell, C.; Burkhard, B.; Daedlow, K.; Sattler, C.; Reckling, M.; Zander, P. Towards an Enhanced Indication of Provisioning Ecosystem Services in Agro-Ecosystems. Environ. Monit. Assess. 2021, 193, 269. [Google Scholar] [CrossRef] [PubMed]
  56. Xiao, Y.; Li, Y.; Tang, X.; Huang, H.; Wang, R. Assessing Spatial–Temporal Evolution and Key Factors of Urban Livability in Arid Zone: The Case Study of the Loess Plateau, China. Ecol. Indic. 2022, 140, 108995. [Google Scholar] [CrossRef]
  57. Hu, B.; Xie, M.; He, R.; Shi, Z.; Zhou, Y.; Ni, H.; Li, H. Spatio-Temporal Evolution of Cropland Ecosystem Services Value and Its Spatially Varying Dominate over the Past Two Decades: A Case Study in Jiangxi Province in Southern China. J. Clean. Prod. 2023, 427, 139228. [Google Scholar] [CrossRef]
  58. Da Silva, G.F.P.; Pegetti, A.L.; Piacesi, M.T.; Belderrain, M.C.N.; Bergiante, N.C.R. Dynamic Modeling of an Early Warning System for Natural Disasters. Syst. Res. Behav. Sci. 2020, 37, 292–314. [Google Scholar] [CrossRef]
  59. Gao, J.; Du, F.; Zuo, L.; Jiang, Y. Integrating Ecosystem Services and Rocky Desertification into Identification of Karst Ecological Security Pattern. Landsc. Ecol. 2021, 36, 2113–2133. [Google Scholar] [CrossRef]
  60. Mosier, S.; Córdova, S.C.; Robertson, G.P. Restoring Soil Fertility on Degraded Lands to Meet Food, Fuel, and Climate Security Needs via Perennialization. Front. Sustain. Food Syst. 2021, 5, 706142. [Google Scholar] [CrossRef]
  61. Chen, J.; Li, Z.; Xiao, H.; Ning, K.; Tang, C. Effects of Land Use and Land Cover on Soil Erosion Control in Southern China: Implications from a Systematic Quantitative Review. J. Environ. Manag. 2021, 282, 111924. [Google Scholar] [CrossRef]
  62. Li, Y.; Zhang, X.; Zhi, C.; Liu, Z.; Lu, Z.; Liu, Y. Towards the Progress of Ecological Restoration and Economic Development in China’s Loess Plateau and Strategy for More Sustainable Development. Sci. Total Environ. 2021, 756, 143676. [Google Scholar] [CrossRef]
  63. Martínez-Valderrama, J.; Ibáñez, J.; Del Barrio, G.; Sanjuán, M.E.; Alcalá, F.J.; Martínez-Vicente, S.; Ruiz, A.; Puigdefábregas, J. Present and Future of Desertification in Spain: Implementation of a Surveillance System to Prevent Land Degradation. Sci. Total Environ. 2016, 563–564, 169–178. [Google Scholar] [CrossRef]
  64. Gao, J.; Zou, C.; Zhang, K.; Xu, M.; Wang, Y. The Establishment of Chinese Ecological Conservation Redline and Insights into Improving International Protected Areas. J. Environ. Manag. 2020, 264, 110505. [Google Scholar] [CrossRef] [PubMed]
  65. Liu, S.; Li, X.; Chen, D.; Duan, Y.; Ji, H.; Zhang, L.; Chai, Q.; Hu, X. Understanding Land Use/Land Cover Dynamics and Impacts of Human Activities in the Mekong Delta over the Last 40 Years. Glob. Ecol. Conserv. 2020, 22, e00991. [Google Scholar] [CrossRef]
  66. He, J.; Pan, Z.; Liu, D.; Guo, X. Exploring the Regional Differences of Ecosystem Health and Its Driving Factors in China. Sci. Total Environ. 2019, 673, 553–564. [Google Scholar] [CrossRef] [PubMed]
  67. Su, Y.Z.; Zhao, W.Z.; Su, P.X.; Zhang, Z.H.; Wang, T.; Ram, R. Ecological Effects of Desertification Control and Desertified Land Reclamation in an Oasis–Desert Ecotone in an Arid Region: A Case Study in Hexi Corridor, Northwest China. Ecol. Eng. 2007, 29, 117–124. [Google Scholar] [CrossRef]
  68. Richardson, L.; Loomis, J.; Kroeger, T.; Casey, F. The Role of Benefit Transfer in Ecosystem Service Valuation. Ecol. Econ. 2015, 115, 51–58. [Google Scholar] [CrossRef]
Figure 1. Map of the study area.
Sustainability 16 03915 g001
Figure 2. Technology roadmap.
Sustainability 16 03915 g002
Figure 3. Land use types in Aksu City from 2000 to 2020.
Sustainability 16 03915 g003
Figure 4. Chordal map of land use changes in Aksu City during: (a) 2000–2005; (b) 2005–2010; (c) 2010–2015; (d) 2015–2020.
Sustainability 16 03915 g004
Figure 5. Spatial mapping of ecosystem service value classes from 2000 to 2020.
Sustainability 16 03915 g005
Figure 6. Spatial pattern changes of ecological risk from 2000 to 2020.
Sustainability 16 03915 g006
Figure 7. Bivariate spatial autocorrelation results of ESV and ERI from 2000 to 2020.
Sustainability 16 03915 g007
Figure 8. Bivariate spatial correlations of ESV and ERI from 2000 to 2020.
Sustainability 16 03915 g008
Figure 9. Spatial autocorrelation distribution of ecosystem service value per unit area and ecological risk index from 2000 to 2020.
Sustainability 16 03915 g009
Table 1. List of ancillary data used in this study.
Data TypeDescriptionSpatial ResolutionThe Source of Data
Underlying dataLand use data30 mhttps://www.resdc.cn/
Administrative divisions-https://www.resdc.cn/
Statistical dataGrain crop production-https://tjj.xinjiang.gov.cn/
Grain crop planted area-https://tjj.xinjiang.gov.cn/
Grain crop unit price-https://www.stats.gov.cn/
Table 2. Average value of ecological services per unit area of ecosystems in Aksu City from 2000 to 2020 (CNY/hm2).
Ecosystem ServicesLand Use Types
Primary ClassificationSecondary ClassificationC *FGSWBIPBL
SSFP1537.51351.33324.66607.580.006.96
RMP340.903999.43477.72338.580.0020.87
WS1815.795797.83264.376047.990.0013.91
RSGR1238.352654.111678.971321.840.0090.44
CR647.017941.474438.592982.250.0069.57
PE187.842327.131465.624318.000.00285.24
HR2080.165196.913251.2661,964.070.00166.97
STSSC723.533231.552045.371502.720.00104.36
MNC215.67246.98157.69115.950.006.96
BD236.542942.831859.854837.460.0097.40
CSAC104.362791.55820.933112.120.0041.74
Total9127.6437,481.1116,785.0387,148.560.00904.42
* C means cropland, F means forest, GS means grass and shrubland, WB means waterbody, IP means impervious, BL means bare land, SS means supply service, RS means regulatory services, STS means support Services, CS means cultural service, FP means food production, RMP means raw material production, WS means water supply, GR means gas regulation, CR means climate regulation, PE means purification of the environment, HR means hydrological regulation, SC means soil conservation, MNC means maintaining nutrient cycles, BD means biodiversity, AC means aesthetic landscape.
Table 3. Value and share of ecosystem services of land use types from 2000 to 2020 (CNY 108).
Land Use Type20002005201020152020
ESV%ESV%ESV%ESV%ESV%
CL9.1017.969.9420.2110.2821.0612.4126.3712.6726.81
F5.7611.374.479.094.419.034.389.314.389.28
GS18.4936.5017.7836.1517.3335.5213.7429.1913.6528.88
WB7.2514.326.9614.146.7513.836.5313.876.5813.92
IP10.0619.8610.0420.4110.0320.5610.0021.269.9721.11
BL9.1017.969.9420.2110.2821.0612.4126.3712.6726.81
Proportions are in %. LR means low risk, LRR means lower risk, MR means medium risk, HRR means higher risk, HR means high risk.
Table 4. Proportion of landscape ecological risk classes in Aksu City from 2000 to 2020.
Proportion *
200020052010201520202000–2020
LR0.110.100.120.070.07−0.04%
LRR79.8179.8979.7979.1478.82−0.90
MR7.847.978.137.747.83−0.02
HRR5.335.235.386.576.631.30
HR6.906.816.586.476.64−0.26
* Proportions are in %. LR means low risk, LRR means lower risk, MR means medium risk, HRR means higher risk, HR means high risk.
Table 5. Response of ecological service value to ecological risk intensity in Aksu City from 2000 to 2020.
ERL2000–20052005–20102010–20152015–2020
ICNCDCICNCDCICNCDCICNCDC
LR5204912071041981802104
LRR2726595212271213202661591427112
MR5193225209631843432142
HRR101794372001781249512417
HR30205631126234719497028116
RL means ecological risk level, LR means low risk, LRR means lower risk, MR means medium risk, HRR means higher risk, HR means high risk, IC means increase, NC means no change, DC means decrease.
Disclaimer/Publisher’s Note: The statements, opinions and data contained in all publications are solely those of the individual author(s) and contributor(s) and not of MDPI and/or the editor(s). MDPI and/or the editor(s) disclaim responsibility for any injury to people or property resulting from any ideas, methods, instructions or products referred to in the content.

