
Spatio-Temporal Trends in Precipitation, Temperature, and Extremes: A Study of Malawi and Zambia (1981–2021)

1
International Livestock Research Institute (ILRI), Accelerating Impacts of CGIAR Climate Research for Africa (AICCRA), Addis Ababa P.O. Box 5689, Ethiopia
2
Norwegian Meteorological Institute, 0313 Oslo, Norway
3
School of Geography and the Environment, University of Oxford, Oxford OX1 3QY, UK
4
School of Geography and Environmental Science, University of Southampton, Southampton SO17 1BJ, UK
*
Author to whom correspondence should be addressed.
Sustainability 2024, 16(10), 3885; https://doi.org/10.3390/su16103885
Submission received: 22 March 2024
/
Revised: 20 April 2024
/
Accepted: 22 April 2024
/
Published: 7 May 2024
(This article belongs to the Special Issue Climate Change and Environmental Resource Conservation for Sustainable Development)
Abstract
:Analyzing long-term climate changes is a prerequisite for identifying hotspot areas and developing site-specific adaptation measures. The current study focuses on assessing changes in precipitation, maximum and minimum temperatures, and potential evapotranspiration in Zambia and Malawi from 1981 to 2021. High-resolution precipitation and temperature datasets are used, namely, Climate Hazards Group InfraRed Precipitation with Station data (0.05°) and Multi-Source Weather (0.1°). The Mann–Kendall trend test and Sen’s Slope methods are employed to assess the changes. The trend analysis shows a non-significant increase in annual precipitation in many parts of Zambia and Central Malawi. In Zambia and Malawi, the average annual and seasonal maximum and minimum temperatures show a statistically significant increasing trend (up to 0.6 °C/decade). The change in precipitation during the major rainy seasons (December–April) shows a non-significant increasing trend (up to 3 mm/year) in a large part of Zambia and Central Malawi. However, Malawi and Northern Zambia show a non-significant decreasing trend (up to −5 mm/year). The change in December–April precipitation significantly correlates with El Niño–Southern Oscillation (Indian Ocean Dipole) in Southern (Northern) Zambia and Malawi. To minimize the impact of the observed changes, it is imperative to develop adaptation measures to foster sustainability in the region.
1. Introduction
Over the past few decades, our world has undergone a profound transformation characterized by unprecedented shifts in temperature patterns. The increase in temperature and changes and variability in other climate variables have caused a significant impact on human society, environment, and economy [1]. The Intergovernmental Panel on Climate Change (IPCC) has played a crucial role in illuminating these changes, particularly emphasizing the significant warming trends that have unfolded [1,2,3]. The last four decades, in particular, have seen successive temperature increases, surpassing any previous period since 1850 [4]. This surge in global temperatures, exacerbated by human-induced climate change, has transitioned climate change and variability from a future concern to an immediate reality, with profound impacts evident in various regions worldwide [5,6]. During the last 5 to 10 decades, the average temperature has increased by more than 0.7 °C globally and 0.5 °C in Africa [7,8]. According to the IPCC assessment report [9], the annual mean precipitation is increasing across large parts of the world, particularly in North America, Asia, and Europe. However, some areas in the tropics, such as Africa and North America, are experiencing a drying trend. The impact of the change in precipitation and temperature is particularly high in developing countries such as Africa and South America due to their limited adaptation capacity and technologies, including improved forecasts of extreme events. With limited adaptation capacity, Africa is one of the most vulnerable continents [1,10,11,12]. Africa is recognized as one of the hotspots for climate change and faces devastating consequences, particularly regarding food and water insecurity, impacting vital sectors crucial for economic growth [13,14,15,16]. The region’s susceptibility to extreme events such as droughts, floods, and heatwaves is amplified by high climate variability (i.e., seasonal rainfall variability), which poses significant challenges to both community livelihoods and the economic trajectory of the region [13,17,18,19,20].
The climate of both East and West Africa is intricately shaped by the variations in large-scale climate phenomena, prominently including ENSO (El Niño–Southern Oscillation) and IOD (Indian Ocean Dipole) [21,22,23,24,25,26]. These climatic influences contribute significantly to the occurrence of extreme weather events, manifesting as prolonged periods of droughts and sudden onset of floods in these regions. ENSO refers to the cyclical warming and cooling of the temperatures in the eastern and central equatorial Pacific Ocean. It significantly influences atmospheric circulation and precipitation patterns [11,27,28]. During El Niño phases, East Africa often experiences drier conditions, leading to droughts, while La Niña phases can result in increased rainfall and potential flooding [29,30]. Similarly, the Indian Ocean Dipole (IOD), which involves temperature anomalies in the Indian Ocean, plays a crucial role in modulating weather patterns. Positive IOD events, characterized by warmer-than-average sea surface temperatures in the Western Indian Ocean, are associated with increased rainfall in East Africa, potentially causing flooding [14,29,31,32].
The decline in seasonal precipitation during the long rainy season in East Africa (March–May) and summer rains (December–February) in South Africa are believed to be due to the increase in temperature of the Indian Ocean [33]. Due to these climate variables, African countries are experiencing an increased risk of extreme events affecting different sectors such as the agriculture, water, and energy sectors. As most of the population in Africa is highly dependent on rain-fed agriculture, a reduction in rainfall during the main seasons significantly impacts the community and leads to food insecurity [34]. Agriculture, constituting over 70% of the livelihood of the rural population in East and South Africa, is the backbone of food security and contributes substantially to the local economy [35]. The vulnerability of Africa to climate change is expected to intensify in the future due to projected changes in rainfall patterns and increase in temperature, posing significant challenges to key sectors such as agriculture, water resources, and food security [36,37,38,39,40].
The urgency to develop adaptation measures to address the impact of current climate conditions and the projected increase in extreme events, such as floods, heatwaves, and droughts, is paramount. Despite this urgency, the number of studies in Zambia and Malawi examining trends of precipitation, temperature, and extreme events, such as consecutive wet and dry days and heatwaves, are limited, with a predominant focus on seasonal to decadal variability [41,42,43]. However, to effectively mitigate and minimize these impacts, a comprehensive understanding of climate changes at the local scale is essential. Therefore, this study aims to fill this gap by investigating the trends in precipitation and temperature at a high spatial resolution in Zambia and Malawi. Utilizing high-resolution climate datasets becomes crucial in identifying hotspot areas that are particularly vulnerable to extreme climate variations. As highlighted by [13], the detection of changes and the identification of these hotspots are fundamental prerequisites for implementing climate change adaptation strategies, both at the regional and basin levels.
This study contributes to this imperative by conducting a detailed analysis of long-term changes in precipitation and average, maximum, and minimum temperatures in Malawi and Zambia. These countries, despite facing the challenges of climate change, have been relatively under-explored in comparison to regions such as East and South Africa. By focusing on Malawi and Zambia, this research aims to fill a gap in climate change studies and provide valuable insights that can inform targeted adaptation efforts in areas that may be experiencing pronounced and critical climate variations.
2. Materials and Methods
2.1. Study Area and Data
The study was conducted in Malawi and Zambia, countries known for their diverse topography shaped by the Great Rift Valley. According to the Köppen classification, a large part of Malawi and Zambia experience a humid subtropical climate (Cwa), characterized by hot summers and mild winters [44]. The average annual precipitation in Malawi varies between 600 mm and 1600 mm. Notably, the Rift Valley and mountainous regions represent two distinct areas, with the former experiencing lower rainfall and the latter recording higher precipitation levels (Figure 1).
Malawi experiences wet and dry seasons influenced by the Inter-Tropical Convergence Zone (ITCZ). The hot wet and cool dry seasons span from November to April and May to October with average temperatures ranging from 30 °C to 35 °C and 13 °C, respectively. In addition, (Figure 1). The high and low temperatures in the low- and highlands of Malawi lead to a higher and a lower (e.g., Lake Malawi) potential evapotranspiration (PET) of between 600 mm and 1400 mm, respectively.
Zambia’s predominantly sub-tropical climate is marked by three seasons: a hot and dry season (September to November), a wet rainy season (December to April), and a cool dry season (May to August). The average maximum (Tmax) and minimum (Tmin) temperatures in Zambia vary between 24 °C and 30 °C and 12 °C and 20 °C, respectively. Additionally, the PET is elevated in Zambia compared to Malawi, ranging from 1300 mm in the north to 1700 mm in the southwest. Malawi and Zambia have the same rainy season from December to April (DJFMA).
2.2. Datasets
To assess the current and future changes in climate, several datasets are used. For historical climate, the Climate Hazards Group Infrared Precipitation with Stations v2.0 (CHIRPS) [45] for precipitation and the Multi-Source Weather (MSWX) [46] dataset for maximum and minimum temperature are used. CHIRPS has been identified as the most reliable precipitation dataset in the region and other parts of the world [47,48,49].
CHIRPS, a satellite-based rainfall estimate, employs infrared cold cloud duration (CCD) estimates and station data at daily, 5-day, and monthly intervals [45]. Covering a semi-global extent (from 50 S to 50 N across all longitudes), this gridded rainfall dataset boasts a spatial resolution of 0.05° (~5 km) and spans from 1981 to the present. Primarily crafted for monitoring droughts and global environmental changes in data-scarce regions like East Africa, CHIRPS is a valuable resource. Its applications extend to climate extreme monitoring, trend analysis, and hydrological projections, especially in regions with complex topography, such as the Ethiopian highlands. Widely acknowledged for its high quality, spatial and temporal resolution, and rigorous quality control measures, CHIRPS finds extensive use in evaluating long-term climate variability and trends. On the other hand, the MSWX is a high-resolution (0.1°) bias-corrected global meteorological dataset publicly available from GloH2O (http://www.gloh2o.org/mswx/, (accessed on 5 January 2024)). The dataset is constructed using various observational data sources such as the Climatic Research Unit Time Series (CRU TS) [50] and Climatologies at High Resolution for the Earth’s Land Surface Areas (CHELSA) [51] by applying bias-correction and downscaling techniques. The GloH2O dataset includes daily and sub-daily meteorological datasets such as temperature, relative humidity, surface pressure, and wind speed. MSWX is available globally from 1979 to the present at a spatial resolution of 0.1°.
2.3. Methodology
To assess the long-term change in seasonal and annual precipitation, PET, and maximum (Tmax) and minimum (Tmin) temperatures, the daily data are aggregated into monthly, seasonal, and annual time scales. The PET is calculated using the Hargreaves [52] method, suitable for areas with limited data availability, relying on temperature and radiation. This method has been applied successfully in the region [28,53]. The PET equation based on Hargreaves is expressed in Equation (1).
where PET is the reference evapotranspiration (mm/day), Tmean is the mean average daily temperature (°C), Tmax and Tmin are the daily maximum and minimum temperatures (°C), respectively, and Ra is terrestrial radiation (MJ/m2/day).
In addition to assessing the mean seasonal and annual changes, we also evaluated the long-term trends in extreme events for the period 1981–2021. The selected extreme indices include consecutive dry (CDD) and wet (CWD) days, heavy (R10mm) and very heavy (R20mm) precipitation days, and heatwaves (Table 1). These extreme events are identified based on the criteria established by the Expert Team on Climate Change Detection and Indices (ETCCDI) [54] and the European Climate Assessment project (ECA) (https://www.ecad.eu//indicesextremes/index.php, (accessed on 28 February 2024)). To pre-process the datasets, including cropping the global data to the study area and aggregating the daily data to monthly, seasonal, and annual time scales, the Climate Data Operators (CDO) [55] is used.
To assess the long-term changes in precipitation, temperature, PET, and extreme indices, the Mann–Kendall (MK) test [56] and Sen’s Slope [57] are used. These statistical methods are widely utilized for detecting trends and estimating their magnitude over time. The MK test assesses the presence of a monotonic trend in a dataset, determining whether there is a systematic upward or downward movement over time. On the other hand, Sen’s Slope provides a robust estimation of the trend’s magnitude by calculating the median of all possible slopes between data points. Together, these statistical tools offer a comprehensive approach for identifying and quantifying trends in time-series data. The MK test detects the presence of trends, while Sen’s Slope provides a reliable measure of the trend’s steepness or slope. The test statistic for the MK test is calculated using Equations (2)–(4).
where n is the number of data points, Xi and Xj are the data values at time i and j, respectively, and sign is the sign function. The variance of statistics (Var (S)) is calculated using Equation (3).
where k is the number of tied groups, and tk is the size of the kth tied group. Finally, the Z-statistics (score) is computed using Equation (4)
To assess the historical change in precipitation, temperature, and potential evapotranspiration, the daily datasets are aggregated into seasonal and annual time scales. In Malawi and Zambia, the major rainy season is during DJFMA.
To better understand the climate of the region, in addition to the long-term trend, the impact of the large-scale climate drivers, ENSO and IOD indices, is assessed. ENSO and IOD are two major climate drivers influencing weather patterns and precipitation variability globally and in Africa. By examining their temporal correlation with seasonal precipitation, the study provides a high-resolution correlation map to identify areas impacted by the indices. The Pearson correlation coefficient (r, Equation (5)) is used to measure the strength and direction of the relationship between precipitation ENSO and IOD.
where is the correlation coefficient, X and Y are the data points of precipitation and ENSO or IOD, and and are their long-term means.
3. Results
3.1. Annual Trends
The long-term analysis of annual precipitation reveals an increasing trend across a substantial portion of Zambia and Malawi from 1981 to 2021 (Figure 2). The increase in annual precipitation (up to 8 mm/year) in Zambia is not statistically significant (Figure 2c). Unlike the other parts of Zambia, the northern and Muchinga provinces show a non-significant decreasing trend of up to −2 mm/year. In Malawi, annual precipitation shows an increasing trend (up to 4 mm/year) in the central region, but a decreasing trend (−4 mm/year) is observed in the southern region. Similarly, the southern part of the northern region (Mzimba and Nkhata districts) of Malawi shows a decreasing trend of up to −5 mm/year.
The long-term change in PET also shows an increasing trend in parts of Zambia’s northern, central–eastern, Lusaka, and eastern provinces (Figure 2b). On the contrary, the northwestern and central western parts of Zambia exhibited a decreasing trend during the 1981–2021 period. Additionally, the eastern part of the Muchinga province shows a declining trend in PET, with values reaching up to 0.15 mm/year. The observed increasing trend in PET in the upper north and eastern parts of Zambia is statistically significant (Figure 2d). In Malawi, the PET shows an increasing trend (up to 0.2 mm/year) in central and southern regions. On the other hand, the northern part of Malawi displays a decreasing trend in PET during the period 1981–2021. The increase in PET observed in the southern region and some places in the northern region of Malawi is statistically significant.
Aligned with global warming trends, the maximum and minimum temperatures exhibit a statistically significant increasing trend in Zambia and Malawi during the period from 1981 to 2021 (Figure 3). In Zambia, the Tmax shows a statistically significant increasing trend largely in the northern and eastern regions (up to 0.5°/decade). Compared to the other parts of Zambia, the central part shows a non-significant change from 1981 to 2021. Tmin, on the other hand, shows a statistically significant increasing trend in Zambia. Similar to the change in Tmax, the change in Tmin is high (up to 0.4 °C/decade) in the north and northwestern regions of Zambia. Malawi also exhibits an increasing trend in Tmax and Tmin from 1981 to 2021. The increase in Tmax is higher in the central and western regions of Malawi compared to the Northern region. On the contrary, the increase in Tmin is higher in the Northern region compared to the central and western regions. Overall, the observed increase in Tmax and Tmin in Malawi is statistically significant (Figure 3c,d).
3.2. Seasonal Trends
The seasons of December to April (DJFMA), March to August (MJJA), and September to November (SON) reveal both decreasing and increasing trends in precipitation across various regions in Zambia and Malawi (Figure 4). During the major rainy season (DJFMA), a large part of Zambia shows an increasing trend (up to 6 mm/year), which is significant in a few places. However, the Muchinga regions of Zambia are facing a drying tendency (up to 2.5 mm/year) during DJFMA. During MJJA (cold dry season), only parts of central Zambia show a statistically significant increasing trend in precipitation. In Malwai, the precipitation during DJFMA is increasing (up to 5 mm/year) in the central region, which is statistically significant in a few places. Notably, the western and northeastern parts of Malawi show a decreasing trend in precipitation (−4.5 mm/year) during DJFMA.
The seasonal precipitation during the hot dry season (SON) shows a non-significant decreasing trend change, particularly in Northern Zambia and a large part of Malawi.
The temperature during the cold and wet seasons is increasing in both Zambia and Malawi during the period from 1981 to 2021 (Figure 5). During DJFMA, Tmax shows an increasing trend in Zambia and Malawi. The increase in Tmax during DJFMA in Zambia, except in the central region, and Malawi is statistically significant. In addition, during the cold dry season (MJJA), the north region of Zambia and a large part of Malawi shows a statistically significant increasing trend (up to 0.35 °C/decade). On the other hand, a non-significant decreasing trend is observed in Central Zambia and Lake Malawi. During the hot dry season (SON), both Zambia and Malawi show a statistically significant increasing trend in Tmax (up to 0.6 °C/decade) during 1981–2021.
The change in Tmin, similar to Tmax, is significant in Zambia and Malawi during the wet and dry cold and hot seasons (Figure 6). During DJFMA, Tmin in Zambia and Malawi shows a significant increasing trend up to 0.5 °C/decade. The change in Tmin is higher in northern and northwestern parts of Zambia compared to Central and Southern Zambia. Tmax during MJJA also exhibits a statistically significant increase in Northern and Northwestern Zambia and Northern Malawi. During SON, the Tmin, similar to the change in Tmax, shows a statistically significant increasing trend up to 0.62 °C/decade in Zambia and Malawi. The increase in Tmin during the season of SON is more pronounced in the northern parts of Zambia and Malawi compared to other regions.
3.3. Climate Extremes
The long-term trend in the annual number of consecutive dry (CDD) and wet (CWD) days exhibits spatial variability across the region (Figure 7). The trend analysis reveals a non-significant increasing trend in the western and southern parts of the region, while a decreasing trend is observed in the northwestern and central parts of Zambia. In Malawi, the trend in CDD demonstrates a decreasing trend of up to 2.5 days per year. The observed change in CDD is statistically significant in some parts of Southern Malawi (Figure 7c). Conversely, CWD shows a non-significant increasing trend (up to 0.22 days per year) in parts of Southern Zambia and Northern Malawi. Overall, large parts of Zambia and Central and Southern Malawi exhibit a non-significant decreasing trend in CWD, with significant trends observed in only a few patches across the region (Figure 7d).
The number of heavy (R10mm) and very heavy (R20mm) precipitation days exhibits an increasing trend in Zambia and Malawi (Figure 8). The trend in R10mm shows a non-significant increasing trend in large parts of Zambia and Central Malawi, with significant trends observed in a few places. However, unlike other parts of the region, the western and northern parts of Malawi exhibit a non-significant decreasing trend in R10mm. Similarly, the western and northern regions of Malawi show a decreasing trend in R20mm, while an increasing trend is observed in different parts of Zambia, particularly in the western, southern, and central regions.
In line with global warming trends, the number of heatwave days shows a significant increasing trend in Zambia and Malawi (Figure 9). In Zambia, the number of heatwave days exhibits a significant increasing trend of up to 0.82 days per year, with the increase being more pronounced in the southern and eastern parts and lower in the northern parts. Similarly, the southern and central parts of Malawi demonstrate a significant increasing trend of up to 0.55 days per year, while a non-significant change is observed in the northern part.
3.4. Impact of Large-Scale Climate Variables on Seasonal Rainfall Variability
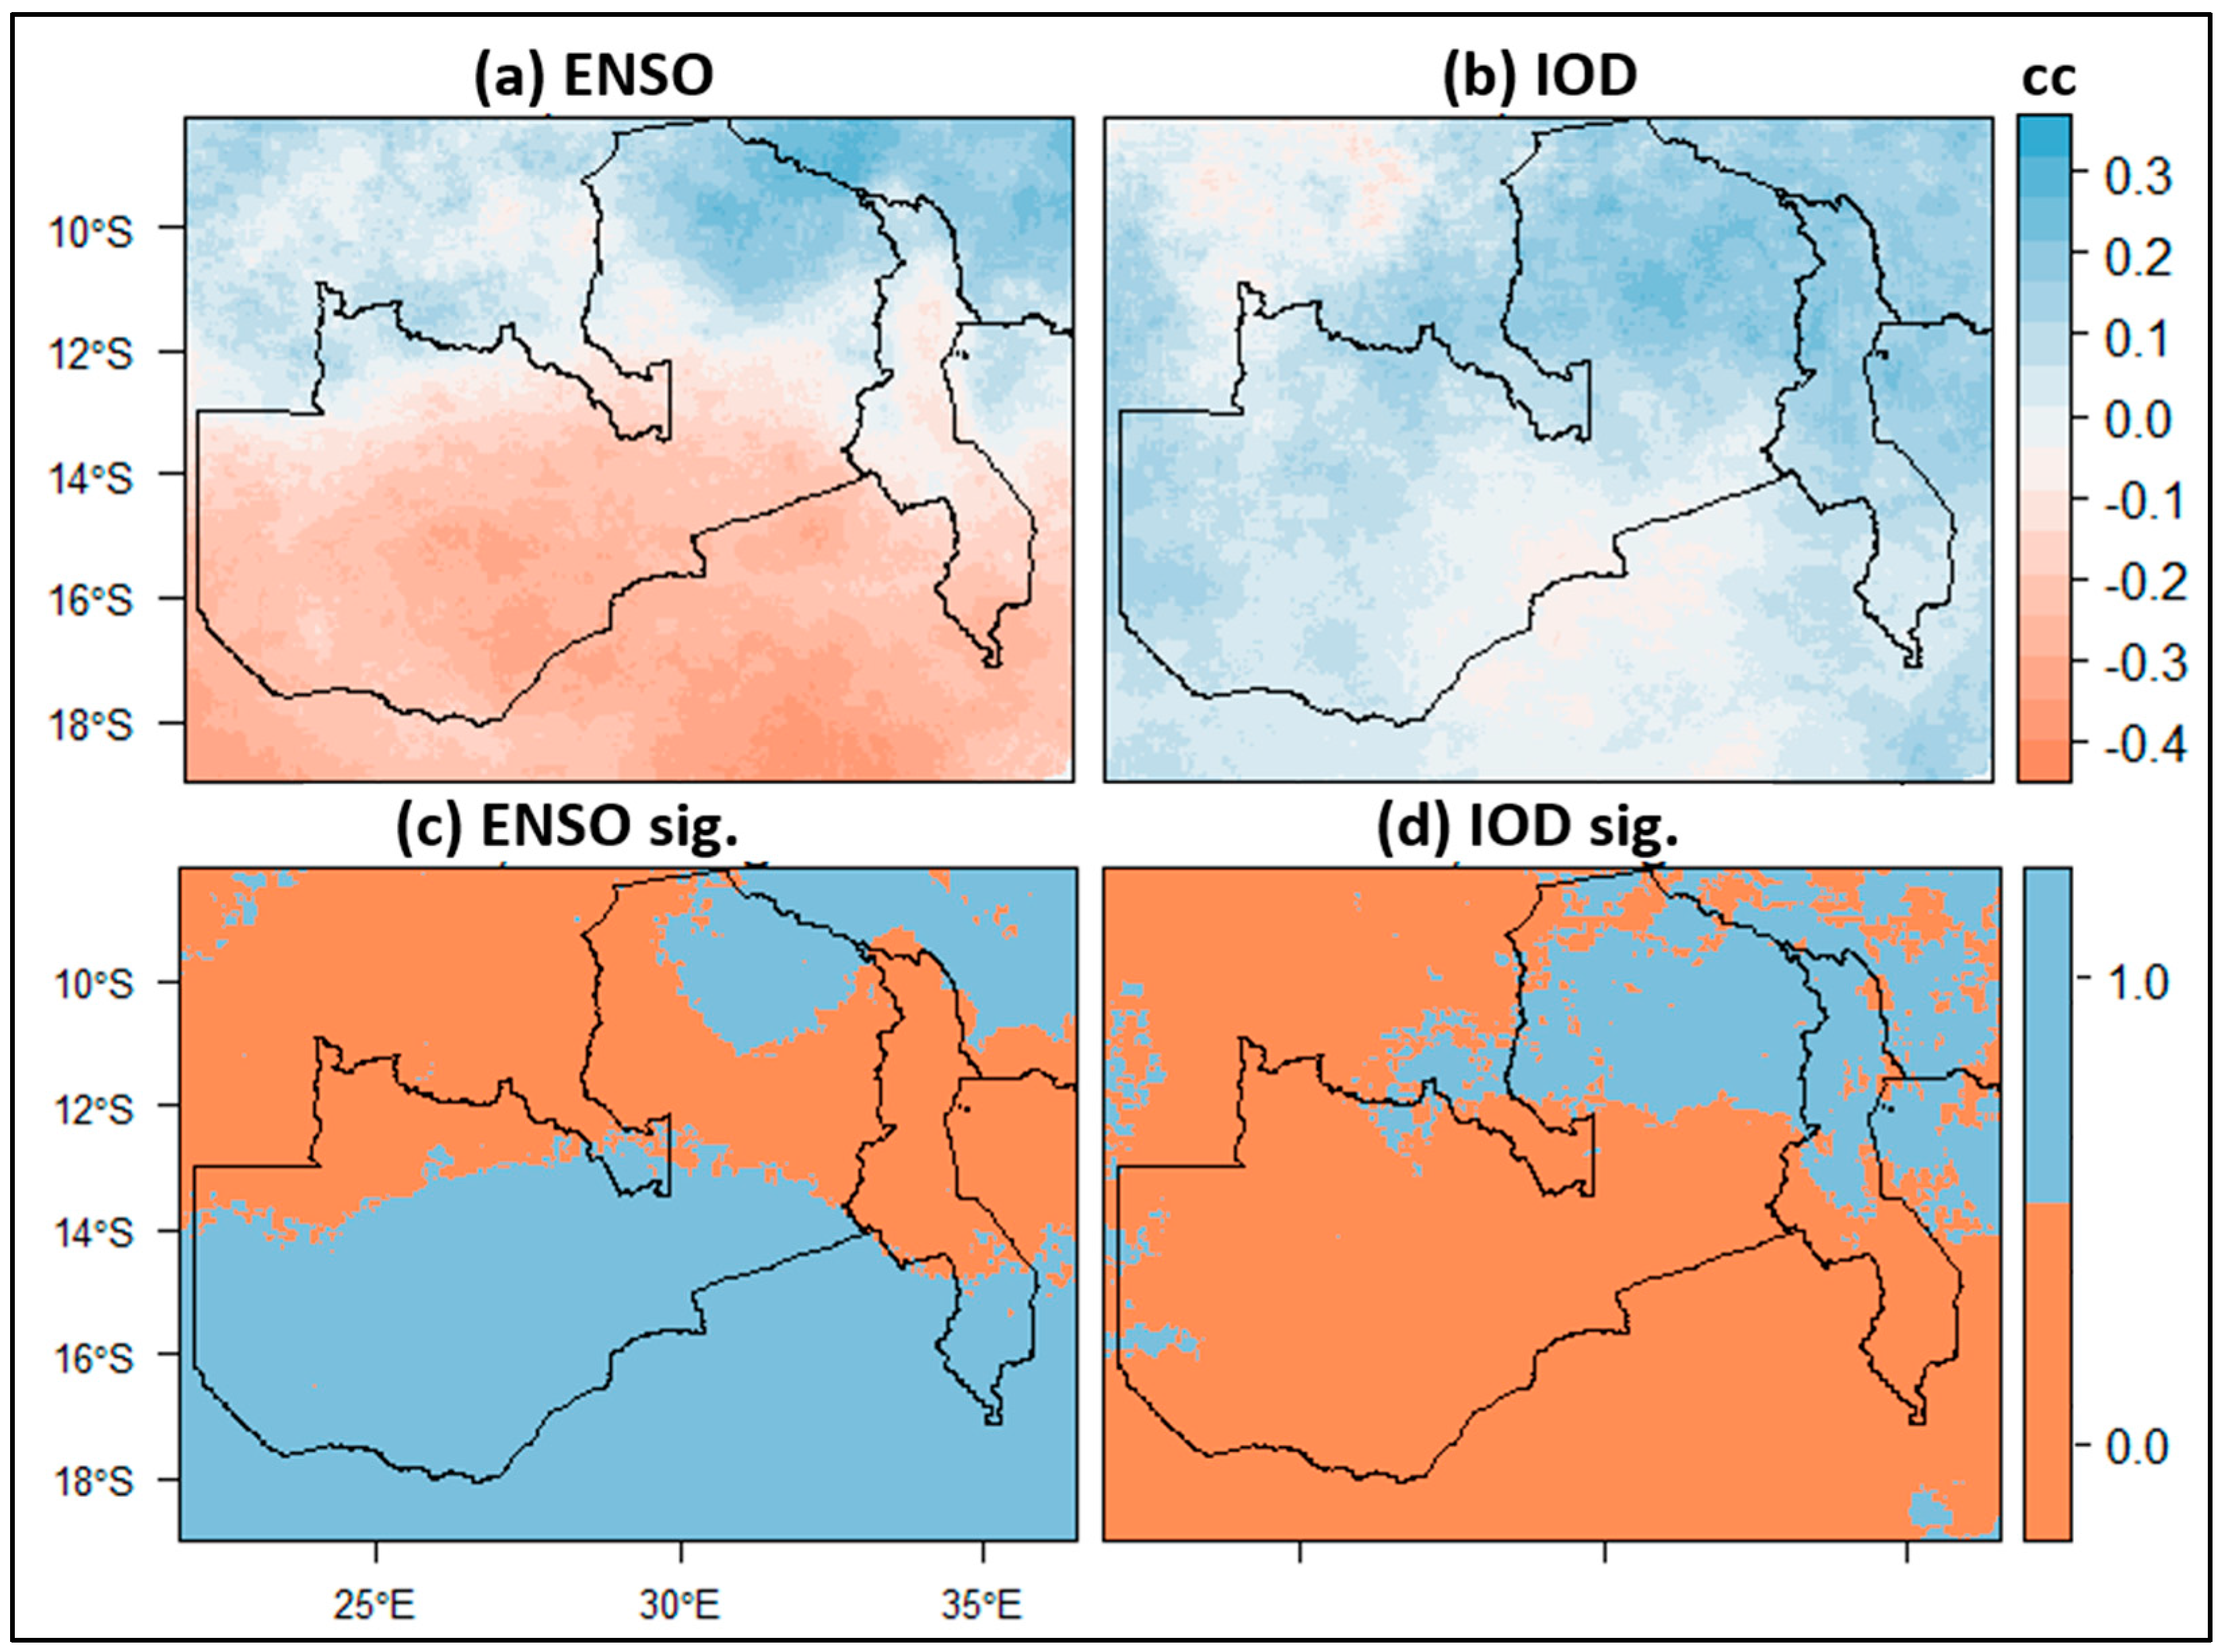
Although the analysis reveals an increasing trend in precipitation during the major rainy seasons across a significant portion of Zambia and the central region of Malawi, it is noteworthy that this trend lacks statistical significance. To further explore the factors influencing seasonal rainfall variability, the relationship between precipitation patterns and anomalies in the El Niño–Southern Oscillation (ENSO) and Indian Ocean Dipole (IOD) is examined. Figure 10 illustrates the correlation between seasonal rainfall and ENSO and IOD anomalies. The relationship between ENSO and DJFMA precipitation shows a significant negative correlation, reaching up to −0.4, in Central, Western, and Southern Zambia and Southern Malawi (Figure 10a). This indicates a moderately strong negative relationship between ENSO and seasonal precipitation in these regions. Conversely, there is a non-significant positive correlation (up to 0.3) between ENSO and DJFMA precipitation in the northwestern, Copperbelt, and the southern parts of the Muchinga and Luapula regions in Zambia, as well as of Northern Malawi. This suggests a moderately weak positive relationship between ENSO and precipitation in these areas.
On the contrary, the correlation between IOD and DJFMA precipitation is positive (up to 0.32) in Zambia and Malawi (Figure 10b). The relationship between IOD and DJFMA precipitation is only significant in the northern regions of Malawi and Zambia. This indicates that the relationship between IOD and DJFMA precipitation is noteworthy, particularly in the northern regions of both countries.
4. Discussion
Based on high-resolution precipitation and temperature datasets, the comprehensive long-term trend analysis conducted for the period 1981–2021 reveals significant changes in Zambia and Malawi. The utilization of reliable climate datasets derived from ground observations and satellite data are crucial for enhancing the accuracy and precision of detecting changes and variability in climate patterns at a much higher resolution. This comprehensive analysis offers valuable insights into the evolving climatic conditions in the region, providing a solid foundation for informed decision making across various sectors. These maps facilitate the identification of hotspot areas, supporting the development of locally tailored adaptation measures in critical sectors such as water management, agriculture, and energy. The use of high-resolution climate datasets proves instrumental in not only detecting trends but also in pinpointing specific areas that require focused attention to mitigate and manage the impacts of changing climatic conditions effectively [13,58,59,60].
According to [59], high-quality climate datasets are required to build our understanding of the impact of climate change and to manage natural disasters such as floods and droughts. By improving predictions and developing disaster management strategies, these datasets play a crucial role in mitigating risks associated with extreme weather events. Therefore, this study employs the most reliable climate products to accurately assess changes in annual and seasonal precipitation, Tmax, Tmin, and PET. For example, CHIRPS was identified as the best-performing precipitation dataset compared to ground observations at multiple time scales (daily–annual) in East Africa [47,48] and South Africa [61,62], and has been used in climate change studies in different parts of East and South Africa [14,63,64]. According to [42,64], CHIRPS has shown a consistent pattern of change and variability compared to gauge measurement in Malawi and Zambia.
Based on CHIRPS, a non-significant increasing trend (up to 8 mm/year) in annual precipitation is observed in a large part of Zambia and Central Malawi, and this is in line with previous studies [63,65]. The documented rise in precipitation can be predominantly attributed to the increased rainfall during the December–February period, which is associated with changes in sea surface temperature and the Pacific Walker Circulation [63,65]. The most important rainy season is the DJFMA, contributing over 90% of the annual rainfall and serving as the primary agricultural season. During DJFMA, Northern Zambia and a large part of Malawi show a non-significant decreasing trend. In line with this study, a non-significant drying trend in precipitation since 2000 has been reported in Malawi [64]. Precipitation during the DJFMA season exhibits a moderate and significant correlation with ENSO. Previous studies [64,66] suggest that rainfall patterns in Malawi and Zambia are influenced by the Intertropical Convergence Zone (ITCZ) and ENSO, indicating that the wet and dry seasons are associated with ENSO. Additionally, seasonal rainfall is impacted by the Quasi-Biennial Oscillation (QBO), which is a pattern of atmospheric pressure variations that occurs in the equatorial stratosphere [67]. In general, the precipitation changes in countries in East and South Africa, including Malawi and Zambia, are highly impacted by the changes in sea surface temperature including ENSO and IOD [21,29,68]. Similar to the change observed in mean precipitation, extreme events such as CDD, CWD, R10mm, and R20mm did not exhibit a significant change in Zambia and Malawi, and this is in line with previous studies covering different parts of the region [19,69,70].
Unlike the observed changes in precipitation and precipitation extremes, the Tmax, Tmin, and heatwaves show a statistically significant increasing trend during the period from 1981 to 2021. The observed rise in Tmax, Tmin, and heatwaves aligns with the broader phenomenon of global warming. Consistent with the outcomes of this investigation, several other studies have reported a comparable upward trend for temperatures and temperature extremes within the region [11,13,19,71,72,73,74,75]. In general, the increase in temperature in Africa during the past five to ten decades is more than 0.5 °C [7,8,11,40,76], and it is projected to increase in the future [12,28,77,78,79,80].
The observed increase in Tmax and Tmin leads to an increase in PET in Zambia and Malawi. The increase in PET and temperature will particularly impact the agriculture sector. Moreover, the concurrent increase in temperature and PET, coupled with a reduction in seasonal precipitation observed in Malawi and Northern Zambia, is anticipated to exert a substantial influence on agriculture, water resources, and the energy sector. These interconnected changes underscore the multifaceted challenges posed by evolving climate patterns, necessitating strategic interventions and adaptive measures across various sectors. Overall, both Malawi and Zambia demand specific attention, especially in light of the drying trend witnessed during the rainy season and the escalating temperatures (Tmax and Tmin). Given the constrained capacity within the communities of these two countries, there is a pressing need for an integrated approach, supported by the respective governments, to formulate and implement adaptation measures such as water-harvesting structures and crop rotations. For example, traditional methods like water-harvesting techniques, terraces, crop diversity, and agroforestry are already being practiced by smallholder farmers to adapt to climate change [81]. These indigenous practices can serve as valuable resources in formulating effective adaptation strategies tailored to the local context, contributing to the sustainability of the region. This will help mitigate the adverse effects of the declining trend in precipitation during the rainy season (i.e., DJFMA) and the concurrent rise in temperature and evapotranspiration in different sectors, particularly the agriculture sector. Given that a substantial portion of the population relies heavily on this sector for sustenance, implementing these adaptation measures will be crucial for ensuring food security and livelihood resilience in the face of changing climatic conditions.
5. Conclusions
The long-term trend analysis, spanning the period of 1981 to 2021, reveals significant changes in climate patterns in Zambia and Malawi. The utilization of high-resolution precipitation and temperature datasets, including CHIRPS (0.05°) and MSWX temperature (0.1°), has allowed to conduct a thorough analysis of annual and seasonal changes in precipitation, maximum and minimum temperatures, and potential evapotranspiration (PET). These findings provide critical insights into the evolving climatic conditions in the region, serving as a valuable resource for informed decision making across various sectors such as agriculture, water resources, energy, and health.
Notably, the observed increase in precipitation in Zambia, particularly during the major rainy seasons (December–April) will benefit the agriculture sector, where most of the population depends, and other sectors. However, the observed decreasing trend in Malawi and Northern Zambia will be a challenge for the region and requires the development of adaptation measures to minimize the impacts. Concurrently, both Zambia and Malawi exhibit a statistically significant increase in temperatures, which contributes to the rise in potential evapotranspiration (PET), and the decline in precipitation will pose a series of challenges to the agriculture sector.
Our study emphasizes the importance of utilizing high-quality, high-resolution climate datasets to accurately detect and understand climate change impacts. However, it is important to address that even though we used the best-performing climate datasets available for this region and globally, they may still have uncertainties stemming from satellites, observations, and merging and interpolation techniques. The identified trends and hotspots provide a foundation for developing localized adaptation strategies, particularly given the limited capacity within the communities of Zambia and Malawi. Based on the insights gained from this high-resolution study, future research should prioritize identifying site-specific adaptation measures to mitigate the impacts of changing climate and climate extremes. This will enable the development of government-supported integrated adaptation approaches, including the implementation of water-harvesting structures and crop rotations, which are crucial for mitigating the adverse effects of declining precipitation and increasing temperatures, ensuring sustainable development in the face of evolving climatic conditions.
Author Contributions
Conceptualized, T.D. and S.H.G.; methodology, T.D. and S.H.G.; formal analysis, S.H.G.; writing—original draft, T.D. and S.H.G.; writing—review and editing, S.H.G.; supervision, S.H.G. and T.D. All authors have read and agreed to the published version of the manuscript.
Funding
T.D. acknowledges funding support from the European Union Department for International Partnerships (INTPA) that funded the LEG4DEV DESIRA project (https://leg4dev.org/; Grant Number: FOOD/2020/418-90). This research was also funded by the Australian Centre for International Agricultural Research (ACIAR) and the International Development Association (IDA) of the World Bank to the Accelerating Impact of CGIAR Climate Research for Africa (AICCRA) project.
Institutional Review Board Statement
Not applicable.
Informed Consent Statement
Not applicable.
Data Availability Statement
The rainfall data used in this study is the Climate Hazards Group InfraRed Precipitation with Station version 2.0 (CHIRPS), and it is freely available from the Climate Hazards Center University of California, Santa Barbara (https://data.chc.ucsb.edu/products/CHIRPS-2.0/, accessed on 28 January 2024). Similarly, Multi-Source Weather (MSWX) temperature is publicly available from the GloH2O (https://www.gloh2o.org/mswx/, accessed on 5 January 2024).
Acknowledgments
This research paper was made possible through generous support from multiple projects. We gratefully acknowledge the financial support from the European Union Department for Interna-tional Partnerships (INTPA) that funded the LEG4DEV DESIRA project (https://leg4dev.org/); the Australian Centre for International Agricultural Research (ACIAR) and the Accelerating Impacts of CGIAR Climate Research for Africa (AICCRA). AICCRA aims to deliver a climate-smart African future driven by science and innovation in agriculture and is supported by a grant from the Inter-national Development Association (IDA) of the World Bank. Explore our work at https://aiccra.cgiar.org/.
Conflicts of Interest
The authors declare no conflicts of interest.
References
- Hewitson, B.; Janetos, A.C.; Carter, T.R.; Giorgi, F.; Jones, R.G.; Kwon, W.-T.; Mearns, L.O.; Schipper, E.L.F.; van Aalst, M. 2014: Regional context. In: Climate Change 2014: Impacts, Adaptation, and Vulnerability; Part B: Regional Aspects. Contribution of Working Group II to the Fifth Assessment Report of the Intergovernmental Panel on Climate Change; Barros, V.R., Field, C.B., Dokken, D.J., Mastrandrea, M.D., Mach, K.J., Bilir, T.E., Chatterjee, M., Ebi, K.L., Estrada, Y.O., Genova, R.C., et al., Eds.; Cambridge University Press: Cambridge, UK; New York, NY, USA, 2014; pp. 1133–1197. [Google Scholar]
- Solomon, S. (Ed.) IPCC Climate Change 2007: The Physical Science Basis; Cambridge University Press: Cambridge, UK, 2007; p. 1007. [Google Scholar]
- IPCC. IPCC Third Assessment Report: Climate Change 2001 (TAR); IPCC: Geneva, Switzerland, 2001. [Google Scholar]
- Masson-Delmotte, V.; Zhai, P.; Pirani, A.; Connors, S.L.; Péan, C.; Berger, S.; Caud, N.; Chen, Y.; Goldfarb, L.; Gomis, M.I.; et al. (Eds.) Climate Change 2021: The Physical Science Basis. Contribution of Working Group I to the Sixth Assessment Report of the Intergovernmental Panel on Climate Change; Cambridge University Press: Cambridge, UK, 2021. [Google Scholar]
- Abbass, K.; Qasim, M.Z.; Song, H.; Murshed, M.; Mahmood, H.; Younis, I. A Review of the Global Climate Change Impacts, Adaptation, and Sustainable Mitigation Measures. Environ. Sci. Pollut. Res. 2022, 29, 42539–42559. [Google Scholar] [CrossRef] [PubMed]
- Malhi, Y.; Franklin, J.; Seddon, N.; Solan, M.; Turner, M.G.; Field, C.B.; Knowlton, N. Climate Change and Ecosystems: Threats, Opportunities and Solutions. Philos. Trans. R. Soc. B Biol. Sci. 2020, 375, 20190104. [Google Scholar] [CrossRef] [PubMed]
- Nicholson, S.E.; Nash, D.J.; Chase, B.M.; Grab, S.W.; Shanahan, T.M.; Verschuren, D.; Asrat, A.; Lézine, A.-M.; Umer, M. Temperature Variability over Africa during the Last 2000 Years. Holocene 2013, 23, 1085–1094. [Google Scholar] [CrossRef]
- Gan, T.Y.; Ito, M.; Hülsmann, S.; Qin, X.; Lu, X.X.; Liong, S.Y.; Rutschman, P.; Disse, M.; Koivusalo, H. Possible Climate Change/Variability and Human Impacts, Vulnerability of Drought-Prone Regions, Water Resources and Capacity Building for Africa. Hydrol. Sci. J. 2016, 61, 1209–1226. [Google Scholar] [CrossRef]
- IPCC. AR6 Climate Change 2022: Impacts, Adaptation and Vulnerability; IPCC: Geneva, Switzerland, 2022. [Google Scholar]
- Sutton, M.A.; van Grinsven, H.; Billen, G.; Bleeker, A.; Bouwman, A.F.; Bull, K.; Erisman, J.W.; Grennfelt, P.; Grizzetti, B.; Howard, C.M.; et al. Summary for Policy Makers. In The European Nitrogen Assessment: Sources, Effects and Policy Perspectives; Bleeker, A., Grizzetti, B., Howard, C.M., Billen, G., van Grinsven, H., Erisman, J.W., Sutton, M.A., Grennfelt, P., Eds.; Cambridge University Press: Cambridge, UK, 2011; pp. xxiv–xxxiv. ISBN 978-1-107-00612-6. [Google Scholar]
- Niang, I.; Ruppel, O.C.; Abdrabo, M.A.; Essel, A.; Lennard, C.; Padgham, J.; Urquhart, P. Africa. In Climate Change 2014: Impacts, Adaptation, and Vulnerability; Barros, V.R., Ed.; Part B: Regional Aspects; Cambridge University Press: Cambridge, UK, 2014; pp. 1199–1265. [Google Scholar]
- Almazroui, M.; Saeed, F.; Saeed, S.; Nazrul Islam, M.; Ismail, M.; Klutse, N.A.B.; Siddiqui, M.H. Projected Change in Temperature and Precipitation Over Africa from CMIP6. Earth Syst. Environ. 2020, 4, 455–475. [Google Scholar] [CrossRef]
- Gebrechorkos, S.H.; Hülsmann, S.; Bernhofer, C. Long-Term Trends in Rainfall and Temperature Using High-Resolution Climate Datasets in East Africa. Sci. Rep. 2019, 9, 11376. [Google Scholar] [CrossRef] [PubMed]
- Gebrechorkos, S.H.; Hülsmann, S.; Bernhofer, C. Analysis of Climate Variability and Droughts in East Africa Using High-Resolution Climate Data Products. Glob. Planet. Chang. 2020, 186, 103130. [Google Scholar] [CrossRef]
- Haile, G.G.; Tang, Q.; Leng, G.; Jia, G.; Wang, J.; Cai, D.; Sun, S.; Baniya, B.; Zhang, Q. Long-Term Spatiotemporal Variation of Drought Patterns over the Greater Horn of Africa. Sci. Total Environ. 2020, 704, 135299. [Google Scholar] [CrossRef]
- Omambia, A.N.; Shemsanga, C.; Sanchez Hernandez, I.A. Climate Change Impacts, Vulnerability, and Adaptation in East Africa (EA) and South America (SA). In Handbook of Climate Change Mitigation; Chen, W.-Y., Seiner, J., Suzuki, T., Lackner, M., Eds.; Springer: New York, NY, USA, 2012; pp. 571–620. ISBN 978-1-4419-7991-9. [Google Scholar]
- WWF Climate Change Impacts on East Africa. A Review of the Scientific Literature; World Wide Fund For Nature: Washington, DC, USA, 2006. [Google Scholar]
- Haile, G.G.; Tang, Q.; Sun, S.; Huang, Z.; Zhang, X.; Liu, X. Droughts in East Africa: Causes, Impacts and Resilience. Earth-Sci. Rev. 2019, 193, 146–161. [Google Scholar] [CrossRef]
- Gebrechorkos, S.H.; Hülsmann, S.; Bernhofer, C. Changes in Temperature and Precipitation Extremes in Ethiopia, Kenya, and Tanzania. Int. J. Climatol. 2019, 39, 18–30. [Google Scholar] [CrossRef]
- Bradshaw, C.D.; Pope, E.; Kay, G.; Davie, J.C.S.; Cottrell, A.; Bacon, J.; Cosse, A.; Dunstone, N.; Jennings, S.; Challinor, A.; et al. Unprecedented Climate Extremes in South Africa and Implications for Maize Production. Environ. Res. Lett. 2022, 17, 084028. [Google Scholar] [CrossRef]
- Ficchì, A.; Cloke, H.; Neves, C.; Woolnough, S.; Coughlan de Perez, E.; Zsoter, E.; Pinto, I.; Meque, A.; Stephens, E. Beyond El Niño: Unsung Climate Modes Drive African Floods. Weather. Clim. Extrem. 2021, 33, 100345. [Google Scholar] [CrossRef]
- Ogwang, B.; Ongoma, V.; Shilenje, Z.W.; Ramotubei, T.; Letuma, M.; Ngaina, J. Influence of Indian Ocean Dipole on Rainfall Variability and Extremes over Southern Africa. Mausam 2020, 71, 637–648. [Google Scholar] [CrossRef]
- Rouault, M.; Monyela, B.; Imbol Koungue, R.A.; Imbol Nkwinkwa, A.S.N.; Dieppois, B.; Illig, S.; Keenlyside, N. Ocean Impact on Southern African Climate Variability and Water Resources; Water Research Commission: Pretoria, South Africa, 2019. [Google Scholar]
- Fer, I.; Tietjen, B.; Jeltsch, F.; Wolff, C. The Influence of El Niño–Southern Oscillation Regimes on Eastern African Vegetation and Its Future Implications under the RCP8.5 Warming Scenario. Biogeosciences 2017, 14, 4355–4374. [Google Scholar] [CrossRef]
- Mpelasoka, F.; Awange, J.L.; Zerihun, A. Influence of Coupled Ocean-Atmosphere Phenomena on the Greater Horn of Africa Droughts and Their Implications. Sci. Total Environ. 2018, 610–611, 691–702. [Google Scholar] [CrossRef]
- Endris, H.S.; Lennard, C.; Hewitson, B.; Dosio, A.; Nikulin, G.; Artan, G.A. Future Changes in Rainfall Associated with ENSO, IOD and Changes in the Mean State over Eastern Africa. Clim. Dyn. 2018, 52, 2029–2053. [Google Scholar] [CrossRef]
- Tierney, J.E.; Ummenhofer, C.C.; deMenocal, P.B. Past and Future Rainfall in the Horn of Africa. Sci. Adv. 2015, 1, e1500682. [Google Scholar] [CrossRef]
- Gebrechorkos, S.H.; Taye, M.T.; Birhanu, B.; Solomon, D.; Demissie, T. Future Changes in Climate and Hydroclimate Extremes in East Africa. Earth’s Future, 2023; 11, e2022EF003011. [Google Scholar] [CrossRef]
- Palmer, P.I.; Wainwright, C.M.; Dong, B.; Maidment, R.I.; Wheeler, K.G.; Gedney, N.; Hickman, J.E.; Madani, N.; Folwell, S.S.; Abdo, G.; et al. Drivers and Impacts of Eastern African Rainfall Variability. Nat. Rev. Earth Environ. 2023, 4, 254–270. [Google Scholar] [CrossRef]
- Park, S.; Kang, D.; Yoo, C.; Im, J.; Lee, M.-I. Recent ENSO Influence on East African Drought during Rainy Seasons through the Synergistic Use of Satellite and Reanalysis Data. ISPRS J. Photogramm. Remote Sens. 2020, 162, 17–26. [Google Scholar] [CrossRef]
- Blau, M.T.; Ha, K.-J. The Indian Ocean Dipole and Its Impact on East African Short Rains in Two CMIP5 Historical Scenarios with and Without Anthropogenic Influence. J. Geophys. Res. Atmos. 2020, 125, e2020JD033121. [Google Scholar] [CrossRef]
- Wainwright, C.M.; Finney, D.L.; Kilavi, M.; Black, E.; Marsham, J.H. Extreme Rainfall in East Africa, October 2019–January 2020 and Context under Future Climate Change. Weather 2021, 76, 26–31. [Google Scholar] [CrossRef]
- Funk, C.; Dettinger, M.D.; Michaelsen, J.C.; Verdin, J.P.; Brown, M.E.; Barlow, M.; Hoell, A. Warming of the Indian Ocean Threatens Eastern and Southern African Food Security but Could Be Mitigated by Agricultural Development. Proc. Natl. Acad. Sci. USA 2008, 105, 11081–11086. [Google Scholar] [CrossRef] [PubMed]
- Ngcamu, B.S.; Chari, F. Drought Influences on Food Insecurity in Africa: A Systematic Literature Review. Int. J. Environ. Res. Public Health 2020, 17, 5897. [Google Scholar] [CrossRef]
- FAO. The State of Food Insecurity in the World (SOFI); Food and Agricultural Organization of the United Nations and World Bank: Rome, Italy, 2014. [Google Scholar]
- Mahoo, H.F.; Radeny, M.A.O.; Kinyangi, J.; Cramer, L. Climate Change Vulnerability and Risk Assessment of Agriculture and Food Security in Ethiopia: Which Way Forward? Working Paper No. 59. CCAFS Working Paper 2013. Available online: https://cgspace.cgiar.org/items/3ab9835e-26e6-42e7-8a85-15bf7bdb6dc4 (accessed on 21 January 2024).
- Kotir, J.H. Climate Change and Variability in Sub-Saharan Africa: A Review of Current and Future Trends and Impacts on Agriculture and Food Security. Environ. Dev. Sustain. 2011, 13, 587–605. [Google Scholar] [CrossRef]
- Nicol, A.; Langan, S.J.; Victor, M.; Gonsalves, J.F. Water-Smart Agriculture in East Africa; CGIAR Research Program on Water, Land and Ecosystems; International Water Management Institute: Colombo, Sri Lanka, 2015; ISBN 978-92-9090-813-5. [Google Scholar]
- Emediegwu, L.E.; Wossink, A.; Hall, A. The Impacts of Climate Change on Agriculture in Sub-Saharan Africa: A Spatial Panel Data Approach. World Dev. 2022, 158, 105967. [Google Scholar] [CrossRef]
- CDKN. The IPCC’s Fifth Assessment Report: Whats in It for Africa; CDKN: London, UK, 2014; p. 79. [Google Scholar]
- Saimi, F.M.; Hamzah, F.M.; Toriman, M.E.; Jaafar, O.; Tajudin, H. Trend and Linearity Analysis of Meteorological Parameters in Peninsular Malaysia. Sustainability 2020, 12, 9533. [Google Scholar] [CrossRef]
- Chisanga, C.B.; Nkonde, E.; Phiri, E.; Mubanga, K.H.; Lwando, C. Trend Analysis of Rainfall from 1981–2022 over Zambia. Heliyon 2023, 9, e22345. [Google Scholar] [CrossRef]
- Tadeyo, E.; Chen, D.; Ayugi, B.; Yao, C. Characterization of Spatio-Temporal Trends and Periodicity of Precipitation over Malawi during 1979–2015. Atmosphere 2020, 11, 891. [Google Scholar] [CrossRef]
- Beck, H.E.; Zimmermann, N.E.; McVicar, T.R.; Vergopolan, N.; Berg, A.; Wood, E.F. Present and Future Köppen-Geiger Climate Classification Maps at 1-Km Resolution. Sci. Data 2018, 5, 180214. [Google Scholar] [CrossRef]
- Funk, C.; Peterson, P.; Landsfeld, M.; Pedreros, D.; Verdin, J.; Shukla, S.; Husak, G.; Rowland, J.; Harrison, L.; Hoell, A.; et al. The Climate Hazards Infrared Precipitation with Stations—A New Environmental Record for Monitoring Extremes. Sci. Data 2015, 2, 150066. [Google Scholar] [CrossRef] [PubMed]
- Beck, H.E.; Dijk, A.I.J.M.V.; Larraondo, P.R.; McVicar, T.R.; Pan, M.; Dutra, E.; Miralles, D.G. MSWX: Global 3-Hourly 0.1° Bias-Corrected Meteorological Data Including Near-Real-Time Updates and Forecast Ensembles. Bull. Am. Meteorol. Soc. 2022, 103, E710–E732. [Google Scholar] [CrossRef]
- Gebrechorkos, S.H.; Hülsmann, S.; Bernhofer, C. Evaluation of Multiple Climate Data Sources for Managing Environmental Resources in East Africa. Hydrol. Earth Syst. Sci. 2018, 22, 4547–4564. [Google Scholar] [CrossRef]
- Dinku, T.; Funk, C.; Peterson, P.; Maidment, R.; Tadesse, T.; Gadain, H.; Ceccato, P. Validation of the CHIRPS Satellite Rainfall Estimates over Eastern Africa. Q. J. R. Meteorol. Soc. 2018, 144, 292–312. [Google Scholar] [CrossRef]
- AL-Falahi, A.H.; Saddique, N.; Spank, U.; Gebrechorkos, S.H.; Bernhofer, C. Evaluation the Performance of Several Gridded Precipitation Products over the Highland Region of Yemen for Water Resources Management. Remote Sens. 2020, 12, 2984. [Google Scholar] [CrossRef]
- Harris, I.; Jones, P.D.; Osborn, T.J.; Lister, D.H. Updated High-Resolution Grids of Monthly Climatic Observations—The CRU TS3.10 Dataset. Int. J. Climatol. 2014, 34, 623–642. [Google Scholar] [CrossRef]
- Karger, D.N.; Conrad, O.; Böhner, J.; Kawohl, T.; Kreft, H.; Soria-Auza, R.W.; Zimmermann, N.E.; Linder, H.P.; Kessler, M. Climatologies at High Resolution for the Earth’s Land Surface Areas. Sci. Data 2017, 4, 170122. [Google Scholar] [CrossRef]
- Hargreaves, G.; Samani, Z. Reference Crop Evapotranspiration from Temperature. Appl. Eng. Agric. 1985, 1, 96–99. [Google Scholar] [CrossRef]
- Taye, M.T.; Willems, P. Identifying Sources of Temporal Variability in Hydrological Extremes of the Upper Blue Nile Basin. J. Hydrol. 2013, 499, 61–70. [Google Scholar] [CrossRef]
- Karl, T.R.; Nicholls, N.; Ghazi, A. CLIVAR/GCOS/WMO Workshop on Indices and Indicators for Climate Extremes Workshop Summary. In Weather and Climate Extremes: Changes, Variations and a Perspective from the Insurance Industry; Karl, T.R., Nicholls, N., Ghazi, A., Eds.; Springer: Dordrecht, The Netherlands, 1999; pp. 3–7. ISBN 978-94-015-9265-9. [Google Scholar]
- Schulzweida, U.; Kornblueh, L. Ralf Quast CDO—Climate Data Operators—Project Management Service 2009. Available online: https://code.mpimet.mpg.de/projects/cdo (accessed on 21 January 2024).
- Kendall, M.G. Rank Correlation Methods, 4th ed.; Charles Griffin: London, UK, 1975; Available online: https://search.worldcat.org/title/Rank-correlation-methods/oclc/3827024 (accessed on 21 January 2024).
- Sen, P.K. Estimates of the Regression Coefficient Based on Kendall’s Tau. J. Am. Stat. Assoc. 1968, 63, 1379–1389. [Google Scholar] [CrossRef]
- Navarro-Racines, C.; Tarapues, J.; Thornton, P.; Jarvis, A.; Ramirez-Villegas, J. High-Resolution and Bias-Corrected CMIP5 Projections for Climate Change Impact Assessments. Sci. Data 2020, 7, 7. [Google Scholar] [CrossRef]
- Wang, Y.; Karimi, H.A. Generating High-Resolution Climatological Precipitation Data Using SinGAN. Big Earth Data 2023, 7, 81–100. [Google Scholar] [CrossRef]
- Chakraborty, D.; Dobor, L.; Zolles, A.; Hlásny, T.; Schueler, S. High-Resolution Gridded Climate Data for Europe Based on Bias-Corrected EURO-CORDEX: The ECLIPS Dataset. Geosci. Data J. 2021, 8, 121–131. [Google Scholar] [CrossRef]
- du Plessis, J.A.; Kibii, J.K. Applicability of CHIRPS-Based Satellite Rainfall Estimates for South Africa. J. South Afr. Inst. Civ. Eng. 2021, 63, 43–54. [Google Scholar] [CrossRef]
- Kouakou, C.; Paturel, J.-E.; Satgé, F.; Tramblay, Y.; Defrance, D.; Rouché, N. Comparison of Gridded Precipitation Estimates for Regional Hydrological Modeling in West and Central Africa. J. Hydrol. Reg. Stud. 2023, 47, 101409. [Google Scholar] [CrossRef]
- Muthoni, F.K.; Odongo, V.O.; Ochieng, J.; Mugalavai, E.M.; Mourice, S.K.; Hoesche-Zeledon, I.; Mwila, M.; Bekunda, M. Long-Term Spatial-Temporal Trends and Variability of Rainfall over Eastern and Southern Africa. Theor. Appl. Climatol. 2019, 137, 1869–1882. [Google Scholar] [CrossRef]
- Haghtalab, N.; Moore, N.; Ngongondo, C. Spatio-Temporal Analysis of Rainfall Variability and Seasonality in Malawi. Reg. Environ. Chang. 2019, 19, 2041–2054. [Google Scholar] [CrossRef]
- Maidment, R.I.; Allan, R.P.; Black, E. Recent Observed and Simulated Changes in Precipitation over Africa. Geophys. Res. Lett. 2015, 42, 8155–8164. [Google Scholar] [CrossRef]
- Nash, D.J.; Pribyl, K.; Endfield, G.H.; Klein, J.; Adamson, G.C.D. Rainfall Variability over Malawi during the Late 19th Century. Int. J. Climatol. 2018, 38, e629–e642. [Google Scholar] [CrossRef]
- Kumbuyo, C.P.; Yasuda, H.; Kitamura, Y.; Shimizu, K. Fluctuation of Rainfall Time Series in Malawi: An Analysis of Selected Areas. Geofizika 2014, 31, 13–28. [Google Scholar] [CrossRef]
- Jiang, Y.; Zhou, L.; Roundy, P.E.; Hua, W.; Raghavendra, A. Increasing Influence of Indian Ocean Dipole on Precipitation Over Central Equatorial Africa. Geophys. Res. Lett. 2021, 48, e2020GL092370. [Google Scholar] [CrossRef]
- Diedhiou, A.; Bichet, A.; Wartenburger, R.; Seneviratne, S.I.; Rowell, D.P.; Sylla, M.B.; Diallo, I.; Todzo, S.; Touré, N.E.; Camara, M.; et al. Changes in Climate Extremes over West and Central Africa at 1.5 °C and 2 °C Global Warming. Environ. Res. Lett. 2018, 13, 065020. [Google Scholar] [CrossRef]
- Omondi, P.A.; Awange, J.L.; Forootan, E.; Ogallo, L.A.; Barakiza, R.; Girmaw, G.B.; Fesseha, I.; Kululetera, V.; Kilembe, C.; Mbati, M.M.; et al. Changes in Temperature and Precipitation Extremes over the Greater Horn of Africa Region from 1961 to 2010. Int. J. Climatol. 2014, 34, 1262–1277. [Google Scholar] [CrossRef]
- Mengistu, A.G.; Woyessa, Y.E.; Tesfuhuney, W.A.; Steyn, A.S.; Lee, S.S. Assessing the Impact of Climate Change on Future Extreme Temperature Events in Major South African Cities. Theor. Appl. Climatol. 2023, 155, 1807–1819. [Google Scholar] [CrossRef]
- Bedair, H.; Alghariani, M.S.; Omar, E.; Anibaba, Q.A.; Remon, M.; Bornman, C.; Kiboi, S.K.; Rady, H.A.; Salifu, A.-M.A.; Ghosh, S.; et al. Global Warming Status in the African Continent: Sources, Challenges, Policies, and Future Direction. Int. J. Environ. Res. 2023, 17, 45. [Google Scholar] [CrossRef]
- Engdaw, M.M.; Ballinger, A.P.; Hegerl, G.C.; Steiner, A.K. Changes in Temperature and Heat Waves over Africa Using Observational and Reanalysis Data Sets. Int. J. Climatol. 2022, 42, 1165–1180. [Google Scholar] [CrossRef]
- Adhikari, U.; Nejadhashemi, A.P.; Woznicki, S.A. Climate Change and Eastern Africa: A Review of Impact on Major Crops. Food Energy Secur. 2015, 4, 110–132. [Google Scholar] [CrossRef]
- Camberlin, P. Temperature Trends and Variability in the Greater Horn of Africa: Interactions with Precipitation. Clim. Dyn. 2017, 48, 477–498. [Google Scholar] [CrossRef]
- Funk, C. USGS Fact Sheet 2010–3074: A Climate Trend Analysis of Kenya; U.S. Geological Survey Earth Resources Observation and Science: Sioux Falls, SD, USA, 2010.
- Gebrechorkos, S.H.; Hülsmann, S.; Bernhofer, C. Regional Climate Projections for Impact Assessment Studies in East Africa. Environ. Res. Lett. 2019, 14, 044031. [Google Scholar] [CrossRef]
- Ayugi, B.O.; Chung, E.-S.; Zhu, H.; Ogega, O.M.; Babousmail, H.; Ongoma, V. Projected Changes in Extreme Climate Events over Africa under 1.5 °C, 2.0 °C and 3.0 °C Global Warming Levels Based on CMIP6 Projections. Atmos. Res. 2023, 292, 106872. [Google Scholar] [CrossRef]
- Kikstra, J.; Nicholls, Z.; Smith, C.; Lewis, J.; Lamboll, R.; Byers, E.; Sandstad, M.; Meinshausen, M.; Gidden, M.; Rogelj, J.; et al. The IPCC Sixth Assessment Report WGIII Climate Assessment of Mitigation Pathways: From Emissions to Global Temperatures. Geosci. Model Dev. 2022, 15, 9075–9109. [Google Scholar] [CrossRef]
- Majdi, F.; Hosseini, S.A.; Karbalaee, A.; Kaseri, M.; Marjanian, S. Future Projection of Precipitation and Temperature Changes in the Middle East and North Africa (MENA) Region Based on CMIP6. Theor. Appl. Climatol. 2022, 147, 1249–1262. [Google Scholar] [CrossRef]
- AL-Falahi, A.H.; Barry, S.; Gebrechorkos, S.H.; Spank, U.; Bernhofer, C. Potential of Traditional Adaptation Measures in Mitigating the Impact of Climate Change. Sustainability 2023, 15, 15442. [Google Scholar] [CrossRef]
Figure 1.
Average annual (a) precipitation (Prcp, mm), (b) potential evapotranspiration (PET, mm), (c) maximum temperature (Tmax, °C), and (d) minimum temperature (Tmin, °C) for the period 1981–2021 for Malawi (longitude: 32.7°–36°) and Zambia (longitude: 22°–34°).
Figure 1.
Average annual (a) precipitation (Prcp, mm), (b) potential evapotranspiration (PET, mm), (c) maximum temperature (Tmax, °C), and (d) minimum temperature (Tmin, °C) for the period 1981–2021 for Malawi (longitude: 32.7°–36°) and Zambia (longitude: 22°–34°).

Figure 2.
Long-term trend in annual (a) precipitation (Prcp, mm/year) and (b) potential evapotranspiration (PET, mm/year) during 1981–2021. The lower panel illustrates the significance (sig) of the trend (p-value < 0.05) for (c) Prcp and (d) PET. Values of 1 and −1 indicate a significant increasing and decreasing trend, respectively, while a non-significant change is represented by 0.

Figure 3.
Long-term trend in annual (a) maximum (Tmax) and (b) minimum (Tmin) temperatures (°C/decade) during 1981–2021. The lower panel illustrates the significance (sig) of the trend with a p-value of < 0.05 for (c) Tmax and (d) Tmin. Values of 1 and −1 indicate a significant increasing and decreasing trend, respectively, while a non-significant change is represented by 0.

Figure 4.
Long-term trend in seasonal precipitation (mm/year) during (a) DJFMA, (b) MJJA, and (c) SON for Malawi and Zambia during 1981–2021. The lower panel illustrates the significance of the trend (p-value < 0.05) for (d) DJFMA, (e) MJJA, and (f) SON. Values of 1 and −1 indicate a significant increasing and decreasing trend, respectively, while a non-significant change is represented by 0.

Figure 5.
Long-term trend in seasonal maximum temperature (Tmax, °C/decade) during (a) DJFMA, (b) MJJA, and (c) SON seasons for Malawi and Zambia during 1981–2021. The lower panel illustrates the significance of the trend with a p-value of < 0.05 for (d) DJFMA, (e) MJJA, and (f) SON. Values of 1 and −1 indicate a significant increasing and decreasing trend, respectively, while a non-significant change is represented by 0.
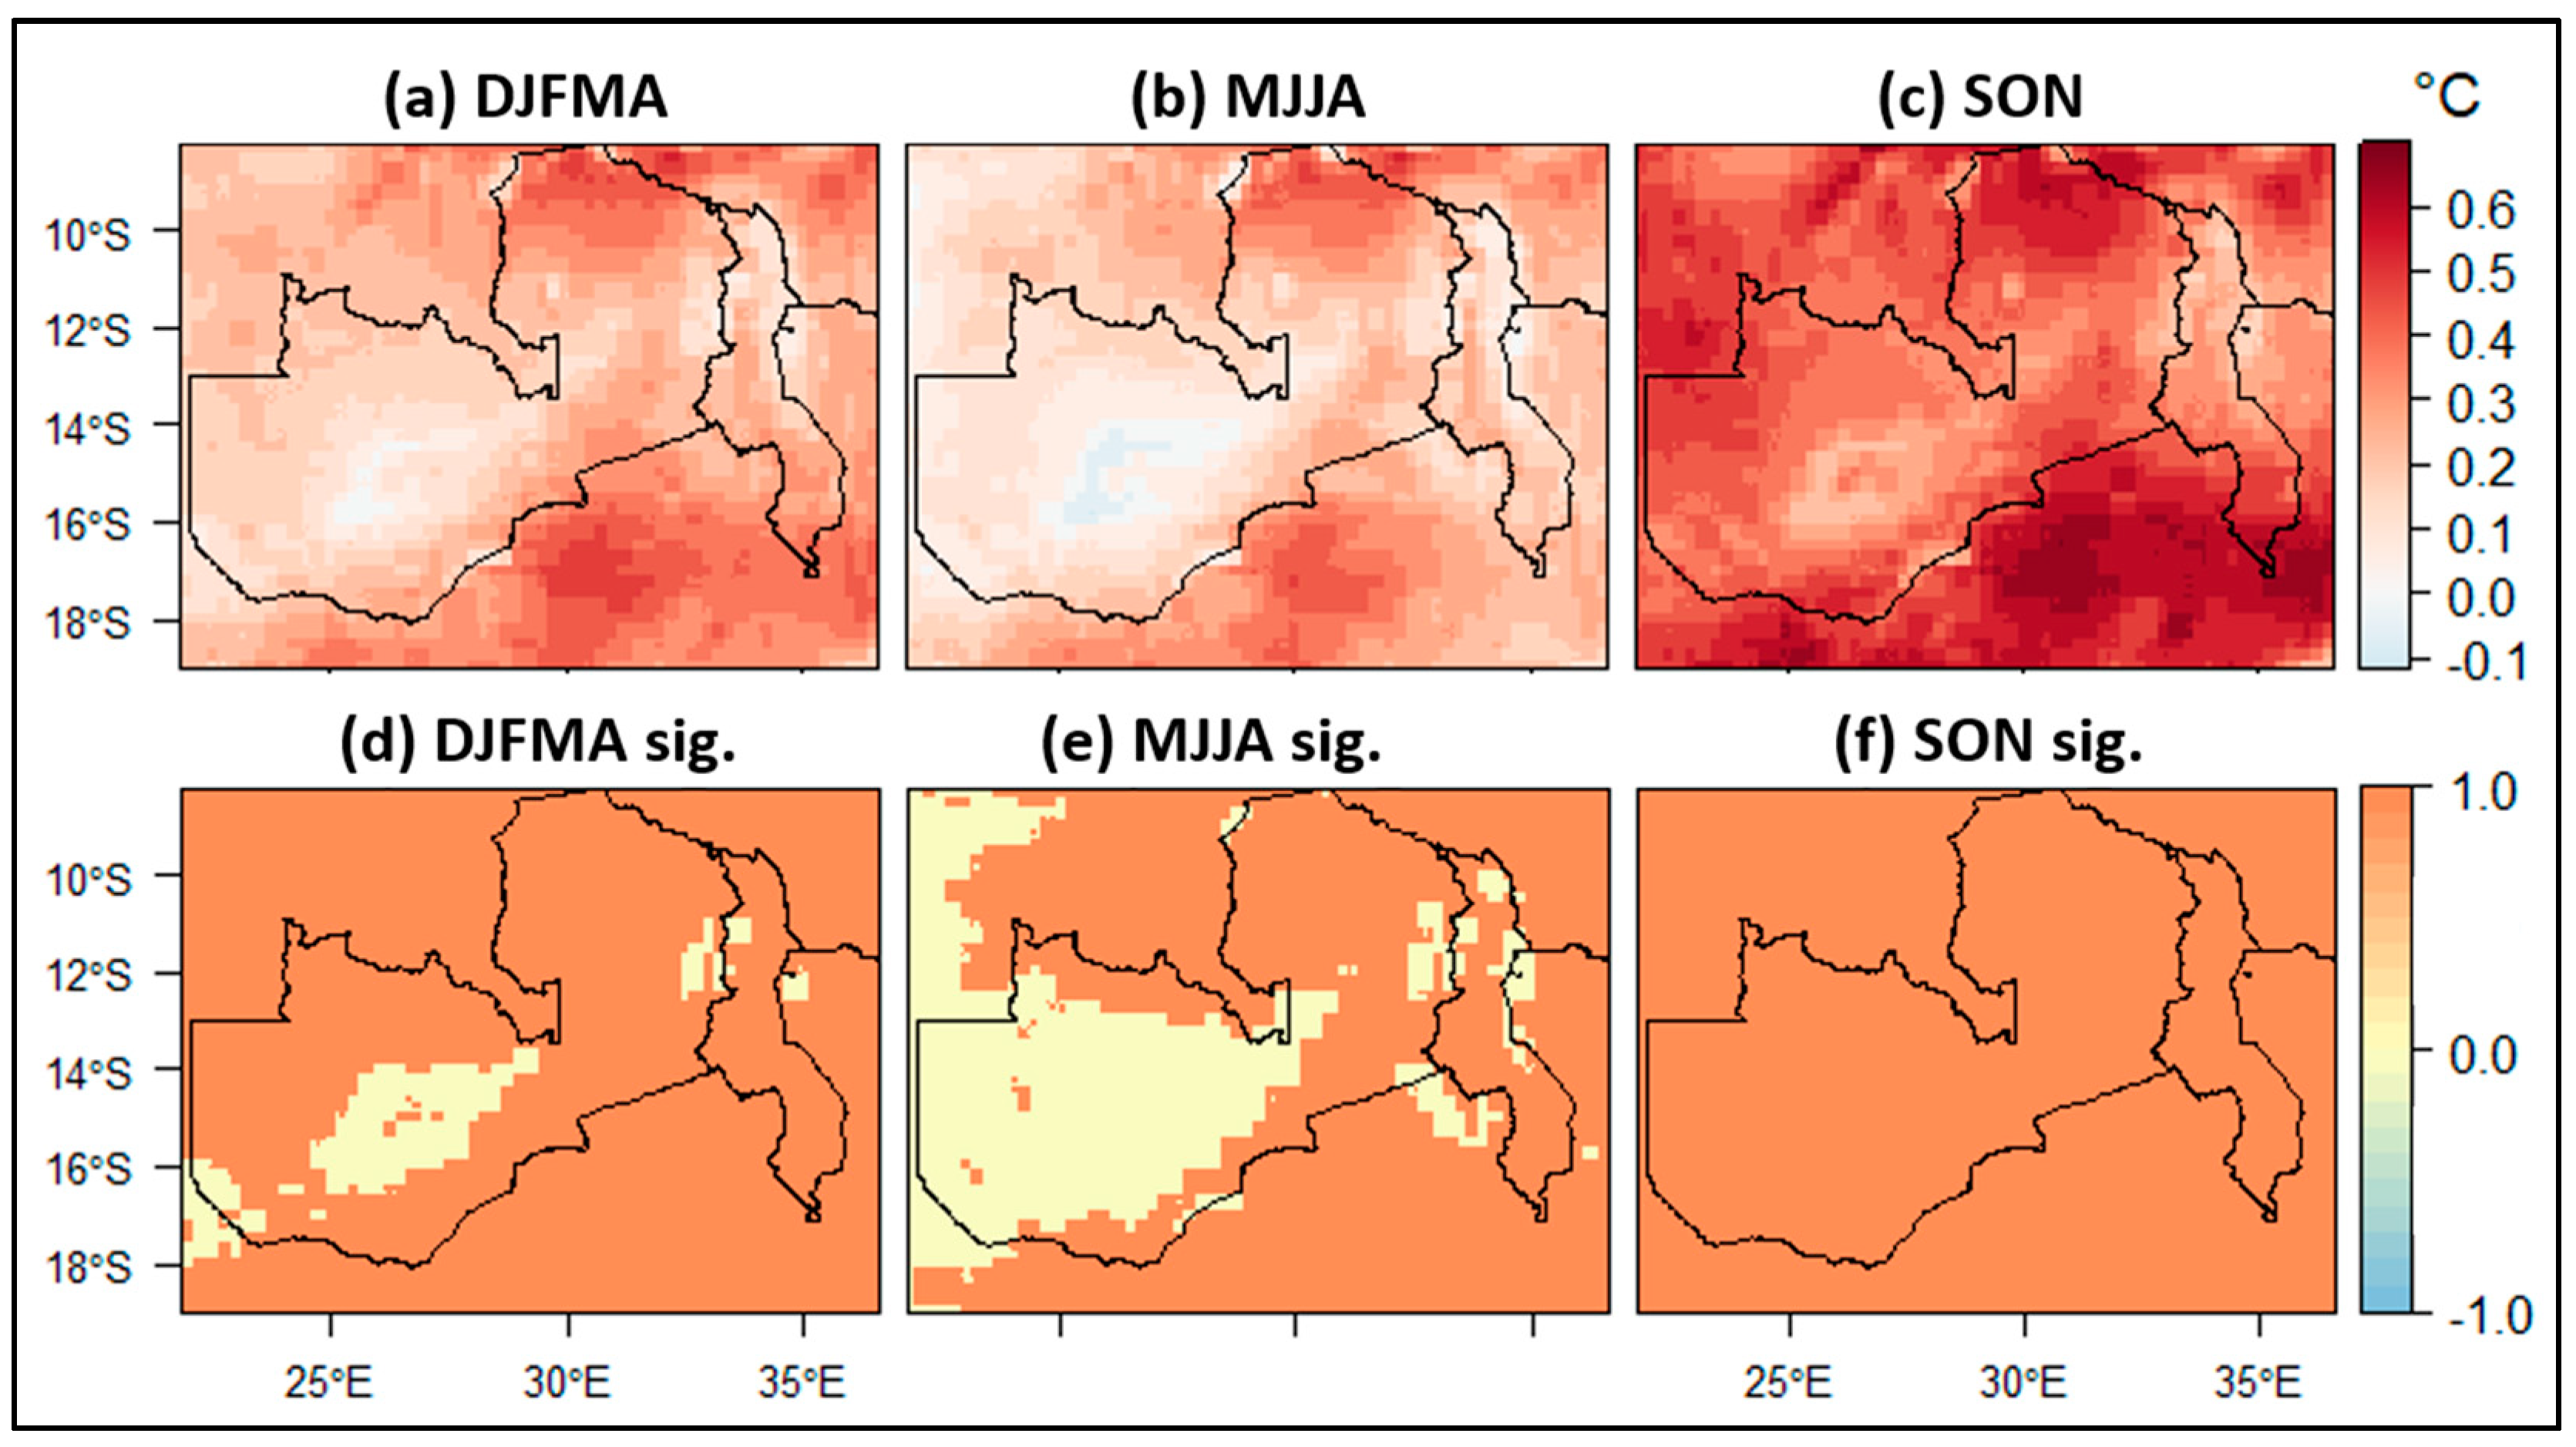
Figure 6.
Long-term trend in seasonal minimum temperature (Tmin, °C/decade) during (a) DJFMA, (b) MJJA, and (c) SON for Malawi and Zambia during 1981–2021. The lower panel illustrates the significance of the trend with a p-value of < 0.05 for (d) DJFMA, (e) MJJA, and (f) SON. Values of 1 and −1 indicate a significant increasing and decreasing trend, respectively, while a non-significant change is represented by 0.

Figure 7.
Annual trend of consecutive dry (CDD, (a)) and wet (CWD, (b)) days. The lower panel shows the significance (sig.) of the trend with a p-value of < 0.05 for (c) CDD and (d) CWD. Values of 1 and −1 indicate a significant increasing and decreasing trend, respectively, while a non-significant change is represented by 0.
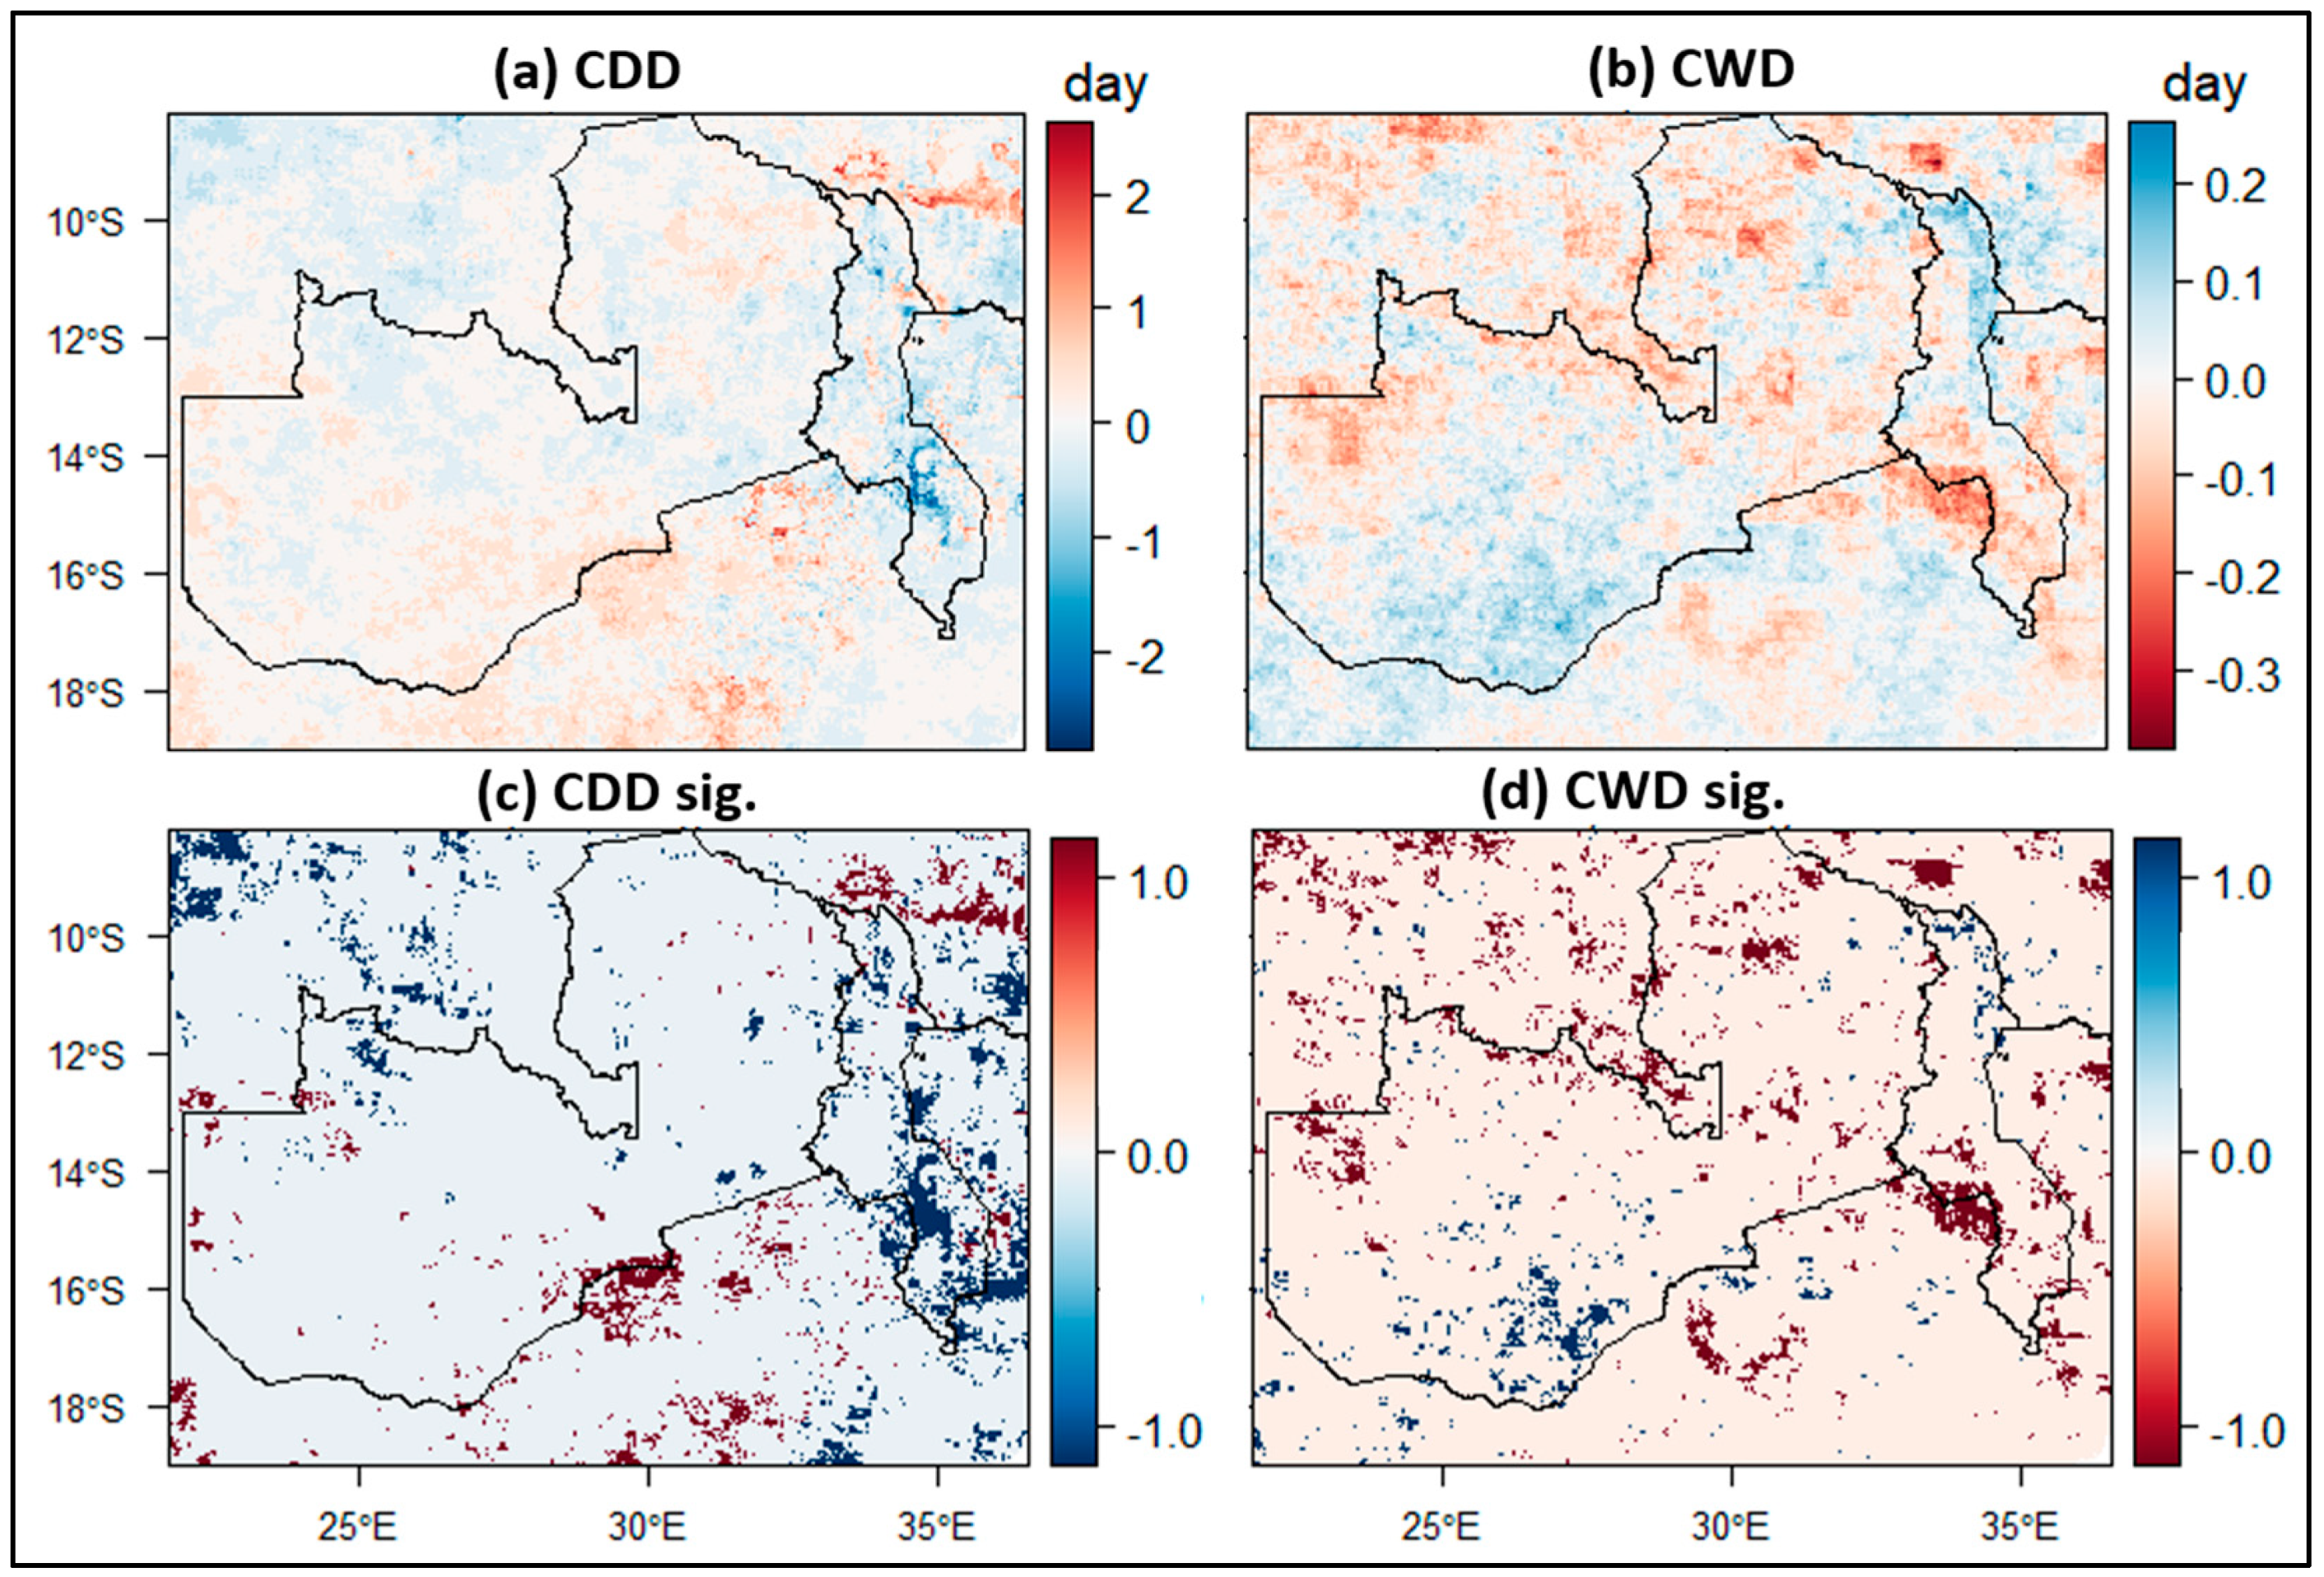
Figure 8.
Annual trend in heavy (a) and very heavy (b) rainfall days. The lower panel shows the significance (sig.) of the trend with a p-value of < 0.05 for (c) heavy and (d) very heavy rainfall days. Values of 1 and −1 indicate a significant increasing and decreasing trend, respectively, while a non-significant change is represented by 0.
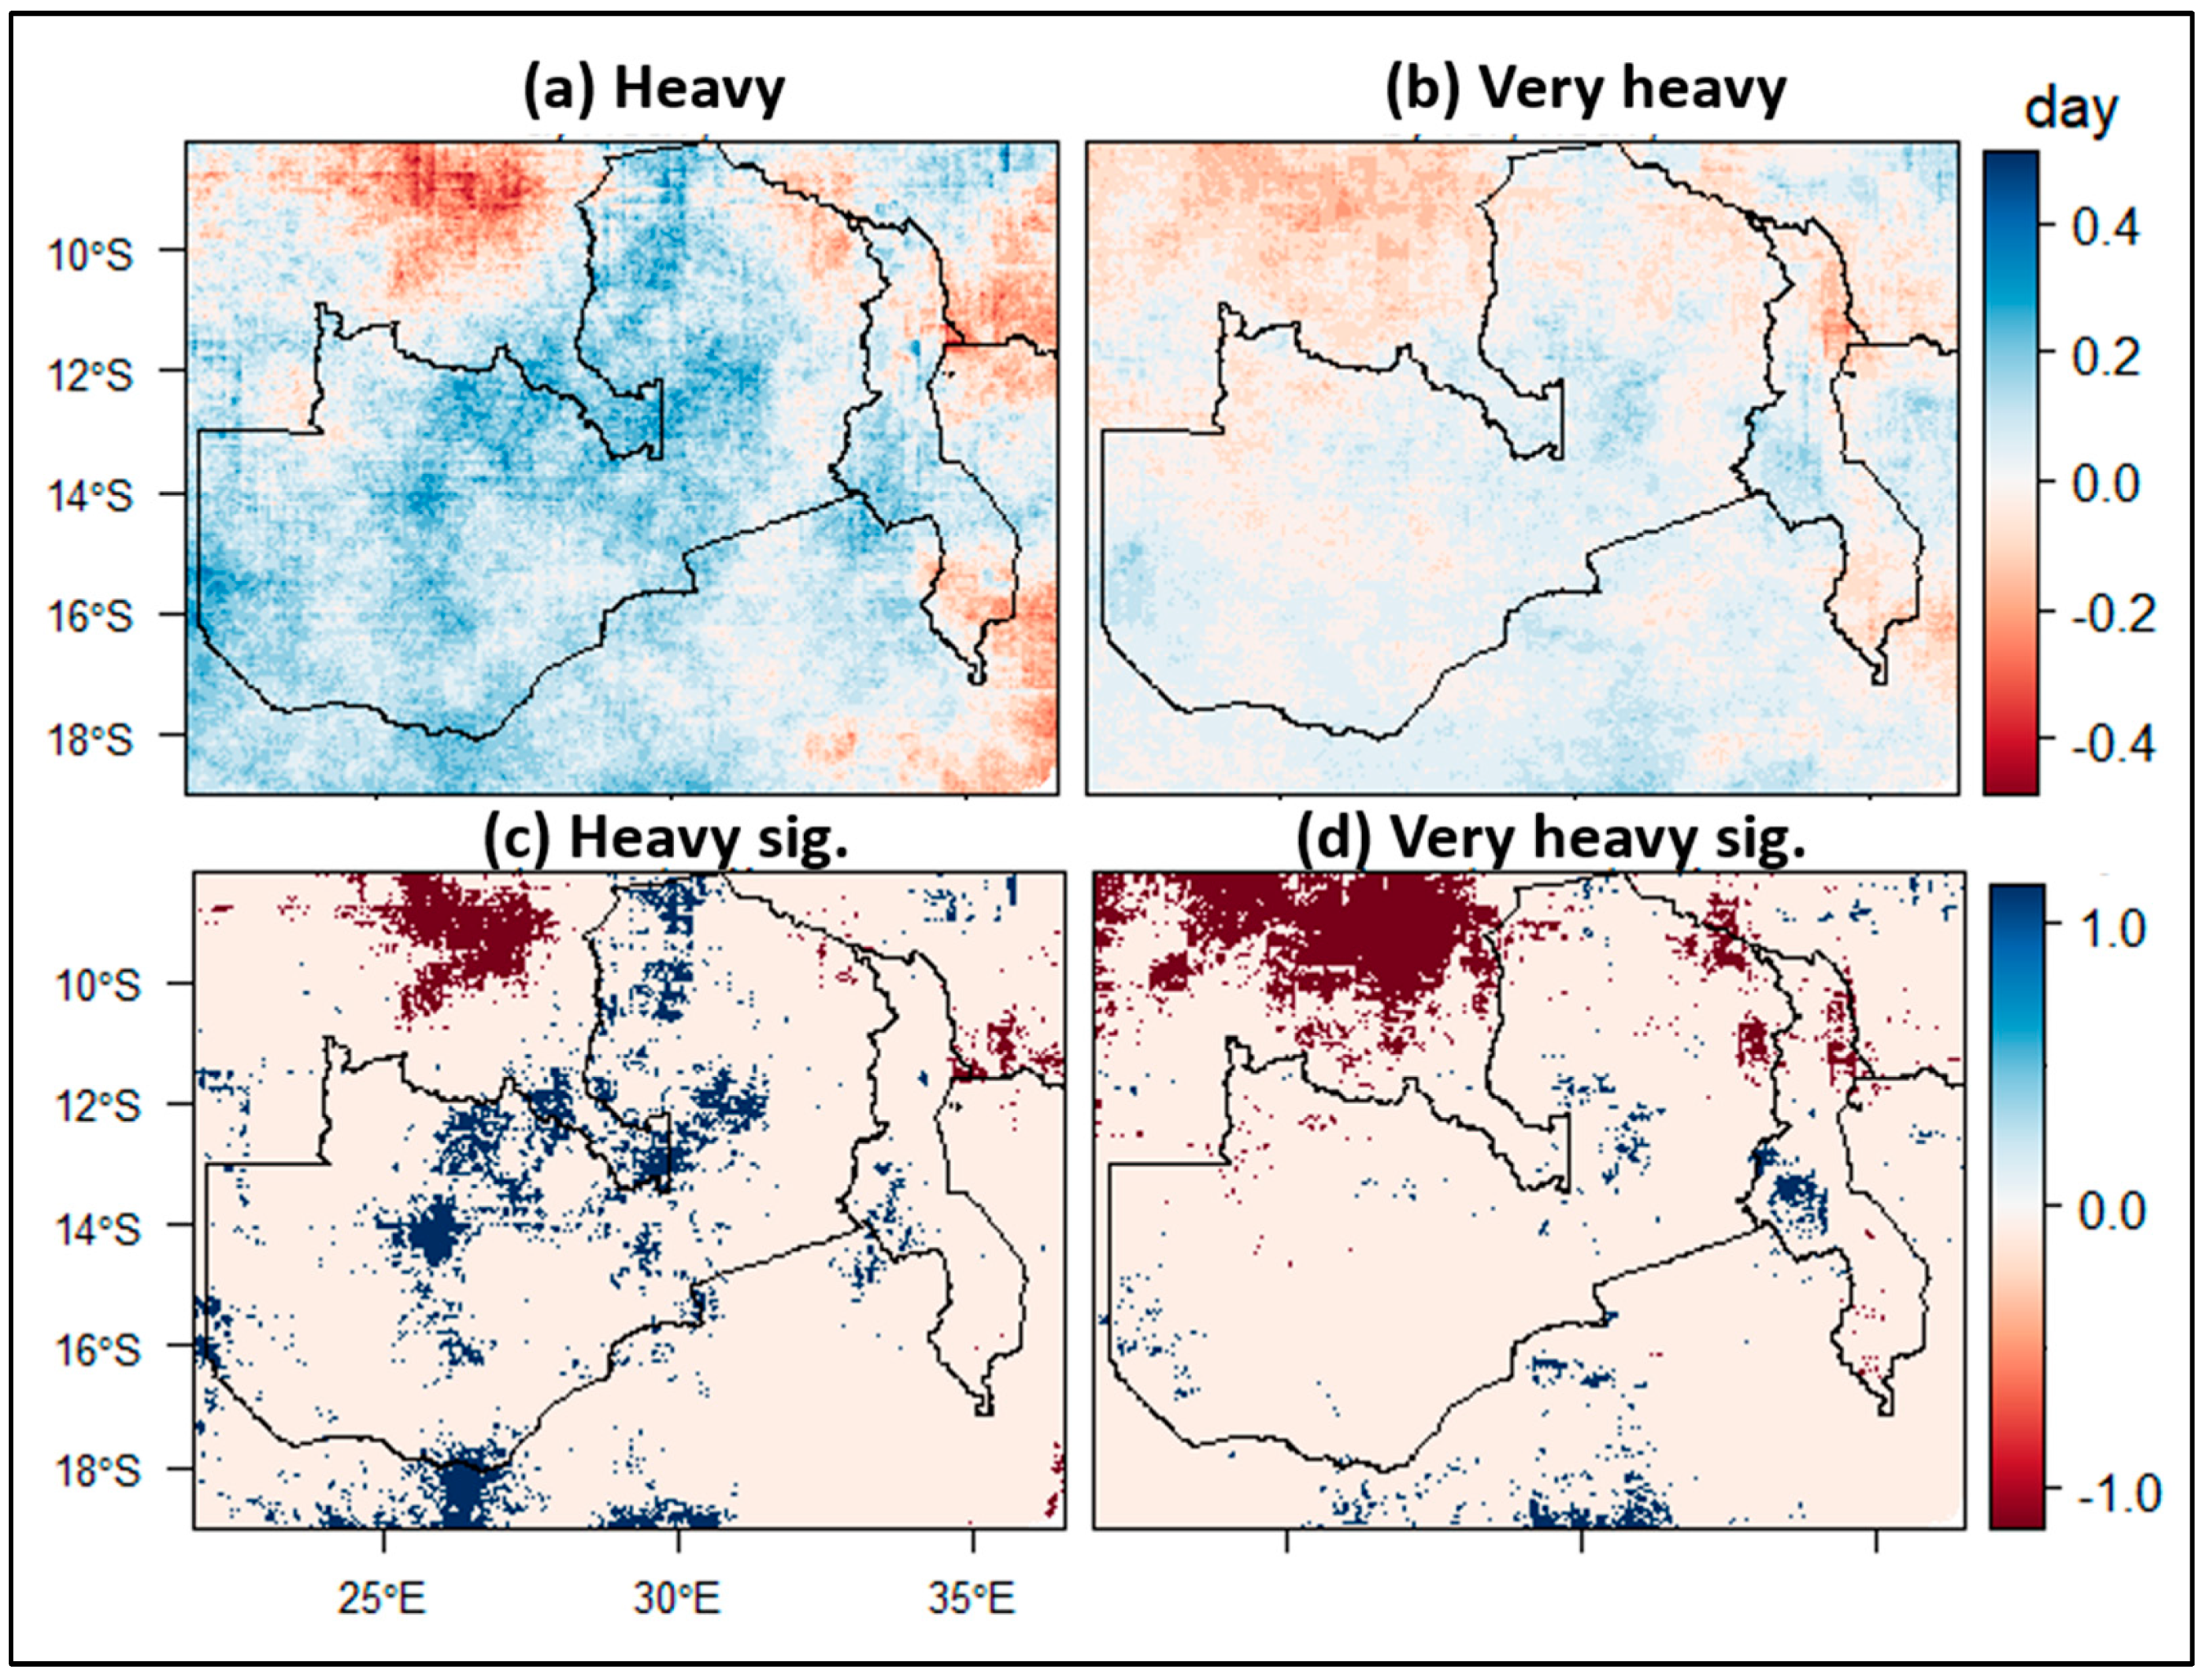
Figure 9.
Annual trend in heatwave days (a). (b) shows the significance (sig.) of the trend with a p-value of < 0.05 for heatwave days. Values of 1 and −1 indicate a significant increasing and decreasing trend, respectively, while a non-significant change is represented by 0.
Figure 9.
Annual trend in heatwave days (a). (b) shows the significance (sig.) of the trend with a p-value of < 0.05 for heatwave days. Values of 1 and −1 indicate a significant increasing and decreasing trend, respectively, while a non-significant change is represented by 0.

Figure 10.
Temporal correlation between DJFMA precipitation and ENSO (a) and IOD (b) events. The lower panel (c,d) indicates the significance of the relationship at a p-value of < 0.05, where values of 1 and 0 denote a statistically significant and non-significant relationship, respectively.
Figure 10.
Temporal correlation between DJFMA precipitation and ENSO (a) and IOD (b) events. The lower panel (c,d) indicates the significance of the relationship at a p-value of < 0.05, where values of 1 and 0 denote a statistically significant and non-significant relationship, respectively.

Table 1.
List of selected precipitation and temperature extreme indices and their definition based on ETCCDI and ECA.
Table 1.
List of selected precipitation and temperature extreme indices and their definition based on ETCCDI and ECA.
| Index | Definition | Unit |
|---|---|---|
| CDD | Consecutive Dry Day (CDD): maximum number of consecutive days with daily precipitation below 1 mm (maximum length of dry spell). | days |
| CWD | Consecutive Wet Day (CWD): maximum number of consecutive days with daily precipitation greater than 1 mm (maximum length of wet spell). | days |
| R10mm | Heavy precipitation days: total number of days with daily precipitation greater than 10 mm. | days |
| R20mm | Very heavy precipitation days: total number of days with daily precipitation greater than 20 mm. | days |
| Heatwave | Heatwave duration: number of six consecutive days when the daily maximum temperature exceeds the mean reference period by 5 °C. | days |
Disclaimer/Publisher’s Note: The statements, opinions and data contained in all publications are solely those of the individual author(s) and contributor(s) and not of MDPI and/or the editor(s). MDPI and/or the editor(s) disclaim responsibility for any injury to people or property resulting from any ideas, methods, instructions or products referred to in the content. |
© 2024 by the authors. Licensee MDPI, Basel, Switzerland. This article is an open access article distributed under the terms and conditions of the Creative Commons Attribution (CC BY) license (https://creativecommons.org/licenses/by/4.0/).
Share and Cite
MDPI and ACS Style
Demissie, T.; Gebrechorkos, S.H. Spatio-Temporal Trends in Precipitation, Temperature, and Extremes: A Study of Malawi and Zambia (1981–2021). Sustainability 2024, 16, 3885. https://doi.org/10.3390/su16103885
AMA Style
Demissie T, Gebrechorkos SH. Spatio-Temporal Trends in Precipitation, Temperature, and Extremes: A Study of Malawi and Zambia (1981–2021). Sustainability. 2024; 16(10):3885. https://doi.org/10.3390/su16103885
Chicago/Turabian StyleDemissie, Teferi, and Solomon H. Gebrechorkos. 2024. "Spatio-Temporal Trends in Precipitation, Temperature, and Extremes: A Study of Malawi and Zambia (1981–2021)" Sustainability 16, no. 10: 3885. https://doi.org/10.3390/su16103885
Note that from the first issue of 2016, this journal uses article numbers instead of page numbers. See further details here.