Article

The Risk of Water Quality Deterioration with Urban Flood Control—A Case in Wuxi

1
College of Civil Engineering, Nanjing Forestry University, Nanjing 210037, China
2
Ecological Complexity and Modeling Laboratory, Department of Botany and Plant Sciences, University of California, Riverside, CA 92521, USA
*
Author to whom correspondence should be addressed.
Sustainability 2024, 16(1), 185; https://doi.org/10.3390/su16010185
Submission received: 18 November 2023 / Revised: 19 December 2023 / Accepted: 21 December 2023 / Published: 25 December 2023

Abstract

:
There is a demand for flood control in densely populated river network areas. Therefore, small floodgates are used for long-term and rapid water flow regulation in such contexts. However, people often disregard these floodgates’ potential interference with the natural water environment. This study focused on an urban floodgate-controlled reach and monitored the monthly data of four main pollutant indicators (TN, TP, CODMn, and NH3-N) from 2016 to 2018 at six fixed sampling points (S1–S6). The difference analysis and cluster analysis results indicated that floodgate adjustments were the dominant driving factor of water quality changes in the reach, with pollutant concentration differences observed between the floodgate opening and closing periods. The results of the Canadian Council of Ministers of the Environment Water Quality Index evaluation showed that the water quality of the floodgate-controlled reach was categorized as “marginal” or “poor”. It is particularly important to note that the concentration of nitrogen compounds exceeded the allowable limits. The results of the Mann–Kendall trend and time series analyses revealed an overall upward trend in NH3-N concentration and a localized upward trend in TP concentration and presented periodic concentration fluctuations of four pollutants (TN, TP, CODMn, and NH3-N). This study highlights that flood control management using small floodgates can pose a risk of deteriorating water quality. Therefore, it is necessary to develop scientific water quality management methods.

1. Introduction

Rivers are essential natural waterway systems on Earth, and their flow characteristics profoundly impact ecosystems, human societies, and the environmental balance around their banks [1,2]. As a critical habitat for biodiversity, rivers not only supply essential potable water resources for residents but also provide the necessary productive water supply for urban agriculture, industry, and others [3]. Moreover, rivers are also a part of the urban landscape, offering residents recreational spaces and serving as an integral aspect of city life [4]. However, with the rapid pace of urbanization, rivers also face numerous threats. Urban expansion and changes in land use result in river dredging and filling, which disrupt natural landscapes and the ecological pathways of rivers [5], undermining their ecological functions. Moreover, urban residents’ industrial wastewater, domestic sewage, and agricultural runoff enter the water cycle [6], further leading to severe water pollution. This affects aquatic life and human health and threatens the quality and sustainability of water sources [7,8]. Dams are not only a part of the water system but also a product of urbanization [9]. The higher the level of urbanization, the higher the requirements for water system control [10]. There is also a relatively large number of dams being built [10,11]. In addition, the dam itself does not produce pollutants, but the pollution emitted by the city will accumulate at the dam site [12,13].
Firstly, dams alter the natural flow of rivers, causing a slowdown in water flow, followed by upstream silt deposition and downstream riverbed erosion processes [14,15,16]. The natural transport of sediments is crucial for maintaining ecological balance in riparian areas and the stability of riverbanks [17]. Under conditions of reduced hydrodynamic force, rivers cannot effectively carry away silt and bottom sediments, leading to alterations in the natural state of the riverbed and an increased risk of flooding [18,19]. Secondly, reservoirs formed by dams are prone to accumulating pollutants [20,21]. Domestic wastewater, agricultural fertilizers, and industrial waste may accumulate in these areas, contaminating water resources and posing a threat to aquatic life and human health [22,23]. Additionally, dam construction has long-term impacts on the surrounding ecosystems, groundwater levels, and ecological balance. They can lead to the disappearance of natural wetlands, disruption of wildlife habitats, and changes in groundwater levels [16,24]. Finally, due to the development of cities and population gathering, in order to protect the property of urban residents from flood threats, the demand for urban flood control will likely continue to rise [19]. As a type of dam, floodgates are mainly used to protect the lives and property of residents in the watershed from flood threats [25]. Therefore, they are extensively built-in highly urbanized areas. In the majority of instances, the higher the degree of urbanization in the watershed, the higher the requirements for flood control [26,27]. Floodgates hinder “river connectivity” within the watershed, reduce river flow, result in the accumulation of water pollutants in rivers, as well as cause water quality deterioration during this process [28,29]. Due to their management rules, they often exhibit characteristics of counter-seasonal water level adjustment [27]. Floodgates are usually opened during periods when the water level is high and closed during periods when the water level is low [30]. This characteristic leads to a longer hydraulic retention time in the floodgate-controlled reach [31]. Therefore, when planning and managing floodgate projects, it is necessary to continuously track the water quality status of the floodgate-controlled reach. At the same time, measures can be taken to reduce the risk of water quality deterioration in urban rivers and ensure the sustainability of water resources [32,33,34].
In this research, we propose three hypotheses: 1. At a certain time of the year, when the water quality of the floodgate-controlled reach undergoes drastic changes in a short period of time, the influencing factor of “floodgate control” plays a dominant role. 2. The impact of floodgates on water quality may not be entirely negative. For example, opening the floodgate may improve the water quality of the reach. 3. The floodgate opens and closes at a fixed time every year. So, in a complete regulatory cycle (close/open), there may be regularity in the variation in the pollutant concentration.

2. Materials and Methods
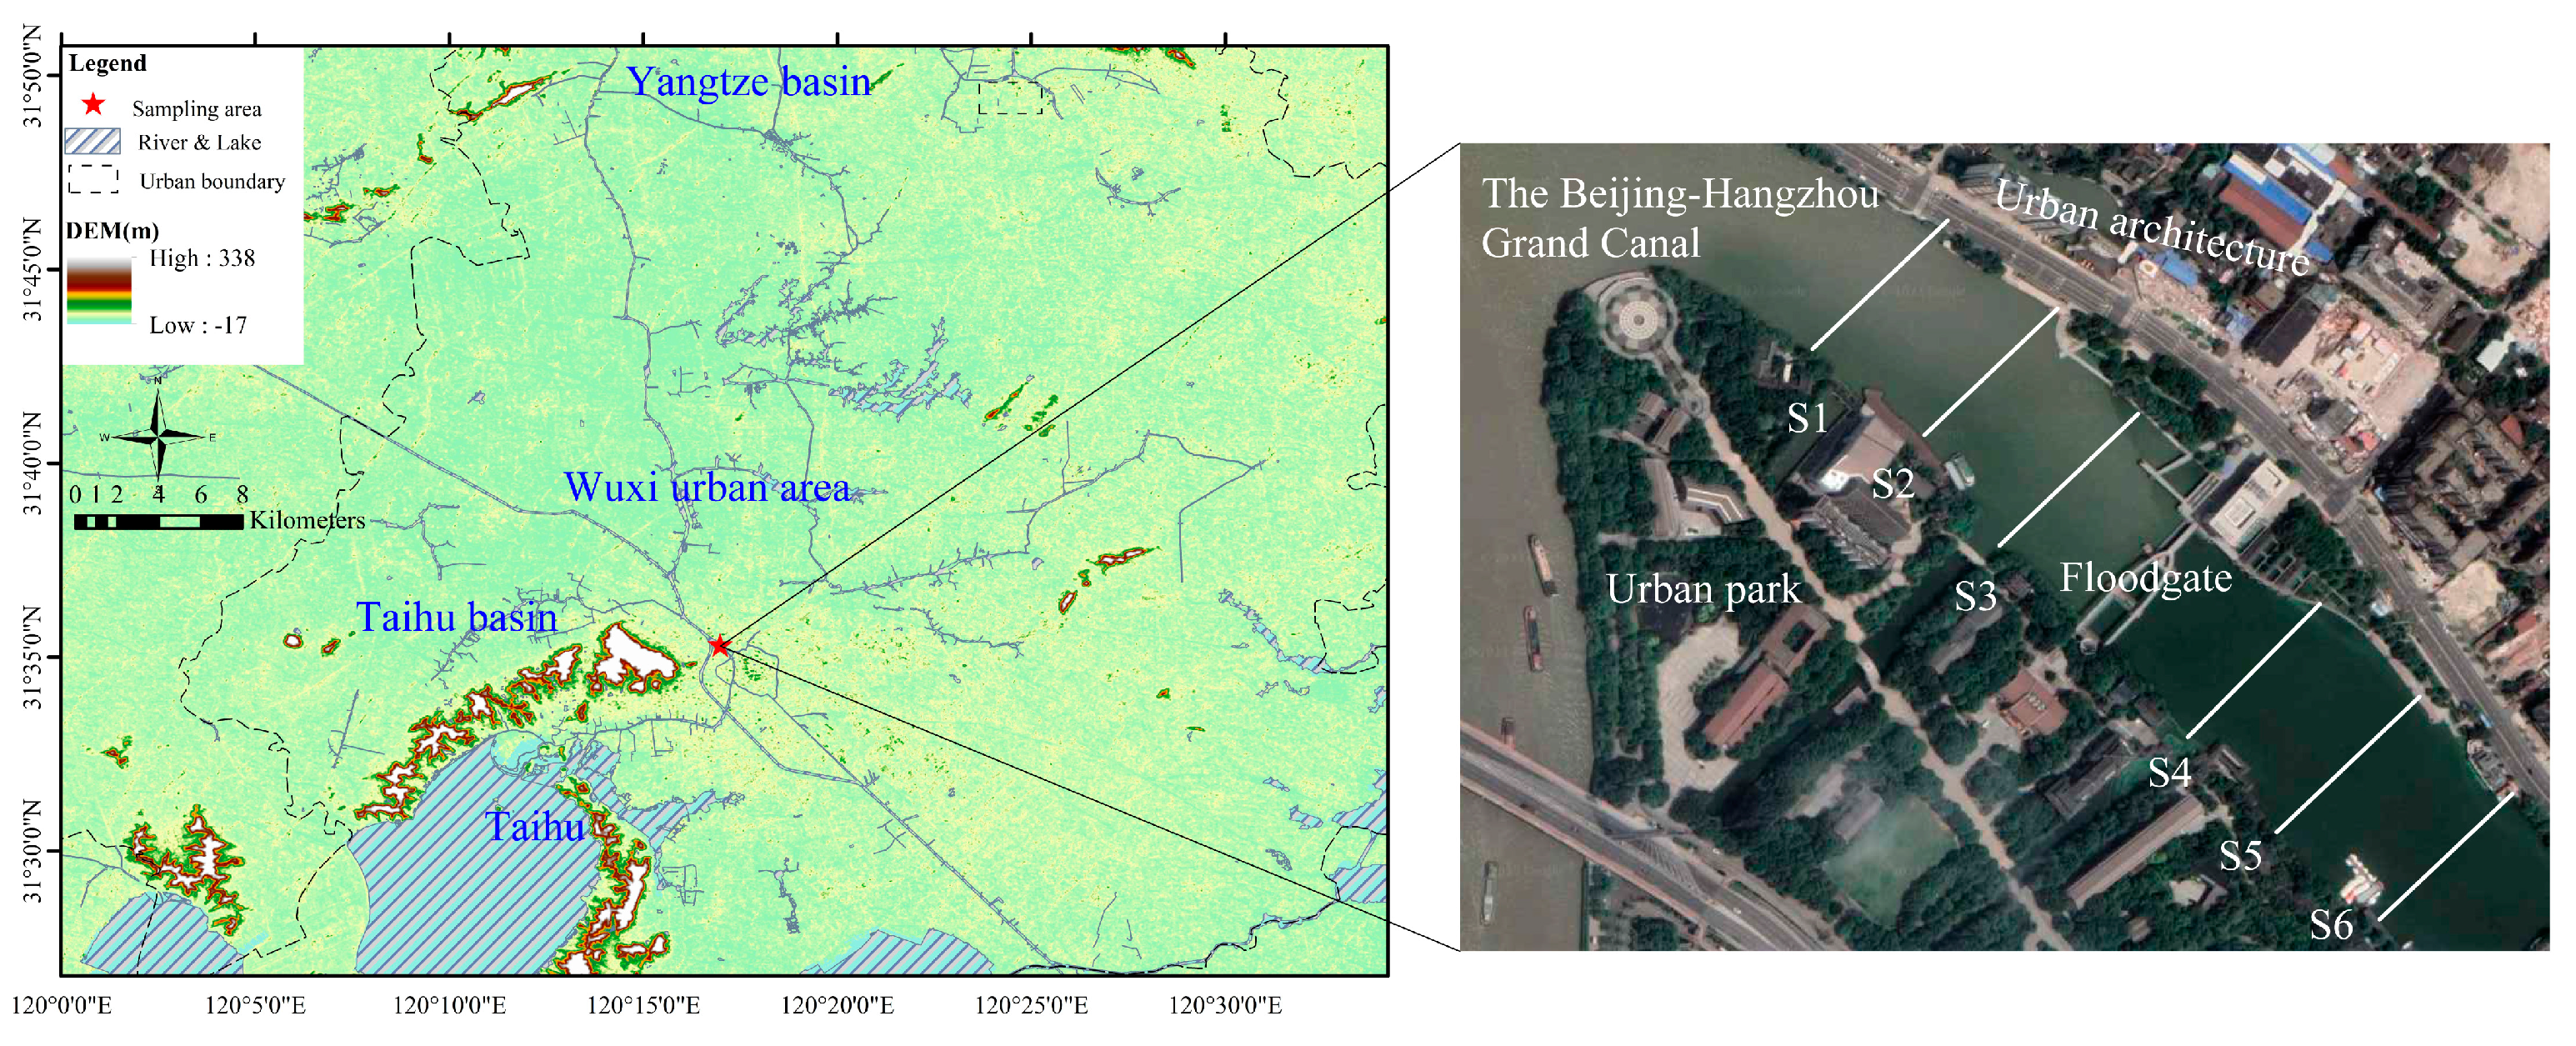
2.1. Study Area

Wuxi is located in the southern part of Jiangsu Province, China, in the Yangtze River Delta Economic Zone. It is an important city in the Yangtze River Basin. One of Wuxi’s most significant geographical features is its proximity to Lake Taihu, Wuxi is also part of the the Taihu Basin, and its relatively low elevation makes it susceptible to flooding (Figure 1). Therefore, the Wuxi municipal government has implemented a series of flood control measures, including embankments, floodgates, and pumping stations, to protect the city from flood damage. According to data from the Wuxi Water Resources Bureau, as of September 2023, Wuxi has constructed 228 floodgates, including 214 small-scale floodgates (https://water.wuxi.gov.cn/: 7 September 2023).
This study selected a floodgate-controlled reach in the “urban flood control system” of Wuxi city (Figure 1). The region belongs to the plain area of the Yangtze River Delta; here, the presence of various water bodies affects the terrain fluctuation, making the city generally maintain a flat terrain [35]. Plain landforms provide favorable land use conditions for urban development [35]. The climate in this area is distinguished by four seasons (spring, summer, autumn, and winter), and there is a periodic pattern in the hydrological season (high flow period, normal flow period, and low flow period) (https://water.wuxi.gov.cn/). Summer is relatively humid and hot, winter is relatively cold, and precipitation is relatively abundant; it belongs to a subtropical monsoon climate [36]. The water system surrounding this reach of the river crisscrosses vertically and horizontally. The upstream flow mainly derives from the Beijing–Hangzhou Grand Canal, and the downstream flow eventually enters the Taihu Lake (Figure 1). The urban area near the reach is densely populated, and transportation here is well-developed [37]. With the increase in urbanization, Wuxi city continuously invests in environmental protection work, promoting green city construction and sustainable development [38].

2.2. Sample Collection and Laboratory Analysis

2.2.1. Parameter Selection

This study selected six water quality sampling points (S1–S6) at intervals of 100 m within a 500 m range along the river over three years (2016–2018) (Figure 1). This study selected three critical flow periods defined by the local conservancy bureau: the high flow period (June–September) (https://water.wuxi.gov.cn/), the normal flow period (February–May), and the low flow period (October–January). Four main pollutants, namely total nitrogen (TN), total phosphorus (TP), chemical oxygen demand (CODMn), and ammonia nitrogen (NH3-N), were selected [39]. According to the environmental governance targets proposed by the Wuxi Municipal Government, the concentrations of these pollutants should comply with the class III water quality standard of the national surface water environmental quality standard (Table S1 in the Supplementary Materials) [40].

2.2.2. Water Sampling Time

This study was conducted from January to December 2016–2018, with sampling taking place in the middle of each month, including wet and dry seasons. A suitable temperature was required to reduce the interference from external factors, such as rainstorms, on water quality. Water samples were taken 0.5–1.0 m below the water surface and far away from the river shore to reduce the impact of edge effects due to shallow rivers. When collecting the samples, all the floodgates were closed.

2.2.3. Water Sample Processing

First, river water was taken to clean and moisten the water extractor before sampling. Then, a polyethylene storage bottle was washed more than 3 times using the water in the water extractor, and the water sample was immediately taken in full and placed into the cryogenic storage box for preservation. All the water samples were stored at 4 °C in a laboratory refrigerator, and water quality data analysis was completed within 24 h. In order to minimize potential errors and depict real water body conditions accurately, we obtained six water samples at each location, conducting three tests for each water sample.

2.2.4. The Detection of Water Quality Indicators

Following the national standards of HJ636-2012 and HJ671-2013 [41,42], we used the “Alkaline potassium persulfate ablation UV spectrophotometric method” to detect the TN concentration [41], and we used the “Ammonium molybdate spectrophotometric method” to detect the TP concentration [42]. Also, to follow the national standards of GB11892-89 and HJ/T195-2005 [43,44], we used the “Permanganate index method” [43] to detect the CODMn concentration, and we used “Gas-phase molecular absorption spectrometry” to detect the NH3-N concentration [44].

2.3. Statistical Methods

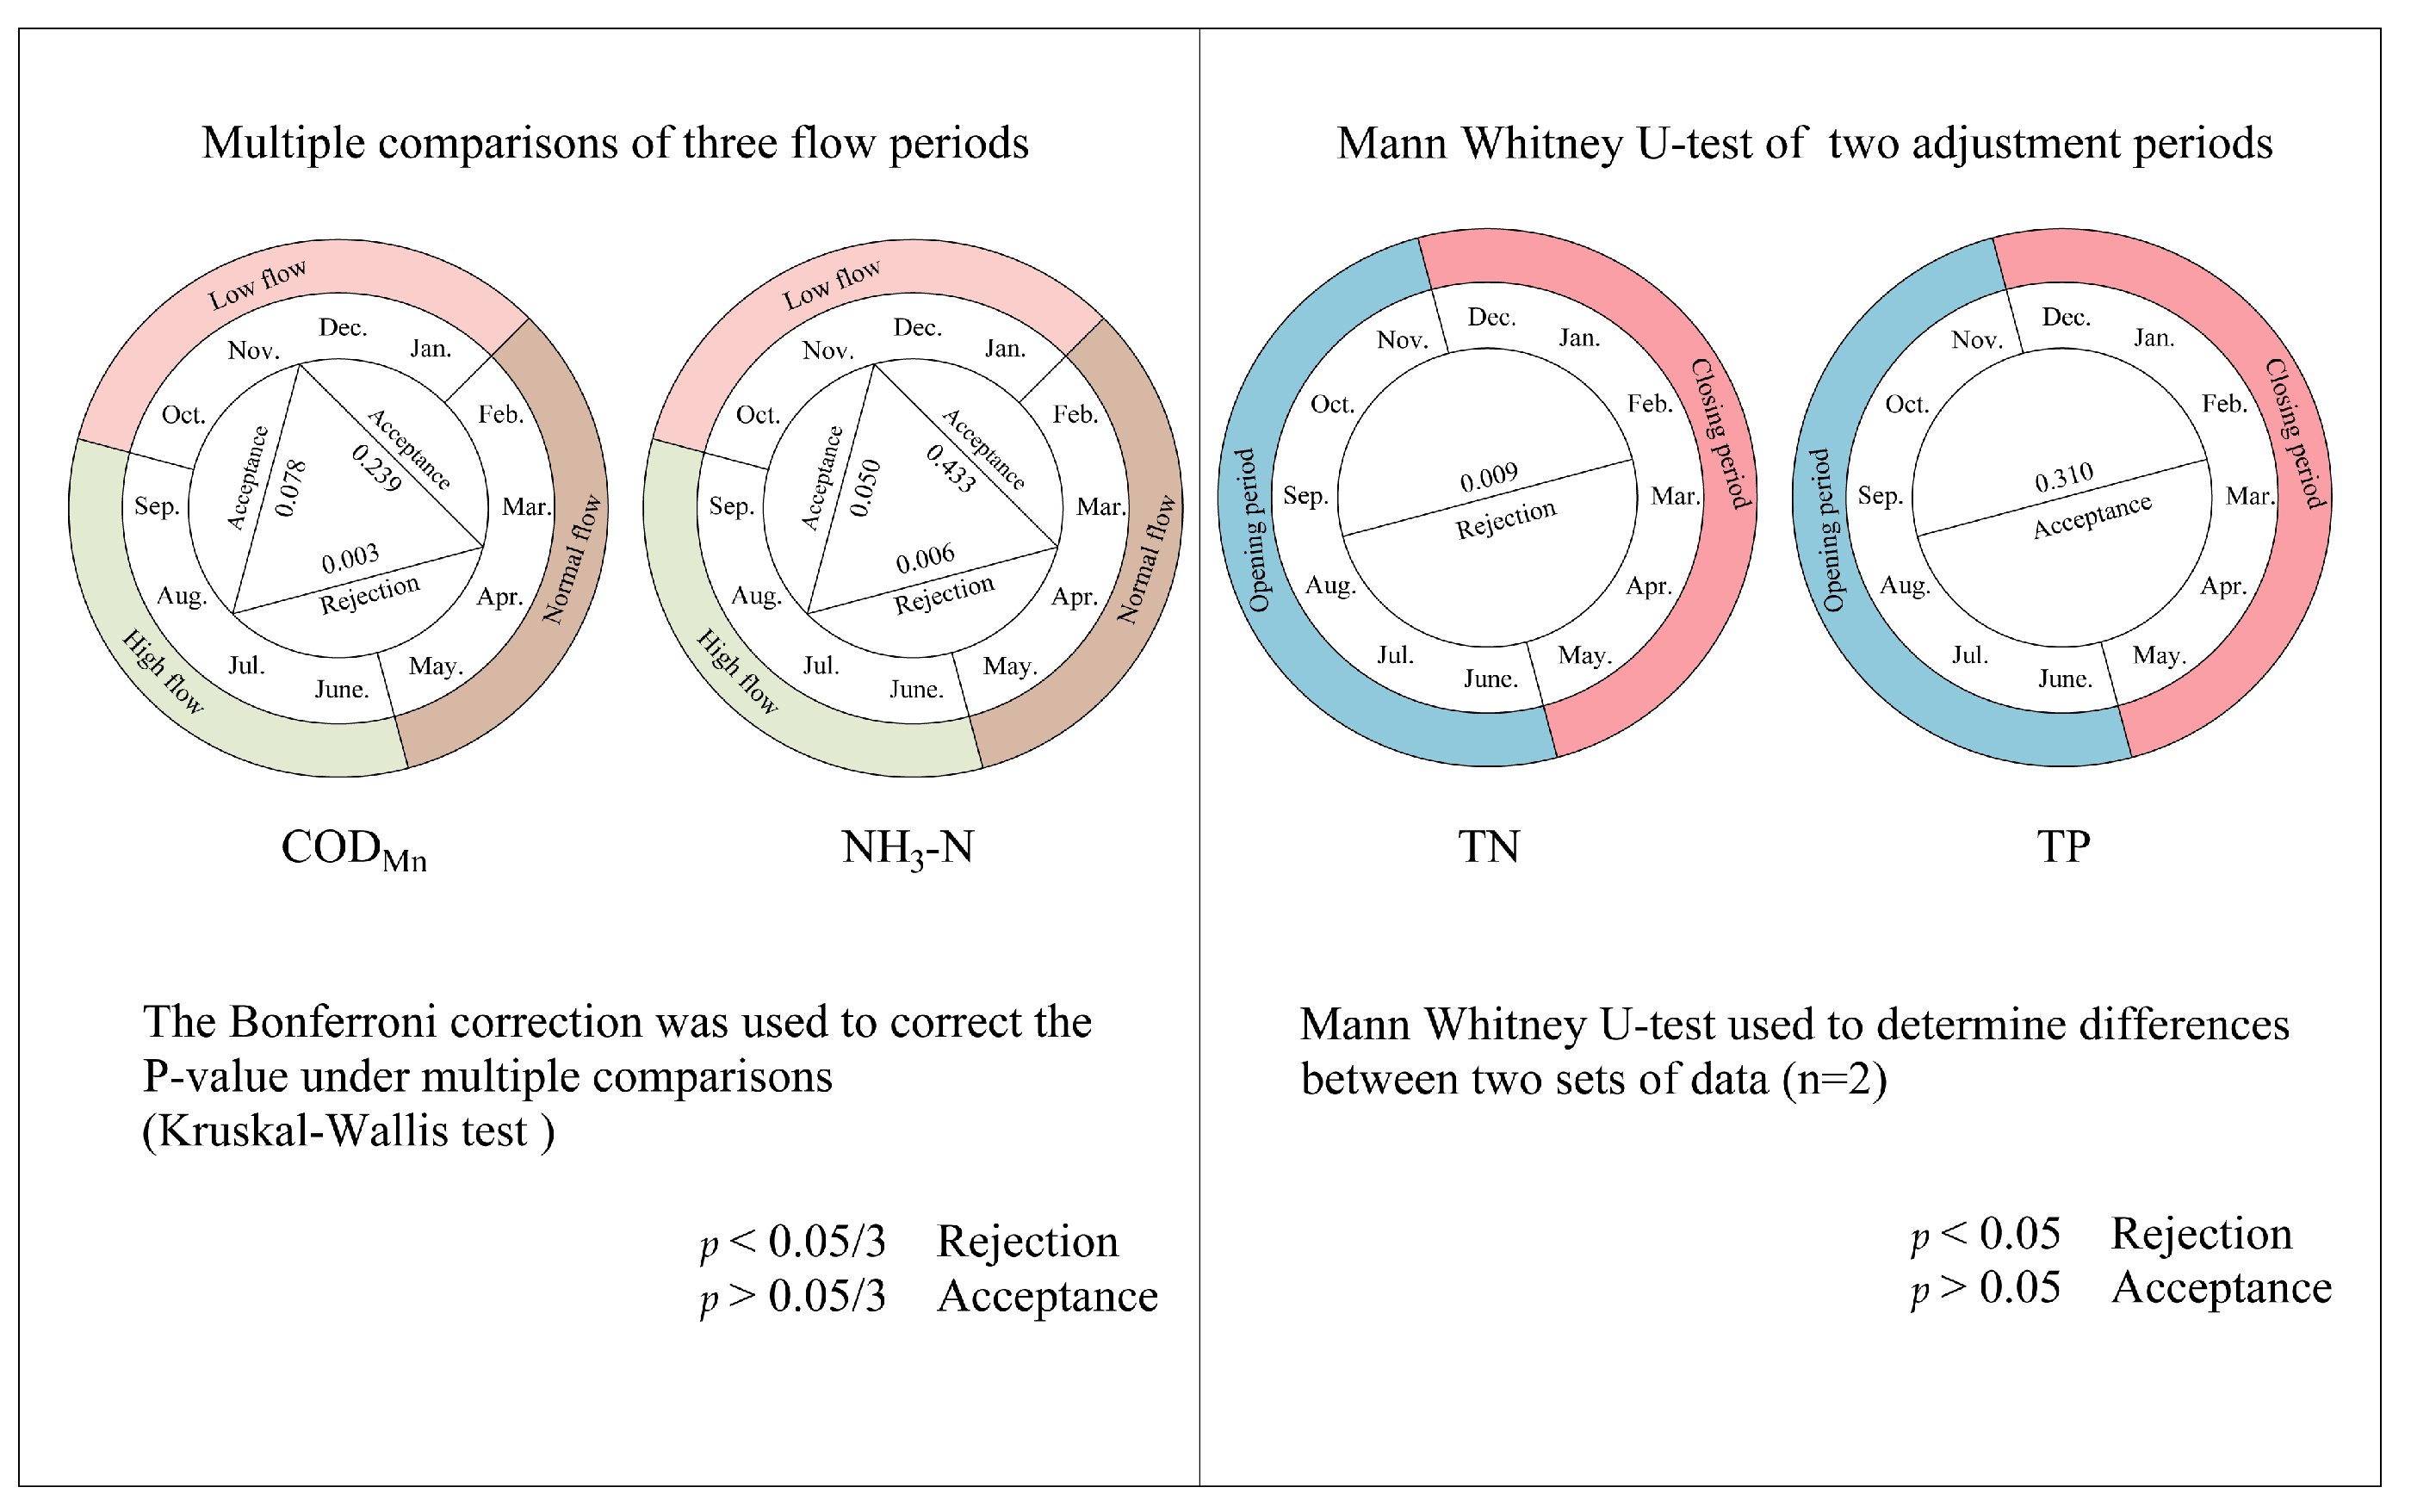
2.3.1. Difference Analysis

The Kruskal–Wallis test (for more than two groups) and the Mann–Whitney U test (for two groups) are based on the fundamental idea of combining data from different groups into a single dataset, ranking the combined data, and assessing the significant differences in the sum of the ranks [45]. They are non-parametric testing methods; non-parametric test methods do not rely on assumptions about the data’s distribution or parameters such as variance. Instead, they are based on the ranks or order of data for statistical inference [46]. These methods are typically more robust and suitable for various types of data, especially small samples or non-normally distributed data [47]. The significance level is usually set at 0.05, which is a widely accepted standard in statistics [48]. These two methods can detect differences in data groups. In this study, we conducted significance tests on three flow periods and two adjustment periods of the reach. To determine whether the adjustment of the floodgate is the dominant factor driving changes in water quality within reach.

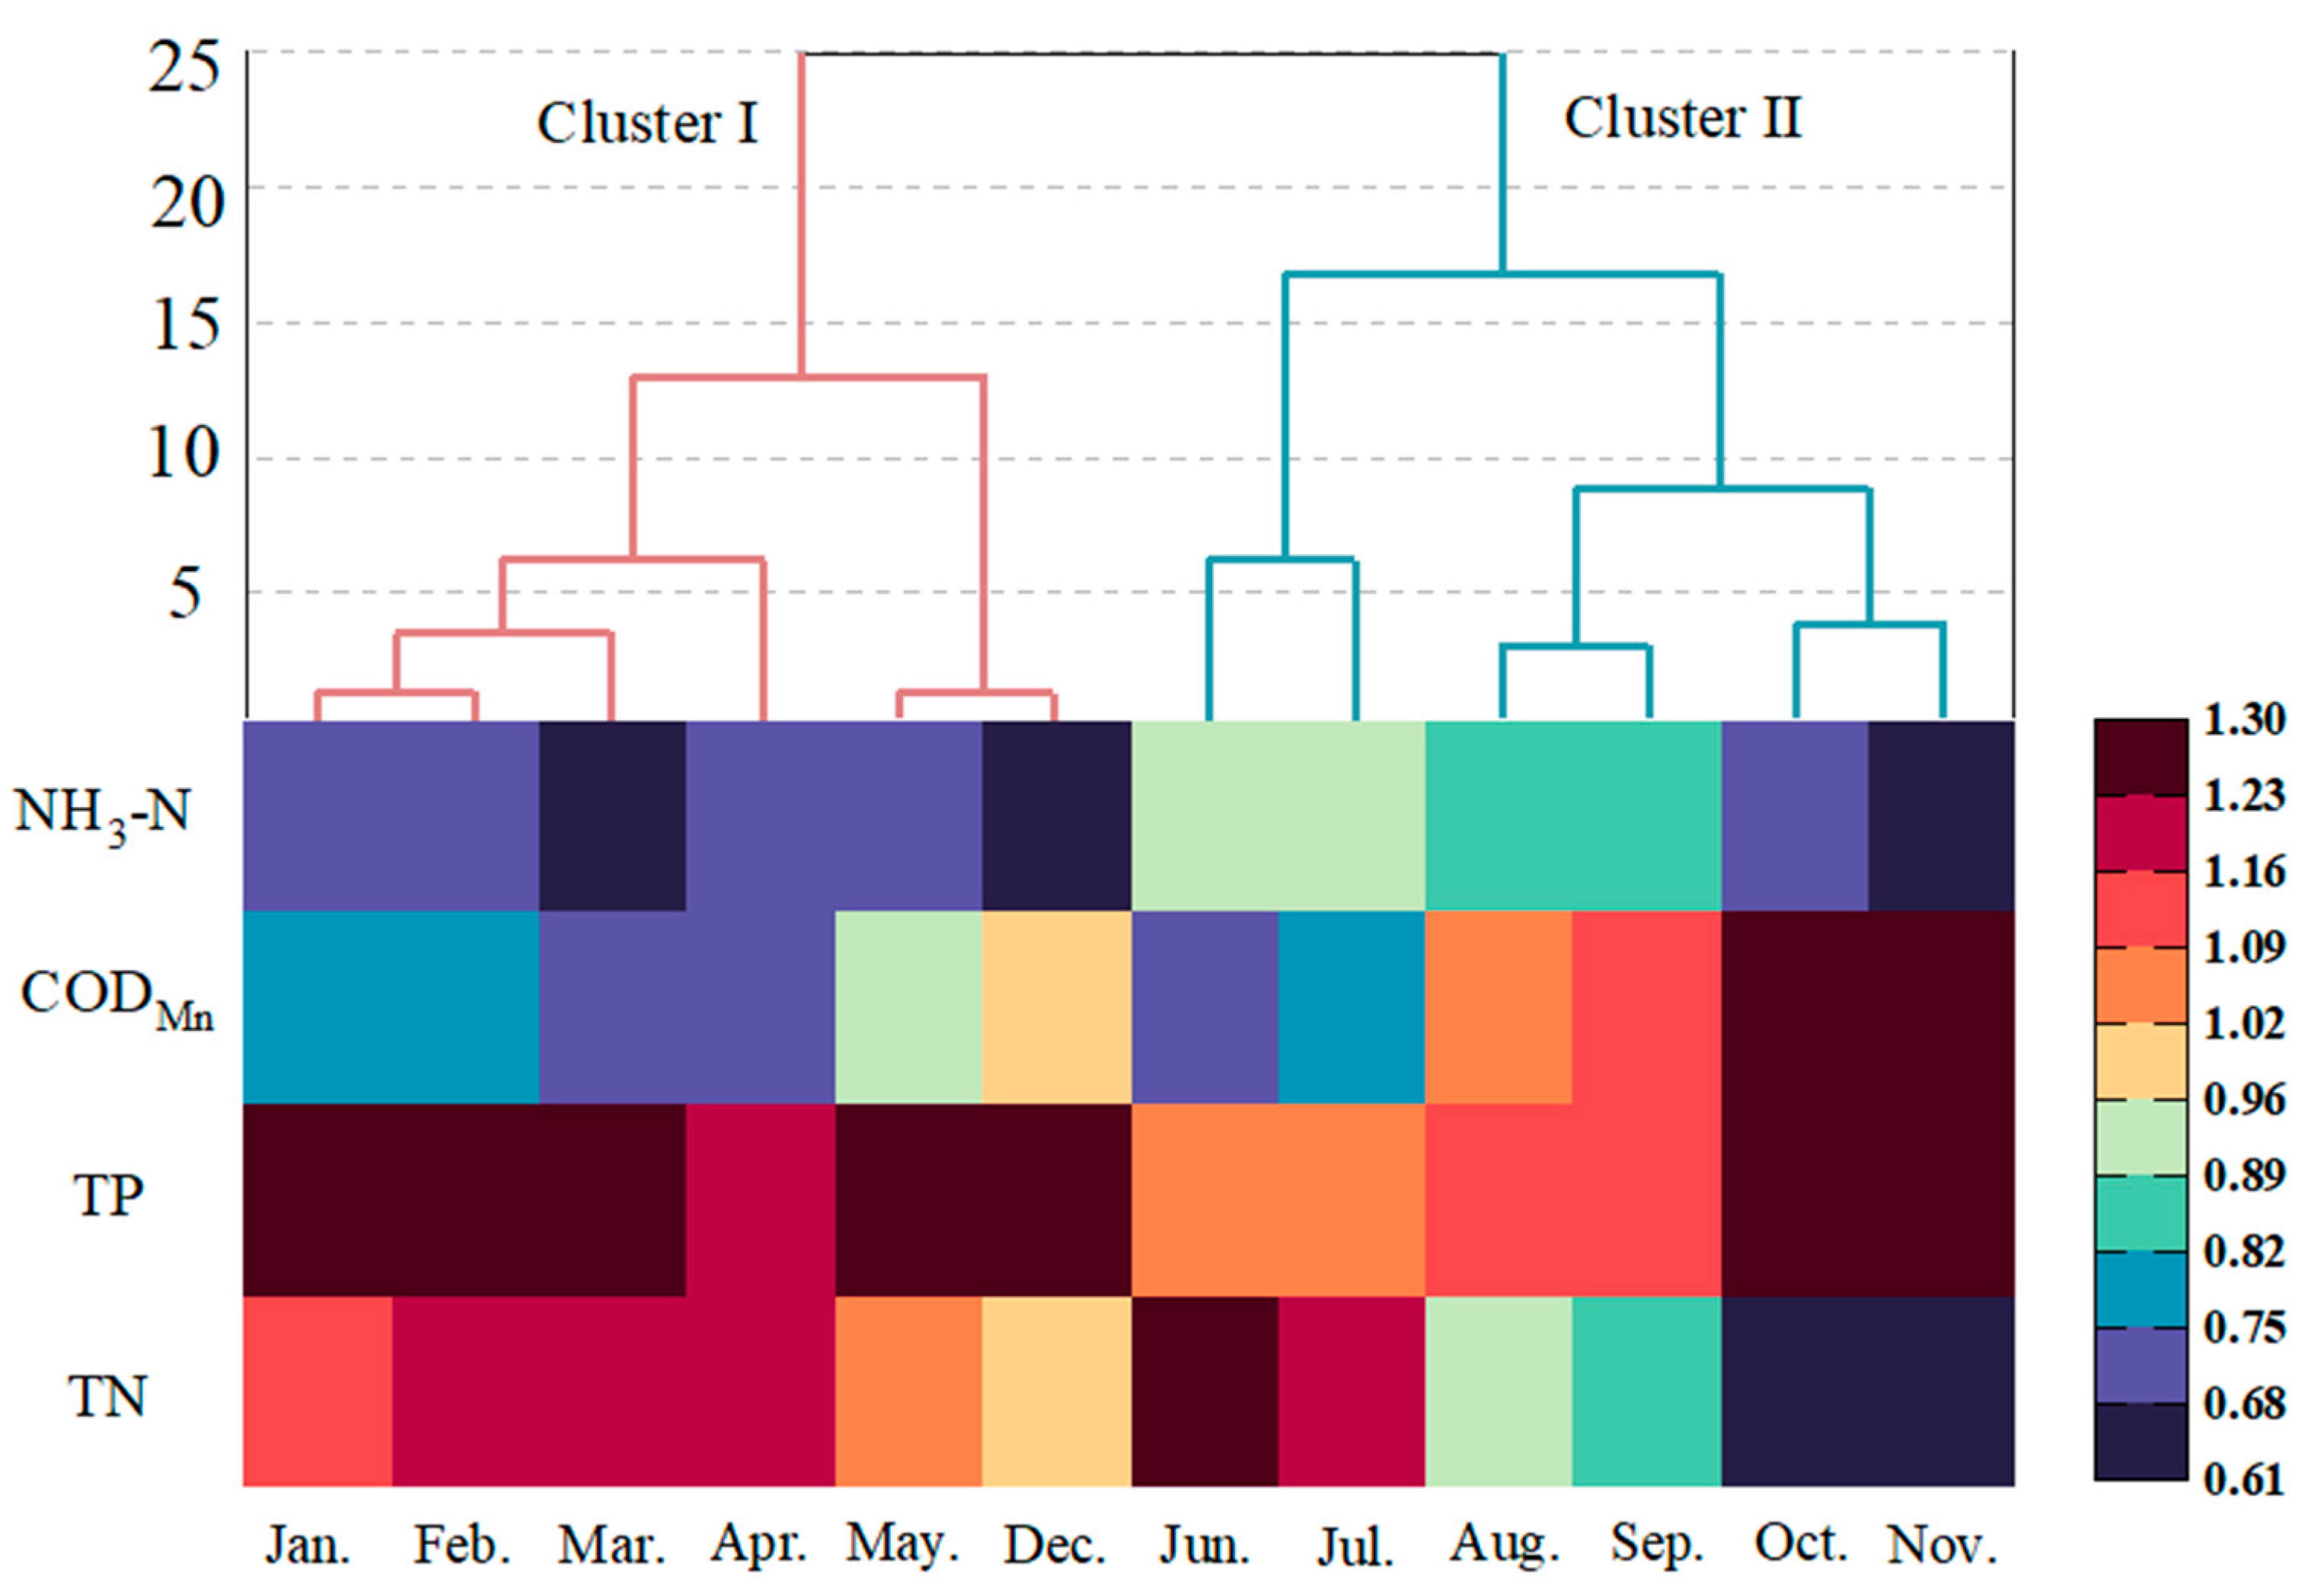
2.3.2. Cluster Analysis (CA)

Cluster analysis is typically employed to discover latent structures in data, aiding in understanding how the data are organized and the relationships between objects [49]. In hierarchical clustering, one common strategy used is the within-group linkage method, which calculates the distance or similarity when two clusters are merged during the clustering process. This is often referred to as “single linkage” or “minimum linkage” [50,51]. This method can simultaneously identify multiple long sequence data. We used this method to cluster months of data with internal similarity.

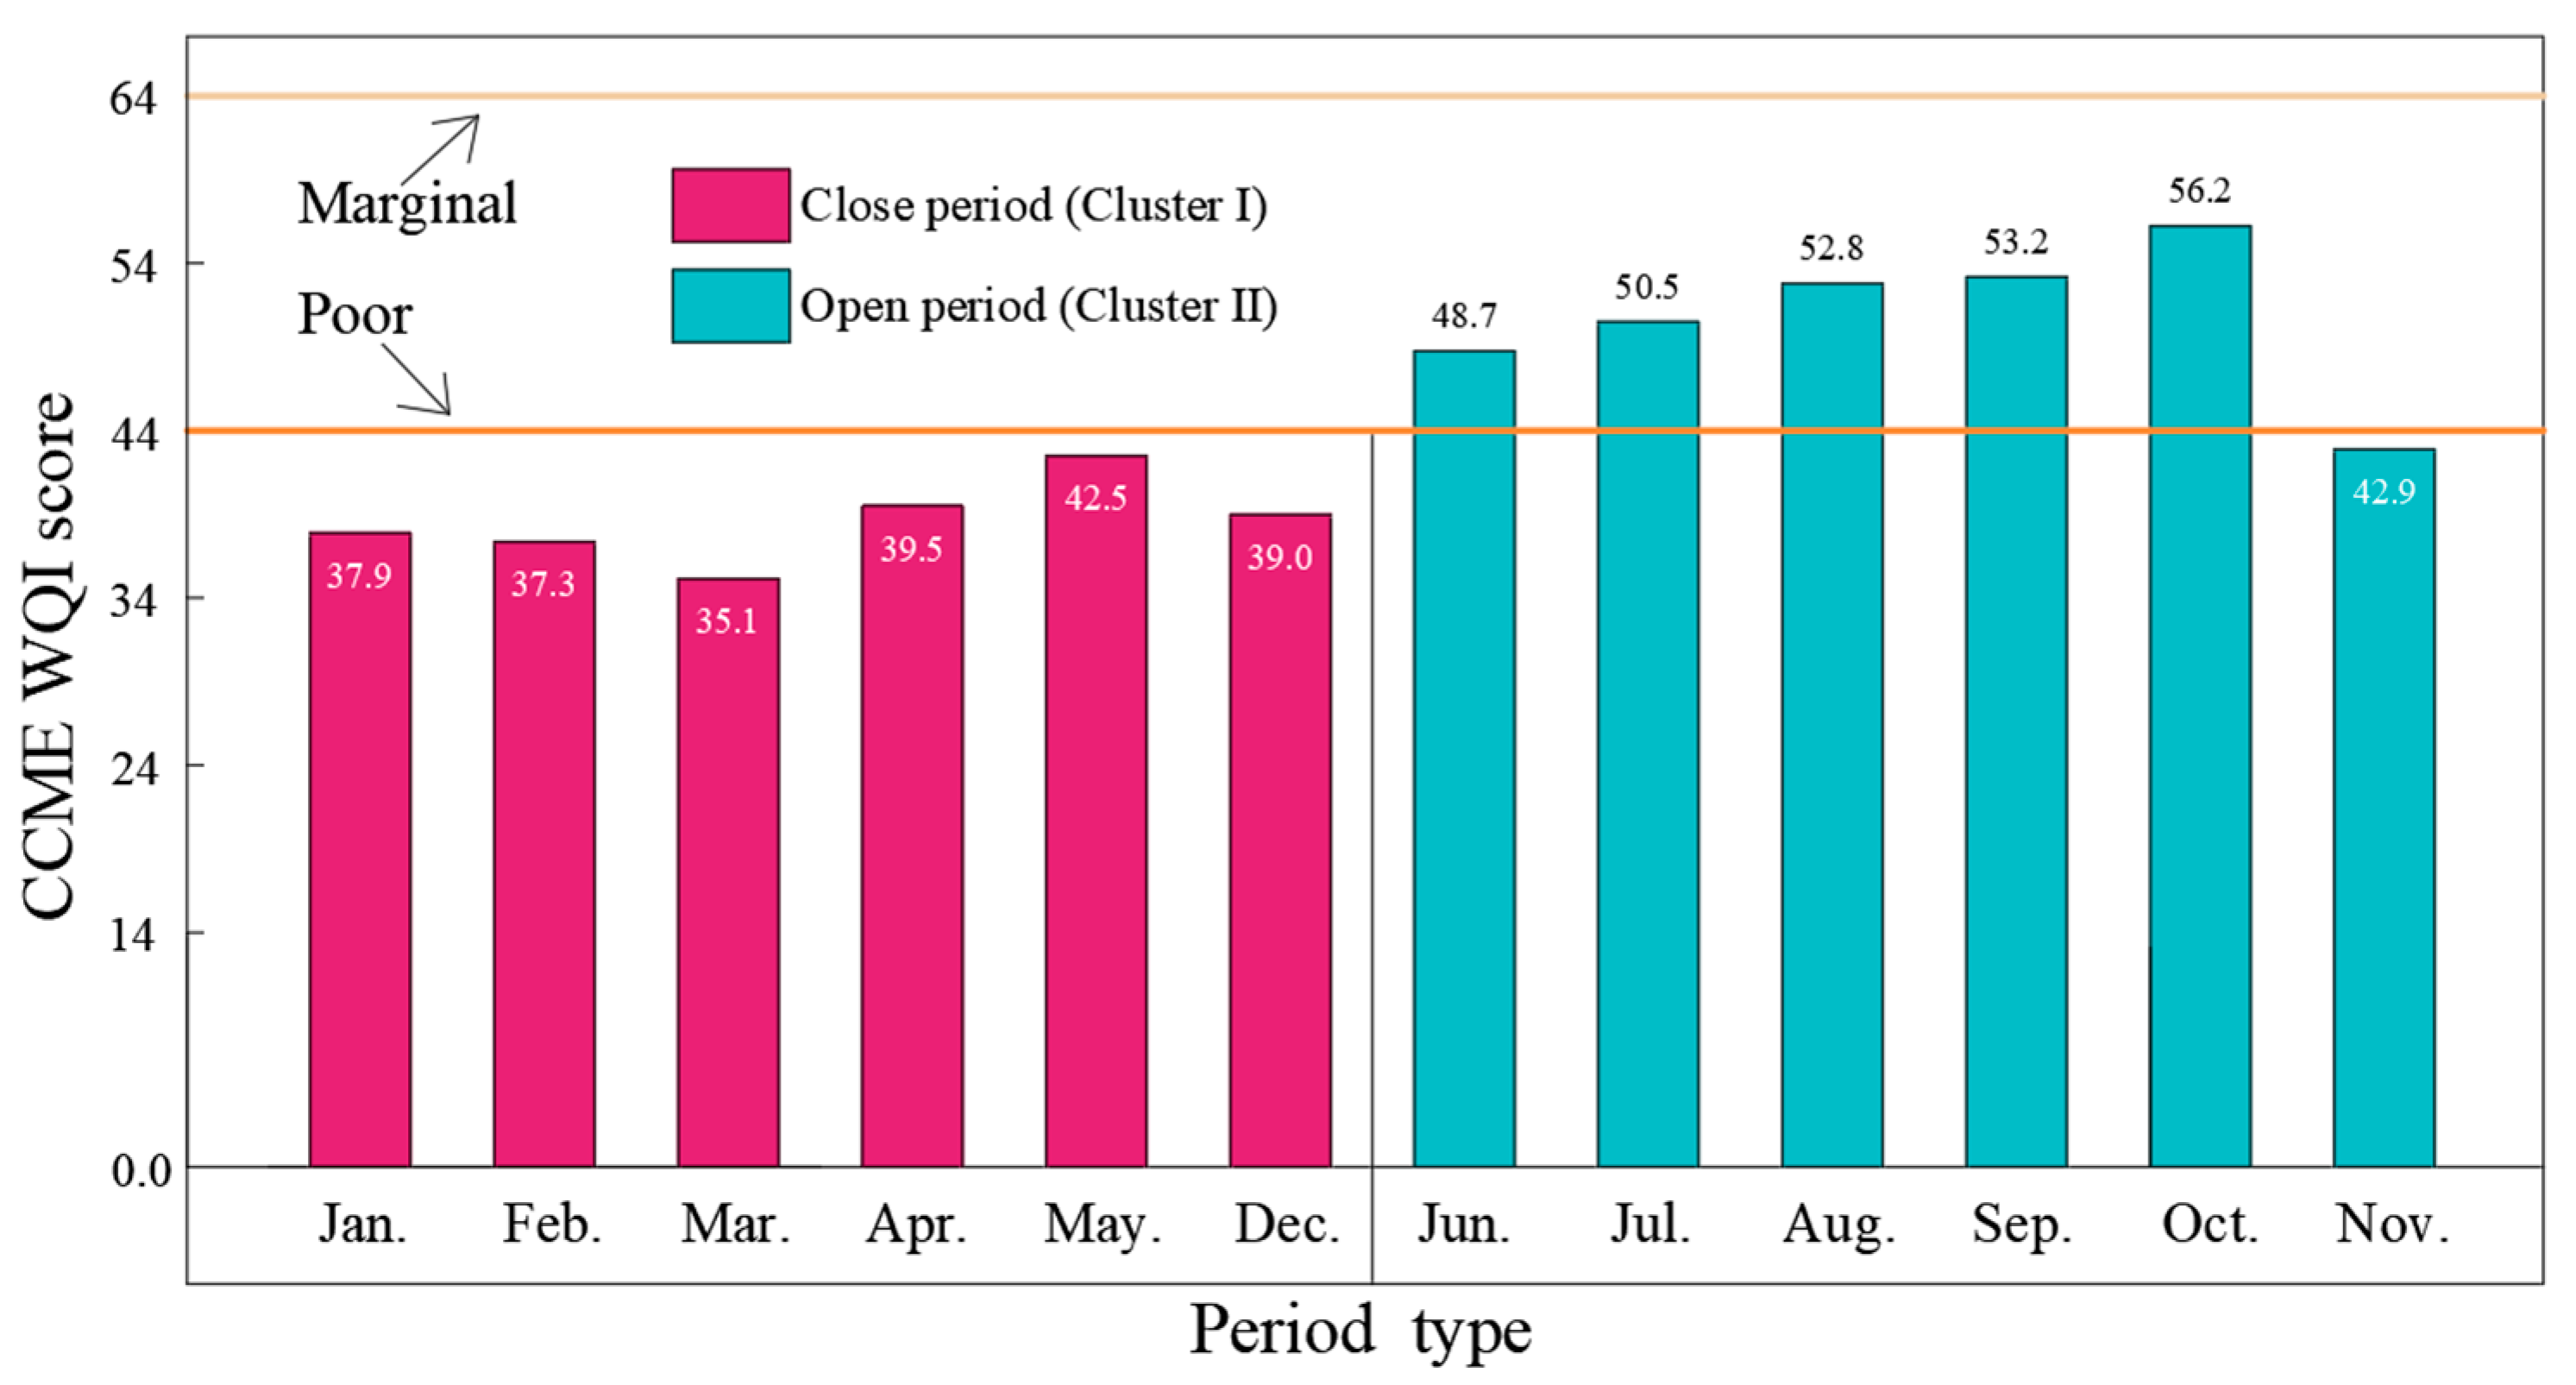
2.3.3. Water Quality Index

The Canadian Council of Ministers of the Environment Water Quality Index (CCME WQI) assesses and reports surface water quality [52]. It provides a numerical value or rating that summarizes the overall water quality at a specific location, making it easier for the public and decision-makers to understand water quality data (Table S2, Formulas (S1) and (S2) in the Supplementary Materials) [53]. The index’s thorough evaluation of water quality parameters is incredibly valuable for decision-makers in China [54]. This water quality index helps us present the water quality status in a quantitative way. We used this method to evaluate the state of pollution in reach at different times. At the same time, quantify the degree of floodgates on river water quality and determine the proportion of pollutants exceeding the standard.

2.3.4. Mann–Kendall Trend

Mann–Kendall trend analysis is a commonly used non-parametric statistical method used to detect the presence of trends or the direction of trends (increasing or decreasing) in time series data (Table S3, Formulas (S3) and (S4) in the Supplementary Materials) [55]. It does not require time series data to conform to the assumptions of normal distribution or other parametric distributions, making it effective for various types of data, especially when data do not meet the assumptions of a normal distribution [56,57]. This method can reflect the possible changes in the water quality of the reach in the future. We used this method to test the trend of changes in the concentrations of four pollutants throughout the entire monitoring cycle.

2.3.5. Time Series Analysis

Time series analysis is a statistical method used to study time series data. It aims to identify patterns, trends, seasonality, and cyclic features within the data to enable forecasting, interpretation, and decision support [58]. The exponential smoothing method used in this study smooths data by applying weighted averages to time series data, giving more weight to the observations [59]. It suits data with strong seasonality or trends [60]. We used exponential smoothing methods to determine the periodic variation intervals of pollutant concentrations and describe their changing characteristics.

3. Results and Discussion

3.1. Risk Periods Identification

In the initial stages of the analysis, it is crucial to address a fundamental question: Will the water management process of the floodgate significantly drive changes in reach water quality? Transitions between flow periods generally lead to significant changes in river water quality. Therefore, this section uses a difference test to determine whether the dominant factor in the changes in water quality in the floodgate-controlled reach is the change in the flow period or the adjustment of the floodgate. The analysis results are outlined below.
In the difference analysis results, significant differences in water quality were observed for CODMn and NH3-N across the three flow periods (p < 0.05), while no significant differences were detected for TN and TP (p > 0.05) (Table 1). This indicates that changes did not influence TN and TP in the three flow periods. Among the indicators that showed differences, CODMn and NH3-N refined multiple comparisons and revealed decisions of “acceptance” in the comparison between the high flow period and the low flow period and between the low flow period and the normal flow period (p > 0.05/3). In contrast, a decision of “rejection” was observed in the comparison between the normal flow period and the high flow period (p < 0.05/3) (Figure 2). This suggests that the differences in CODMn and NH3-N during the transition from the normal flow to the high flow period were the primary cause of the overall significant differences. The transition from a normal flow period to a high flow period occurred in June. Before this, the floodgate was closed for an extended period, and due to the increase in flood risk in the river, the floodgate began frequent water level regulation activities afterward [27]. Therefore, the CODMn and NH3-N concentrations of the reach undergo significant changes after the floodgates are opened [9]. Mann–Whitney U tests were conducted for TN and TP before and after June, revealing significant differences for TN as well (p < 0.05) (Figure 2). There were also significant differences in CODMn, NH3-N, and TN at this time point. Therefore, this section suggests that the main reason for the significant differences in water quality in the floodgate-controlled reach was the adjustment of the floodgate rather than the changes in the flow periods.
There were no significant differences in the TP concentration during the flow change period or at the adjustment time point of the floodgate (accept assumptions) (Figure 2). This might be attributed to the low hydraulic conditions in the floodgate-controlled reach, which facilitate the settling of larger particulate matter. TP primarily consists of particulate phosphorus; particulate phosphorus is a large particle substance that easily undergoes sedimentation, and a significant portion of externally introduced particle phosphorus deposits to the bottom of the water body after entering the reach [61,62]. Therefore, the sedimentation of particle phosphorus in the floodgate-controlled reach may explain why there was no difference in the TP concentration during these specific periods.
This section utilized cluster analysis to identify the internal structure of the dataset, divide the samples into different clusters, and discover hidden patterns and associations in the data. The analysis results are as follows (Figure 3):
In the cluster analysis, the system classified the 12 months into two clusters, with December to May forming Cluster I and June to November forming Cluster II (Figure 3). This indicates that the data within Cluster I (December to May) and Cluster II (June to November) in this floodgate-controlled reach have internal correlations. This could be attributed to significant differences in river conditions during these two periods. Cluster I, comprising December to May, represents a cluster of months when the floodgates were closed, during which substances both upstream and downstream of the floodgates cannot flow naturally. The floodgates hinder the natural chemical cycling of the river [11]. Cluster II, consisting of the months from June to November, represents a cluster of months when the floodgates are open. During this period, water was frequently exchanged between the area upstream and downstream of the floodgates, inducing the dispersion and redistribution of retained pollutants [63]. In other words, the former is closer to the “lake” state, while the latter is closer to the “river” state [64].
In the heat map results, the period represented by Cluster I has a wide span of concentration changes for each pollutant. In contrast, the period represented by Cluster II has a narrow span of concentration changes for each pollutant (Figure 3). The reason for this may be that the hydrodynamic forces during the period represented by Cluster I were much smaller than those represented by Cluster II, where higher hydrodynamic forces have a better water self-cleaning ability and weaker hydrodynamic forces will lead to a continuous accumulation of pollution [65]. The impact of river hydrodynamic forces on river water quality is relatively direct [66,67]. Therefore, the impact of the floodgate on river water dynamics is an important reason for the occurrence of two water quality clusters in the floodgate-controlled reach.

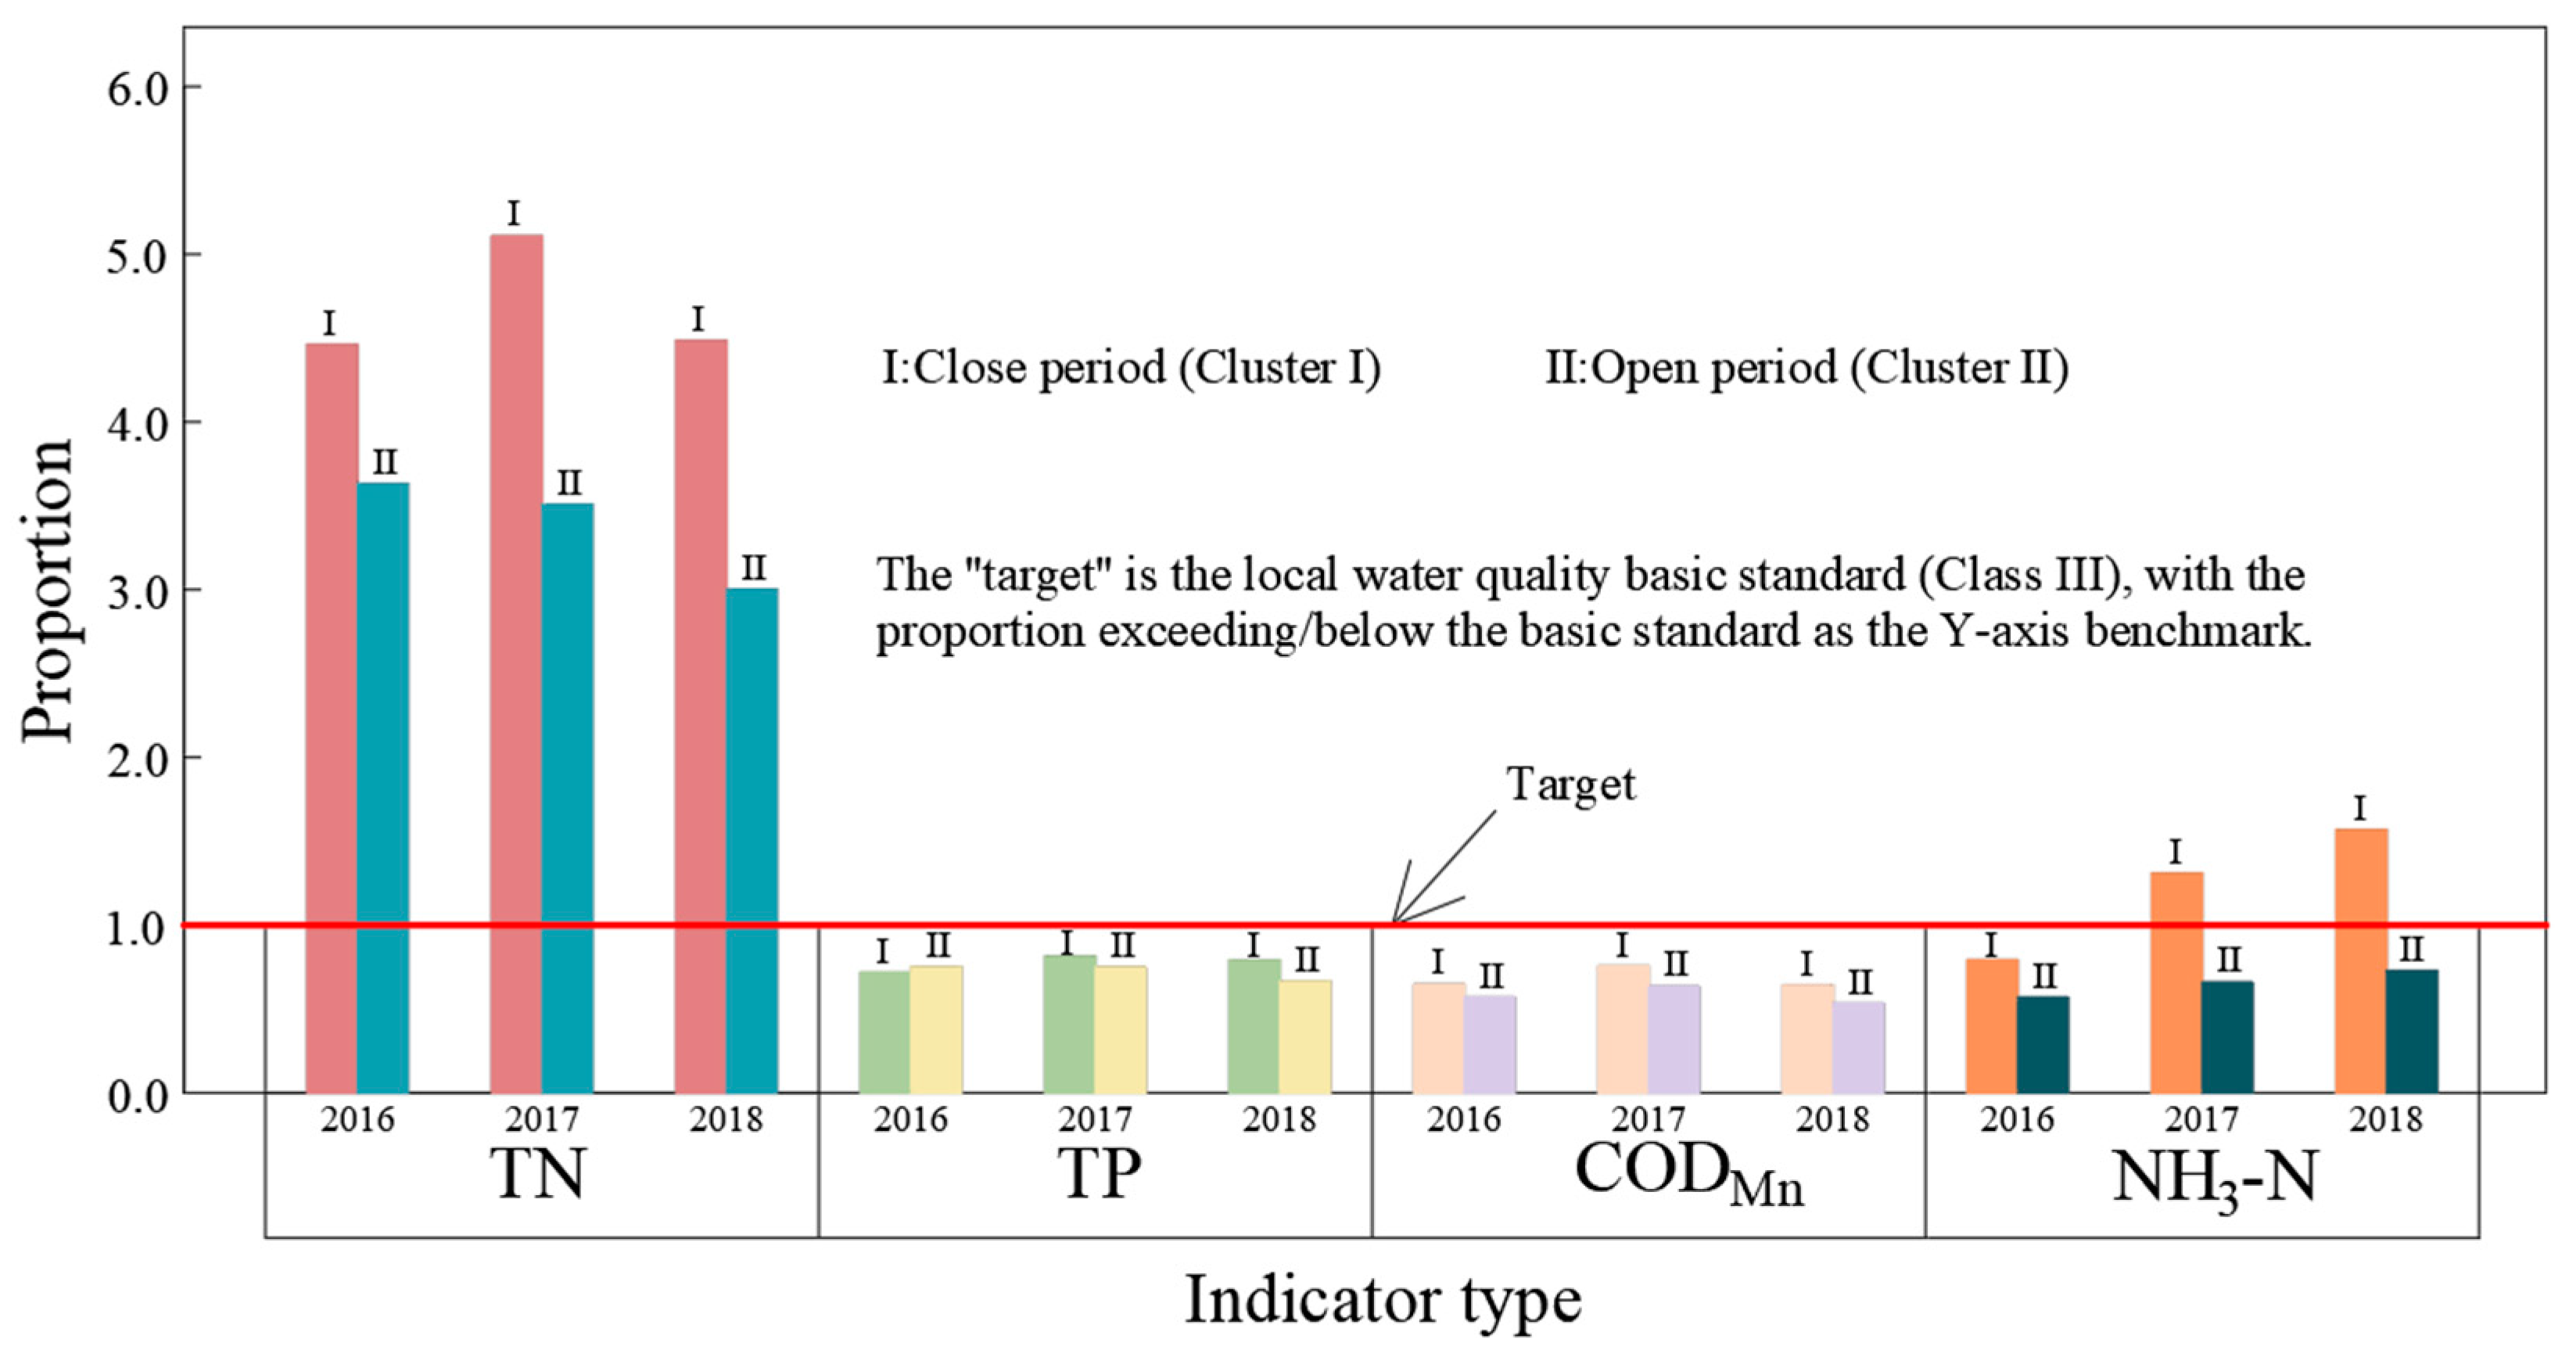
3.2. Level and Degree of Contamination

In this section, the CCME WQI model was used to assess the level of river pollution by utilizing monthly average water quality data and 12 key variables (from January to December) obtained from two data clusters. For the convenience of comparing different periods, we quantified these 12 months as independent water quality scores. The analysis yielded the following results (Figure 4):
Firstly, in the water quality evaluation results of all months, more than half of the river periods were in a “Poor” state, and the best river periods were only slightly stronger in a “Marginal” state (Figure 4), indicating that the overall water quality of the floodgate-controlled reach was not ideal. This may be due to the obstruction of river connectivity by the floodgate [29]. The pollutant input from the outside accumulates in the floodgate-controlled reach, and the river’s water quality deteriorates during this process [12]. Therefore, the existence of floodgates has a significant impact on river water quality [20].
In addition, the worst November score (42.9) in Cluster II was higher than the best May score (42.5) in Cluster I (Figure 4), indicating that the overall water quality score of Cluster II was better than Cluster I. This may be because there are differences in the mechanism of pollutant concentration changes between these two periods. Cluster I was in the closed state of the floodgate, during which pollutants accumulated in the reach; the concentration of pollutants increased at this stage. Meanwhile, Cluster II was in the open state of the floodgate. During this state, polluted water masses were released in the reach, and the concentration of pollutants decreased [68,69].
Finally, the alternating periods of May–June and November–December are two important time points: 1. The floodgate opens after a long closure period. 2. The floodgate closes after a long period of opening. The former quickly reaches the “Marginal” state after a month from the “Poor” state, while the latter slowly decreases from 42.9 points to 39.0 points (both in the “Poor” state) after a month (Figure 4). For score changes at the same time interval, the former was much greater than the latter, which may be because after the floodgate was closed, the accumulation of pollutants took a certain amount of time. The water quality is slowly deteriorating, so the score changes gradually [70]. After opening the floodgate, the accumulated pollution will be quickly washed and diluted by the water flow, and the concentration will also decrease soon, so the score changes quickly [71].
Considering the possibility of differences in the levels of different pollutants exceeding the standard in this reach, it is necessary to refine the differences to explore the key points of pollution control in the floodgate-controlled reach. Therefore, this section explores the excess proportions of four pollutants through the F2 variable in the CCME-WQI model. The analysis results are outlined in Figure 5.
From Figure 5, it can be seen that TP and CODMn reached the target water quality in all periods, NH3-N did not reach the target water quality in some periods, and TN did not reach the target water quality in any periods. The TP and CODMn were relatively light at the floodgate-controlled reach, while the nitrogen compounds were more severe. The reason for this may be that nitrogen compounds derive from various sources, including industrial, transportation, wastewater treatment, and combustion activities [72]. Wuxi has a high urbanization rate, and there may be many points and non-point sources of nitrogen compound emissions [37,73,74]. So, the pollution released within the city, combined with the substantial accumulation in the floodgate-controlled area, significantly disturbs the nitrogen cycle in this region [75]. Meanwhile, in the comparison between Cluster I and Cluster II, the concentrations of TP and CODMn exhibited a relatively small disparity, whereas the TN and NH3-N concentrations displayed a significant contrast (Figure 5); this is perhaps due to the fact that the closed period experiences a greater deposition of pollutants compared to the open period. CODMn and TP are more susceptible to sedimentation effects in a reach than TN and NH3-N [76].

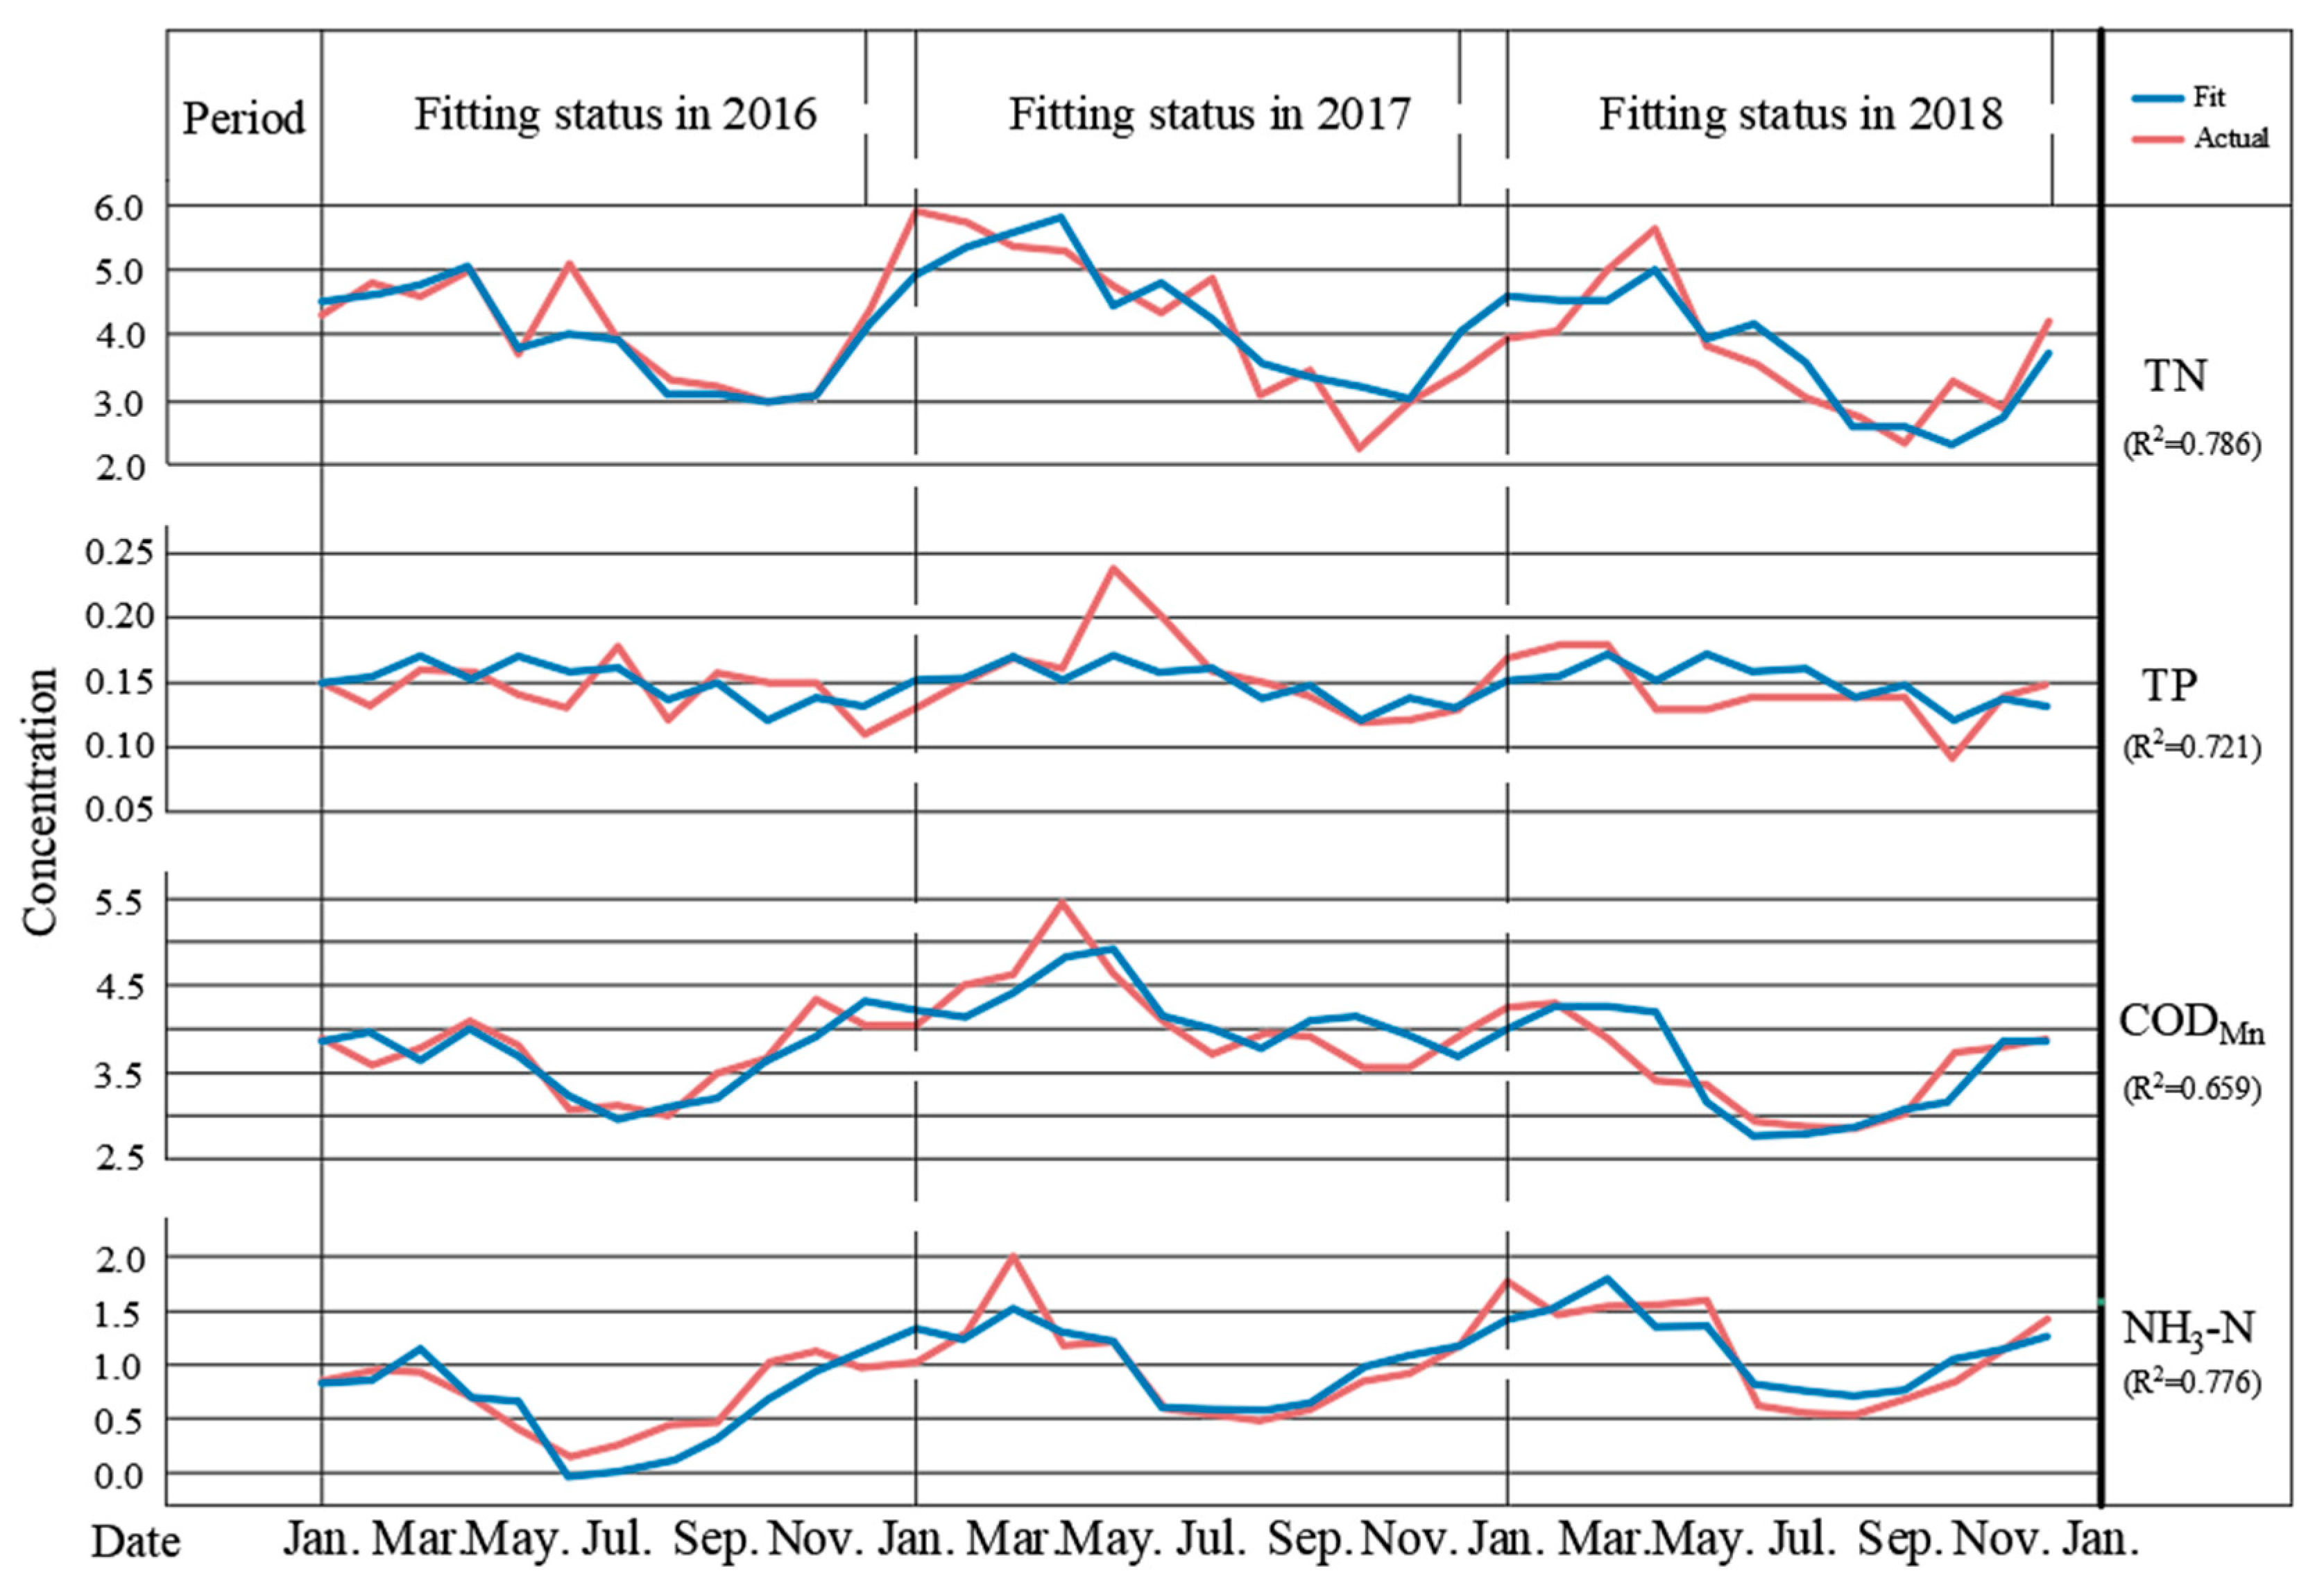
3.3. Fluctuation and Trend of Pollutants

In this section, the Mann–Kendall trend test was performed on the concentration data of the four pollutants to investigate the characteristics of the fluctuation in these concentrations and identify potential trends in pollutant concentration changes. The analysis results are as follows (Figure 6):
In the trend test results, TP shows an overall trend type of “0” (no change). At the same time, TN and CODMn exhibit a general trend type of “−1” (not significantly decreased) (Figure 6). The concentrations of TP, TN, and CODMn do not display a significant overall trend, suggesting that these pollutants have reached a relatively stable state of concentration increase and decrease during the annual opening and closing periods. However, NH3-N exhibits a significant overall and localized increasing trend (Figure 6), which may be attributed to the high population density in Wuxi city. The discharge of industrial and domestic wastewater in urban production and daily life was relatively large [77]. This wastewater enters the floodgate-controlled reach, which results in a sustained increase in the NH3-N concentration [75,78].
Furthermore, TP’s trend type at the S1 sampling point was “4” (extremely significant increase); at the S2 sampling point, it was “3” (significant increase) (Figure 6). This indicates that the local concentrations of TP at sampling points S1 and S2 have shown a notable upward trend over three years. This trend could be associated with the influx of dissolved phosphorus as sampling points S1 and S2 are closest to the upstream area, making them particularly susceptible to the impact of dissolved phosphorus input from upstream sources [79].
In addition, this section utilizes time series analysis to identify trends in concentration data and to explore the characteristics and range of changes in the concentration of these pollutants. The findings are presented below:
In the exponential smoothing fitting curve of the four pollutants, the stationary R2 was significant at more than 0.6 (Figure 7), indicating the periodic fluctuation in the four pollutants. This may be due to the regularity of river hydrological changes (including flow, rainfall, and temperature) in the floodgate-controlled reach [21]. Hydrological changes are the main basis for the adjustment of floodgates, resulting in periodic changes in the concentration of pollutants in the floodgate-controlled reach affected by the adjustment of floodgates [9,78]. In addition, due to narrow urban river channels, the concentration changes in various pollutants are relatively similar [80].
As shown in Figure 7, for TN, there was a decreasing range from March to November and an increasing range from November to February. TN peaks from April to May each year and reaches its trough from October to November with the most significant change trend. NH3-N not only exhibits obvious fluctuation characteristics but also shows an upward trend over the three years (double exponential smoothing) (Figure 7). This could be attributed to the high levels of nitrogen compound emissions in the vicinity of this area, leading to the most pronounced fluctuations in TN and NH3-N concentrations within the floodgate-controlled region [6,81]. Furthermore, the general fitting curve for TP remains relatively consistent, with occasional periods of data fluctuation (Figure 7). This can be attributed to the presence of particulate P in TP, which tends to accumulate significantly after entering the floodgate-controlled area, causing frequent fluctuations in TP [82]. Lastly, the fitting curve for CODMn also displays some fluctuations. Still, it exhibits the lowest level of seasonal fitting among the four pollutants (R2 = 0.659) (Figure 7). This could be attributed to the presence of urban parks adjacent to the river (Figure 1), where vegetated areas exert an inhibitory effect on the fluctuation in the CODMn concentration [83].

4. Conclusions

Water quality changes were primarily driven by the adjustment of the floodgate in the floodgate-controlled reach, and the changes exhibited significant temporal heterogeneity. The 12 months that we assessed can be divided into two distinct phases: the opening and closing periods. The overall water quality of the reach can be categorized as “Poor” or “Marginal”. Unfortunately, these two states are at the lowest two levels in the CCME WQI; therefore, the water quality in the floodgate-controlled reach was not ideal. During the closing period, the floodgates accumulate pollutants, which are released during the opening period. All four pollutants exhibited periodic fluctuations. These water quality changes may be related to the obstruction of hydrodynamic forces by floodgates and factors related to urban sewage discharge (especially wastewater containing nitrogen compounds and dissolved/particulate phosphorus), underlining the complex interplay of factors affecting water quality. These findings collectively emphasize that the flood control procedures involving urban floodgates significantly impact water quality. Implementing a scientifically sound water resource management approach is imperative to reduce the risk of water quality deterioration.
Some suggestions for water resource management include the following: 1. During extended periods of floodgate closure, proactive river dredging can reduce the sedimentation of pollutants. 2. During the opening period of the floodgate, concentrated filtration can be applied to the water body to prevent pollution diffusion upon reopening. 3. Measures should be taken to reduce pollution levels in runoff from surrounding areas, especially upstream water bodies, minimizing the influx of pollutants into the floodgate-controlled reach. 4. In the vicinity of the floodgate-controlled reach, comprehensive control efforts must be implemented to address both point and non-point sources of pollution, focusing on nitrogen compounds and dissolved/particulate phosphorus, to prevent the generation of pollution.

Supplementary Materials

The following supporting information can be downloaded at: https://www.mdpi.com/article/10.3390/su16010185/s1, Table S1: Environmental quality standards for surface water (GB 3838-2002) [84]; Table S2: CCME WQI water quality classification; Table S3: Mann–Kendall trend types and features; Formulas (S1)–(S4).

Author Contributions

Conceptualization, P.H.; methodology, P.H.; software, P.H.; validation, L.F.; formal analysis, P.H.; investigation, P.H.; resources, L.F.; data curation, L.F.; writing—original draft preparation, P.H.; writing—review and editing, L.F.; visualization, P.H.; supervision, L.F.; project administration, L.F.; funding acquisition, L.F. All authors have read and agreed to the published version of the manuscript.

Funding

This research was funded by the Oversea Study Fellowship from the China Scholarship Council, National Natural Science Foundation of China (No. 42007151).

Institutional Review Board Statement

Not applicable.

Informed Consent Statement

Not applicable.

Data Availability Statement

The data collection for this study has been approved by the relevant managers. However, floodgates are usually critical infrastructure, and disclosing detailed data related to them may make them the target of malicious behavior, so access to such information is restricted.

Conflicts of Interest

The authors declare no conflict of interest.

References

  1. Haeffner, M.; Jackson-Smith, D.; Buchert, M.; Risley, J. Accessing blue spaces: Social and geographic factors structuring familiarity with, use of, and appreciation of urban waterways. Landsc. Urban Plann. 2017, 167, 136–146. [Google Scholar] [CrossRef]
  2. Kuo, P.-H.; Shih, S.-S.; Otte, M.L. Restoration recommendations for mitigating habitat fragmentation of a river corridor. J. Environ. Manag. 2021, 296, 113197. [Google Scholar] [CrossRef] [PubMed]
  3. Liu, M.; Zhao, L.; Li, Q.; Zou, J.; Hu, Y.; Zhang, Y.; Xu, P.; Wu, Z.; Deng, W.; Tao, J. Hydrochemical characteristics, main ion sources of main rivers in the source region of Yangtze River. China Environ. Sci. 2021, 41, 1243–1254. [Google Scholar] [CrossRef]
  4. Zhang, Z.; Zhang, H.; Feng, J.; Wang, Y.; Liu, K. Evaluation of social values for ecosystem services in urban riverfront space based on the solves model: A case study of the fenghe river, Xi’an, China. Int. J. Environ. Res. Public Health 2021, 18, 2765. [Google Scholar] [CrossRef] [PubMed]
  5. Chen, Y.; Xu, Y.; Zhou, K. The spatial stress of urban land expansion on the water environment of the Yangtze River Delta in China. Sci. Rep. 2022, 12, 17011. [Google Scholar] [CrossRef] [PubMed]
  6. Yang, H.; Li, Y.; Pu, Y.; Yao, X.; Yao, J. Spatio-temporal distribution characteristics and the river water quality of Zhangjiagang City. Acta Sci. Circumstantiae 2021, 41, 4064–4073. [Google Scholar] [CrossRef]
  7. Liu, J.; Shen, Z.; Yan, T.; Yang, Y. Source identification and impact of landscape pattern on riverine nitrogen pollution in a typical urbanized watershed, Beijing, China. Sci. Total Environ. 2018, 628, 1296–1307. [Google Scholar] [CrossRef]
  8. Huang, J.; Zhang, Y.; Bing, H.; Peng, J.; Dong, F.; Gao, J.; Arhonditsis, G.B. Characterizing the river water quality in China: Recent progress and on-going challenges. Water Res. 2021, 201, 117309. [Google Scholar] [CrossRef]
  9. Luo, Z.; Shao, Q.; Zuo, Q.; Cui, Y. Impact of land use and urbanization on river water quality and ecology in a dam dominated basin. J. Hydrol. 2020, 584, 124655. [Google Scholar] [CrossRef]
  10. Ho, M.; Lall, U.; Allaire, M.; Devineni, N.; Kwon, H.H.; Pal, I.; Raff, D.; Wegner, D. The future role of dams in the United States of America. Water Resour. Res. 2017, 53, 982–998. [Google Scholar] [CrossRef]
  11. Maavara, T.; Chen, Q.; Meter, K.V.; Brown, L.E.; Zhang, J.; Ni, J.; Zarfl, C. River dam impacts on biogeochemical cycling. Nat. Rev. Earth Environ. 2020, 1, 103–116. [Google Scholar] [CrossRef]
  12. Feng, L.; Hu, P.; Chen, M.; Li, B. Quantifying cumulative changes in water quality caused by small floodgates in Taihu Lake Basin—A case in Wuxi. Sci. Total Environ. 2023, 900, 165608. [Google Scholar] [CrossRef] [PubMed]
  13. Huang, C.; Li, X.-F.; You, Z. The Impacts of Urban Manufacturing Agglomeration on the Quality of Water Ecological Environment Downstream of the Three Gorges Dam. Front. Ecol. Evol. 2021, 8, 612883. [Google Scholar] [CrossRef]
  14. Kuriqi, A.; Pinheiro, A.N.; Sordo-Ward, A.; Bejarano, M.D.; Garrote, L. Ecological impacts of run-of-river hydropower plants—Current status and future prospects on the brink of energy transition. Renew. Sustain. Energy Rev. 2021, 142, 110833. [Google Scholar] [CrossRef]
  15. Dépret, T.; Piégay, H.; Dugué, V.; Vaudor, L.; Faure, J.-B.; Le Coz, J.; Camenen, B. Estimating and restoring bedload transport through a run-of-river reservoir. Sci. Total Environ. 2019, 654, 1146–1157. [Google Scholar] [CrossRef] [PubMed]
  16. Zhang, X.; Fang, C.; Wang, Y.; Lou, X.; Su, Y.; Huang, D. Review of effects of dam construction on the ecosystems of river estuary and nearby marine areas. Sustainability 2022, 14, 5974. [Google Scholar] [CrossRef]
  17. Ezcurra, E.; Barrios, E.; Ezcurra, P.; Ezcurra, A.; Vanderplank, S.; Vidal, O.; Villanueva-Almanza, L.; Aburto-Oropeza, O. A natural experiment reveals the impact of hydroelectric dams on the estuaries of tropical rivers. Sci. Adv. 2019, 5, eaau9875. [Google Scholar] [CrossRef]
  18. Yang, H.; Yang, S.; Xu, K.; Milliman, J.; Wang, H.; Yang, Z.; Chen, Z.; Zhang, C. Human impacts on sediment in the Yangtze River: A review and new perspectives. Glob. Planet. Chang. 2018, 162, 8–17. [Google Scholar] [CrossRef]
  19. Deng, X.; Xu, Y. Degrading flood regulation function of river systems in the urbanization process. Sci. Total Environ. 2018, 622, 1379–1390. [Google Scholar] [CrossRef]
  20. Lokhande, S.; Tare, V. Spatio-temporal trends in the flow and water quality: Response of river Yamuna to urbanization. Environ. Monit. Assess. 2021, 193, 117. [Google Scholar] [CrossRef]
  21. Wang, Y.; Lu, S.; Feng, Q.; Liu, W.; Liu, J.; Liu, K.; Zuo, Y. Effect of cascade dam construction on the spatio-temporal variations of water quality in Heihe River. J. Lake Sci. 2020, 32, 1539–1551. [Google Scholar] [CrossRef]
  22. Akoto, O.; Adopler, A.; Tepkor, H.E.; Opoku, F. A comprehensive evaluation of surface water quality and potential health risk assessments of Sisa river, Kumasi. Groundw. Sustain. Dev. 2021, 15, 100654. [Google Scholar] [CrossRef]
  23. Pereda, O.; Acuña, V.; von Schiller, D.; Sabater, S.; Elosegi, A. Immediate and legacy effects of urban pollution on river ecosystem functioning: A mesocosm experiment. Ecotoxicol. Environ. Saf. 2019, 169, 960–970. [Google Scholar] [CrossRef] [PubMed]
  24. Liu, X.; Hu, X.; Ao, X.; Wu, X.; Ouyang, S. Community characteristics of aquatic organisms and management implications after construction of Shihutang Dam in the Gangjiang River, China. Lake Reserv. Manag. 2018, 34, 42–57. [Google Scholar] [CrossRef]
  25. Choo, Y.-M.; Sim, S.-B.; Choe, Y.-W. A study on urban inundation using SWMM in Busan, Korea, using existing dams and artificial underground waterways. Water 2021, 13, 1708. [Google Scholar] [CrossRef]
  26. Feng, L.; Sun, X.; Zhu, X. Impact of floodgates operation on water environment using one-dimensional modelling system in river network of Wuxi city, China. Ecol. Eng. 2016, 91, 173–182. [Google Scholar] [CrossRef]
  27. Mel, R.A.; Viero, D.P.; Carniello, L.; D’Alpaos, L. Optimal floodgate operation for river flood management: The case study of Padova (Italy). J. Hydrol. Reg. Stud. 2020, 30, 100702. [Google Scholar] [CrossRef]
  28. Deng, X. Correlations between water quality and the structure and connectivity of the river network in the Southern Jiangsu Plain, Eastern China. Sci. Total Environ. 2019, 664, 583–594. [Google Scholar] [CrossRef]
  29. Panagiotou, A.; Zogaris, S.; Dimitriou, E.; Mentzafou, A.; Tsihrintzis, V.A. Anthropogenic barriers to longitudinal river connectivity in Greece: A review. Ecohydrol. Hydrobiol. 2022, 22, 295–309. [Google Scholar] [CrossRef]
  30. Zhang, Y.; Xia, J.; Liang, T.; Shao, Q. Impact of water projects on river flow regimes and water quality in Huai River Basin. Water Resour. Manag. 2010, 24, 889–908. [Google Scholar] [CrossRef]
  31. Bianchini, I.; Fushita, Â.T.; Cunha-Santino, M.B. Evaluating the retention capacity of a new subtropical run-of-river reservoir. Environ. Monit. Assess. 2019, 191, 161. [Google Scholar] [CrossRef] [PubMed]
  32. Geng, M.; Wang, K.; Yang, N.; Li, F.; Zou, Y.; Chen, X.; Deng, Z.; Xie, Y. Spatiotemporal water quality variations and their relationship with hydrological conditions in Dongting Lake after the operation of the Three Gorges Dam, China. J. Clean. Prod. 2021, 283, 124644. [Google Scholar] [CrossRef]
  33. Deng, C.; Liu, L.; Li, H.; Peng, D.; Wu, Y.; Xia, H.; Zhang, Z.; Zhu, Q. A data-driven framework for spatiotemporal characteristics, complexity dynamics, and environmental risk evaluation of river water quality. Sci. Total Environ. 2021, 785, 147134. [Google Scholar] [CrossRef] [PubMed]
  34. Ustaoğlu, F.; Taş, B.; Tepe, Y.; Topaldemir, H. Comprehensive assessment of water quality and associated health risk by using physicochemical quality indices and multivariate analysis in Terme River, Turkey. Environ. Sci. Pollut. Res. 2021, 28, 62736–62754. [Google Scholar] [CrossRef] [PubMed]
  35. Sun, W.; Chen, W.; Jin, Z. Spatial function regionalization based on an ecological-economic analysis in Wuxi City, China. Chin. Geogr. Sci. 2019, 29, 352–362. [Google Scholar] [CrossRef]
  36. Li, J.; Pu, L.; Zhu, M.; Liao, Q.; Wang, H.; Cai, F. Spatial pattern of heavy metal concentration in the soil of rapid urbanization area: A case of Ehu Town, Wuxi City, Eastern China. Environ. Earth Sci. 2014, 71, 3355–3362. [Google Scholar] [CrossRef]
  37. Li, Y.; Wang, X.; Tian, X.; Zhang, Y. Understanding the mechanism of urban material metabolism with ecological network analysis: An experimental study of Wuxi, China. Ecol. Modell. 2018, 367, 58–67. [Google Scholar] [CrossRef]
  38. Shao, Z.; Zhang, Y.; Li, Y. Greening China’s urban growth machine: The micro-politics of growth and environment protection in Wuxi, China. J. Urban Aff. 2023, 1–15. [Google Scholar] [CrossRef]
  39. Yi, J.; Xu, F.; Gao, Y.; Xiang, L.; Mao, X. Variations of water quality of the major 22 inflow rivers since 2007 and impacts on Lake Taihu. J. Lake Sci. 2016, 6, 1167–1174. [Google Scholar] [CrossRef]
  40. Peng, H. Bulletin on the Ecological Environment of Wuxi City in 2022; Wuxi Ecological Environment Bureau: Wuxi, China, 2023; pp. 1–23. [Google Scholar]
  41. HJ636-2012; Water Quality-Determination of Total Nitrogen-Alkaline Potassium Persulfate Digestion UV Spectrophotometric Method. China Environmental Science Press: Beijing, China, 2012; pp. 1–8.
  42. HJ671-2013; Water Quality-Determination of Total Phosphorus-Flow Injection Analysis (FIA) and Ammonium Molybdate Spectrophotometry. China Environmental Science Press: Beijing, China, 2013; pp. 1–12.
  43. GB11892-89; Water Quality-Determination of Permanganate Index. China Environmental Science Press: Beijing, China, 1990; pp. 184–187.
  44. HJ/T195-2005; Water Quality—Determination of Ammonia—Nitrogen by Gas—Phase Molecular Absorption Spectrometry. China Environmental Science Press: Beijing, China, 2006; pp. 1–3.
  45. Elhatip, H.; Hınıs, M.A.; Gülbahar, N. Evaluation of the water quality at Tahtali dam watershed in Izmir-Turkey by means of statistical methodology. Stoch. Environ. Res. Risk Assess. 2008, 22, 391–400. [Google Scholar] [CrossRef]
  46. Calazans, G.M.; Pinto, C.C.; da Costa, E.P.; Perini, A.F.; Oliveira, S.C. Using multivariate techniques as a strategy to guide optimization projects for the surface water quality network monitoring in the Velhas river basin, Brazil. Environ. Monit. Assess. 2018, 190, 726. [Google Scholar] [CrossRef] [PubMed]
  47. McKight, P.E.; Najab, J. Kruskal-Wallis test. Corsini Encycl. Psychol. 2010, 1-1. [Google Scholar] [CrossRef]
  48. Kennedy-Shaffer, L. Before p < 0.05 to beyond p < 0.05: Using history to contextualize p-values and significance testing. Am. Stat. 2019, 73, 82–90. [Google Scholar] [CrossRef] [PubMed]
  49. Kamble, S.R.; Vijay, R. Assessment of water quality using cluster analysis in coastal region of Mumbai, India. Environ. Monit. Assess. 2011, 178, 321–332. [Google Scholar] [CrossRef] [PubMed]
  50. Dabgerwal, D.K.; Tripathi, S.K. Assessment of surface water quality using hierarchical cluster analysis. Int. J. Environ. 2016, 5, 32–44. [Google Scholar] [CrossRef]
  51. Warsito, B.; Sumiyati, S.; Yasin, H.; Faridah, H. Evaluation of river water quality by using hierarchical clustering analysis. IOP Conf. Ser. Earth Environ. Sci 2021, 896, 012072. [Google Scholar] [CrossRef]
  52. Rickwood, C.J.; Carr, G.M. Development and sensitivity analysis of a global drinking water quality index. Environ. Monit. Assess. 2009, 156, 73–90. [Google Scholar] [CrossRef] [PubMed]
  53. Bilgin, A. Evaluation of surface water quality by using Canadian Council of Ministers of the Environment Water Quality Index (CCME WQI) method and discriminant analysis method: A case study Coruh River Basin. Environ. Monit. Assess. 2018, 190, 554. [Google Scholar] [CrossRef]
  54. Yang, T.; Wei, Y.; Yan, C.; Xing, X.; Qiao, D. Application of CCME WQI in Water Quality Evaluation of China. Water Resour. Power 2017, 35, 73–75. [Google Scholar]
  55. Hamed, K.H. Trend detection in hydrologic data: The Mann–Kendall trend test under the scaling hypothesis. J. Hydrol. 2008, 349, 350–363. [Google Scholar] [CrossRef]
  56. Zhai, X.; Xia, J.; Zhang, Y. Water quality variation in the highly disturbed Huai River Basin, China from 1994 to 2005 by multi-statistical analyses. Sci. Total Environ. 2014, 496, 594–606. [Google Scholar] [CrossRef] [PubMed]
  57. Mahmoodi, N.; Osati, K.; Salajegheh, A.; Saravi, M.M. Trend in river water quality: Tracking the overall impacts of climate change and human activities on water quality in the Dez River Basin. J. Water Health 2021, 19, 159–173. [Google Scholar] [CrossRef]
  58. Men, B.; Li, C.; Yin, S. Analysis of spatiotemporal dynamic evolution trend of groundwater quality in Daxing District based on partial connection number. Water Resour. Prot. 2023, 39, 233–243. [Google Scholar] [CrossRef]
  59. Su, S.; Li, D.; Zhang, Q.; Xiao, R.; Huang, F.; Wu, J. Temporal trend and source apportionment of water pollution in different functional zones of Qiantang River, China. Water Res. A J. Int. Water Assoc. 2011, 45, 1781–1795. [Google Scholar] [CrossRef] [PubMed]
  60. Yang, H.; Jia, C.; Li, X.; Yang, F.; Wang, C.; Yang, X. Evaluation of seawater intrusion and water quality prediction in Dagu River of North China based on fuzzy analytic hierarchy process exponential smoothing method. Environ. Sci. Pollut. Res. 2022, 29, 66160–66176. [Google Scholar] [CrossRef] [PubMed]
  61. Piao, J.; Tang, C.; Song, X. Distributions of phosphorus fractions in the sediments of a river–lake system: A case study in Huai River catchment area, China. Water Sci. Technol. 2015, 72, 824–834. [Google Scholar] [CrossRef]
  62. Yin, Y.; Zhang, W.; Tang, J.; Chen, X.; Zhang, Y.; Cao, X.; Li, Q. Impact of river dams on phosphorus migration: A case of the Pubugou Reservoir on the Dadu River in China. Sci. Total Environ. 2022, 809, 151092. [Google Scholar] [CrossRef] [PubMed]
  63. Zheng, H.; Lei, X.; Shang, Y.; Duan, Y.; Kong, L.; Jiang, Y.; Wang, H. Sudden water pollution accidents and reservoir emergency operations: Impact analysis at Danjiangkou Reservoir. Environ. Technol. 2018, 39, 787–803. [Google Scholar] [CrossRef]
  64. Tang, X. Evolution, driving mechanism and control strategy for eutrophication in Changjiang River Basin. Yangtze River 2020, 51, 80–87. [Google Scholar] [CrossRef]
  65. Tang, L.; Pan, X.; Feng, J.; Pu, X.; Liang, R.; Li, R.; Li, K. Experimental investigation on the relationship between COD degradation and hydrodynamic conditions in urban rivers. Int. J. Environ. Res. Public Health 2019, 16, 3447. [Google Scholar] [CrossRef]
  66. Le, T.P.Q.; Billen, G.; Garnier, J.; Chau, V.M. Long-term biogeochemical functioning of the Red River (Vietnam): Past and present situations. Reg. Environ. Chang. 2015, 15, 329–339. [Google Scholar] [CrossRef]
  67. Yaghmaei, H.; Sadeghi, S.H.; Moradi, H.; Gholamalifard, M. Effect of Dam operation on monthly and annual trends of flow discharge in the Qom Rood Watershed, Iran. J. Hydrol. 2018, 557, 254–264. [Google Scholar] [CrossRef]
  68. Yang, L.; Li, J.; Zhou, K.; Feng, P.; Dong, L. The effects of surface pollution on urban river water quality under rainfall events in Wuqing district, Tianjin, China. J. Clean. Prod. 2021, 293, 126136. [Google Scholar] [CrossRef]
  69. Zhang, Y.; Xia, J.; Wang, G.; Jiang, Y.; Zhao, C. Research on influence of dams’ union dispatch on water quality in Huaihe River Basin. Eng. J. Wuhan Univ. 2007, 40, 31–35. [Google Scholar] [CrossRef]
  70. Guo, C.; Jin, Z.; Guo, L.; Lu, J.; Ren, S.; Zhou, Y. On the cumulative dam impact in the upper Changjiang River: Streamflow and sediment load changes. Catena 2020, 184, 104250. [Google Scholar] [CrossRef]
  71. Palinkas, C.M.; Testa, J.M.; Cornwell, J.C.; Li, M.; Sanford, L.P. Influences of a river dam on delivery and fate of sediments and particulate nutrients to the adjacent estuary: Case study of Conowingo Dam and Chesapeake Bay. Estuaries Coasts 2019, 42, 2072–2095. [Google Scholar] [CrossRef]
  72. Xia, X.; Zhang, S.; Li, S.; Zhang, L.; Wang, G.; Zhang, L.; Wang, J.; Li, Z. The cycle of nitrogen in river systems: Sources, transformation, and flux. Environ. Sci. Process. Impacts 2018, 20, 863–891. [Google Scholar] [CrossRef]
  73. Xu, H.; Gao, Q.; Yuan, B. Analysis and identification of pollution sources of comprehensive river water quality: Evidence from two river basins in China. Ecol. Indic. 2022, 135, 108561. [Google Scholar] [CrossRef]
  74. Gao, Y.; Zhou, F.; Ciais, P.; Miao, C.; Yang, T.; Jia, Y.; Zhou, X.; Klaus, B.-B.; Yang, T.; Yu, G. Human activities aggravate nitrogen-deposition pollution to inland water over China. Natl. Sci. Rev. 2020, 7, 430–440. [Google Scholar] [CrossRef]
  75. Zhang, J.; Zhang, L.; Chai, Q.; Shen, Y.; Ji, L.; Zhao, Q.; Li, X.; Liu, W.; Li, C. Insights into spatiotemporal variations of the water quality in Taihu Lake Basin, China. Environ. Monit. Assess. 2021, 193, 757. [Google Scholar] [CrossRef]
  76. Li, Z.; Ma, J.; Guo, J.; Paerl, H.W.; Brookes, J.D.; Xiao, Y.; Fang, F.; Ouyang, W.; Lunhui, L. Water quality trends in the Three Gorges Reservoir region before and after impoundment (1992–2016). Ecohydrol. Hydrobiol. 2019, 19, 317–327. [Google Scholar] [CrossRef]
  77. Atinkpahoun, C.N.; Le, N.D.; Pontvianne, S.; Poirot, H.; Leclerc, J.-P.; Pons, M.-N.; Soclo, H.H. Population mobility and urban wastewater dynamics. Sci. Total Environ. 2018, 622, 1431–1437. [Google Scholar] [CrossRef] [PubMed]
  78. Duan, W.; He, B.; Chen, Y.; Zou, S.; Wang, Y.; Nover, D.; Chen, W.; Yang, G. Identification of long-term trends and seasonality in high-frequency water quality data from the Yangtze River basin, China. PLoS ONE 2018, 13, e0188889. [Google Scholar] [CrossRef] [PubMed]
  79. Chen, S.; Chen, L.; Gao, Y.; Guo, J.; Li, L.; Shen, Z. Larger phosphorus flux triggered by smaller tributary watersheds in a river reservoir system after dam construction. J. Hydrol. 2021, 601, 126819. [Google Scholar] [CrossRef]
  80. Wang, G.; Woyu, N.; Mao, J.; Xiao, Y.; Peng, J. Spatio-temproal variation analysis of water quality in sluice-controlled urban river based on two-step cluster. Environ. Eng. 2022, 40, 117–122+160. [Google Scholar] [CrossRef]
  81. Zhou, R.; Yuan, X.; Ja, B.M.; Yu, H.; Zhang, Q.; Tang, D. Spatial Distributions of Transferable Nitrogen Forms and Influencing Factors in Sediments from Inflow Rivers in Different Lake Basins. Environ. Sci. 2018, 39, 7. [Google Scholar] [CrossRef]
  82. Tang, X.; Wu, M.; Li, R. Distribution, sedimentation, and bioavailability of particulate phosphorus in the mainstream of the Three Gorges Reservoir. Water Res. 2018, 140, 44–55. [Google Scholar] [CrossRef]
  83. Bian, Z.; Liu, L.; Ding, S. Correlation between spatial-temporal variation in landscape patterns and surface water quality: A case study in the Yi River Watershed, China. Appl. Sci. 2019, 9, 1053. [Google Scholar] [CrossRef]
  84. GB3838-2002; Environmental Quality Standards for Surface Water. China Environment Publishing Group: Beijing, China, 2019; ISBN 1380163056.
Figure 1. Study area.
Sustainability 16 00185 g001
Figure 2. Analysis of the differences between the four pollutants in different periods (average from 2016 to 2018).
Sustainability 16 00185 g002
Figure 3. Cluster analysis for 12 months and pollutant concentration heat map (average from 2016 to 2018).
Sustainability 16 00185 g003
Figure 4. CCME WQI score in the adjustment cycle of the floodgate (average from 2016 to 2018).
Sustainability 16 00185 g004
Figure 5. The proportion of the four pollutants exceeding the standard (2016–2018).
Sustainability 16 00185 g005
Figure 6. Mann–Kendall trends of the four pollutants over three years (2016–2018).
Sustainability 16 00185 g006
Figure 7. Time series analysis of the four pollutants based on the exponential smoothing method (2016–2018).
Sustainability 16 00185 g007
Table 1. Hypothesis testing summary for the four assessed pollutants (average from 2016 to 2018).
IndexHypothesisSignificanceDecision (0.050)
TNThe distribution of water quality data are the same at different water quality periods0.058Acceptance
TP0.059Acceptance
CODMn0.012Rejection
NH3-N0.018Rejection
Disclaimer/Publisher’s Note: The statements, opinions and data contained in all publications are solely those of the individual author(s) and contributor(s) and not of MDPI and/or the editor(s). MDPI and/or the editor(s) disclaim responsibility for any injury to people or property resulting from any ideas, methods, instructions or products referred to in the content.

