
Analysis of Multi-Temporal Shoreline Changes Due to a Harbor Using Remote Sensing Data and GIS Techniques
 ,
,  ,
,  ,
,  and
and 
Abstract
:1. Introduction
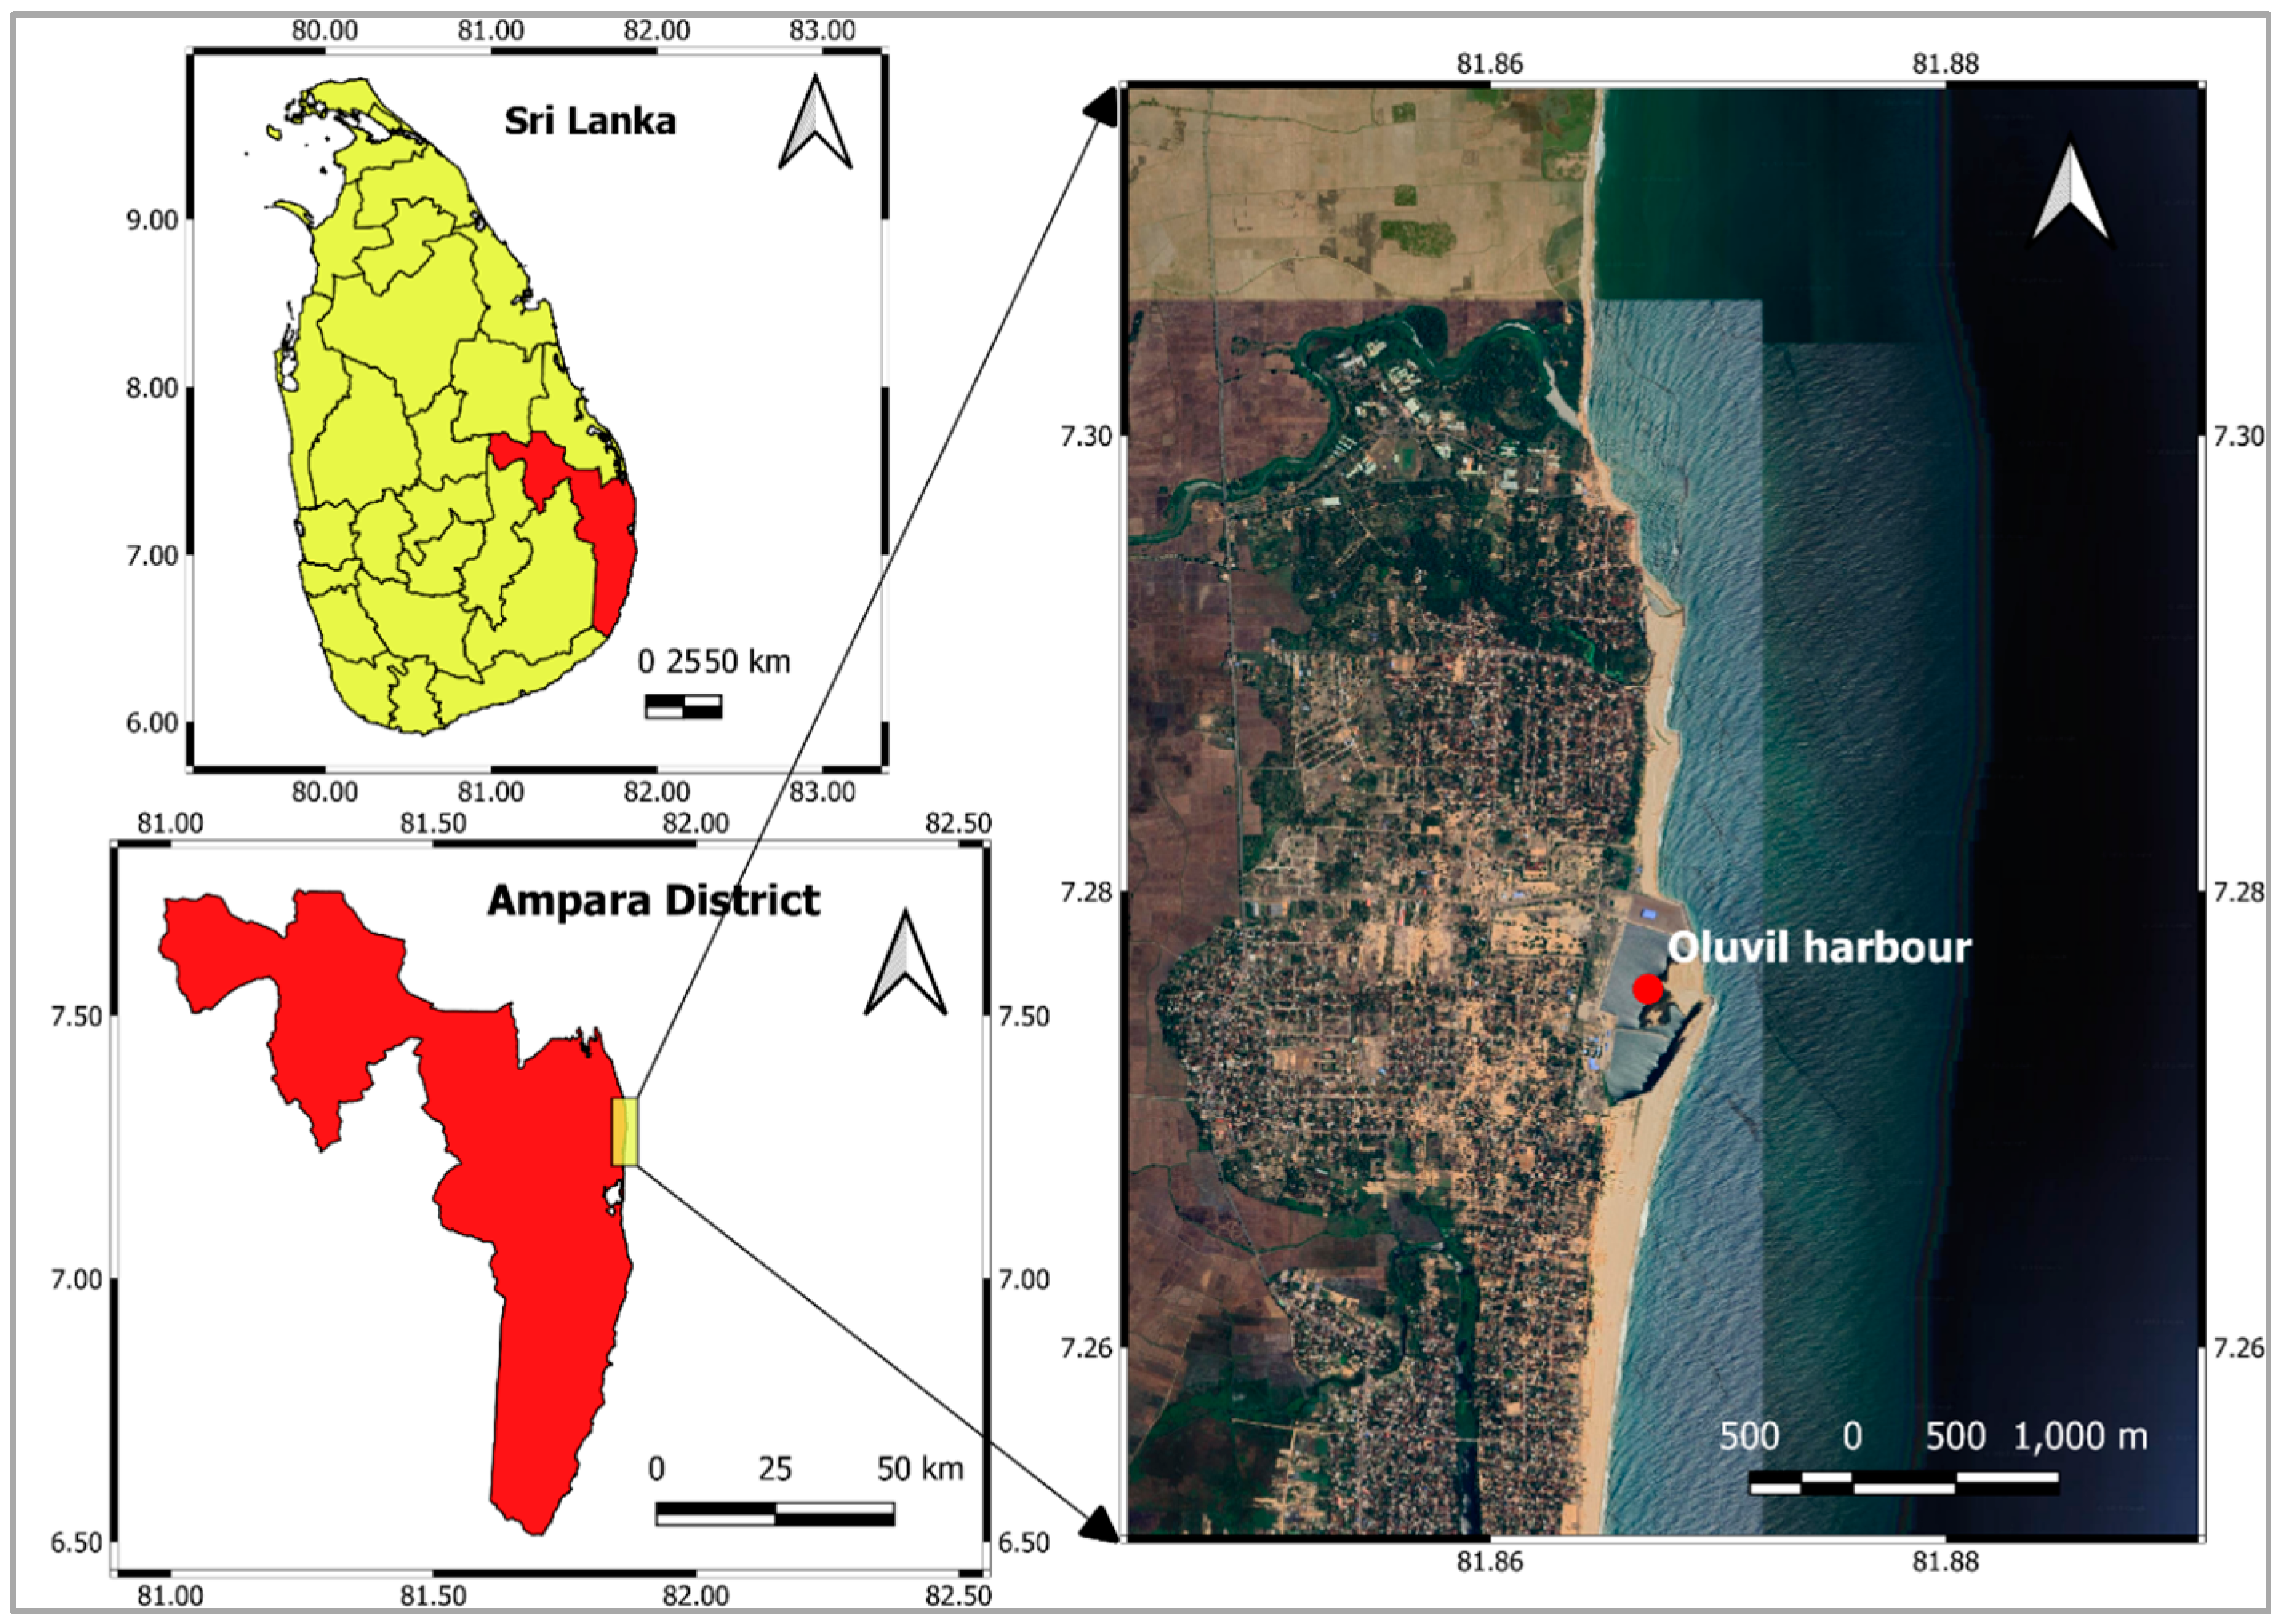
2. Study Area
3. Materials and Methodology
3.1. Data Acquisition
3.2. Detection and Extraction of Shorelines
3.3. The Digital Shoreline Analysis System (DSAS) Application
4. Results and Discussion
4.1. Changes in Shoreline Configuration Pre- and Post-Construction of Oluvil Harbor
4.2. DSAS Statics for Oluvil Coast
4.3. Dynamic Shoreline Processes: Erosion and Accretion
4.4. Potential Impact of Shoreline Changes on Eco-System and Land Use Patterns
4.5. Current State of Oluvil Harbor and Potential Strategies for Future Mitigations
4.6. Accuracy of LandSat Images in the Shoreline Detection
5. Conclusions and Future Works
Author Contributions
Funding
Institutional Review Board Statement
Informed Consent Statement
Data Availability Statement
Acknowledgments
Conflicts of Interest
References
- Crossland, C.J.; Kremer, H.H.; Lindeboom, H.; Crossland, J.I.M.; Le Tissier, M.D. (Eds.) Coastal Fluxes in the Anthropocene: The Land-Ocean Interactions in the Coastal Zone Project of the International Geosphere-Biosphere Programme; Springer Science & Business Media: Berlin/Heidelberg, Germany, 2005. [Google Scholar]
- McGranahan, G.; Balk, D.; Anderson, B. The rising tide: Assessing the risks of climate change and human settlements in low elevation coastal zones. Environ. Urban. 2007, 19, 17–37. [Google Scholar] [CrossRef]
- Cenci, L.; Disperati, L.; Persichillo, M.G.; Oliveira, E.R.; Alves, F.L.; Phillips, M. Integrating remote sensing and GIS techniques for monitoring and modeling shoreline evolution to support coastal risk management. GISci. Remote Sens. 2018, 55, 355–375. [Google Scholar] [CrossRef]
- Kummu, M.; De Moel, H.; Salvucci, G.; Viviroli, D.; Ward, P.J.; Varis, O. Over the hills and further away from coast: Global geospatial patterns of human and environment over the 20th–21st centuries. Environ. Res. Lett. 2016, 11, 034010. [Google Scholar] [CrossRef]
- Franco-Ochoa, C.; Zambrano-Medina, Y.; Plata-Rocha, W.; Monjardín-Armenta, S.; Rodríguez-Cueto, Y.; Escudero, M.; Mendoza, E. Long-term analysis of wave climate and shoreline change along the Gulf of California. Appl. Sci. 2020, 10, 8719. [Google Scholar] [CrossRef]
- Del Río, L.; Gracia, F.J.; Benavente, J. Shoreline change patterns in sandy coasts. A case study in SW Spain. Geomorphology 2013, 196, 252–266. [Google Scholar] [CrossRef]
- Palamakumbure, L.; Ratnayake, A.S.; Premasiri, H.M.R.; Ratnayake, N.P.; Katupotha, J.; Dushyantha, N.; Weththasinghe, S.; Weerakoon, W.A.P. Sea-level inundation and risk assessment along the south and southwest coasts of Sri Lanka. Geoenviron. Disasters 2020, 7, 17. [Google Scholar] [CrossRef]
- Reise, K. Coast of change: Habitat loss and transformations in the Wadden Sea. Helgol. Mar. Res. 2005, 59, 9–21. [Google Scholar] [CrossRef]
- Jacob, C.; Bernatchez, P.; Dupras, J.; Cusson, M. Not just an engineering problem: The role of knowledge and understanding of ecosystem services for adaptive management of coastal erosion. Ecosyst. Serv. 2021, 51, 101349. [Google Scholar] [CrossRef]
- Lanka, S.; Lewangamage, C.; Lewangamage, S.; Srisangeerthanan, S. Tropical cyclone damages in Sri Lanka. Wind Eng. JAWE 2015, 40, 294–302. [Google Scholar]
- Parape, C.D.; Premachandra, C.; Tamura, M.; Bari, A.; Disanayake, R.; Welikanna, D.; Jin, S.; Sugiura, M. Building damage and business continuity management in the event of natural hazards: Case study of the 2004 tsunami in Sri Lanka. Sustainability 2013, 5, 456–477. [Google Scholar] [CrossRef]
- Illangasekare, T.; Tyler, S.W.; Clement, T.P.; Villholth, K.G.; Perera, A.P.G.R.L.; Obeysekera, J.; Gunatilaka, A.; Panabokke, C.R.; Hyndman, D.W.; Cunningham, K.J.; et al. Impacts of the 2004 tsunami on groundwater resources in Sri Lanka. Water Resour. Res. 2006, 42, 1–9. [Google Scholar] [CrossRef]
- Poisson, B.; Garcin, M.; Pedreros, R. The 2004 December 26 Indian Ocean tsunami impact on Sri Lanka: Cascade modelling from ocean to city scales. Geophys. J. Int. 2009, 177, 1080–1090. [Google Scholar] [CrossRef]
- Chandrasekara, S.S.K.; Uranchimeg, S.; Kwon, H.H.; Lee, S.O. Coastal Flood Disaster in Sri Lanka-May 2017: Exploring Distributional Changes in Rainfall and Their Impacts on Flood Risk. J. Coast. Res. 2018, 85, 1476–1480. [Google Scholar] [CrossRef]
- Pollard, J.A.; Spencer, T.; Brooks, S.M. The interactive relationship between coastal erosion and flood risk. Prog. Phys. Geogr. 2019, 43, 574–585. [Google Scholar] [CrossRef]
- Alpar, B. Vulnerability of Turkish coasts to accelerated sea-level rise. Geomorphology 2009, 107, 58–63. [Google Scholar] [CrossRef]
- Chandrasekar, N. Coastal Vulnerability and Shoreline Changes for Southern Tip of India-Remote Sensing and GIS Approach. J. Earth Sci. Clim. Chang. 2013, 4, 2. [Google Scholar] [CrossRef]
- Murali, R.M.; Dhiman, R.; Choudhary, R.; Seelam, J.K.; Ilangovan, D.; Vethamony, P. Decadal shoreline assessment using remote sensing along the central Odisha coast, India. Environ. Earth Sci. 2015, 74, 7201–7213. [Google Scholar] [CrossRef]
- Dean, R.G.; Galvin, C.J., Jr. Beach erosion: Causes, processes, and remedial measures. Crit. Rev. Environ. Sci. Technol. 1976, 6, 259–296. [Google Scholar] [CrossRef]
- Aladwani, N.S. Shoreline change rate dynamics analysis and prediction of future positions using satellite imagery for the southern coast of Kuwait: A case study. Oceanologia 2022, 64, 417–432. [Google Scholar] [CrossRef]
- Abualtayef, M.; Ghabayen, S.; Foul, A.A.; Seif, A.; Kuroiwa, M.; Matsubara, Y.; Matar, O. The Impact of Gaza Fishing Harbour on the Mediterranean Coast of Gaza. J. Coast. Zone Manag. 2012, 16, 1–10. Available online: https://www.neliti.com/publications/92470/ (accessed on 30 November 2022).
- CCCRMD. Sri Lanka Coastal Zone and Coastal Resource Management Plan (CZMP)—2018; CCCRMD: Silver Spring, MD, USA, 2018.
- Stockdon, H.F.; Sallenger, A.H.; List, J.H.; Holman, R.A. Estimation of shoreline position and change using airborne topographic lidar data. J. Coast. Res. 2002, 18, 502–513. [Google Scholar]
- Mapping, S.; Moore, L.J. Shoreline Mapping Techniques. J. Coast. Res. 2000, 16, 111–124. [Google Scholar]
- Basterretxea, G.; Orfila, A.; Jordi, A.; Fornós, J.J.; Tintoré, J. Evaluation of a small volume renourishment strategy on a narrow Mediterranean beach. Geomorphology 2007, 88, 139–151. [Google Scholar] [CrossRef]
- Jones, B.M.; Arp, C.D.; Jorgenson, M.T.; Hinkel, K.M.; Schmutz, J.A.; Flint, P.L. Increase in the rate and uniformity of coastline erosion in Arctic Alaska. Geophys. Res. Lett. 2009, 36, 1–5. [Google Scholar] [CrossRef]
- Murray, J.; Adam, E.; Woodborne, S.; Miller, D.; Xulu, S.; Evans, M. Monitoring shoreline changes along the southwestern coast of South Africa from 1937 to 2020 using varied remote sensing data and approaches. Remote Sens. 2023, 15, 317. [Google Scholar] [CrossRef]
- Wang, J.; Wang, L.; Feng, S.; Peng, B.; Huang, L.; Fatholahi, S.N.; Tang, L.; Li, J. An Overview of Shoreline Mapping by Using Airborne LiDAR. Remote Sens. 2023, 15, 253. [Google Scholar] [CrossRef]
- White, S.A.; Wang, Y. Utilizing DEMs derived from LIDAR data to analyze morphologic change in the North Carolina coastline. Remote Sens. Environ. 2003, 85, 39–47. [Google Scholar] [CrossRef]
- Yang, B.; Hwang, C.; Cordell, H.K. Use of LiDAR shoreline extraction for analyzing revetment rock beach protection: A case study of Jekyll Island State Park, USA. Ocean Coast. Manag. 2012, 69, 1–15. [Google Scholar] [CrossRef]
- Smeeckaert, J.; Mallet, C.; David, N.; Chehata, N.; Ferraz, A. Large-scale classification of water areas using airborne topographic lidar data. Remote Sens. Environ. 2013, 138, 134–148. [Google Scholar] [CrossRef]
- Gens, R. Remote sensing of coastlines: Detection, extraction and monitoring. Int. J. Remote Sens. 2010, 31, 1819–1836. [Google Scholar] [CrossRef]
- Dellepiane, S.; De Laurentiis, R.; Giordano, F. Coastline extraction from SAR images and a method for the evaluation of the coastline precision. Pattern Recognit. Lett. 2004, 25, 1461–1470. [Google Scholar] [CrossRef]
- Trebossen, H.; Deffontaines, B.; Classeau, N.; Kouame, J.; Rudant, J.P. Suivi des évolutions côtières et des risques littoraux en Guyane française par imagerie radar à synthèse d’ouverture. C. R. Geosci. 2005, 337, 1140–1153. [Google Scholar] [CrossRef]
- Maiti, S.; Bhattacharya, A.K. Shoreline change analysis and its application to prediction: A remote sensing and statistics based approach. Mar. Geol. 2009, 257, 11–23. [Google Scholar] [CrossRef]
- Liu, Y.; Huang, H.; Qiu, Z.; Fan, J. Detecting coastline change from satellite images based on beach slope estimation in a tidal flat. Int. J. Appl. Earth Obs. Geoinf. 2013, 23, 165–176. [Google Scholar] [CrossRef]
- Kuleli, T.; Guneroglu, A.; Karsli, F.; Dihkan, M. Automatic detection of shoreline change on coastal Ramsar wetlands of Turkey. Ocean Eng. 2011, 38, 1141–1149. [Google Scholar] [CrossRef]
- Pardo-Pascual, J.E.; Almonacid-Caballer, J.; Ruiz, L.A.; Palomar-Vázquez, J. Automatic extraction of shorelines from Landsat TM and ETM+ multi-temporal images with subpixel precision. Remote Sens. Environ. 2012, 123, 1–11. [Google Scholar] [CrossRef]
- Li, W.; Gong, P. Continuous monitoring of coastline dynamics in western Florida with a 30-year time series of Landsat imagery. Remote Sens. Environ. 2016, 179, 196–209. [Google Scholar] [CrossRef]
- Gerardo, R.; de Lima, I. Comparing the capability of sentinel-2 and Landsat 9 imagery for mapping water and sandbars in the river bed of the Lower Tagus River (Portugal). Remote Sens. 2023, 15, 1927. [Google Scholar] [CrossRef]
- Apostolopoulos, D.N.; Nikolakopoulos, K.G. Assessment and quantification of the accuracy of low-and high-resolution remote sensing data for shoreline monitoring. ISPRS Int. J. Geo-Inf. 2020, 9, 391. [Google Scholar] [CrossRef]
- Hagenaars, G.; de Vries, S.; Luijendijk, A.P.; de Boer, W.P.; Reniers, A.J.H.M. On the accuracy of automated shoreline detection derived from satellite imagery: A case study of the sand motor mega-scale nourishment. Coast. Eng. 2018, 133, 113–125. [Google Scholar] [CrossRef]
- Pardo-Pascual, J.E.; Sánchez-García, E.; Almonacid-Caballer, J.; Palomar-Vázquez, J.M.; de los Santos, E.P.; Fernández-Sarría, A.; Balaguer-Beser, Á. Assessing the accuracy of automatically extracted shorelines on microtidal beaches from landsat 7, landsat 8 and sentinel-2 imagery. Remote Sens. 2018, 10, 326. [Google Scholar] [CrossRef]
- Viaña-Borja, S.P.; Ortega-Sánchez, M. Automatic methodology to detect the coastline from Landsat images with a new water index assessed on three different Spanish Mediterranean deltas. Remote Sens. 2019, 11, 2186. [Google Scholar] [CrossRef]
- Kuleli, T. Quantitative analysis of shoreline changes at the mediterranean coast in Turkey. Environ. Monit. Assess. 2010, 167, 387–397. [Google Scholar] [CrossRef] [PubMed]
- Yadav, A.; Dodamani, B.M.; Dwarakish, G.S. Shoreline analysis using Landsat-8 satellite image. ISH J. Hydraul. Eng. 2021, 27, 347–355. [Google Scholar] [CrossRef]
- Pham, B.T.; Prakash, I. Application of simple remote sensing techniques for the detection and extraction of coastline-a case study of diu island, India. Indian J. Ecol. 2018, 45, 778–784. [Google Scholar]
- Immanuvel David, T.; Mukesh, M.V.; Kumaravel, S.; Sabeen, H.M. Long-and short-term variations in shore morphology of Van Island in gulf of Mannar using remote sensing images and DSAS analysis. Arab. J. Geosci. 2016, 9, 756. [Google Scholar] [CrossRef]
- Otmani, H.; Belkessa, R.; Bengoufa, S.; Boukhediche, W.; Djerrai, N.; Abbad, K. Assessment of shoreline dynamics on the Eastern Coast of Algiers (Algeria): A spatiotemporal analysis using in situ measurements and geospatial tools. Arab. J. Geosci. 2020, 13, 124. [Google Scholar] [CrossRef]
- Thieler, E.R.; Himmelstoss, E.A.; Zichichi, J.L.; Ergul, A. The Digital Shoreline Analysis System (DSAS) Version 4.0—An ArcGIS extension for calculating shoreline change. In Open-File Report; US Geological Survey: Reston, VA, USA, 2009. [Google Scholar] [CrossRef]
- Boak, E.H.; Turner, I.L. Shoreline definition and detection: A review. J. Coast. Res. 2005, 21, 688–703. [Google Scholar] [CrossRef]
- Markose, V.J.; Rajan, B.; Kankara, R.S.; Chenthamil Selvan, S.; Dhanalakshmi, S. Quantitative analysis of temporal variations on shoreline change pattern along Ganjam district, Odisha, east coast of India. Environ. Earth Sci. 2016, 75, 929. [Google Scholar] [CrossRef]
- Hou, X.Y.; Wu, T.; Hou, W.; Chen, Q.; Wang, Y.D.; Yu, L.J. Characteristics of coastline changes in mainland China since the early 1940s. Sci. China Earth Sci. 2016, 59, 1791–1802. [Google Scholar] [CrossRef]
- Mahapatra, M.; Ratheesh, R.; Rajawat, A.S. Shoreline Change Analysis along the Coast of South Gujarat, India, Using Digital Shoreline Analysis System. J. Indian Soc. Remote Sens. 2014, 42, 869–876. [Google Scholar] [CrossRef]
- Liu, H.; Jezek, K.C. Automated extraction of coastline from satellite imagery by integrating Canny edge detection and locally adaptive thresholding methods. Int. J. Remote Sens. 2004, 25, 937–958. [Google Scholar] [CrossRef]
- El-Asmar, H.M.; White, K. Changes in coastal sediment transport processes due to construction of New Damietta Harbour, Nile Delta, Egypt. Coast. Eng. 2002, 46, 127–138. [Google Scholar] [CrossRef]
- Sun, F.; Sun, W.; Chen, J.; Gong, P. Comparison and improvement of methods for identifying waterbodies in remotely sensed imagery. Int. J. Remote Sens. 2012, 33, 6854–6875. [Google Scholar] [CrossRef]
- Modava, M.; Akbarizadeh, G.; Soroosh, M. Integration of Spectral Histogram and Level Set for Coastline Detection in SAR Images. IEEE Trans. Aerosp. Electron. Syst. 2019, 55, 810–819. [Google Scholar] [CrossRef]
- Yang, Y.; Liu, Y.; Zhou, M.; Zhang, S.; Zhan, W.; Sun, C.; Duan, Y. Landsat 8 OLI image based terrestrial water extraction from heterogeneous backgrounds using a reflectance homogenization approach. Remote Sens. Environ. 2015, 171, 14–32. [Google Scholar] [CrossRef]
- Maglione, P.; Parente, C.; Vallario, A. Coastline extraction using high resolution WorldView-2 satellite imagery. Eur. J. Remote Sens. 2014, 47, 685–699. [Google Scholar] [CrossRef]
- Kelly, J.T.; Gontz, A.M. Using GPS-surveyed intertidal zones to determine the validity of shorelines automatically mapped by Landsat water indices. Int. J. Appl. Earth Obs. Geoinf. 2018, 65, 92–104. [Google Scholar] [CrossRef]
- Athawuda, A.M.G.A.D.; Jayasiri, H.B.; Thushari, G.G.N.; Guruge, K.P.G.K.P. Quantification and morphological characterization of plastic litter (0.30–100 mm) in surface waters of off Colombo, west coast of Sri Lanka. Environ. Monit. Assess. 2020, 192, 509. [Google Scholar] [CrossRef]
- Perera, K.R.L.; Ranasinghe, D.P.L. An Analysis of Causes of Coastal Erosion in Calido Beach, Kalutara, West Coast of Sri Lanka. KDU J. Multidiscip. Stud. (KJMS) 2021, 3, 69–79. [Google Scholar]
- Lakmali, E.; Deshapriya, W.G.; Ishara Jayawardene, K.G.A.; Raviranga, R.M.; Ratnayake, N.; Premasiri, H.M.; Senanayake, I. Long term coastal erosion and shoreline positions of Sri Lanka. J. Surv. Fish. Sci. 2017, 3, 69–79. [Google Scholar] [CrossRef]
- Warnasuriya, T.W.S.; Gunaalan, K.; Gunasekara, S.S. Google Earth: A New Resource for Shoreline Change Estimation—Case Study from Jaffna Peninsula, Sri Lanka. Mar. Geod. 2018, 41, 546–580. [Google Scholar] [CrossRef]
- Amalan, K.; Ratnayake, A.S.; Ratnayake, N.P.; Weththasinghe, S.M.; Dushyantha, N.; Lakmali, N.; Premasiri, R. Influence of nearshore sediment dynamics on the distribution of heavy mineral placer deposits in Sri Lanka. Environ. Earth Sci. 2018, 77, 737. [Google Scholar] [CrossRef]
- Nijamir, K.; Thennakoon, T.M.S.P.K.; Rupi Herath, H.M.J.; Mohamed Kaleel, M.I. Exploring physical and human induced coastal morphodynamics: A study with reference to nintavur to addalaichenai coastal areas of Ampara District, Sri Lanka. Acad. J. Interdiscip. Stud. 2021, 10, 347–361. [Google Scholar] [CrossRef]
- Ezzeldin, M.M.; Rageh, O.S.; Saad, M.E. Assessment impact of the damietta harbour (egypt) and its deep navigation channel on adjacent shorelines. J. Integr. Coast. Zone Manag. 2020, 20, 265–281. [Google Scholar] [CrossRef]
- Elmoustapha, A.O.; Levoy, F.; Monfort, O.; Koutitonsky, V.G. A numerical forecast of shoreline evolution after harbour construction in Nouakchott, Mauritania. J. Coast. Res. 2007, 23, 1409–1417. [Google Scholar] [CrossRef]
- Dastgheib, A.; Jongejan, R.; Wickramanayake, M.; Ranasinghe, R. Regional scale risk-informed land-use planning using Probabilistic Coastline Recession modelling and economical optimisation: East Coast of Sri Lanka. J. Mar. Sci. Eng. 2018, 6, 120. [Google Scholar] [CrossRef]
- Short, A.D. Macro-meso tidal beach morphodynamics: An overview. J. Coast. Res. 1991, 7, 417–436. [Google Scholar]
- Prasanna, H.M.I.; Gunathilaka, M.D.E.K.; Welikanna, D.R.; Lanka, S. Variability of the Sounding Datums Around Sri Lankan Coastline (10065). In Proceedings of the FIG Working Week, Hanoi, Vietnam, 23–25 April 2019. [Google Scholar]
- Frigaard, P.; Margheritini, L. Oluvil Port Development Project: 3rd Party Opinion on Report by Lanka Hydraulic Institute Ltd.: Oluvil Port Development Project: Studies on Beach Erosion, June 2011; Aalborg University: Aalborg, Denmark, 2011; Available online: http://vbn.aau.dk/ws/files/58116047/Oluvil_Port_Development_Project_3rd_Party_Opinion_on_Report_by_Lanka_Hydraulic_Institute_Ltd_Oluvil_Port_Development_Project_Studies_on_Beach_Erosion_June_2011.pdf (accessed on 1 December 2022).
- Wijeratne, E.M.S.; Pattiaratchi, C.B. Sea Level Variability in Sri Lanka Waters. 2003. Available online: http://wcrp.ipsl.jussieu.fr/Workshops/SeaLevel/Posters/2_1_WijeratneRevised.pdf (accessed on 1 December 2022).
- Zahir, I.L.M.; Madurapperuma, B.; Iyoob, A.L.; Nijamir, K. Exploring the Ever-Changing Seashore Using Geoinformatics Technology. Earth 2021, 2, 544–555. [Google Scholar] [CrossRef]
- Ranasinghe, R.; Duong, T.; Dastgheib, A.; de Boer, W.; de Vroeg, H. Longshore Sediment Transport (LST) Modelling Study: Trincomalee and Batticaloa Districts (Final Report); IHE: Delft, The Netherlands, 2018. [Google Scholar]
- Nijamir, K.; Ameer, F.; Thennakoon, S.; Herath, J.; Iyoob, A.L.; Zahir, I.L.M.; Sabaratnam, S.; Fathima Jisna, M.V.; Madurapperuma, B. Geoinformatics application for estimating and forecasting of periodic shoreline changes in the east coast of Ampara District, Sri Lanka. Ocean Coast. Manag. 2023, 232, 106425. [Google Scholar] [CrossRef]
- McFeeters, S.K. Ndwi by Mcfeeters. Remote Sens. Environ. 1996, 25, 687–711. [Google Scholar]
- Oyedotun, T.D.T. Shoreline Geometry: DSAS as a Tool for Historical Trend Analysis. Geomorphol. Tech. 2014, 2, 1–12. [Google Scholar]
- Quang, D.N.; Ngan, V.H.; Tam, H.S.; Viet, N.T.; Tinh, N.X.; Tanaka, H. Long-term shoreline evolution using dsas technique: A case study of Quang Nam province, Vietnam. J. Mar. Sci. Eng. 2021, 9, 1124. [Google Scholar] [CrossRef]
- Velsamy, S.; Balasubramaniyan, G.; Swaminathan, B.; Kesavan, D. Multi-decadal shoreline change analysis in coast of Thiruchendur Taluk, Thoothukudi district, Tamil Nadu, India, using remote sensing and DSAS techniques. Arab. J. Geosci. 2020, 13, 838. [Google Scholar] [CrossRef]
- Sytnik, O.; Del Río, L.; Greggio, N.; Bonetti, J. Historical shoreline trend analysis and drivers of coastal change along the Ravenna coast, NE Adriatic. Environ. Earth Sci. 2018, 77, 779. [Google Scholar] [CrossRef]
- Apostolopoulos, D.N.; Avramidis, P.; Nikolakopoulos, K.G. Estimating Quantitative Morphometric Parameters and Spatiotemporal Evolution of the Prokopos Lagoon Using Remote Sensing Techniques. J. Mar. Sci. Eng. 2022, 10, 931. [Google Scholar] [CrossRef]
- Hewavithana, D.K.; Pieris, A.L.; Peries, T.N.; Wijesinghe, M.R. Discovery of a large nesting colony of the Blue-tailed Bee-eater (Merops philippinus) in Oluvil, Ampara. Wildlanka 2017, 5, 11–16. [Google Scholar]
- Ameer, F. Physical impacts of Oluvil harbour. In Proceedings of the 5th International Symposium, London, UK, 27–28 June 2015; South Eastern University of Sri Lanka: Oluvil, Sri Lanka, 2015. [Google Scholar]
- Nijamir, K.; Kaleel, M.I.M. Coastal morphodynamics associated natural hazards: A case study of Oluvil area in Ampara district, Sri Lanka. World Sci. News 2018, 97, 113–124. Available online: http://yadda.icm.edu.pl/yadda/element/bwmeta1.element.psjd-f043b45b-146d-4bdd-a2c1-831b265dff2d (accessed on 30 November 2022).
- Almonacid-Caballer, J.; Sánchez-García, E.; Pardo-Pascual, J.E.; Balaguer-Beser, A.A.; Palomar-Vázquez, J. Evaluation of annual mean shoreline position deduced from landsat imagery as a mid-term coastal evolution indicator. Mar. Geol. 2016, 372, 79–88. [Google Scholar] [CrossRef]
- Karaman, M. Comparison of thresholding methods for shoreline extraction from sentinel-2 and landsat-8 imagery: Extreme Lake Salda, track of Mars on Earth. J. Environ. Manag. 2021, 298, 113481. [Google Scholar] [CrossRef]
- Dewidar, K.; Bayoumi, S. Forecasting shoreline changes along the Egyptian Nile Delta Coast using Landsat Image Series and geographic information system. Environ. Monit. Assess. 2021, 193, 429. [Google Scholar] [CrossRef] [PubMed]


| Image Source | Bands | Wavelength/(µm) | Resolution (m) | Year | Acquisition Date |
|---|---|---|---|---|---|
| Landsat 5 TM | 1—Blue 2—Green 3—Red 4—NIR | 0.45–0.52 0.52–0.60 0.63–0.69 0.76–0.90 | 30 | 1991 | 12 September 1991 |
| 1992 | 7 April 1992 | ||||
| 1996 | 7 July 1996 | ||||
| 1997 | 12 September 1997 | ||||
| 2004 | 14 August 2004 | ||||
| 2005 | 17 August 2005 | ||||
| 2006 | 4 August 2006 | ||||
| 2007 | 6 July 2007 | ||||
| 2008 | 6 June 2008 | ||||
| 2009 | 28 August 2009 | ||||
| 2010 | 3 May 2010 | ||||
| Landsat 7 ETM+ | 1—Blue | 0.45–0.52 | 30 | 2000 | 26 July 2000 |
| 2—Green | 0.52–0.60 | 2001 | 26 May 2001 | ||
| 3—Red | 0.63–0.69 | 2002 | 18 September 2002 | ||
| 4—NIR | 0.77–0.90 | 2003 | 19 July 2003 | ||
| Landsat 8 OLI | 2—Blue 3—Green 4—Red 5—NIR | 0.45–0.51 0.53–0.59 0.64–0.67 0.85–0.88 | 30 | 2013 | 24 September 2013 |
| 2014 | 23 June 2014 | ||||
| 2015 | 26 June 2015 | ||||
| 2016 | 16 September 2016 | ||||
| 2017 | 8 February 2017 | ||||
| 2018 | 4 July 2018 | ||||
| 2019 | 9 September 2019 | ||||
| 2020 | 26 August 2020 | ||||
| 2021 | 28 July 2021 |
Disclaimer/Publisher’s Note: The statements, opinions and data contained in all publications are solely those of the individual author(s) and contributor(s) and not of MDPI and/or the editor(s). MDPI and/or the editor(s) disclaim responsibility for any injury to people or property resulting from any ideas, methods, instructions or products referred to in the content. |
© 2023 by the authors. Licensee MDPI, Basel, Switzerland. This article is an open access article distributed under the terms and conditions of the Creative Commons Attribution (CC BY) license (https://creativecommons.org/licenses/by/4.0/).
Share and Cite
Zoysa, S.; Basnayake, V.; Samarasinghe, J.T.; Gunathilake, M.B.; Kantamaneni, K.; Muttil, N.; Pawar, U.; Rathnayake, U. Analysis of Multi-Temporal Shoreline Changes Due to a Harbor Using Remote Sensing Data and GIS Techniques. Sustainability 2023, 15, 7651. https://doi.org/10.3390/su15097651
Zoysa S, Basnayake V, Samarasinghe JT, Gunathilake MB, Kantamaneni K, Muttil N, Pawar U, Rathnayake U. Analysis of Multi-Temporal Shoreline Changes Due to a Harbor Using Remote Sensing Data and GIS Techniques. Sustainability. 2023; 15(9):7651. https://doi.org/10.3390/su15097651
Chicago/Turabian StyleZoysa, Sanjana, Vindhya Basnayake, Jayanga T. Samarasinghe, Miyuru B. Gunathilake, Komali Kantamaneni, Nitin Muttil, Uttam Pawar, and Upaka Rathnayake. 2023. "Analysis of Multi-Temporal Shoreline Changes Due to a Harbor Using Remote Sensing Data and GIS Techniques" Sustainability 15, no. 9: 7651. https://doi.org/10.3390/su15097651