

Effect of Transportation Operation on Air Quality in China Based on MODIS AOD during the Epidemic
by
 ,
,
Haixia Feng
1,2,
Zhouhao Wu
3,
Xin Li
4,*,
Huacai Xian
1,
Qiang Jia
1,
Xingyu Wang
1 and
Maoxin Zhu
1 1
School of Transportation and Logistics Engineering, Shandong Jiaotong University, Jinan 250023, China
2
Shandong Intelligent Transportation Key Laboratory (Preparatory), Jinan 250023, China
3
Transportation Research Center, Tsinghua University, Beijng 100084, China
4
Department of Industrial, Educational and Social Cooperation, Zhejiang Pharmaceutical University, Ningbo 315599, China
*
Author to whom correspondence should be addressed.
Sustainability 2023, 15(5), 4064; https://doi.org/10.3390/su15054064
Submission received: 23 January 2023
/
Revised: 10 February 2023
/
Accepted: 17 February 2023
/
Published: 23 February 2023
(This article belongs to the Special Issue Theory, Model, Technology, and Application of Remote Sensing in Sustainability)
Abstract
:With the rapid growth of automobile numbers and the increased traffic congestion, traffic has increasingly significant effects on regional air quality and regional sustainable development in China. This study tried to quantify the effect of transportation operation on regional air quality based on MODIS AOD. This paper analyzed the space-time characteristics of air quality and traffic during the epidemic by series analysis and kernel density analysis, and quantified the relationship between air quality and traffic through a Geographically Weighted Regression (GWR) model. The main research conclusions are as follows: The epidemic has a great impact on traffic and regional air quality. PM2.5 and NO2 had the same trend with traffic congestion delay index (CDI), but they were not as obvious as CDI. Both cities with traffic congestion and cities with the worst air quality showed strong spatial dependence. The concentration areas of high AOD value in the east areas of the Hu line were consistent with the two gathering centers formed by cities with traffic congestion in space, and also consistent with the gathering center of cities with poor air quality. The concentration area of AOD decline was consistent with the gathering center formed by cities with the worst air quality. AOD had a strong positive correlation with road network density, and its GWR correlation coefficient was 0.68, then These provinces suitable for GWR or not suitable were divided. This study has a great significance for the transportation planning, regional planning, air quality control strategies and regional sustainable development, etc.
1. Introduction
According to the Ministry of Public Security of China (MOT), by 2022, the number of motor vehicles had reached 417 million, and car parc has now passed the 319 million, surpassing the US to become the country with the most automobiles. The dramatic increase in motor vehicle causes traffic congestion. The research from Abdull [1], Oishi [2], Lv [3], Wang [4], Li [5], Lima [6], Pathak [7], and Jeong [8] have confirmed that traffic congestion brings more emissions in Kyoto, Nagoya (Japan), Beijing, Jinan, Hong Kong (China), Bogotá (Brazil), Delhi (India), and Toronto and Ontario (Canada) respectively. Road traffic emissions to NO2 and PM2.5 were the highest in Hamburg and EU [9,10], and the private cars were the main contributors accounting for 60% CO and SO2 emissions in Bogotá, Colombia [11]. Analyses of PM2.5 sources in Beijing, Hangzhou, Jinan, and other cities have also shown that motor vehicle emissions have surpassed coal to become the main source of urban PM2.5 pollution in China. Judging from the car parc per 1000 people, China’s car parc will continue to mount (in 2019, China’s car parc per 1000 people was 192, the United States as high as 837, Japan was 519, Malaysia was 433 which was equivalent to China’s per capita GDP, and Russia was 373, from McKinsey China Auto Consumer Insights 2019). Traffic emissions have increasingly significant effects on regional air quality and regional sustainable development. Quantify the effect of traffic operation condition on regional air quality are of great importance in regional sustainable development and government decision. With the rapid development of big data technology, traffic-related vehicle big data in traffic operation, traffic emission, air quality (monitoring and modeling) are becoming more widely used [12,13]. Néstor considered a traffic congestion detection system based on connected vehicles and big data through which drivers can identify traffic congestion and change routes accordingly to reduce emissions and shorten travel time [14]. The cost-benefit of five taxi emission reduction countermeasures were analyzed in detail based on multi-mode travel big data [15]. Qin proposed a method for constructing driving cycles in Chinese cities based on big data analysis [16]. Carbon emission flow from self-driving tours and its spatial relationship with scenic spots were examined with a traffic-related big data method [17,18,19]. The major navigation companies in China (Amap and Baidu Maps) launched traffic big data monitoring platforms (https://www.amap.com/ (accessed on 30 April 2022), https://map.baidu.com (accessed on 30 April 2022)) since 2014, which real-time monitor the traffic operation status of major cities in China in real time. The congestion delay index (CDI) based traffic big data proposed to express the time cost brought by traffic congestion to travelers. This has currently become an important basis for evaluating the traffic operations of a city, and an important reference for public transportation, government decision makers, and research institutions.
For the spatiotemporal characteristics of remote sensing data, the analysis of regional air quality and its changes based on remote sensing data has become an important method [20]. The strong correlation between the aerosol optical thickness (AOD) from remote sensing data and the concentration of near surface particles have already been confirmed by many research studies and free MODIS (Moderate Resolution Imaging Spectroradiometer) data is the most widely used in air pollution research [21,22,23].
COVID-19 wreaked havoc on people’s production and life. According to Amap, after the outbreak of COVID-19, both urban residents’ travel intensity and traffic congestion levels in Chinese cities declined differently in the first quarter in 2020, and rush hour congestion delay index (RHCDI) in Beijing, Wuhan, Tianjin, and other major cities decreased by more than 20% compared with the fourth quarter of 2019 (https://report.amap.com/download.do(accessed on 30 April 2022)). However, it also provided a rare opportunity to analyze the effects of transportation operation on regional air quality and regional sustainable development. Traffic volumes, road crash risk, and traffic levels in Rome, Los Angeles, South Korea, etc. were all monitored the significant decline during the period of COVID-19 [24,25,26]. Air quality in China [27,28,29,30,31], India [32,33], Ecuador [34], Spain [35], Canada [36], Moscow [37], the Middle East [38], etc. during COVID-19 were widely analyzed, and the remote sensing data such as TROOMI [39,40], OMI [41], and MODIS [41] were also widely used in air quality monitoring research. Those were researched that the effects of transportation on air quality during COVID-19 in Beijing [42], Shanghai [43], Chinese megacities [44], nationwide (China) [45], Los Angeles [46], New York [47], Istanbul [48], Poland [49], a northwestern US city [50], and Padova (Italy) [51]. These research studies mainly focus on statistical analysis of monitoring data.
Based on MODIS data and traffic big data, this study tried to quantify the effect of traffic operation condition on air quality in China by spatial analysis model during COVID-19.
2. Materials and Methods
2.1. Materials
2.1.1. Research Area and Time
As the world’s largest developing country, China has achieved rapid development, but there are also many problems, such as unbalanced economic and population development. East of the Hu line, which accounts for 43% of China’s land area but 94% of its national population and 96% of the GDP, traffic is heavy, and air quality is poor. According to AMAP monitoring data, in 2020, 93 of the top 100 cities for traffic congestion were located east of the Hu line (Figure 1). Among the 100 cities with the worst air quality in 2020, only Lanzhou, Yinchuan, and Urumqi were west of the Hu line (Figure 1). Nearly half of the cities were coincident between the top 100 cities for traffic congestion and the 100 cities with the worst air quality. For the present study, five cities were selected for analysis—namely, Wuhan (COVID-19 outbreak), Beijing (the capital of China, megacity), and Jinan (capital of Shandong Province; ranked first in the peak congestion index for 2017–2018, and poor air quality) (Figure 1).
The research time is from 1 January to 30 April in 2020 and 2019, and it was divided into four phases; see Table 1.
2.1.2. Research Data
Traffic Data
Congestion delay index (CDI) is an evaluation index that the Amap (https://report.amap.com/diagnosis/index.do (accessed on 8 January 2023)) and Baidu map (https://jiaotong.baidu.com/top (accessed on 8 February 2023)) platforms use for real-time traffic monitoring in major cities. It is the ratio of travel time in traffic congestion (actual traffic time) to that of free flow (the traffic time in unblocked state).
The rush hour congestion delay index (RHCDI, 7:00–9:00 in the morning, 17:00–19:00 in the evening) is an evaluation index of urban congestion that intuitively represents traffic in a city’s road network, and it is also a reflection of exhaust emissions. CDI > 2 is generally considered to indicate serious congestion. The velocity of urban free flow shows considerable differences. In the top 100 congested cities in 2019, the average free-flow velocity was 43.93 km/h. Chongqing had the highest free-flow velocity of 49.51 km/h while Jinhua had only 37.65 km/h. According to Amap, in the first quarter of 2019, for example, the RHCDIs in Beijing city and Chongqing city were above 2.0. The RHCDIs of Wuxuan Road, Yangtze River First Road, and other parts of Chongqing were all above 4.2.
Road network data was collected, including text format and vector format, etc.
Air Quality Data
The national ambient air quality monitoring network includes 1547 air quality monitoring stations. Monitoring results are published on the China Air Quality Online Monitoring and Analysis Platform (https://www.aqistudy.cn/ (accessed on 8 January 2023)). The air quality monitoring factors are as follows: six pollutants (i.e., PM2.5, PM10, SO2, NO2, CO, and O3) and air quality index (AQI). AQI is a dimensionless index that quantitatively describes air quality. It is the expression of air pollution degree and air quality state derived from six parameters (e.g., PM2.5), ranging from 0 to 500. The lower the index, the better the air quality. Figure 2 shows data for the six parameters in Wuhan during the study periods (O3 data were given as the average of eight hours while others were for one hour; for the different scales, O3 was not used) pollutants.
As can be seen in Figure 2, AQI, PM2.5, and PM10 had almost the same variation trends. CO and SO2 content were relatively low, especially CO, without obvious fluctuation patterns. NO2 content was higher than SO2 and lower than AQI, PM2.5, and PM10.
MODIS Data
MOD08 products (daily product, 8-day product and monthly product) are L3 atmosphere product of MODIS, and that includes aerosol, water vapor, and cloud information (https://ladsweb.modaps.eosdis.nasa.gov/ (accessed on 8 January 2023)). The resolution of MODO8 l3 products are 1 degree.
2.1.3. Data Preprocessing
The collected data were preprocessed including, for example, the inspection and processing of data quality, the synthesis of AOD data according to the research phase, the provincial statistics of road network density, the statistics of CDI data, etc.
2.2. Methods
2.2.1. Time Series Analysis
Time series data is a series of data arranged in chronological order, changing with time and related to each other. By studying time series data, we can find the law of historical data, evaluate the current status, predict the change trend of future. Time series analysis was used to analyze the temporal characteristics of CDI, PM2.5, NO2 and the MODISAOD during COVID-19 based on the corresponding to time series data.
2.2.2. Spatial Analysis
Kernel Density Analysis
Kernel density analysis uses the kernel function to calculate the quantity value per unit area according to the point or polyline features, then fit each point or polyline into a smooth conical surface according to data value [26]. This tool is used to calculate the density of features in their surrounding neighborhoods, so it can measure the spatial distribution characteristics of variables.
where: h is the search radius; N is the number of variables; is the variable, and is the distance between any two points; The calculated result is the nuclear density of point .
Geographically Weighted Regression
Geographically Weighted Regression is a local linear regression method based on spatial change relationship modeling. It generates a regression model describing the local relationship in every part of the study area, which can well explain the local spatial relationship and spatial heterogeneity of variables.
where is the coordinates of sample point ; is the kth regression parameter at sample point I; and is the error correction term.
3. Results Analysis
3.1. Temporal Characteristics
RHCDI and Urban Air Quality
First, Jinan city was taken as an example, to analyze the time changes of traffic (RHCDI) and air quality (AQI) during the epidemic (January–April 2019 and 2020), as shown in Figure 3. Jinan is the capital of Shandong Province. It ranked first among the cities in rush hour congestion delay index for 2016–2018, and the air quality was poor.
Both AQI and CDI in Jinan were in a high level in phase I (only Wuhan city was affected), and both AQI and CDI had a big decline. CDI showed obvious cyclical changes (7 days). Weekdays were higher, weekends were lower, and Monday and Friday were slightly higher than the other working days except during holiday. COVID-19 altered these patterns, leading to low CDIs in Phase II. Except for the increase in CDI (1.35) caused by rain and snow on 6 February, the other time CDI was all below 1.2. After the return to worm (Phase III), CDI began to rise gradually, and the weekly fluctuation low of CDI recovered. The cyclical fluctuation of AQI is not obvious, but the values from Phase II to IV were far lower than that in Phase I. During phase II–IV, the peak of AQI almost corresponds to the peak of CDI due to the major human activities in time. Since 10 February, enterprises have resumed work and AQI has reached a peak; the highway toll stations closed due to the epidemic in the whole province and were all lifted from lockdown 21 February, AQI up to p peak; emergencies response level adjusted from Level I to Level II on 7 March, AQI peaked; on 30 April, Tomb Sweeping Day, peak; on 15 April, resume classes, peak; and on the eve of Labor Day, AQI peaked. When AQI reached its peak, CDI also reached its peak. That is, AQI was closely related to people’s activities (CDI) during the epidemic.
Then, we took Wuhan (COVID-19 outbreak) and Beijing (the capital of China, megacity) as examples for analysis. The CDI, PM2.5, and NO2 of Beijing and Wuhan, January–April 2019 and 2020 were shown in Figure 4A,B. Nationwide AQI and CDI were analyzed, and the average D-values of CDIs, PM2.5, and NO2 were shown in Figure 4C–E. We calculated the average values of CDIs, PM2.5, and NO2 during the four stages respectively.
Wuhan, where COVID-19 initially broke out, was sealed until 8 April 2020. From the mid-term phase I to phase III, the CDI of Wuhan was far below the level during the same period in 2019, especially in phases II and III (lockdown period) when it was stable at a very low level (<1.l). It began to gradually rise until phase IV (lift lockdown). PM2.5 and NO2 had the same trend with CDI, and the NO2 decreased significantly, but they were not as obvious as CDI. The trend of AQI and CDI over time in Beijing is basically the same with that in Jinan.
In phase I of 2020, except for Wuhan, CDI, PM2.5, and NO2 in most cities was basically unchanged compared with the same period in 2019, although there were some high and low levels. The average CDI of the top 100 cities in 2019 was only 0.049 higher than in 2020, and average NO2 of the top 100 cities with the worst air quality in 2020 decreased by 7.57 μg/m3, but the average PM2.5 showed a situation higher than that in 2019. During phase II (lockdown period, including Spring Festival), the CDI of all cities fell sharply, and the average CDI of the top 100 cities was only 1.14. PM2.5 and NO2 in major cities also dropped considerably, especially for NO2, which was far lower than in 2019 (PM2.5 and NO2 peaks occurred around 29 January and 12 February in Beijing; confirmed that haze during COVID-19 lockdown was driven by the enhancement of secondary pollution [30]). The average D-value of CDIs were 0.245 in phase II, while PM2.5 and NO2 decreased by 40.02 and 16.85 μg/m3, respectively. In phase III, as COVID-19 eased, the CDI of all cities showed steady recovery, although the CDIs were below the levels in 2019. The PM2.5 and NO2 of all cities were also lower than the levels during the same period in 2019. During phase IV, the social and economic activities had basically recovered, and the CDI, PM2.5, and NO2 of all cities basically recovered to the level of the same period in 2019. Some cities even showed levels higher than in 2019. In brief, although the trends of PM2.5 and NO2 were not as obvious as CDI, the trends of them were similar; that is, urban traffic operation still has a significant effect on regional air quality.
3.2. Spatial Characteristics of Traffic Congestion Cities and Cities with Poor Air Quality
The average AOD from January to April in 2019 is shown in Figure 5A,B as well as the results of the kernel density analysis of the top 100 cities for traffic congestion and the top 100 cities with the worst air quality.
For Moran index (or spatial autocorrelation index), when the value is greater than 0, this indicates a positive spatial correlation; the larger the value, the more obvious the spatial correlation. When Moran’s I is less than 0, there is a negative spatial correlation; the smaller the value, the greater the spatial difference. When Moran’s I is 0, the space is random) is used to measure to measure whether traffic congestion cities and cities with poor air quality are spatially correlated [27]. The values of Moran’s I of the top 100 cities for traffic congestion and the top 100 cities with the worst air quality were 0.28 and 0.16 respectively; that is, cities for traffic congestion and poor air quality indicated strong spatial dependence. Further, kernel density analysis was used to analyze the spatial cluster characteristics of these two types of cities, and Figure 5 shows the result of the kernel density analysis.
As shown in Figure 5A, the AOD values in the east areas of the Hu line were higher than the west, whereas east of the Hu line, which accounts for 94% of its national population, 93 of the top 100 cities for traffic congestion and 97 of the top 100 cities with the worst air quality. The AOD high value area of Xinjiang in the west of the Hu line was due to the impact of sandstorms. There were severe sandstorms on 29–31 January, 16–18 February, 16–19 March, and 21–25 March (from January to April in 2019), according to the meteorological information (http://www.weather.com.cn/ (accessed on 8 January 2023)).
As shown in Figure 5B, cities with traffic congestion formed two high-aggregation centers in the Yangtze River Delta and Pearl River Delta (two major economic development areas in China). Meanwhile, Beijing, Jinan, and other cities were closely connected with the Yangtze River Delta, and they shaped a long strip contact strips belt. A weak gathering center was formed in the Sichuan Basin. The 100 cities with the worst air quality have formed a large gathering center in the eastern land area, which was almost consistent with the gathering area of the Yangtze River Delta (including the formed belt area) formed by the traffic congestion cities. Sichuan Basin weak gathering center was also the same. However, they do not exactly correspond to each other. Especially in the center of the Pearl River Delta (composed of cities with traffic congestion), no city has entered the top 100 cities with the worst air quality. The cities in the Pearl River Delta are closest to the ocean, and the exchange of proximity to the land-sea process help to circulate air. Besides, there is no winter heating in southern China, so coal consumption is low.
As seen in Figure 4B and Figure 5A, the high value concentration areas of AOD in the east areas of the Hu line were consistent with the two gathering centers formed by cities with traffic congestion in space, and also consistent with the gathering center of cities with poor air quality. That is, the air quality is related to the local economy and transportation.
3.3. Spatial-Temporal Analysis
Remote sensing data can reflect the spatial distribution characteristics, and remote sensing data of time series can reflect the spatiotemporal changes of the research object. The AOD differences in between four phases were shown in Figure 6.
During Phases I (not yet affected by the epidemic), the AOD in 2020 in most areas east of the Hu Line was higher than that in 2019. From Phases II to Phases IV, AOD in 2020 was mostly lower than that in the same period in 2019 because of the reduction of human activities caused by the epidemic. Phase II was the period most affected by the epidemic, Wuhan lockdown, and the whole country was in isolation. The concentration area of AOD decline was consistent with the gathering center formed by cities with the worst air quality, as shown in Figure 6.
3.4. Quantitative Analysis Based on GWR
From the above analysis, there is a relationship between regional air quality and traffic. AOD has a strong correlation with regional air quality, and road network density is related to traffic flow and traffic congestion, which has been confirmed by many studies, so, AOD and road network density were selected to represent air quality and traffic respectively. GWR was used to quantitatively analyze the relationship between AOD and road network density. Average AODs from January to April in 2019 and 2020 and the road network density by province (excluding Taiwan Province) were separately modeled and used to build GWR model. The standard deviations of the AOD models constructed based on the in the study area are shown in Figure 7.
The square of correlation coefficient (R2) between AOD in 2019 and road network density based on GWR was 0.68, so, there is a strong correlation between the two, and the correlation relationship can be described by mathematical formula. The advantage of GWR over an ordinary regression model are that it can build a regression model for each sample. The positive coefficient represents a facilitating impact, and the negative means an inhibiting impact. The regression coefficient of the models based GWR in this paper was all positive, so the road network density had a facilitating impact on AOD.
The provinces with the high correlation and low correlation were shown in Figure 7. The provinces with the highest correlation between AOD and road network density were Heilongjiang, Jilin, Liaoning, Inner Mongolia, and the local R2 were all above 0.75, Hebei, Beijing and Tianjin were also above 0.6, and Shandong, Henan, Shanxi and other provinces located in the gathering centers formed by cities with the worst air quality were also above 0.5. The provinces with low correlation were Guangdong, Guangxi, Xinjiang, Hainan, Yunnan and Guizhou, and the local R2 were all below 0.15. These provinces were not suitable for the correlation analysis between road network and air quality.
The R2 between AOD in 2020 and road network density based on GWR was 0.61, and the provinces with the high correlation and low correlation in 2020 were almost similar to that in 2019.
4. Discussion
In this study, there are still many problems and uncertainty in quantifying the effect of transportation on regional air quality.
Transportation is a very complex system affected by many factors, and traffic operation is a very complex system with many influencing factors. CDI and road network density were used to reflect traffic operation in this study. Although CDI can reflect the situations of traffic congestion and traffic operation, road density is also closely related to traffic flow, and AOD is also strongly related to regional air quality; after all, there were certain differences which can affect the accuracy of research results, but it is difficult to quantify the effect. Air quality is also a very complex system affected by many factors such as weather, terrain, emissions pollutants, secondary reaction of air pollutants, etc. For example, during the COVID-19 lockdown, heavy air pollution events still occurred in Beijing on 11–13 February 2020 in Beijing. It was confirmed that this was driven by the enhancement of secondary pollution, and the benefits of emission reductions were overwhelmed by adverse meteorology [28]. Therefore, there are many uncertain factors for two complex systems when analyzing the impact of traffic on air quality.
In addition, the AOD data are commonly missing on days with heavy pollution or very little pollution, and the missing data affect the accuracy of analysis. For instance, there is a serious lack of AOD data (no valid value) in parts of Qinghai, Tibet, Xinjiang and other provinces. The missing data rate of the synthesized AOD monthly product from January–April 2019 was still 14.5%, and the most missing data rate of daily product in 2019 was up to 44.87%. The retrieval algorithm of AOD was improved from “dark target method” and “dark blue algorithm” to MAIAC (multi-angle implementation of atmospheric correction algorithm), and the space resolution was improved from 10 km, 3 km to 1 km, but the algorithm and resolution of remote sensing retrieval AOD need further improvement [52,53]. Although remote sensing data can retrieve the spatial distribution characteristics of the AOD (air pollution) well, as it is instantaneous data, it can only represent the spatial distribution of the satellite transit time. However, the AOD and traffic emissions are always changing, so the AOD retrieved by remote sensing has the problem of time scale deduction.
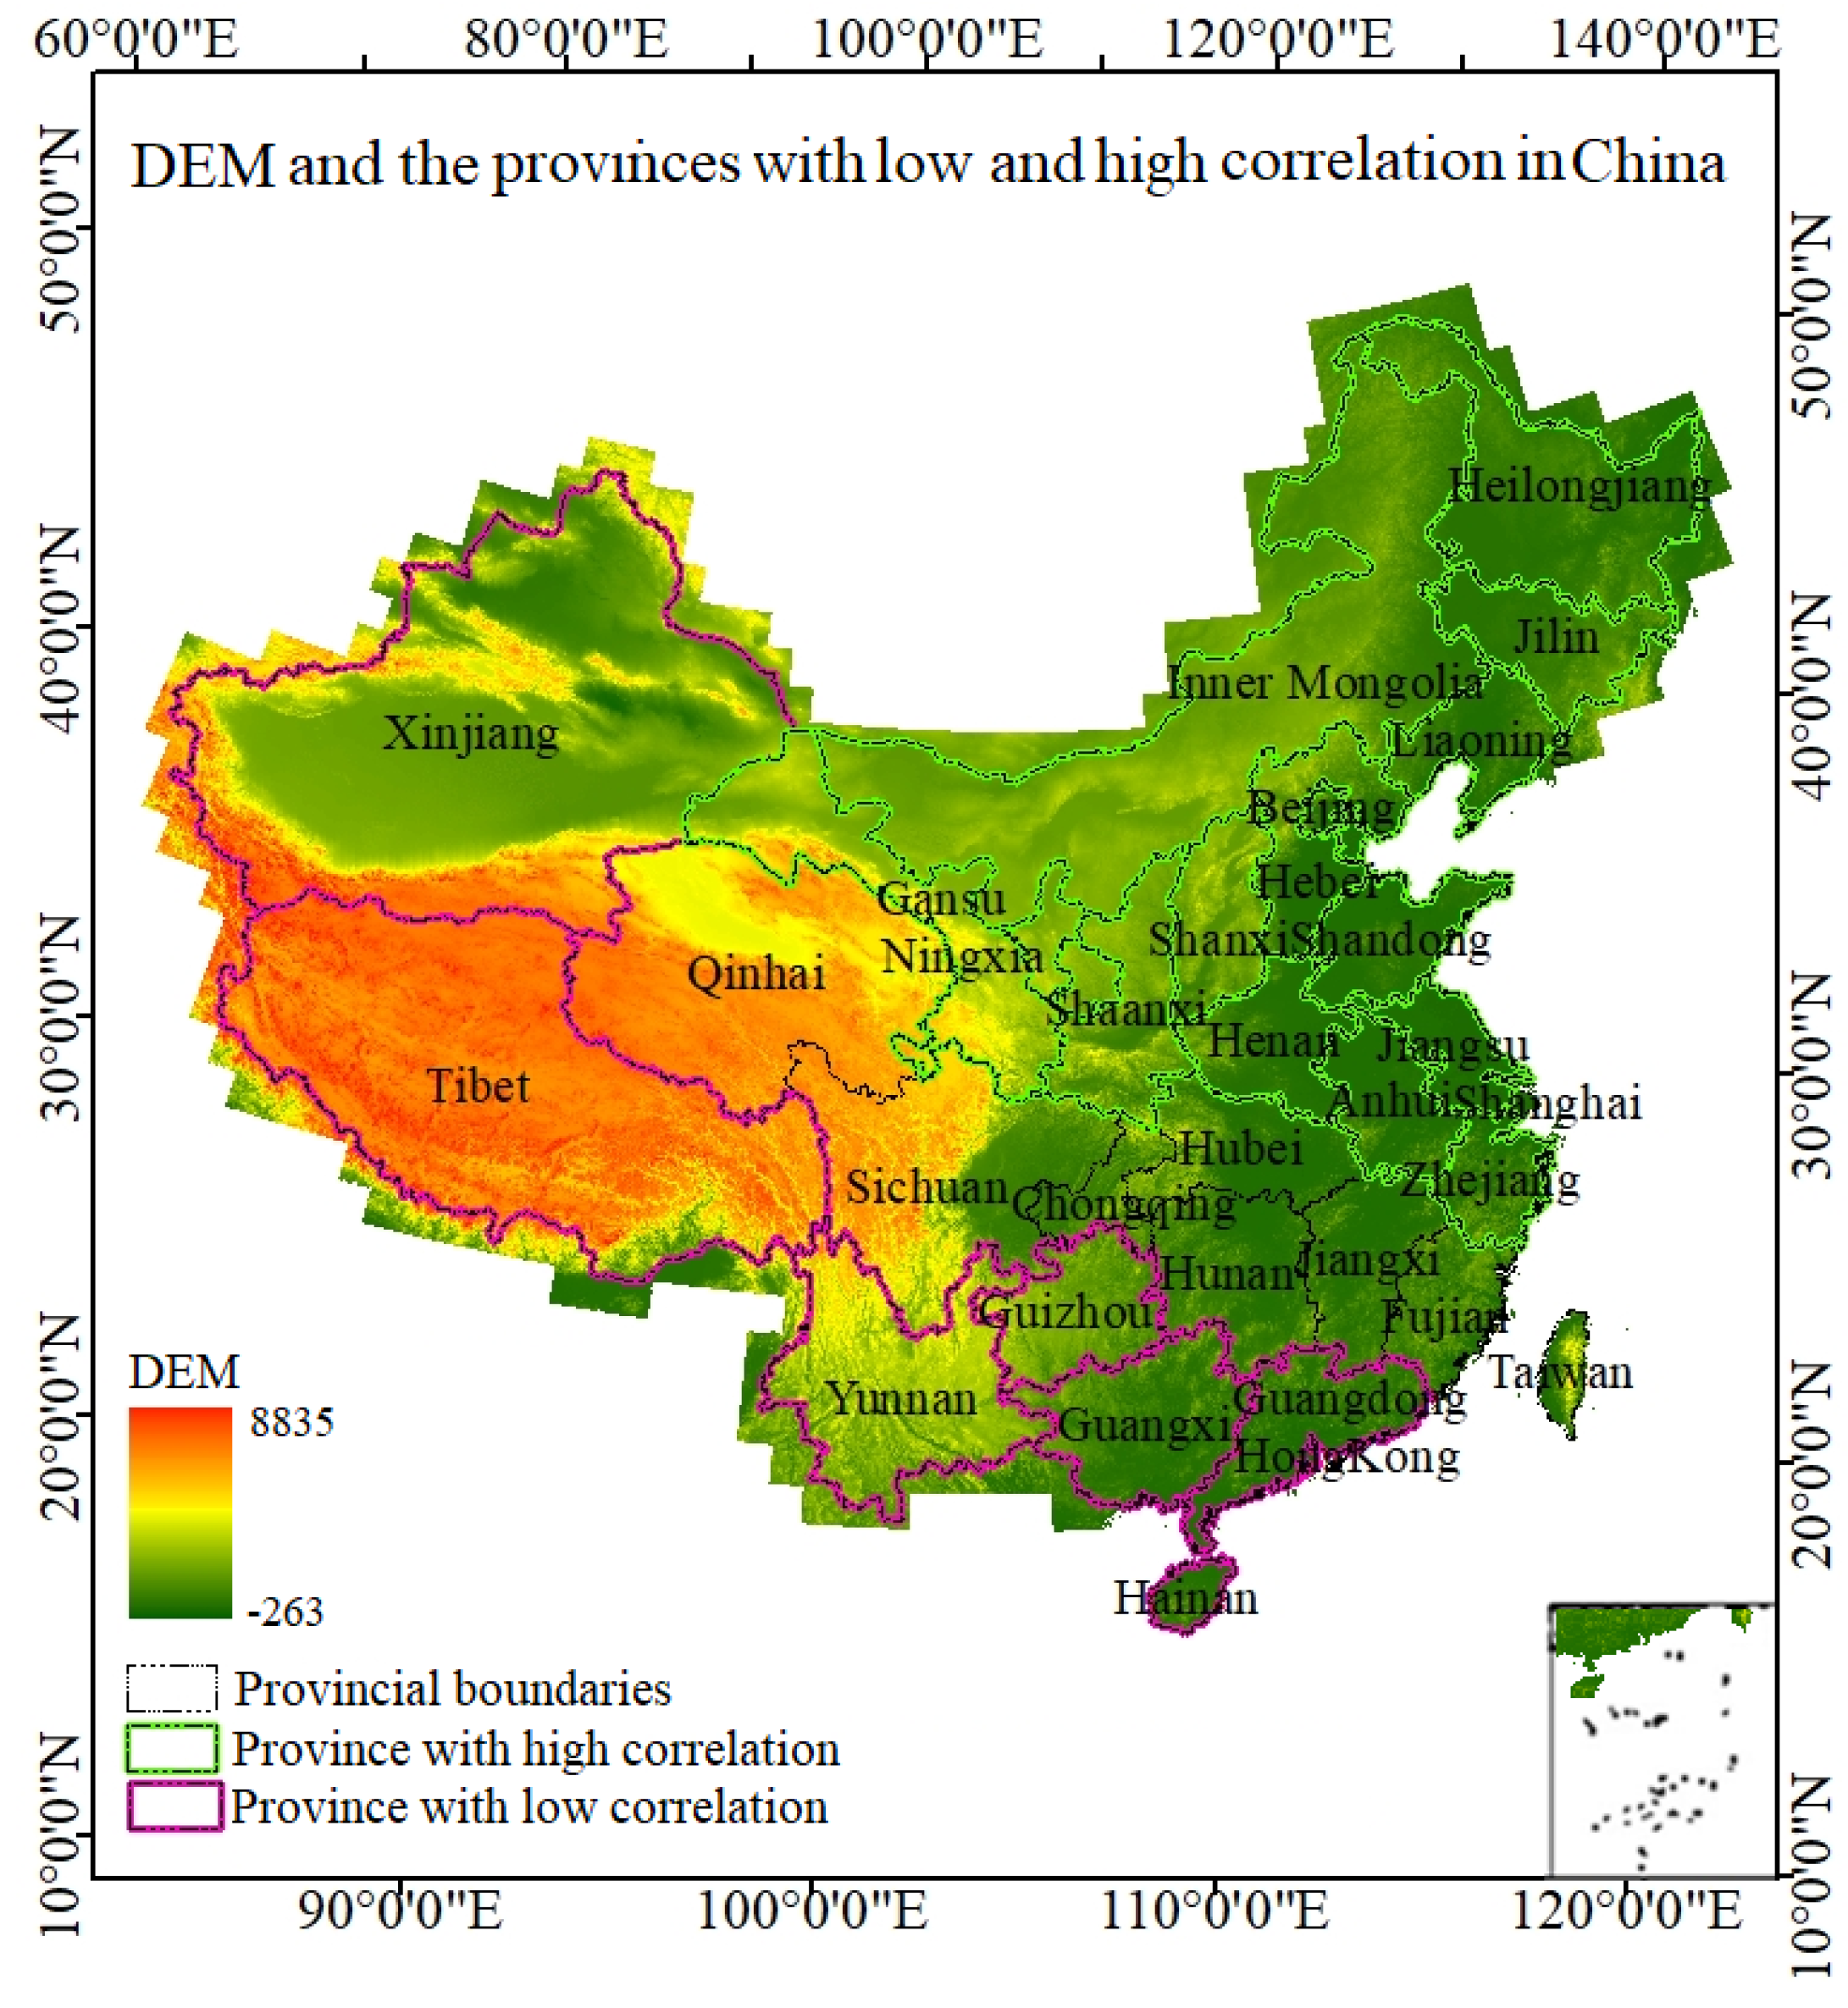
These provinces with low correlation can be divided into two classes, one was close to the sea, such as Hainan and Guangdong, and the other was undulate terrain, such as Yunnan, Guizhou, and Xinjiang. Regional air quality is a very complex system effected by many factors, especially the meteorology factor. As a ligament connect between land and sea, coastal areas have frequent exchanges between land and sea and the active weather, which causes the effect of a reduction of traffic on air quality. As shown in Figure 8, the DEM of Tibet, Xinjiang, Yunnan and Guizhou are all high, and these provinces were located in Qinghai-Tibet Plateau and Yunnan- Guizhou Plateau. The surface conditions in undulate terrain are complex, which not only cause the accuracy reduction of remote sensing retrieval AOD (that were confirmed in China [54,55,56], East Asia, central Asia [57], the European Alpine region [58]), but also result in the decline of the calculation accuracy of the road network.
Quantifying the effect of traffic operation condition on regional air quality can provide the ground for managers to formulate traffic management policies and regional air quality control measures [59,60,61]. For instance, if the air quality in the A region attempts to be controlled at the Y level, according to the constructed GWR model, the road network density in the A region should be approximately X. Compared with the currently road network density Z, reasonable planning of regional road network will be made. The decision making on traffic management-control solutions and emission reduction measures can consult the results of the model and CDI, which is of great significance to regional sustainable development.
5. Conclusions
This study quantified the effect of traffic operation on air quality by spatial and temporal analysis based on MODIS AOD and traffic data. The main research conclusions are as follows: The epidemic has a great impact on traffic and regional air quality. PM2.5 and NO2 (air quality) had the same trend with CDI (traffic congestion) in time, and the peak of AQI almost corresponds to the peak of CDI due to the major human activities during epidemic phases II–IV. In space, the concentration areas of high AOD value were consistent with the two gathering centers formed by cities with traffic congestion and the gathering center of cities with poor air quality. The concentration area of AOD decline was also consistent with the gathering center formed by cities with the worst air quality in space. AOD had a strong positive correlation with road network density, and the correlation coefficient it was based on was 0.68. Those provinces suitable for GWR or not suitable were divided. This study has a great significance to the transportation planning, regional planning and air quality control strategies and regional sustainable development, etc.
Author Contributions
H.F., Writing and Methodology; Z.W., validation; X.L., methodology and modification; H.X., Data curation; Q.J., modification; X.W., investigation; M.Z., data processing. All authors have read and agreed to the published version of the manuscript.
Funding
This research was by National Natural Science Foundation of China, the funding number 52102412; Natural Foundation of Shandong Province, the funding number ZR2022MG077; and Project of Jinan Municipal Bureau of science and Technology, the funding number 2019GXRC022, Strategic Research and Consulting Project of Chinese Academy of Engineering, the funding number 2022NXZD.
Institutional Review Board Statement
This study did not require ethical approval.
Data Availability Statement
The data links used in this paper had been listed.
Acknowledgments
The authors acknowledge the NASA Earth Science Division for the free use of tropospheric MODIS sensor and the ground-based data from Ministry of Environmental Protection of the People’s Republic of China. We thank LetPub (www.letpub.com (accessed on 8 January 2023)) for its linguistic assistance during the preparation of this manuscript.
Conflicts of Interest
The authors declare no conflict of interest.
References
- Abdull, N.; Yoneda, M.; Shimada, Y. Traffic characteristics and pollutant emission from road transport in urban area. Air Qual. Atmos. Health 2020, 13, 731–738. [Google Scholar] [CrossRef]
- Oishi, R.; Imai, Y.; Ikemori, F.; Ohura, T. Traffic source impacts on chlorinated polycyclic aromatic hydrocarbons in PM2.5 by short-range transport. Atmos. Environ. 2019, 216, 116944. [Google Scholar] [CrossRef]
- Lv, C. Research on High Resolution Transport Carbon Emission Inventory and Analysis of Low Carbon Development Scenario in Beijing; Beijing University of Technology: Beijing, China, 2020. [Google Scholar]
- Wang, Q.; Feng, H.X.; Feng, H.Y.; Yu, Y.; Li, J.; Ning, E.W. The impacts of road traffic on urban air quality in Jinan based GWR and remote sensing. Sci. Rep. 2021, 11, 15512. [Google Scholar] [CrossRef] [PubMed]
- Lima, M.A.; Sthel, M.S. Emission of air pollution in the transport sector: Case study of the city of campos dos goytacazes, Brazil. Engineering 2020, 12, 851–862. [Google Scholar] [CrossRef]
- Li, Z.; Fung, J.C.H.; Lau, A.K.H. High spatiotemporal characterization of on-road PM 2.5 concentrations in high-density urban areas using mobile monitoring. Build. Environ. 2018, 143, 196–205. [Google Scholar] [CrossRef]
- Pathak, A.K.; Sharma, M.; Nagar, P.K. A framework for PM2.5 constituents-based (including PAHs) emission inventory and source toxicity for priority controls: A case study of Delhi, India. Chemosphere 2020, 255, 126971. [Google Scholar] [CrossRef]
- Jeong, C.H.; Wang, J.M.; Hilker, N.; Debosz, J.; Sofowote, U.; Su, Y.; Noble, M.; Healy, R.M.; Munoz, T.; Dabek-Zlotorzynska, E.; et al. Temporal and spatial variability of traffic-related PM(2.5) sources: Comparison of exhaust and non-exhaust emissions. Atmos. Environ. 2019, 198, 55–69. [Google Scholar] [CrossRef]
- Monteiro, A.; Durka, P.; Flandorfer, C.; Georgieva, E.; Guerreiro, C.; Kushta, J.; Malherbe, L.; Maiheu, B.; Miranda, A.I.; Stocker, J.; et al. Strengths and weaknesses of the FAIRMODE benchmarking methodology for the evaluation of air quality models. Air Qual. Atmos. Health 2018, 11, 373–383. [Google Scholar] [CrossRef]
- Ramacher, M.; Matthias, V.; Aulinger, A.; Quante, M.; Bieser, J.; Karl, M. Contributions of traffic and shipping emissions to city-scale NOx and PM2.5 exposure in Hamburg. Atmos. Environ. 2020, 237, 117674. [Google Scholar] [CrossRef]
- Mangones, S.C.; Jaramillo, P.; Rojas, N.Y.; Fischbeck, P. Air pollution emission effects of changes in transport supply: The case of Bogotá, Colombia. Environ. Sci. Pollut. Res. 2020, 27, 35971–35978. [Google Scholar] [CrossRef]
- Russo, F.; Villani, M.G.; D’Elia, H.; D’Isidoro, M.; Liberto, C.; Piersanti, A.; Tinarelli, G.; Valenti, G.; Ciancarella, L. A study of traffic emissions based on floating car data for urban scale air quality applications. Atmosphere 2021, 12, 1064. [Google Scholar] [CrossRef]
- Altintasi, O.; Tuydes-Yaman, H.; Tuncay, K. Monitoring urban traffic from floating car data (FCD): Using speed or a los-based state measure. In Scientific and Technical Conference Transport Systems Theory and Practice; Springer: Cham, Switzerland, 2018; pp. 163–173. [Google Scholar] [CrossRef]
- Cárdenas-Benítez, N.; Aquino-Santos, R.; Magaña-Espinoza, P.; Aguilar-Velazco, J.; Edwards-Block, A.; Cass, A.M. Traffic congestion detection system through connected vehicles and big data. Sensors 2016, 16, 599–625. [Google Scholar] [CrossRef]
- Chen, F.X.; Yin, Z.W.; Ye, Y.W.; Sun, D. Taxi hailing choice behavior and economic benefit analysis of emission reduction based on multi-mode travel big data. Transp. Policy 2020, 97, 73–84. [Google Scholar] [CrossRef]
- Qin, Y.N.; Yang, H.L.; Guo, M.J.; Guo, M.C. An Advanced data science model based on big data analytics for urban driving cycle construction in China. In Proceedings of the 2020 International Conference on Computing, Networks and Internet of Things, Sanya, China, 24–26 April 2020; pp. 1–7. [Google Scholar] [CrossRef]
- Hu, Y.H.; Yan, Q.Y. Response to Carbon emission flow from self-driving tours and its spatial relationship with scenic spots—A traffic-related big data method. J. Clean. Prod. 2019, 247, 119540. [Google Scholar] [CrossRef]
- Wang, L.; Chen, C.; Xie, F.; Hu, Z.; Zhang, Z.; Chen, H.; He, X.; Chu, Y. Estimation of the value of regional ecosystem services of an archipelago using satellite remote sensing technology: A case study of Zhoushan Archipelago, China. Int. J. Appl. Earth Obs. Geoinf. 2021, 105, 102616. [Google Scholar] [CrossRef]
- Chen, C.; Liang, J.; Xie, F.; Hu, Z.; Sun, W.; Yang, G.; Yu, J.; Chen, L.; Wang, L.H.; Wang, L.Y.; et al. Temporal and spatial variation of coastline using remote sensing images for Zhoushan archipelago, China. Int. J. Appl. Earth Obs. Geoinf. 2022, 107, 102711. [Google Scholar] [CrossRef]
- Chen, L.F.; Tao, J.H.; Wang, Z.F.; Li, S.S.; Zhang, Y.; Fan, M.; Li, X.Y.; Yu, C.; Zou, M.M.; Su, L.; et al. Review of Satellite Remote Sensing of Air Quality. J. Atmos. Environ. Opt. 2015, 10, 117. [Google Scholar] [CrossRef]
- Tao, J.H.; Zhang, M.G.; Chen, L.F.; Wang, Z.F.; Su, L.; Ge, C.; Han, X.; Zou, M.M. Method to estimate concentration of surface-level particulate matter from satellite-based aerosol optical thickness. Sci. China: Earth Sci. 2013, 56, 1422–1433. [Google Scholar] [CrossRef]
- Wei, J.; Li, Z.Q.; Lyapustin, A. Reconstructing 1-km-resolution high-quality PM 2.5 data records from 2000 to 2018 in China: Spatiotemporal variations and policy implications. Remote Sens. Environ. 2021, 252, 112136. [Google Scholar] [CrossRef]
- Sathe, Y.; Kulkarni, S.; Gupta, P.; Kaginalkar, A.; Islam, S.; Gargava, P. Resolution Imaging Spectroradiometer (MODIS) Aerosol Optical Depth (AOD) and Weather Research Forecasting (WRF) model meteorological data for assessment of fine particulate matter (PM2.5) over India—ScienceDirect. Atmos. Pollut. Res. 2019, 10, 418–434. [Google Scholar] [CrossRef]
- Aletta, F.; Brinchi, S.; Carrese, S.; Gemma, A.; Guattari, C.; Mannini, L.; Patella, M. Analysing urban traffic volumes and mapping noise emissions in Rome (Italy) in the context of containment measures for the COVID-19 disease. Noise Mapp. 2020, 7, 114–122. [Google Scholar] [CrossRef]
- Wang, J.B.; Yang, X.S.; Yu, S.C.; Yuan, Q.; Lian, Z.T.; Yang, Q.L. Road crash risk prediction during COVID-19 for flash crowd traffic prevention: The case of Los Angeles. Comput. Commun. 2023, 198, 195–205. [Google Scholar] [CrossRef] [PubMed]
- Lee, H.; Park, S.J.; Lee, G.R.; Kim, J.E.; Lee, J.H.; Jung, Y.; Nam, E.W. The relationship between trends in COVID-19 prevalence and traffic levels in South Korea. Int. J. Infect. Dis. 2020, 96, 399–407. [Google Scholar] [CrossRef] [PubMed]
- Le, T.; Wang, Y.; Liu, L.; Yang, J.; Yung, Y.L.; Li, G.H.; Seinfeld, J.H. Unexpected air pollution with marked emission reductions during the COVID-19 outbreak in China. Science 2020, 369, eabb7431. [Google Scholar] [CrossRef] [PubMed]
- Tian, H.; Liu, Y.; Li, Y.; Wu, C.H.; Chen, B.; Kraemer, M.G.; Li, B.Y.; Cai, J.; Xu, B.; Yang, Q. An investigation of transmission control measures during the first 50 days of the COVID-19 epidemic in China. Science 2020, 368, 638–642. [Google Scholar] [CrossRef] [Green Version]
- Shi, X.; Brasseur, G.P. The Response in Air Quality to the Reduction of Chinese Economic Activities during the COVID Outbreak. Geophys. Res. Lett. 2020, 47, e2020GL088070. [Google Scholar] [CrossRef] [PubMed]
- Wang, P.; Chen, K.; Zhu, S.; Wang, P.; Zhang, H.L. Severe air pollution events not avoided by reduced anthropogenic activities during COVID-19 outbreak. Resour. Conserv. Recycl. 2020, 158, 104814. [Google Scholar] [CrossRef]
- Yan, X.; Shi, A.; Cao, J.; Li, T.T.; Sun, X.S.; Zhang, R.; Qiu, X.H.; Li, Y.X.; Liang, M.; Lv, M.; et al. The Occurrence of Heavy Air Pollution during the COVID-19 Outbreak in Beijing, China: Roles of Emission Reduction, Meteorological Conditions, and Regional Transport. Sustainability 2021, 13, 12312. [Google Scholar] [CrossRef]
- Tyagi, B.; Choudhury, G.; Vissa, N.K.; Singh, J.; Tesche, M. Changing Air Pollution Scenario During COVID-19: Redefining the Hotspot Regions over India. Environ. Pollut. 2020, 271, 116354. [Google Scholar] [CrossRef]
- Singh, V.; Singh, S.; Biswal, A.; Kesarkar, A.P.; Mor, S.; Ravindra, K. Diurnal and temporal changes in air pollution during COVID-19 strict lockdown over different regions of India. Environ. Pollut. 2020, 266, 115368. [Google Scholar] [CrossRef]
- Zalakeviciute, R.; Vasquez, R.; Bayas, D.; Buenano, A.; Mejia, D.; Zegarra, R.; Diaz, V.; Lamb, B. Drastic Improvements in Air Quality in Ecuador during the COVID-19 Outbreak. Aerosol Air Qual. Res. 2020, 20, 1783–1792. [Google Scholar] [CrossRef]
- Lorenzo-Sáez, E.; Coll-Aliaga, E.; Oliver-Villanueva, J.V.; Campo, F.P.F.; Lerma-Arce, V. Analysis of the COVID-19 Lockdown’s Impact on Air Quality in the Larger Cities of Spain. Sustainability 2022, 14, 5613. [Google Scholar] [CrossRef]
- Mashayekhi, R.; Pavlovic, R.; Racine, J.; Moran, M.D.; Mashayekhi, R.; Pavlovic, R.; Racine, J.; Manseau, A.D.; Katal, A.; Miville, I. Isolating the impact of COVID-19 lockdown measures on urban air quality in Canada. Air Qual. Atmos. Health 2021, 14, 1549–1570. [Google Scholar] [CrossRef] [PubMed]
- Ginzburg, A.S.; Semenov, V.A.; Semutnikova, E.G.; Aleshina, M.A.; Zakharova, P.V.; Lezina, E.A. Impact of COVID-19 Lockdown on Air Quality in Moscow. Doklady Earth Sci. 2020, 495, 862–866. [Google Scholar] [CrossRef]
- Kenawy, A.; Juan, I.L.; Mccabe, M.F.; Domínguez-Castro, F.; Peña-Angulo, D.; Gaber, I.M.; Alqasemi, A.S.; Kindi, K.M.A.; Al-Awadhi, T.; Hereher, M.E.; et al. The impact of COVID-19 lockdowns on surface urban heat island changes and air-quality improvements across 21 major cities in the Middle East. Environ. Pollut. 2021, 288, 117802. [Google Scholar] [CrossRef]
- Bauwens, M.; Compernolle, S.; Stavrakou, T.; Müller, J.-F.; Gent, J.V.; Eskes, H.; Levelt, P.F.; Van der A, R.; Veefkind, J.P.; Vlietinck, J.; et al. Impact of coronavirus outbreak on NO2 pollution assessed using TROPOMI and OMI observations. Geophys. Res. Lett. 2020, 47, e2020GL087978. [Google Scholar] [CrossRef] [PubMed]
- Kaloni, D.; Lee, Y.H.; Dev, S. Impact of COVID19-induced Lockdown on Air Quality in Ireland. In Proceedings of the 2021 IEEE International Geoscience and Remote Sensing Symposium IGARSS, Brussels, Belgium, 11–16 July 2021; pp. 8372–8375. [Google Scholar] [CrossRef]
- Nichol, J.E.; Bilal, M.; Ali, A.M.; Qiu, Z.F. Air Pollution Scenario over China during COVID-19. Remote Sens. 2020, 12, 2100. [Google Scholar] [CrossRef]
- Chen, Z.F.; Hao, X.Y.; Zhang, X.Y.; Chen, F.L. Have traffic restrictions improved air quality? A shock from COVID-19. J. Clean. Prod. 2021, 279, 123622. [Google Scholar] [CrossRef] [PubMed]
- Wu, C.L.; Wang, H.W.; Cai, W.J.; He, H.D.; Ni, A.N.; Peng, Z.R. Impact of the COVID-19 lockdown on roadside traffic-related air pollution in Shanghai, China. Build. Environ. 2021, 194, 107718. [Google Scholar] [CrossRef]
- Gao, C.C..; Li, S.H..; Liu, M.; Zhang, F.Y.; Achal, V.; Tu, Y.; Zhang, S.Q.; Cai, C.L. Impact of the COVID-19 pandemic on air pollution in Chinese megacities from the perspective of traffic volume and meteorological factors. Sci. Total Environ. 2021, 773, 145545. [Google Scholar] [CrossRef]
- Jia, C.Y.; Li, W.D.; Wu, T.C.; He, M. Road traffic and air pollution: Evidence from a nationwide traffic control during coronavirus disease 2019 outbreak. Sci. Total Environ. 2021, 781, 146618. [Google Scholar] [CrossRef] [PubMed]
- Lipsitt, J.; Chan-Golston, A.M.; Liu, J.; Su, J.; Zhu, Y.F.; Jerrett, M. Spatial analysis of COVID-19 and traffic-related Air Pollution in Los Angeles. Environ. Int. 2021, 153, 106531. [Google Scholar] [CrossRef]
- Ghiasi, B.; Alisoltani, T.; Jalali, F.; Tahsinpour, H. Effect of COVID-19 on transportation air pollution by moderation and mediation analysis in Queens, New York. Air Quality Atmos. Health 2022, 15, 289–297. [Google Scholar] [CrossRef]
- Ahin, L.A. The Effects of COVID-19 Measures on Air Pollutant Concentrations at Urban and Traffic Sites in Istanbul. Aerosol Air Qual. Res. 2020, 20, 1874–1885. [Google Scholar] [CrossRef]
- Górka-Kostrubiec, B.; Dudzisz, K. Effect of COVID-19 pandemic restrictions on air pollution at a local scale in urban areas affected by high-intensity vehicle traffic in Poland. Atmos. Space Sci. 2022, 71, 1085–1097. [Google Scholar] [CrossRef]
- Xiang, J.B.; Austin, E.; Gould, T. Impacts of the COVID-19 responses on traffic-related air pollution in a Northwestern US city. Science 2020, 747, 141325. [Google Scholar] [CrossRef]
- Rossi, R.; Ceccato, R.; Gastaldi, M. Effect of Road Traffic on Air Pollution. Experimental Evidence from COVID-19 Lockdown. Sustainability 2020, 12, 8984. [Google Scholar] [CrossRef]
- Lyapustin, A.; Wang, Y.; Laszlo, I.; Kahn, R.; Korkin, S.; Remer, L.; Levy, R.; Reid, J.S. Multiangle implementation of atmospheric correction (MAIAC): 2. Aerosol algorithm. J. Geophys. Res. Atmos. 2011, 116, 14986. [Google Scholar] [CrossRef]
- Chen, Z.Y.; Jin, J.Q.; Zhang, R.; Zhang, T.H.; Chen, J.J.; Yang, J.; Ou, C.Q.; Guo, Y.M. Comparison of different missing-imputation methods for MAIAC (Multiangle Implementation of Atmospheric Correction) AOD in estimating daily PM2.5 Levels. Remote Sens. 2020, 12, 3008. [Google Scholar] [CrossRef]
- Wang, Z.B.; Zou, B.; Qiu, Y.H.; Chen, J.W. Geographical characterization of relationship between aerosol optical depth and PM(2.5) in China. Remote Sens. Inf. 2016, 31, 26–35. [Google Scholar]
- Wei, H.N.; Liang, B.P.; Zhong, S. Analysis of Temporal and Spatial Distribution and Variation Characteristics of Aerosol in Guilin Based on the MODIS Data. Adm. Tech. Environ. Monit. 2018, 30, 16–21. [Google Scholar]
- Chen, H.; Chen, C.; Zhang, Z.; Lu, C.; Wang, L.Y.; He, X.Y.; Chu, Y.L.; Chen, J.Y. Changes of the spatial and temporal characteristics of land-use landscape patterns using multi-temporal Landsat satellite data: A case study of Zhoushan Island, China. Ocean. Coast. Manag. 2021, 213, 105842. [Google Scholar] [CrossRef]
- Wang, P.; Tang, Q.X.; Zhu, Y.X.; Zheng, K.; Liang, T.Q.; Yu, Q.Z.; He, Y.Q. Validation and Analysis of MAIAC AOD Aerosol Products in East Asia from 2011 to 2020. Remote. Sens. 2022, 14, 5735. [Google Scholar] [CrossRef]
- Liu, J.; Ding, J.L.; Li, L.; Li, X.H.; Zhang, Z.; Ran, S.; Ge, X.Y.; Zhang, J.Y.; Wang, J.Z. Characteristics of aerosol optical depth over land types in central Asia. Sci. Total Environ. 2020, 727, 138676. [Google Scholar] [CrossRef]
- Emili, E.; Popp, C.; Petitta, M.; Riffler, M.; Wunderle, S.; Zebisch, M. PM10 remote sensing from geostationary SEVIRI and polar-orbiting MODIS sensors over the complex terrain of the European Alpine region. Remote Sens. Environ. 2010, 114, 2485–2499. [Google Scholar] [CrossRef]
- Chen, C.; Chen, H.; Liang, J.; Huang, W.; Xu, W.; Li, B.; Wang, J. Extraction of water body information from remote sensing imagery while considering greenness and wetness based on Tasseled Cap transformation. Remote Sens. 2022, 14, 3001. [Google Scholar] [CrossRef]
- Zou, Z.; Chen, C.; Liu, Z.; Zhang, Z.; Liang, J.; Chen, H.; Wang, L. Extraction of Aquaculture Ponds along Coastal Region Using U2-Net Deep Learning Model from Remote Sensing Images. Remote Sens. 2022, 14, 4001. [Google Scholar] [CrossRef]
Figure 1.
The top 100 cities for traffic congestion and cities with the worst air quality. The base map is the population density map for China in 2015 (https://www.resdc.cn/DOI/DOI.aspx?DOIid=33 (accessed on 8 January 2023)), and 93 of the top 100 cities for traffic congestion and 97 of the top 100 cities with the worst air quality in 2020 were located east of the Hu line; that is, almost all cities with heavy traffic or poor air quality are located in economically developed areas.

Figure 2.
Air quality data for Wuhan from January–April 2019 and January–April 2020. AQI, PM2.5, and PM10 had almost the same variation trends.
Figure 2.
Air quality data for Wuhan from January–April 2019 and January–April 2020. AQI, PM2.5, and PM10 had almost the same variation trends.
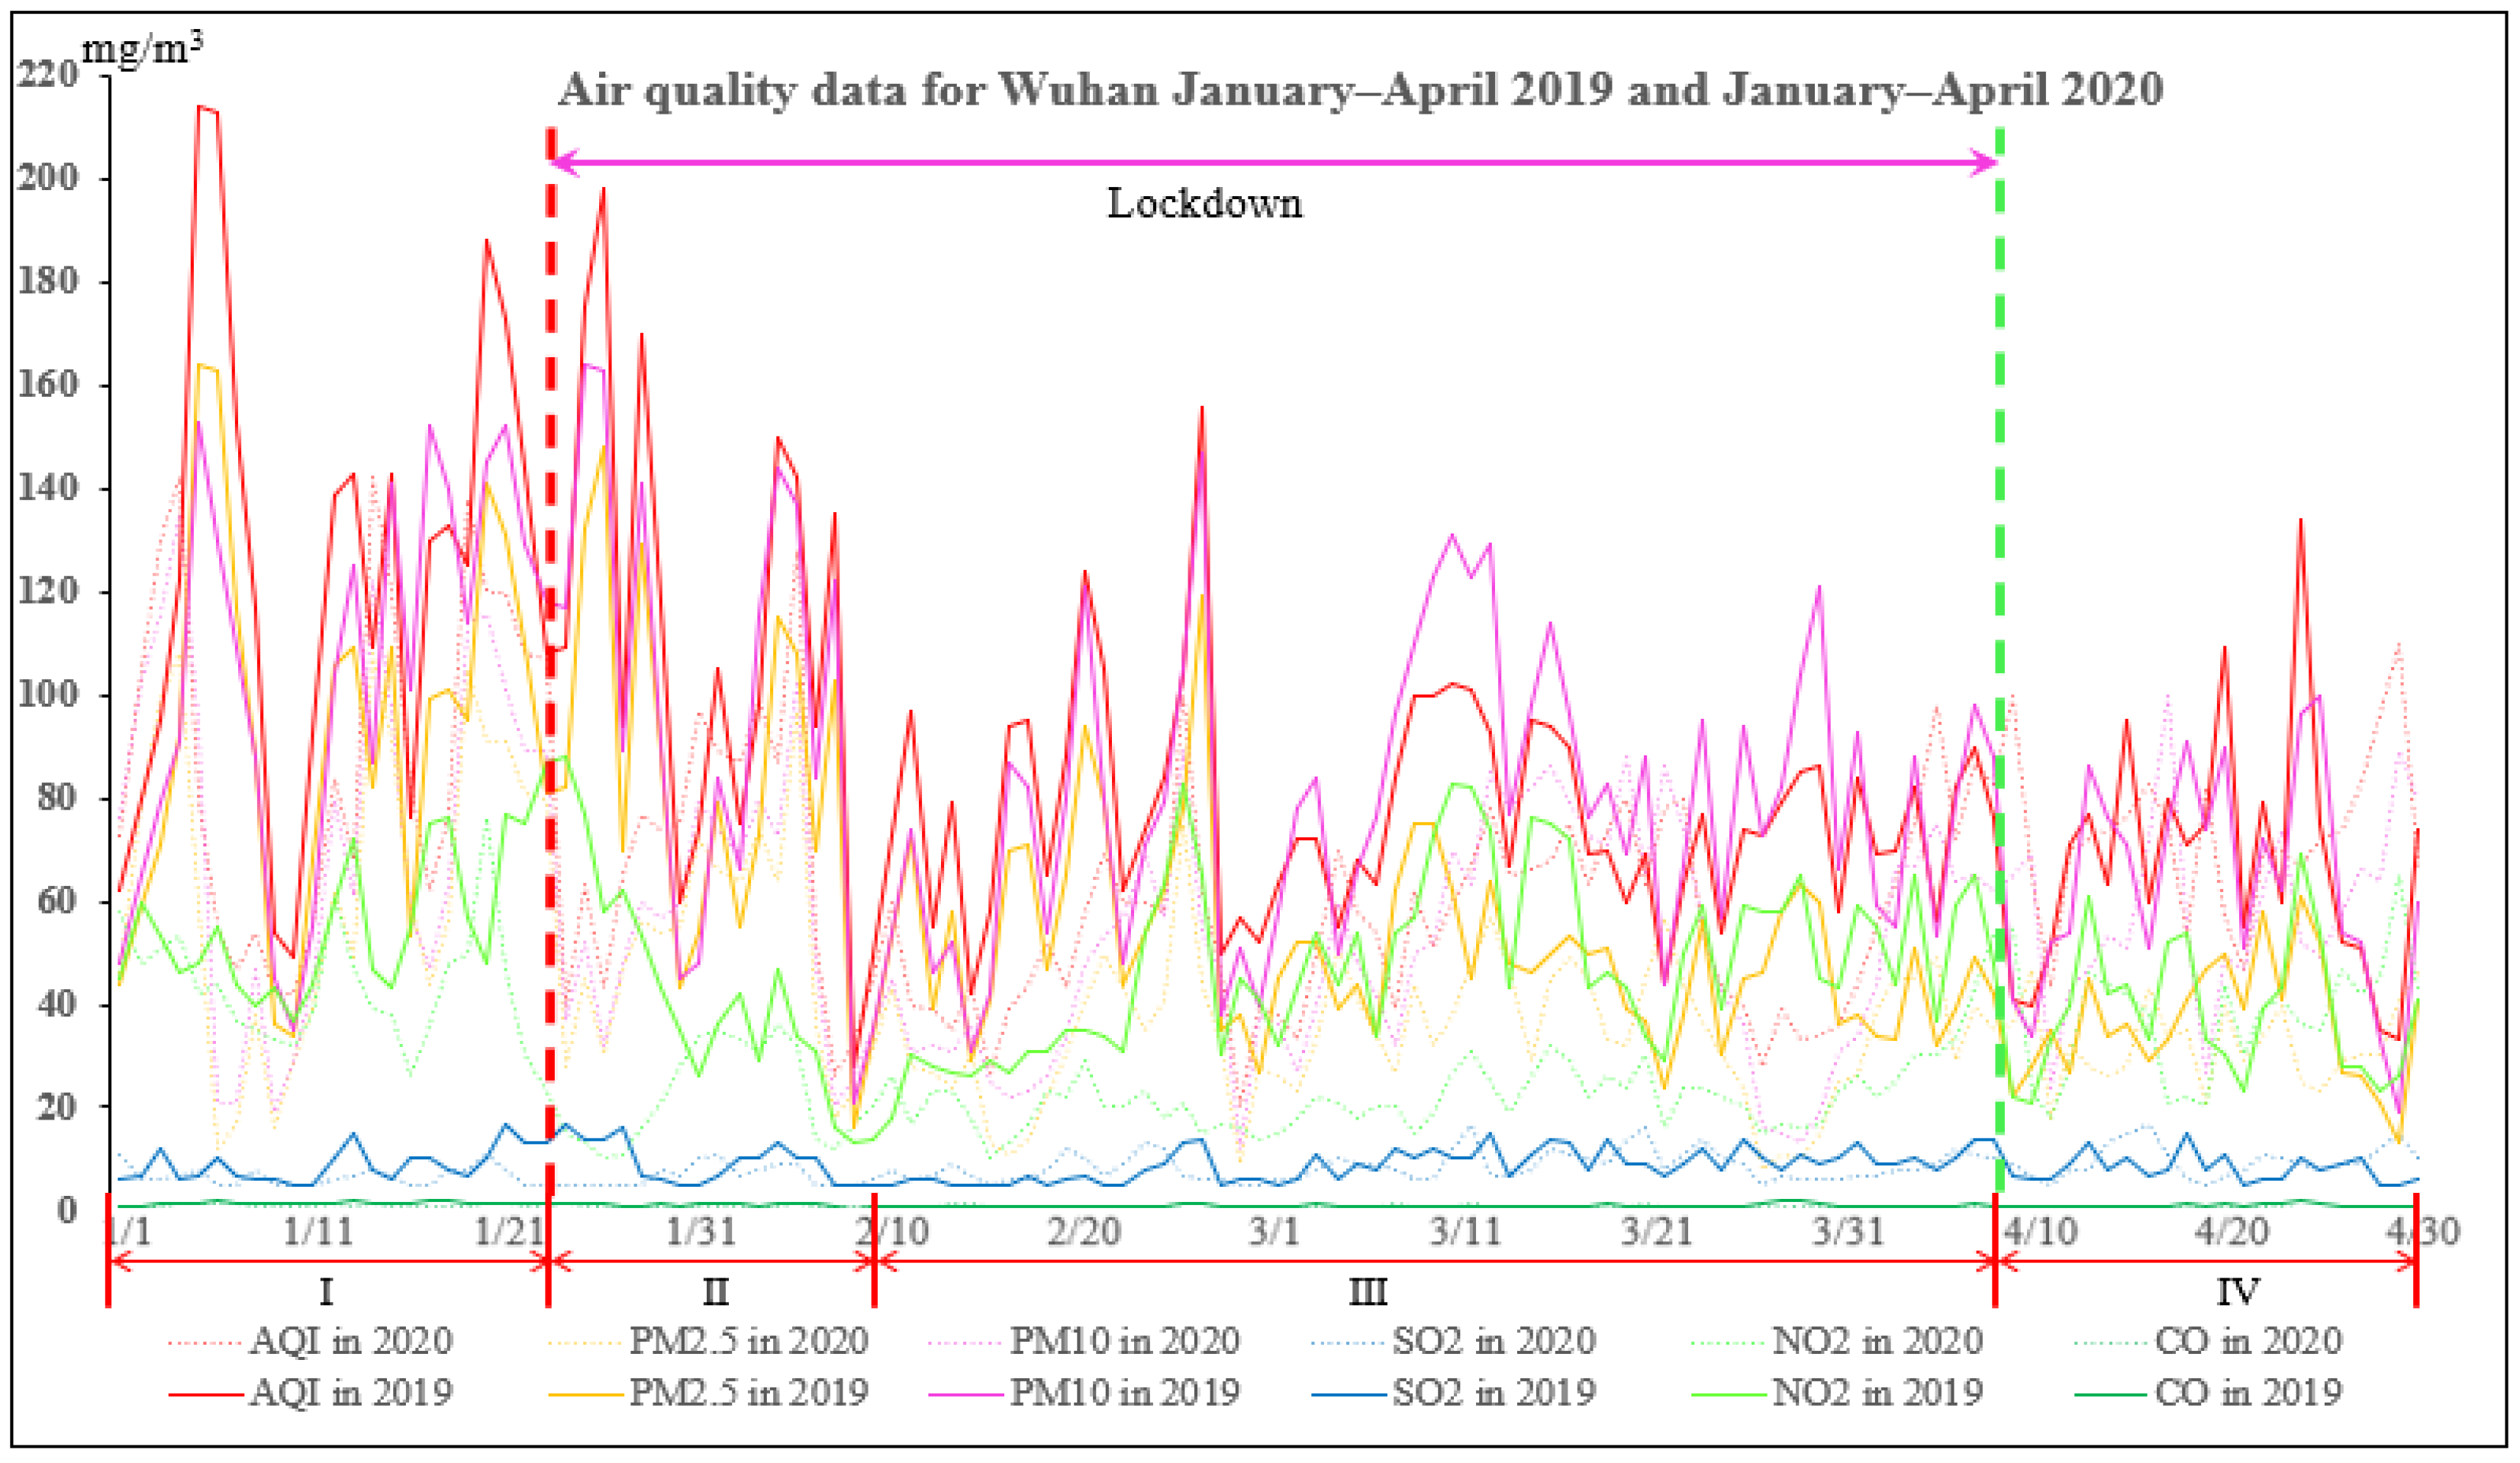
Figure 3.
The peak of AQI almost corresponds to the peak of CDI due to the major human activities during phase II–IV.
Figure 3.
The peak of AQI almost corresponds to the peak of CDI due to the major human activities during phase II–IV.
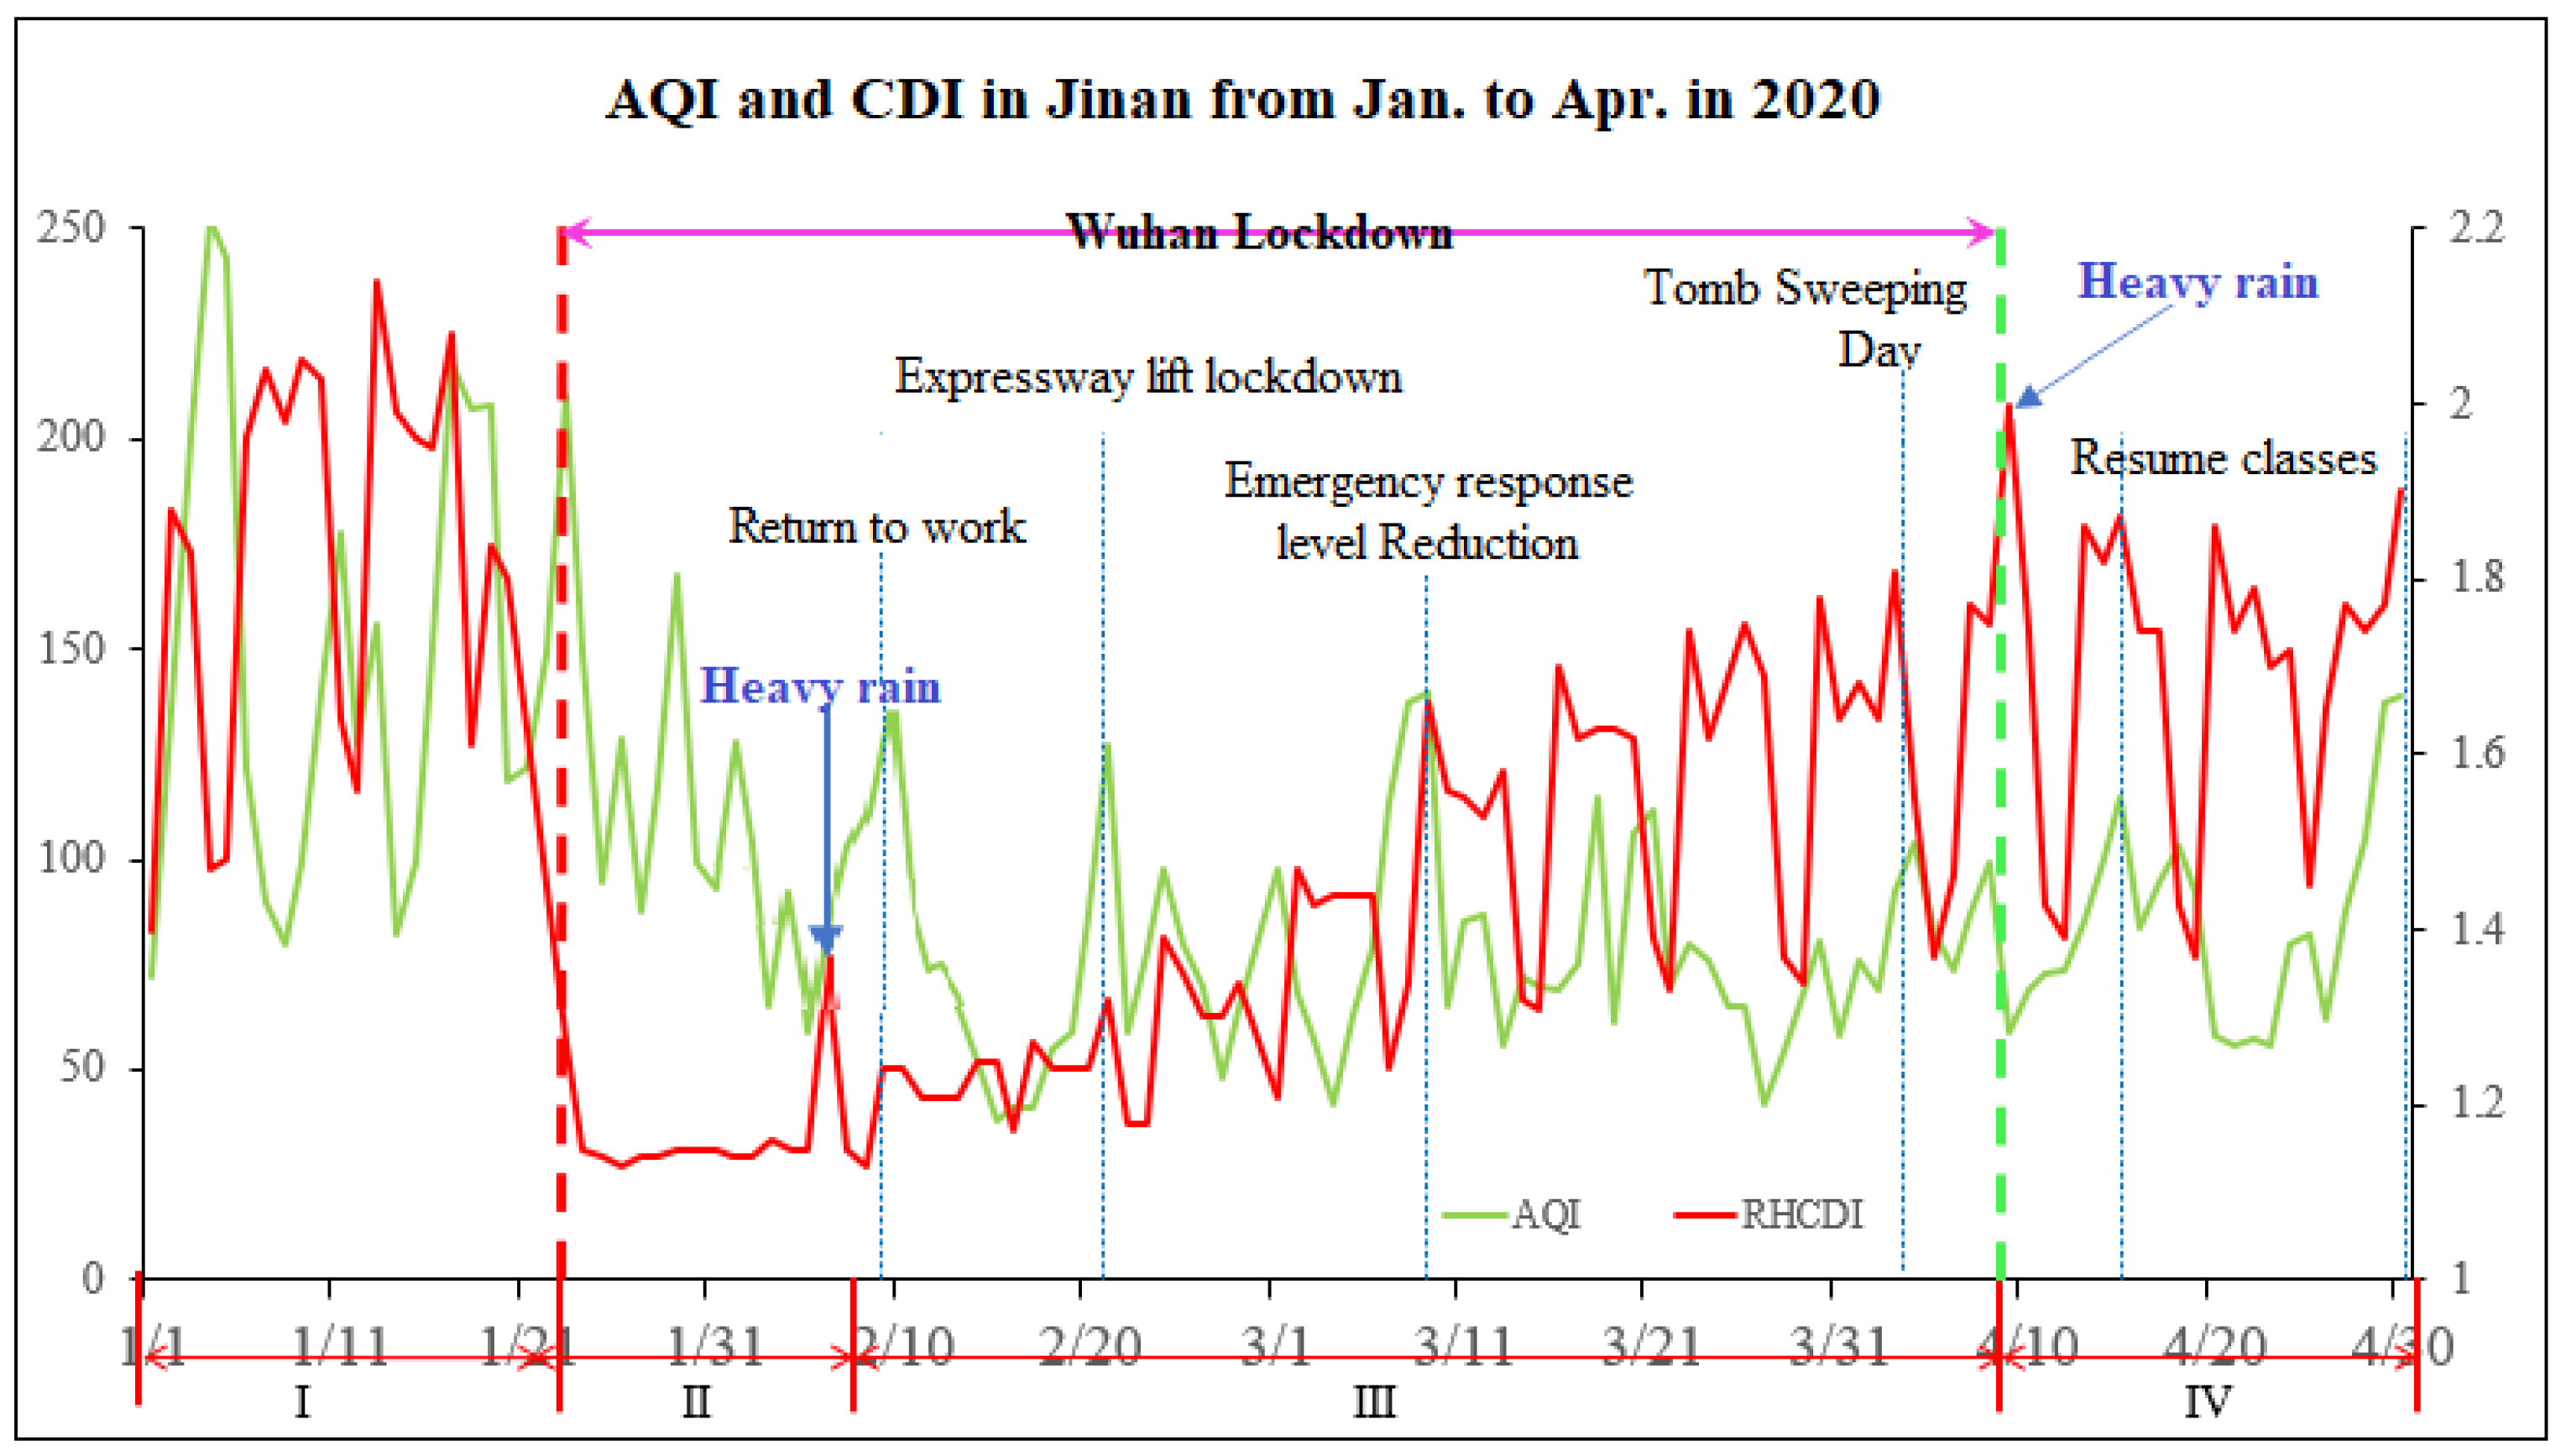
Figure 4.
CDI, PM2.5, and NO2, January–April 2019 and 2020. PM2.5 and NO2 had the same trend with CDI, but they were not as obvious as CDI.
Figure 4.
CDI, PM2.5, and NO2, January–April 2019 and 2020. PM2.5 and NO2 had the same trend with CDI, but they were not as obvious as CDI.
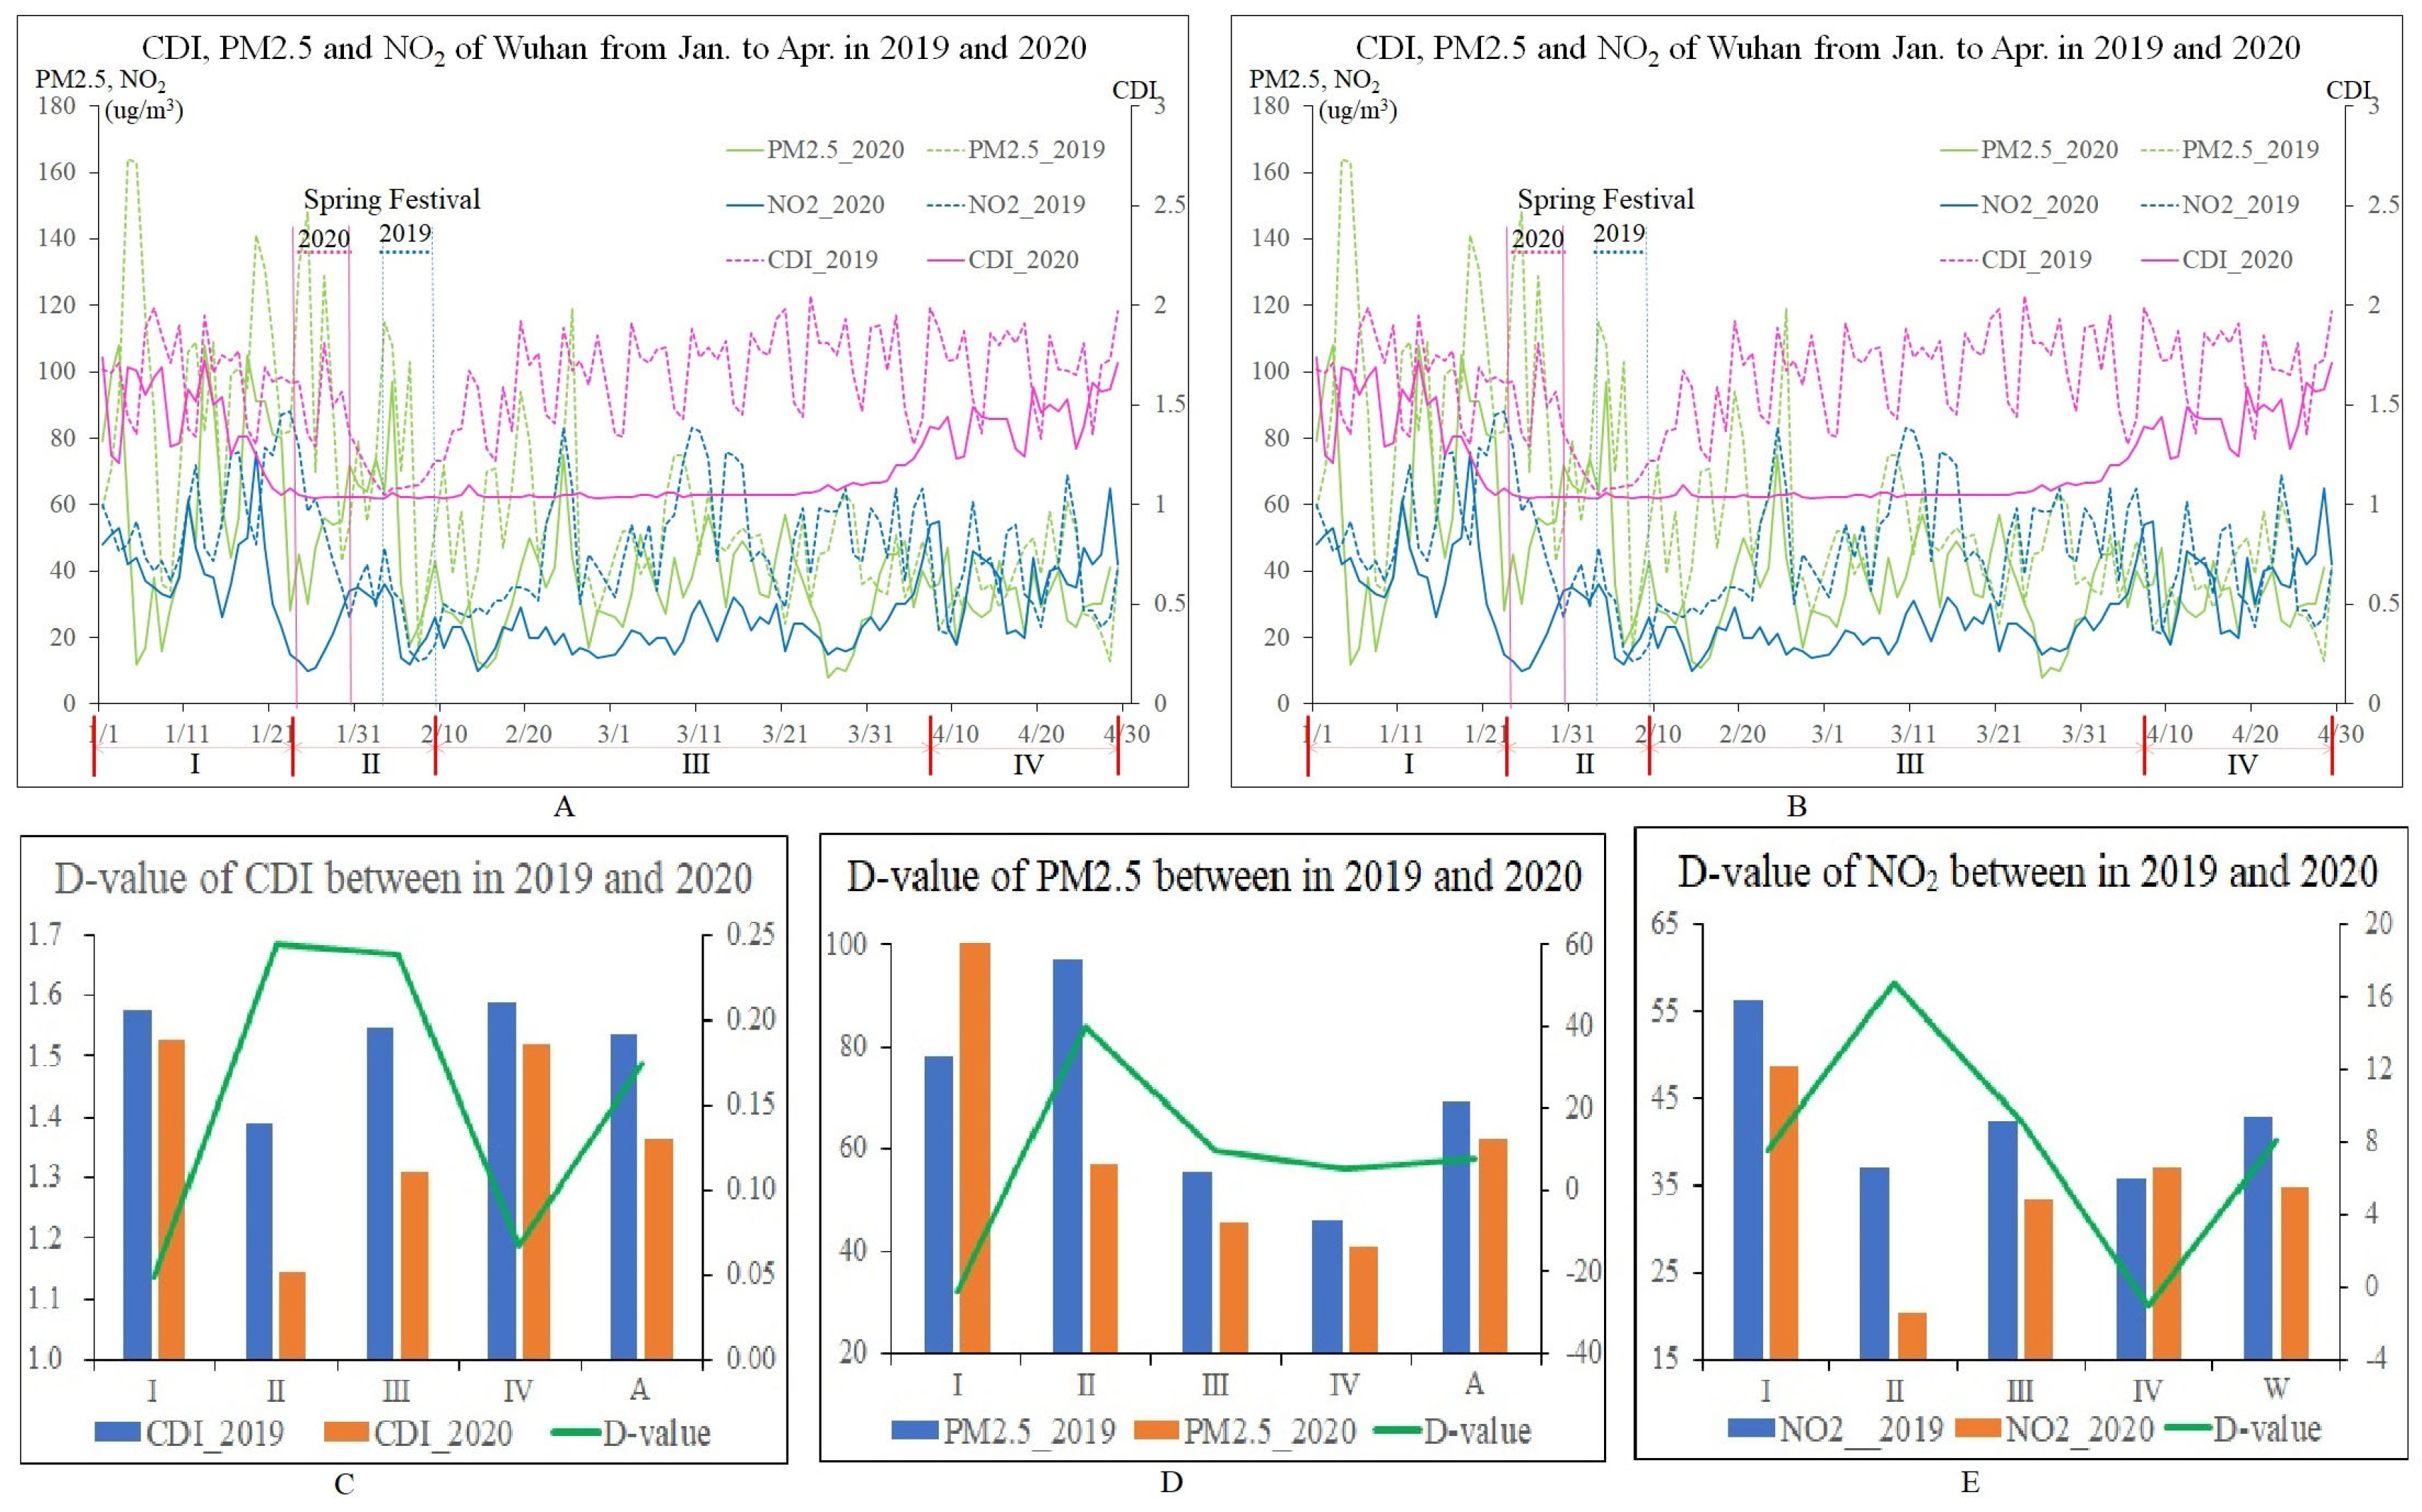
Figure 5.
(A) is the average AOD from January to April in 2019. The darker the color, the higher the value, and the more serious pollution. (B) is the results of kernel density analysis of the top 100 cities for traffic congestion and the top 100 cities with the worst air quality. The concentration areas of high AOD value in the east areas of the Hu line were consistent with the two gathering centers formed by cities with traffic congestion in space, and also consistent with the gathering center of cities with poor air quality.
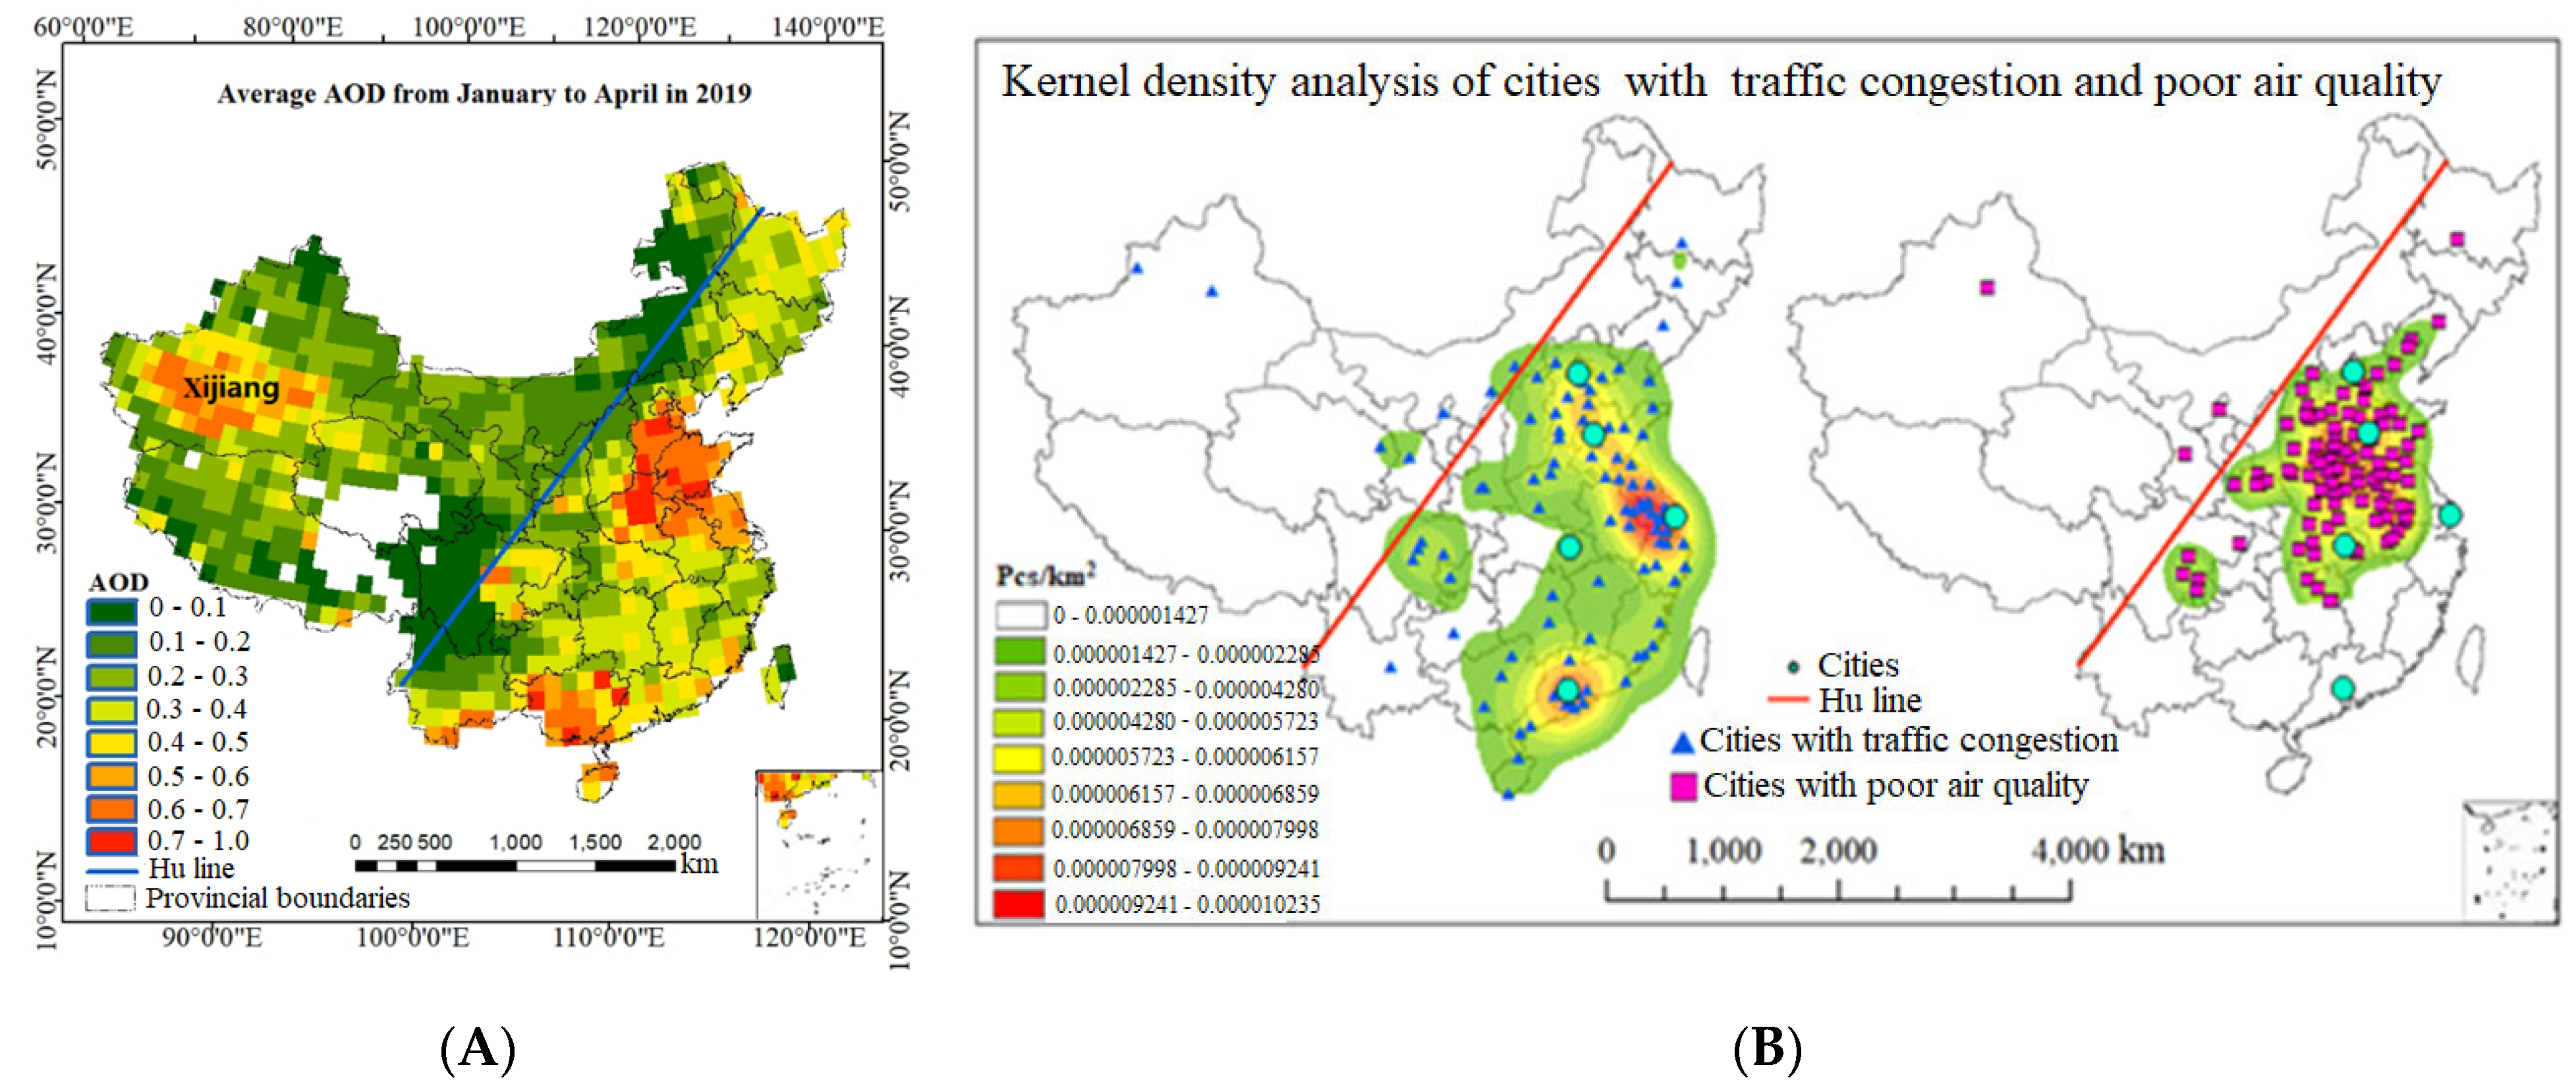
Figure 6.
AOD in 2020 was mostly lower than that in the same period in 2019 From Phases II to Phases IV: the concentration area of AOD decline was consistent with the gathering center formed by cities with the worst air quality.
Figure 6.
AOD in 2020 was mostly lower than that in the same period in 2019 From Phases II to Phases IV: the concentration area of AOD decline was consistent with the gathering center formed by cities with the worst air quality.
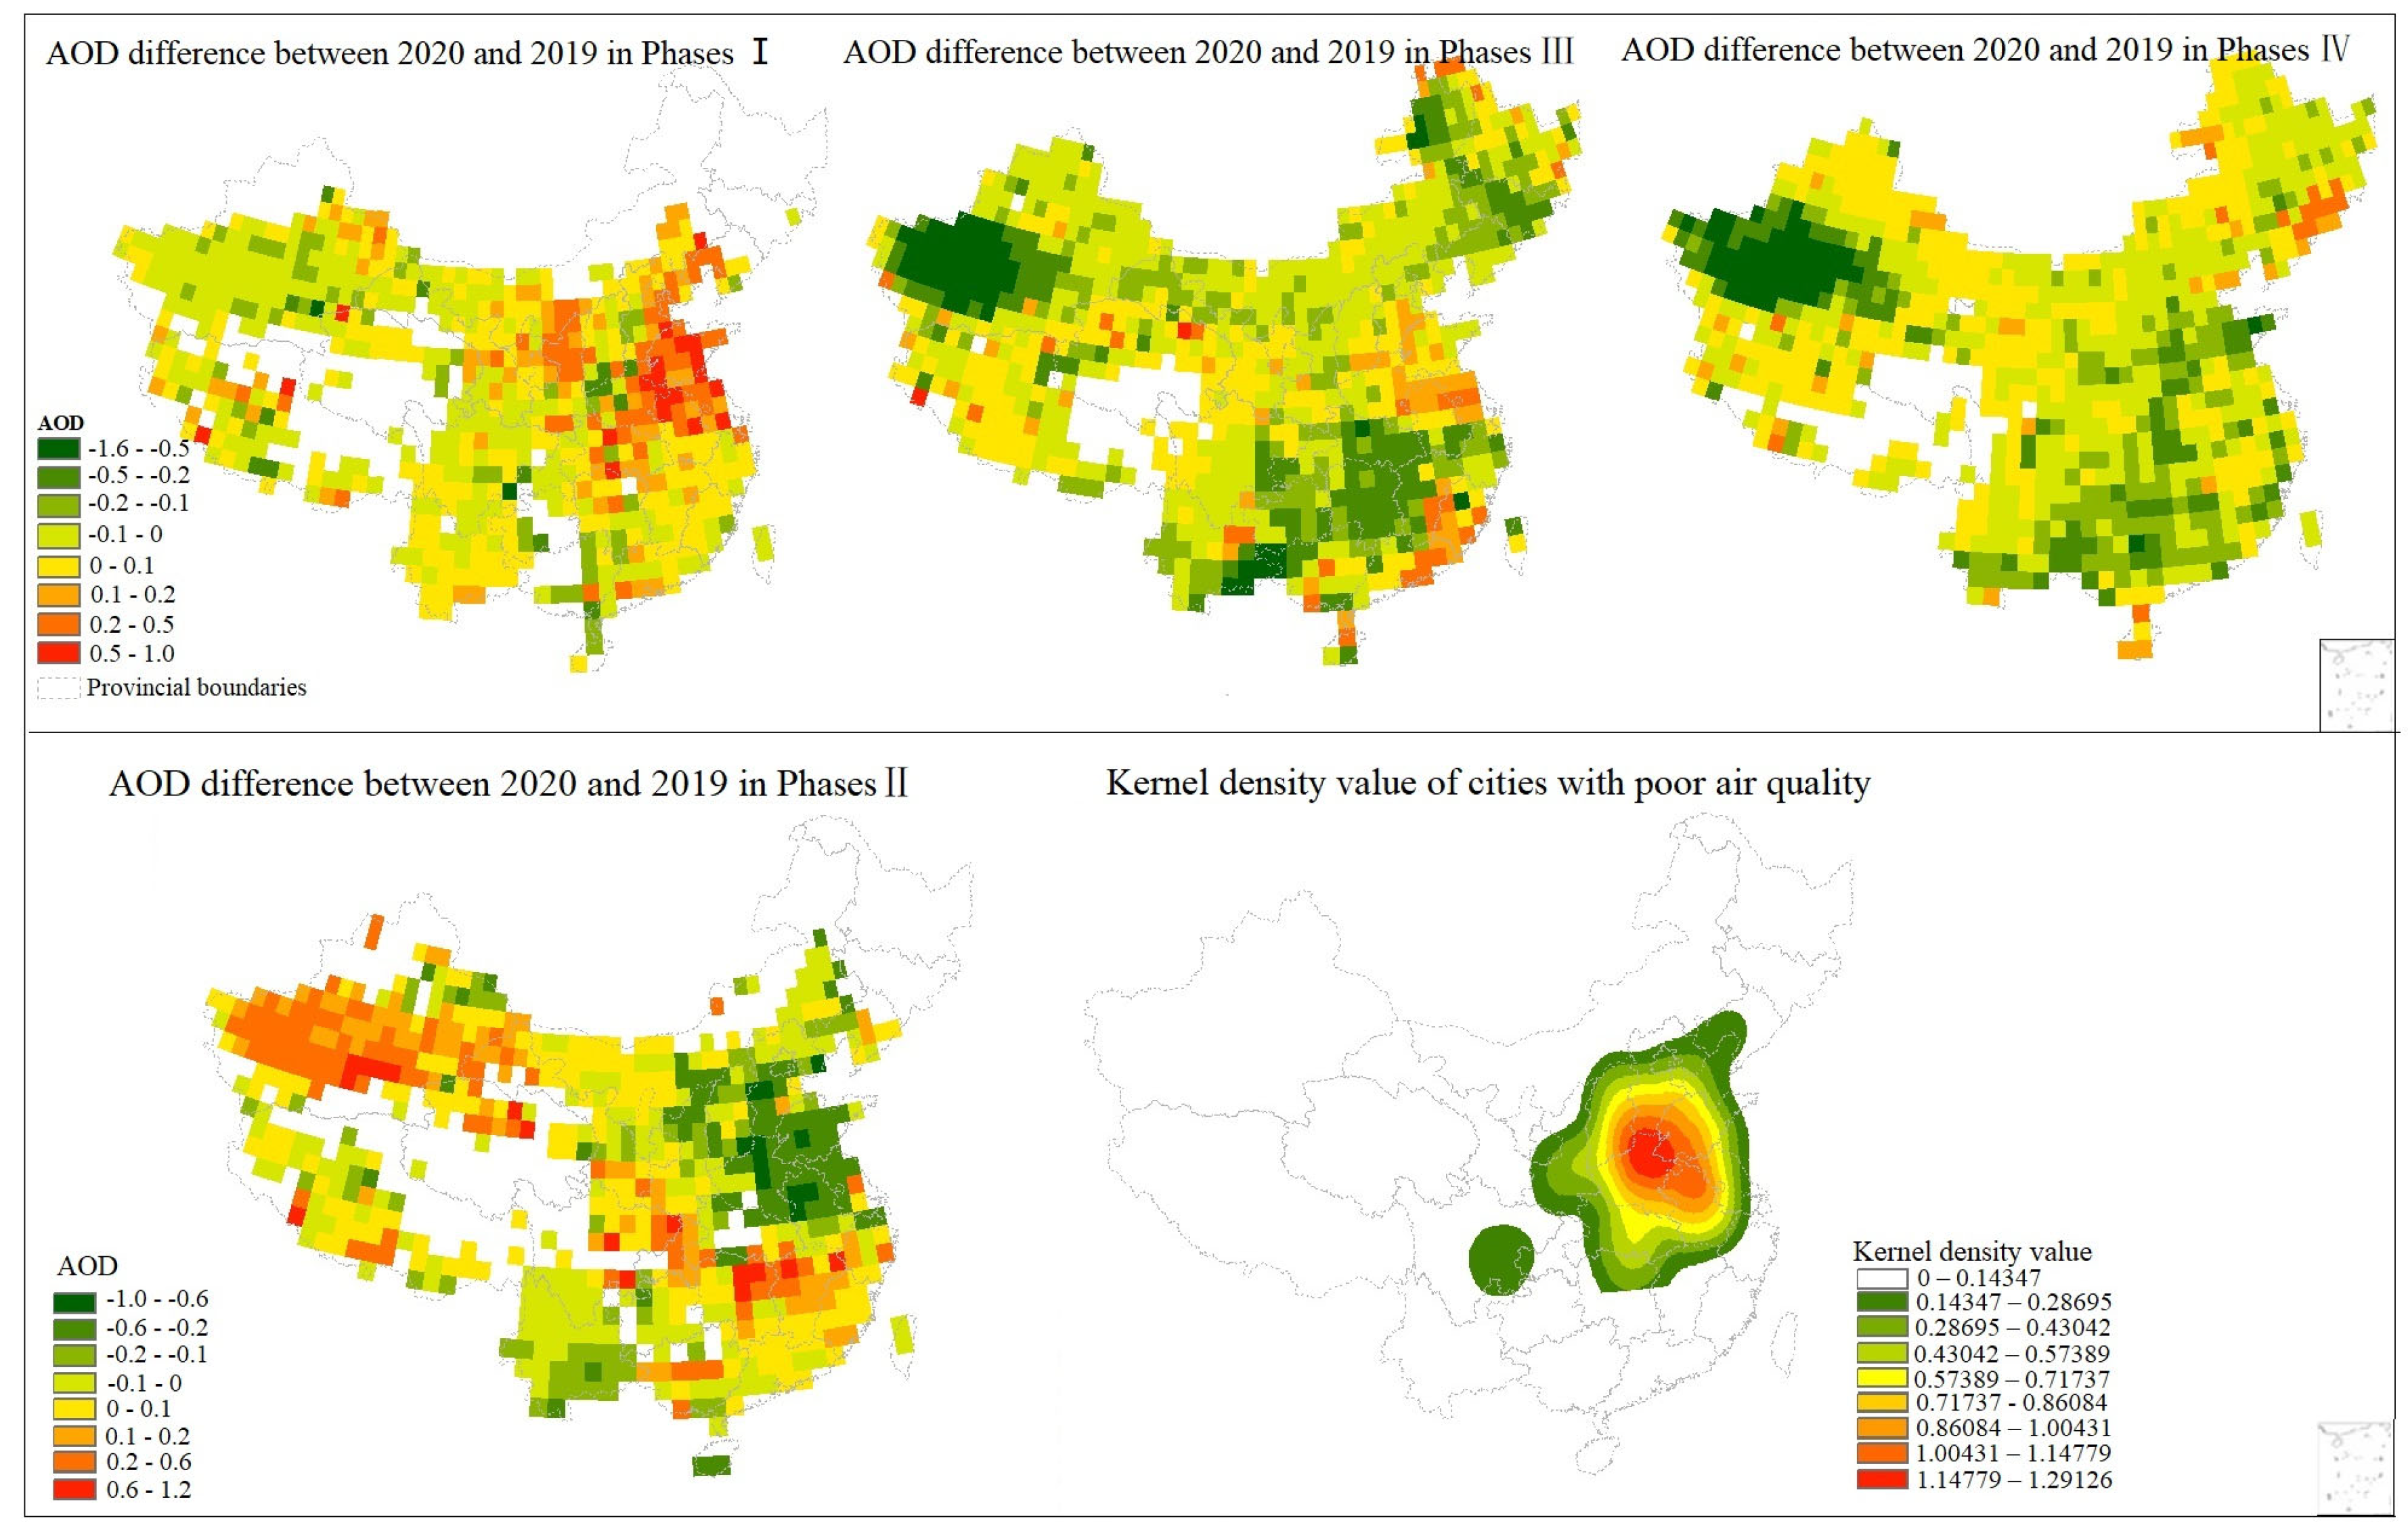
Figure 7.
(a) GWR analysis result in 2019. (b) GWR analysis result in 2020. AOD and road network density has a strong correlation based on GWR. The provinces with the high correlation and low correlation in 2020 were almost similar to that in 2019.
Figure 7.
(a) GWR analysis result in 2019. (b) GWR analysis result in 2020. AOD and road network density has a strong correlation based on GWR. The provinces with the high correlation and low correlation in 2020 were almost similar to that in 2019.
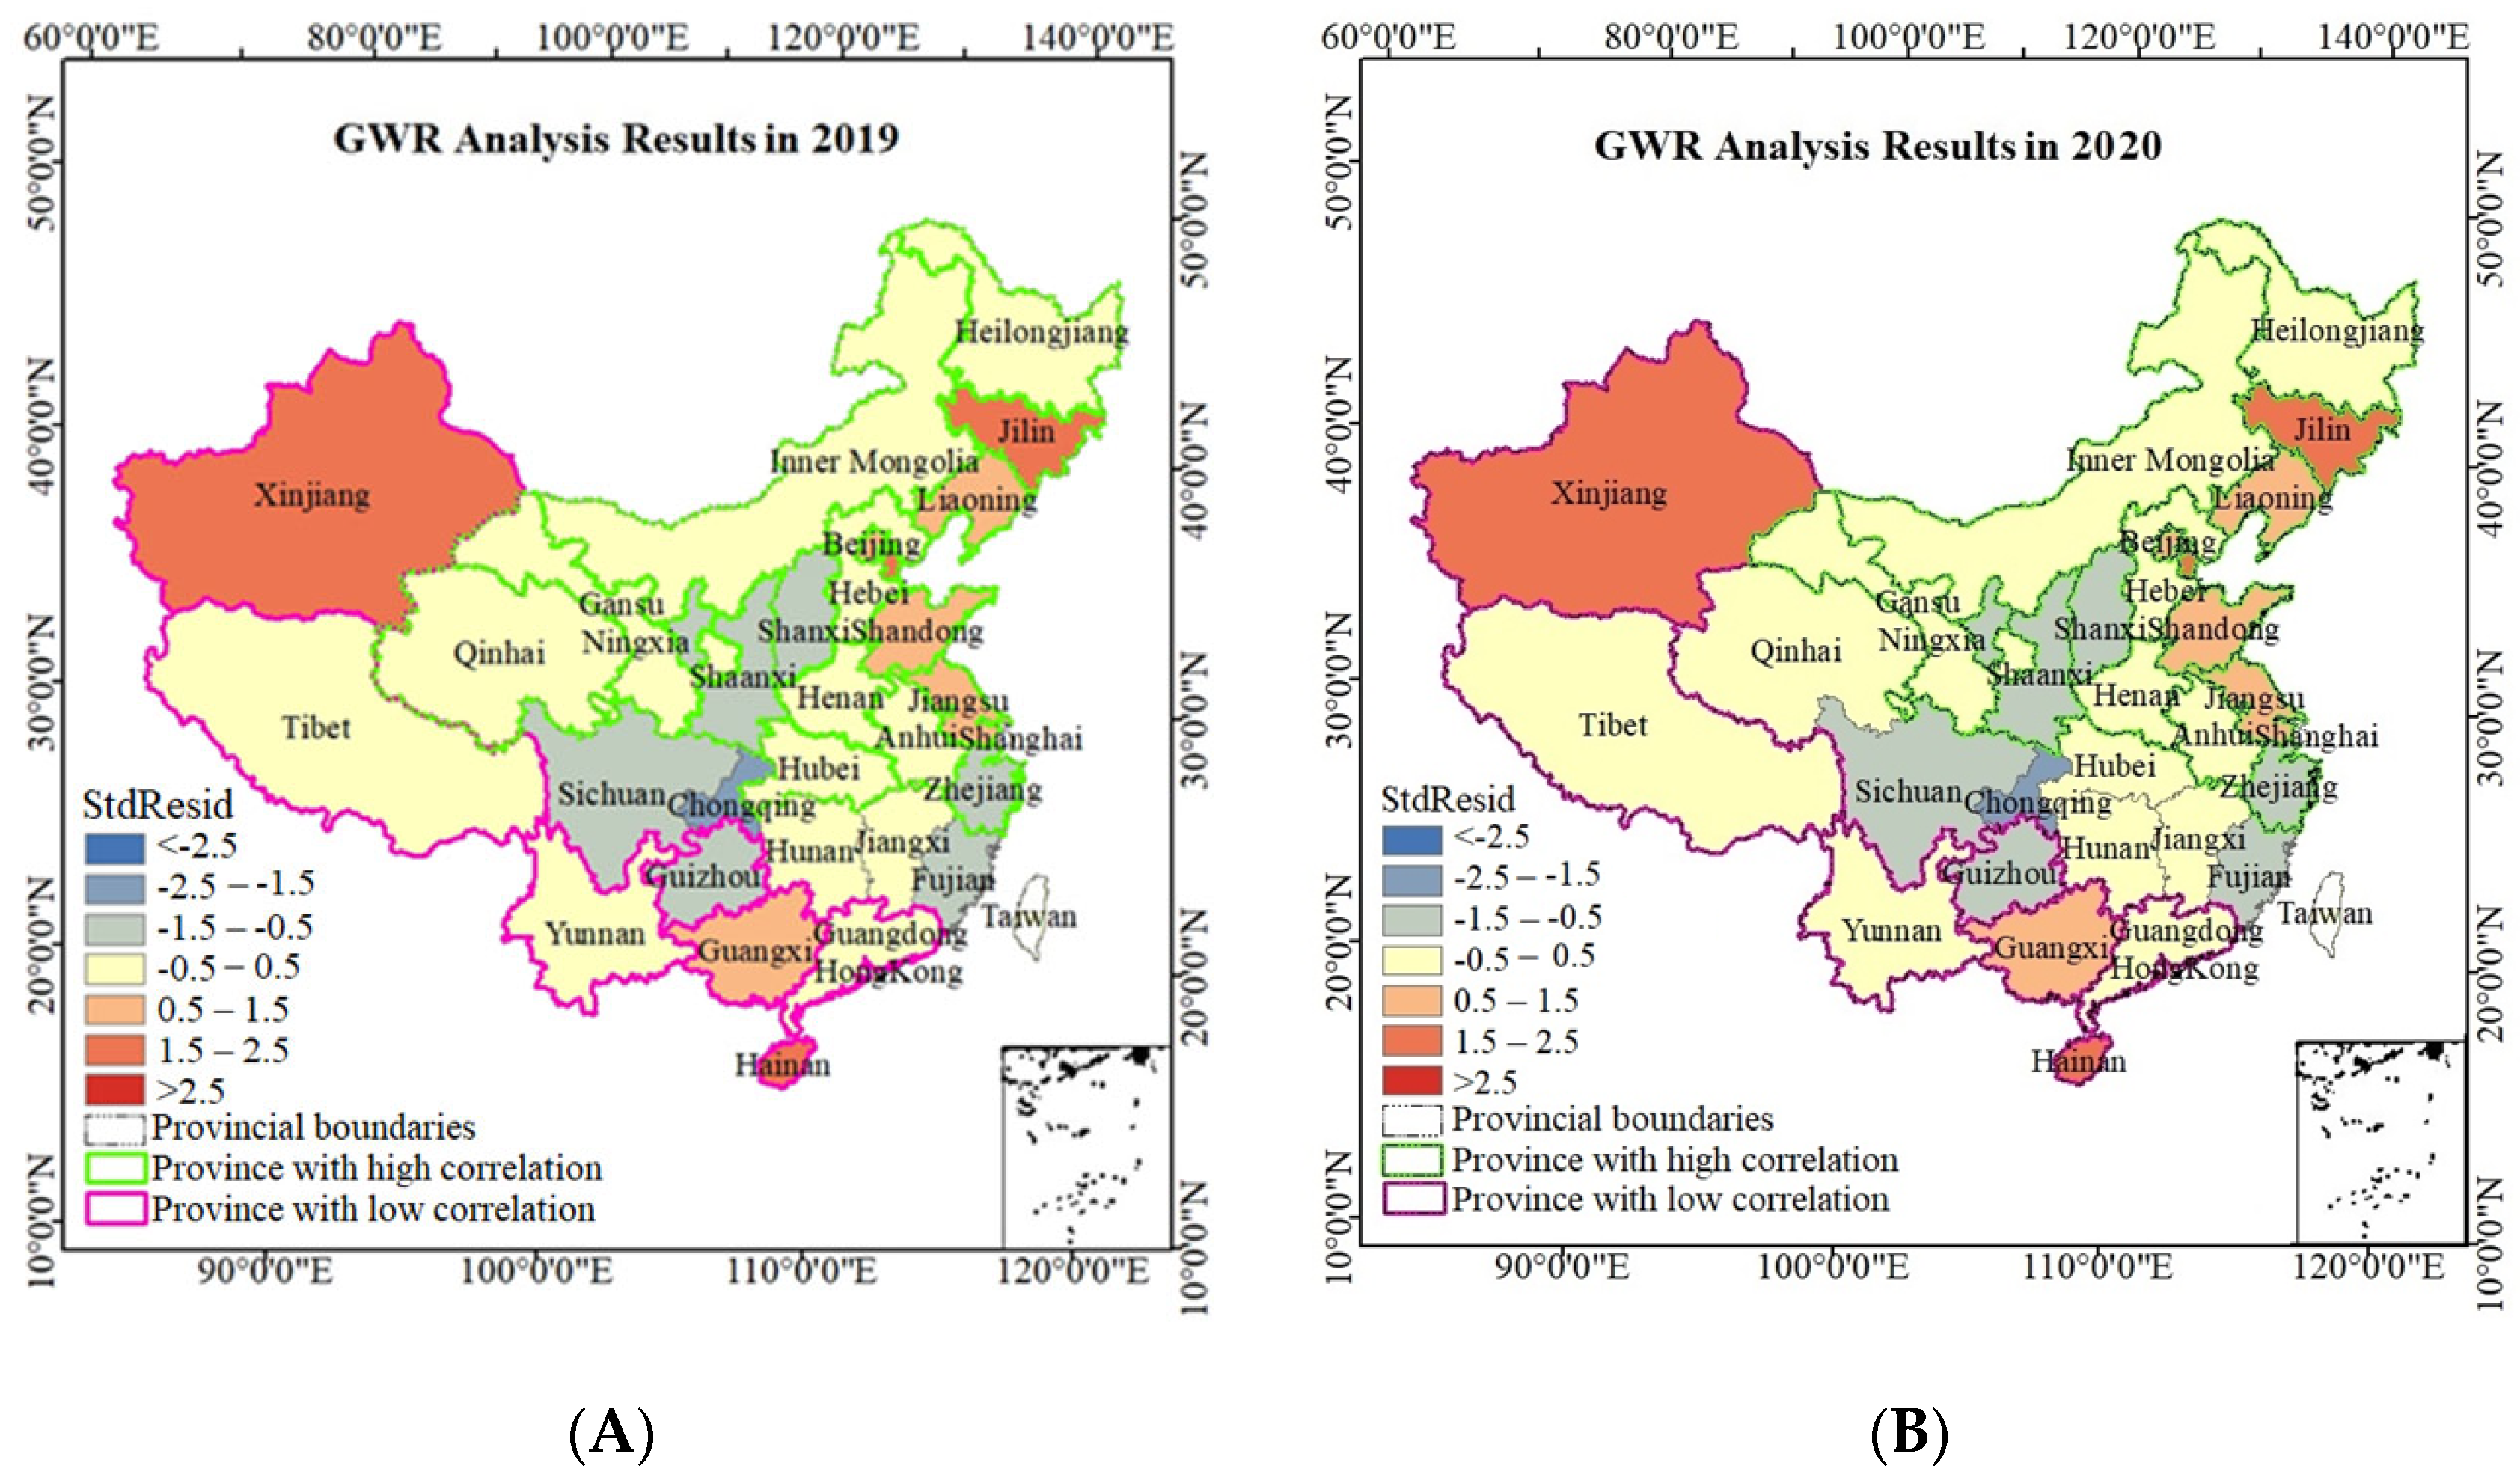
Figure 8.
These provinces with low correlation can be divided into two classes, one was close to the sea, and the other was undulate terrain (high value area of DEM). The base map was the DEM (digital elevation model) with 250 m resolution (https://www.resdc.cn/data.aspx?DATAID=123 (accessed on 8 January 2023)).

Table 1.
Research phase (compared to 2019).
| Time | Phase | Remarks |
|---|---|---|
| 1 January–22 January | I | the early period of the epidemic, only Wuhan city was affected |
| 23 January–9 February | II | Wuhan was in lockdown, the country was kept in quarantine |
| 10 February–7 April | III | resume work |
| 8 April–30 April | IV | Wuhan was unlocked |
Disclaimer/Publisher’s Note: The statements, opinions and data contained in all publications are solely those of the individual author(s) and contributor(s) and not of MDPI and/or the editor(s). MDPI and/or the editor(s) disclaim responsibility for any injury to people or property resulting from any ideas, methods, instructions or products referred to in the content. |
© 2023 by the authors. Licensee MDPI, Basel, Switzerland. This article is an open access article distributed under the terms and conditions of the Creative Commons Attribution (CC BY) license (https://creativecommons.org/licenses/by/4.0/).
Share and Cite
MDPI and ACS Style
Feng, H.; Wu, Z.; Li, X.; Xian, H.; Jia, Q.; Wang, X.; Zhu, M. Effect of Transportation Operation on Air Quality in China Based on MODIS AOD during the Epidemic. Sustainability 2023, 15, 4064. https://doi.org/10.3390/su15054064
AMA Style
Feng H, Wu Z, Li X, Xian H, Jia Q, Wang X, Zhu M. Effect of Transportation Operation on Air Quality in China Based on MODIS AOD during the Epidemic. Sustainability. 2023; 15(5):4064. https://doi.org/10.3390/su15054064
Chicago/Turabian StyleFeng, Haixia, Zhouhao Wu, Xin Li, Huacai Xian, Qiang Jia, Xingyu Wang, and Maoxin Zhu. 2023. "Effect of Transportation Operation on Air Quality in China Based on MODIS AOD during the Epidemic" Sustainability 15, no. 5: 4064. https://doi.org/10.3390/su15054064
Note that from the first issue of 2016, this journal uses article numbers instead of page numbers. See further details here.