
Strategic Decision-Making in Sustainable Water Management Using Demand Analysis and the Water Evaluation and Planning Model
 , , and
Abstract
:1. Introduction
1.1. Background
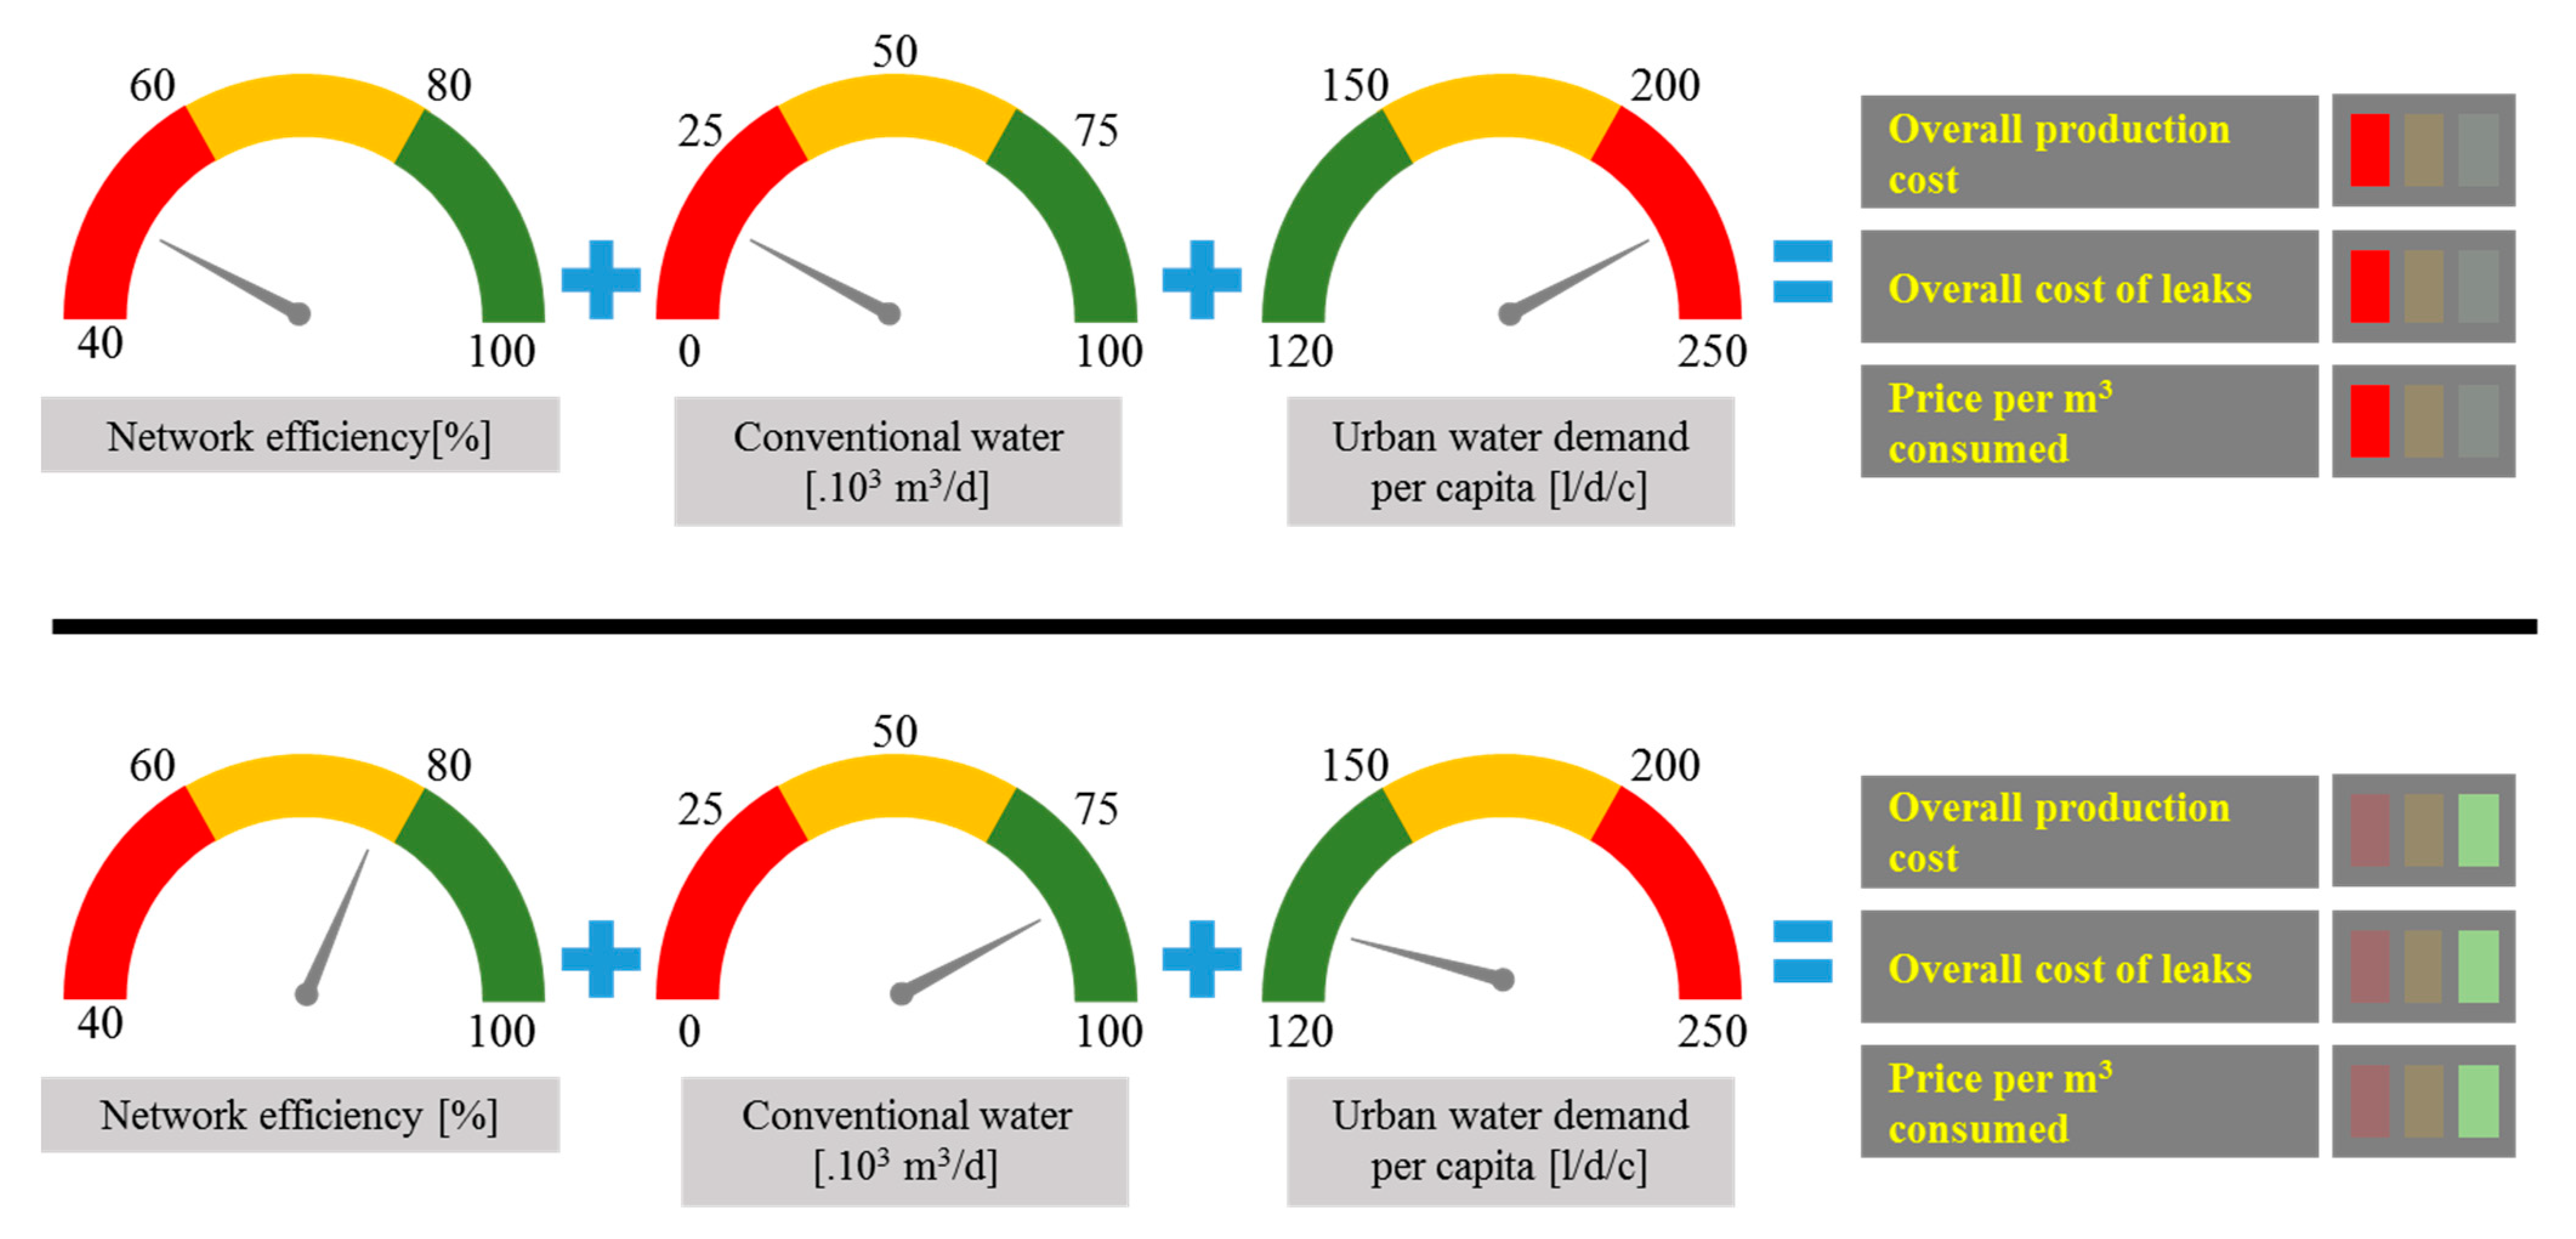
1.2. Modeling Approach
1.3. Problem Statement
1.4. Objectives
2. Methodology
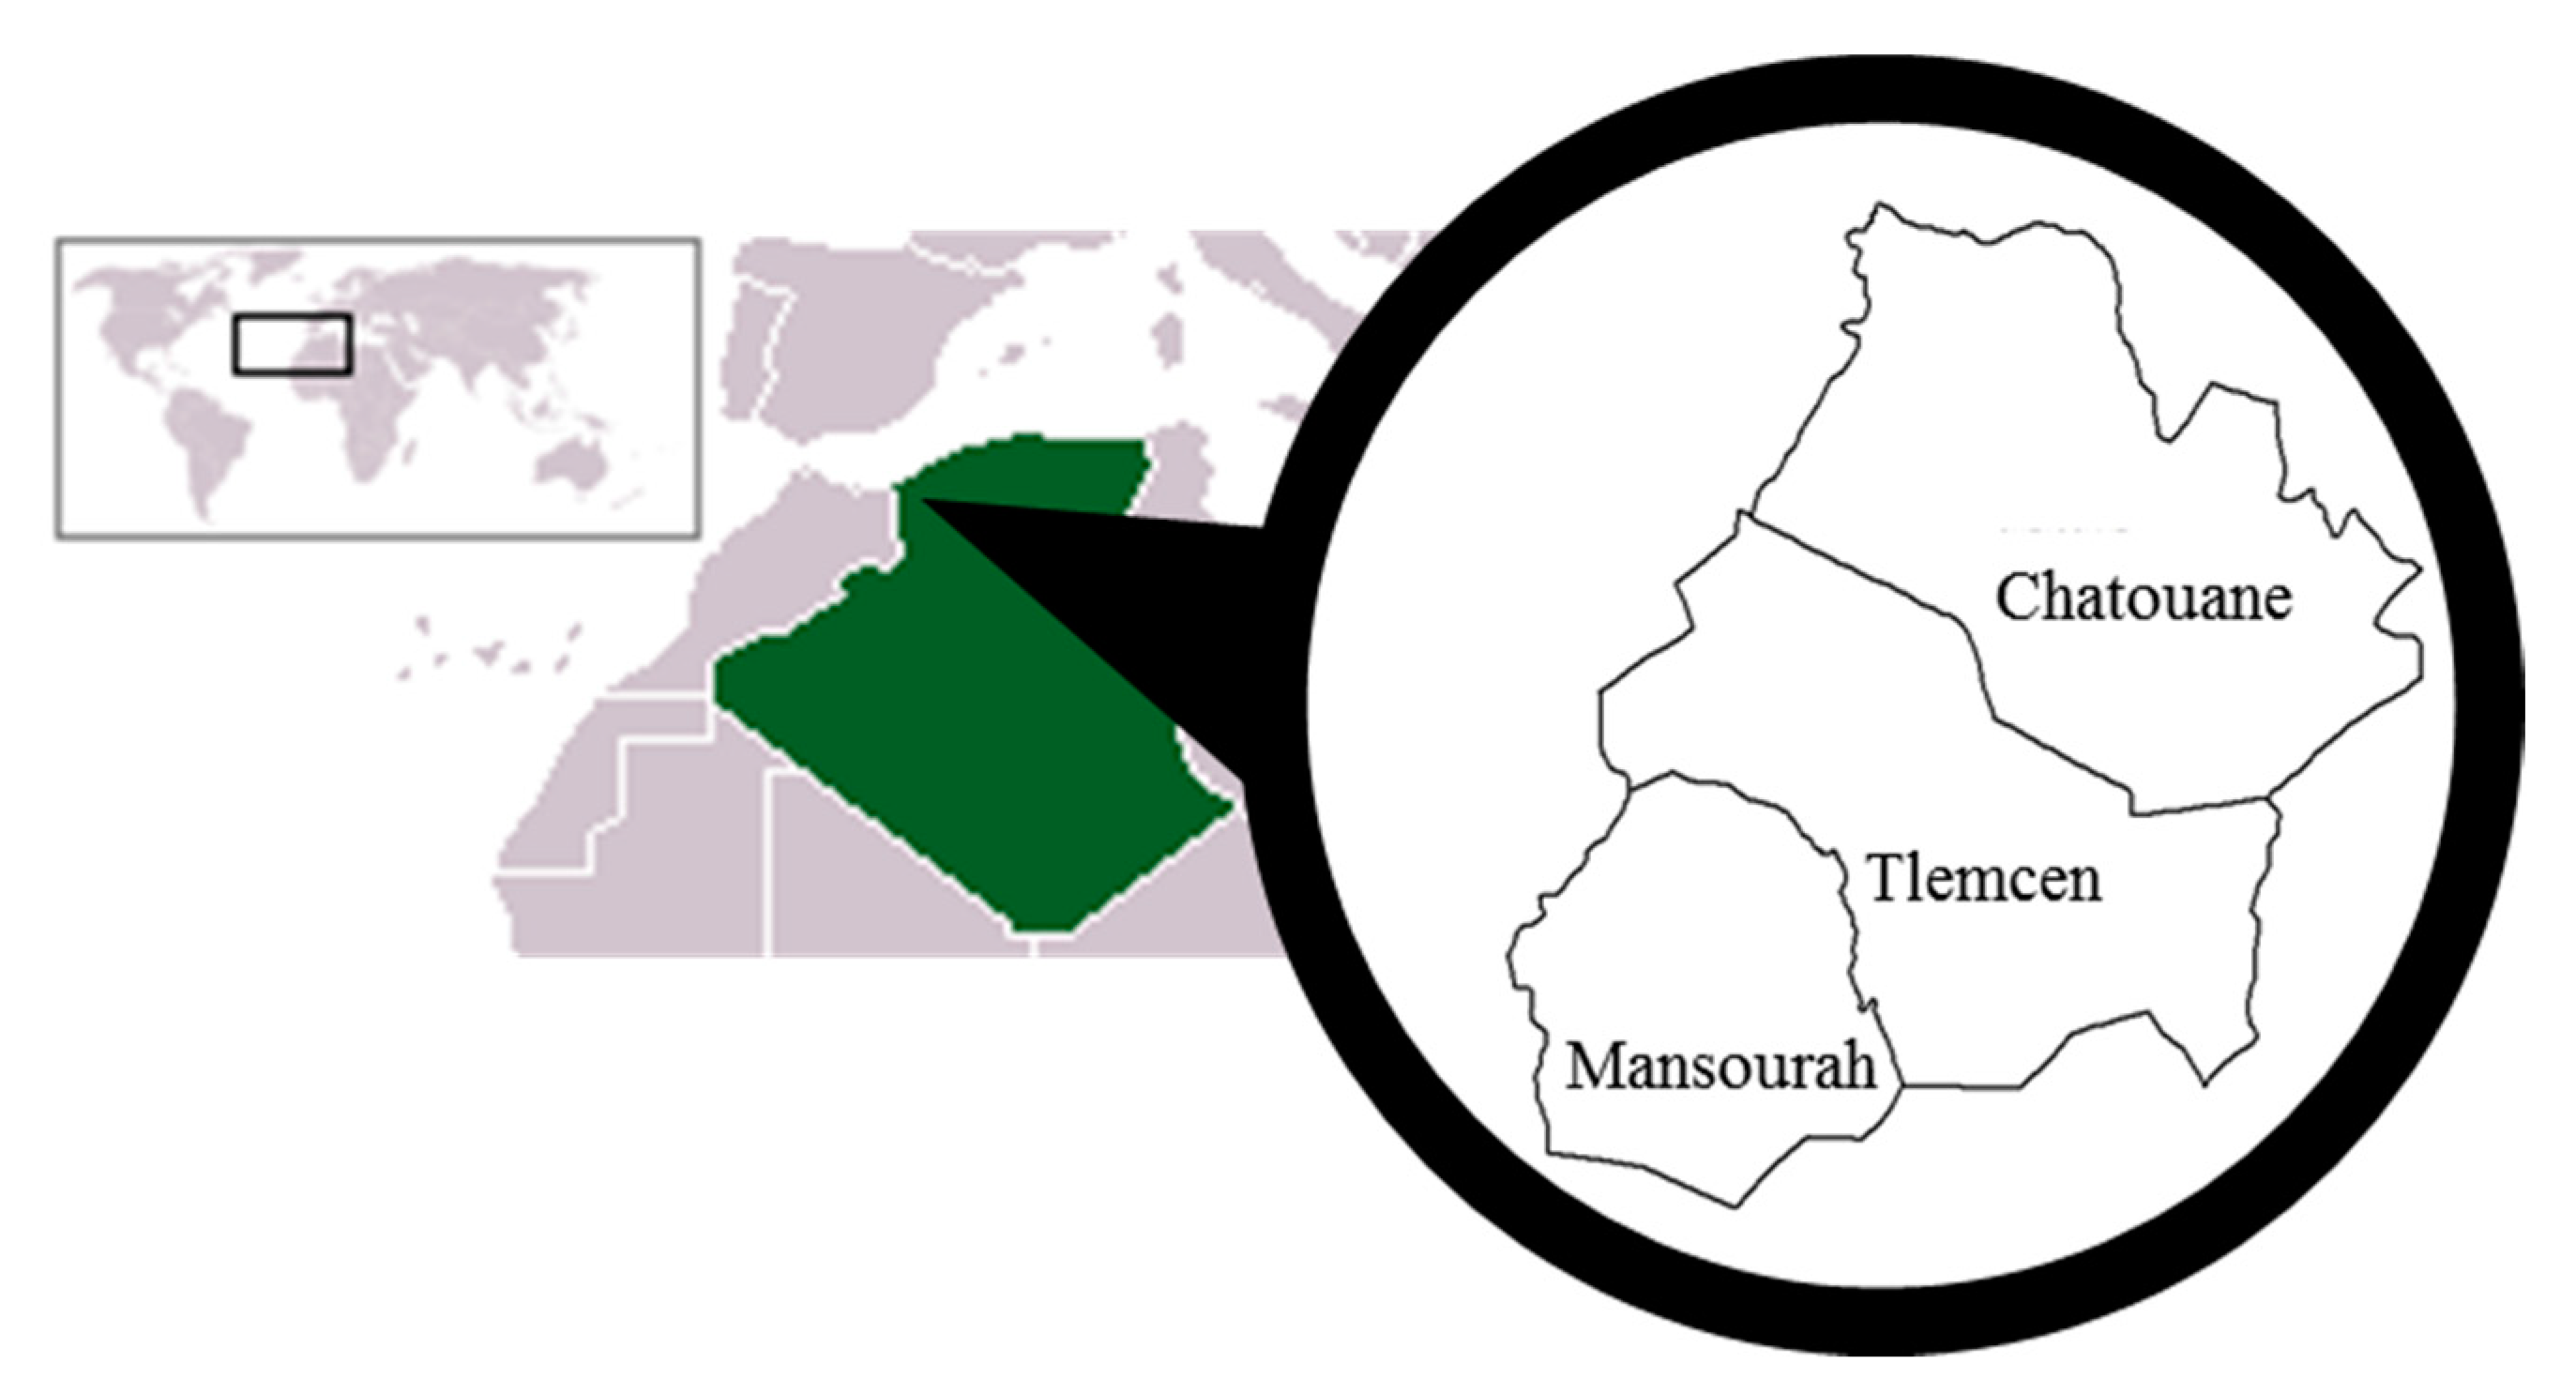
2.1. Study Area
2.2. Modeling Future Urban Water Demand
3. Results and Discussion
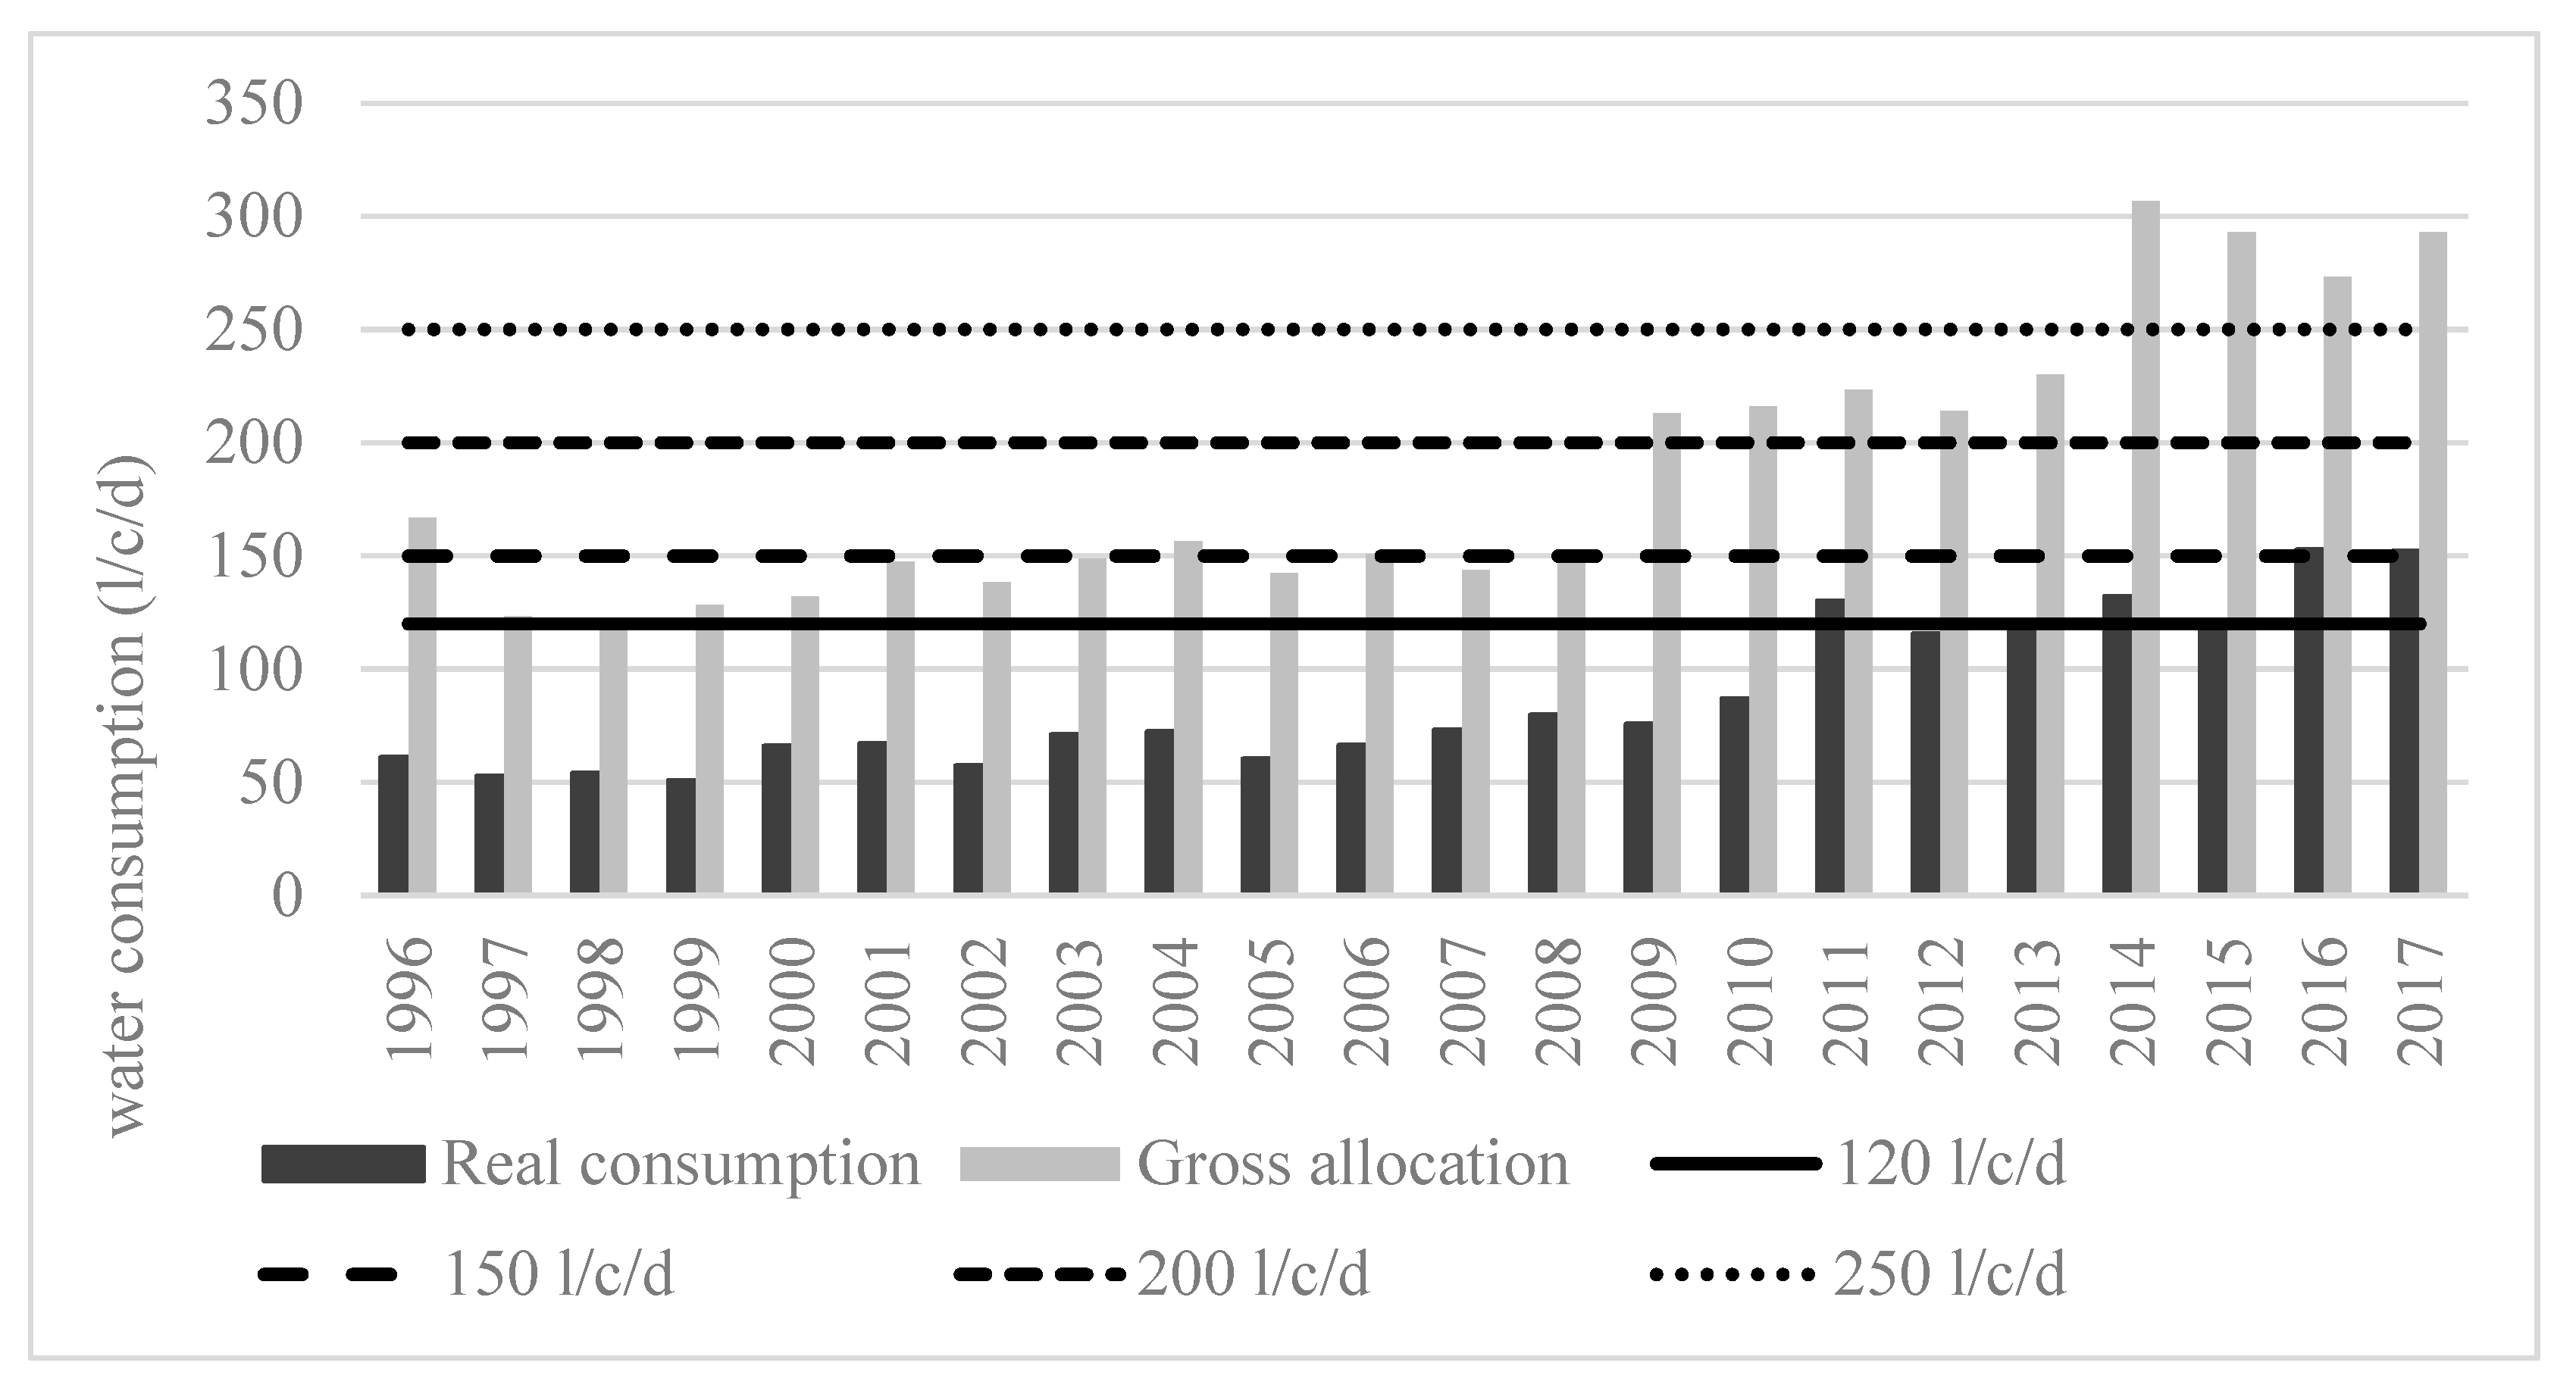
3.1. Analysis of Water Supply and Consumption
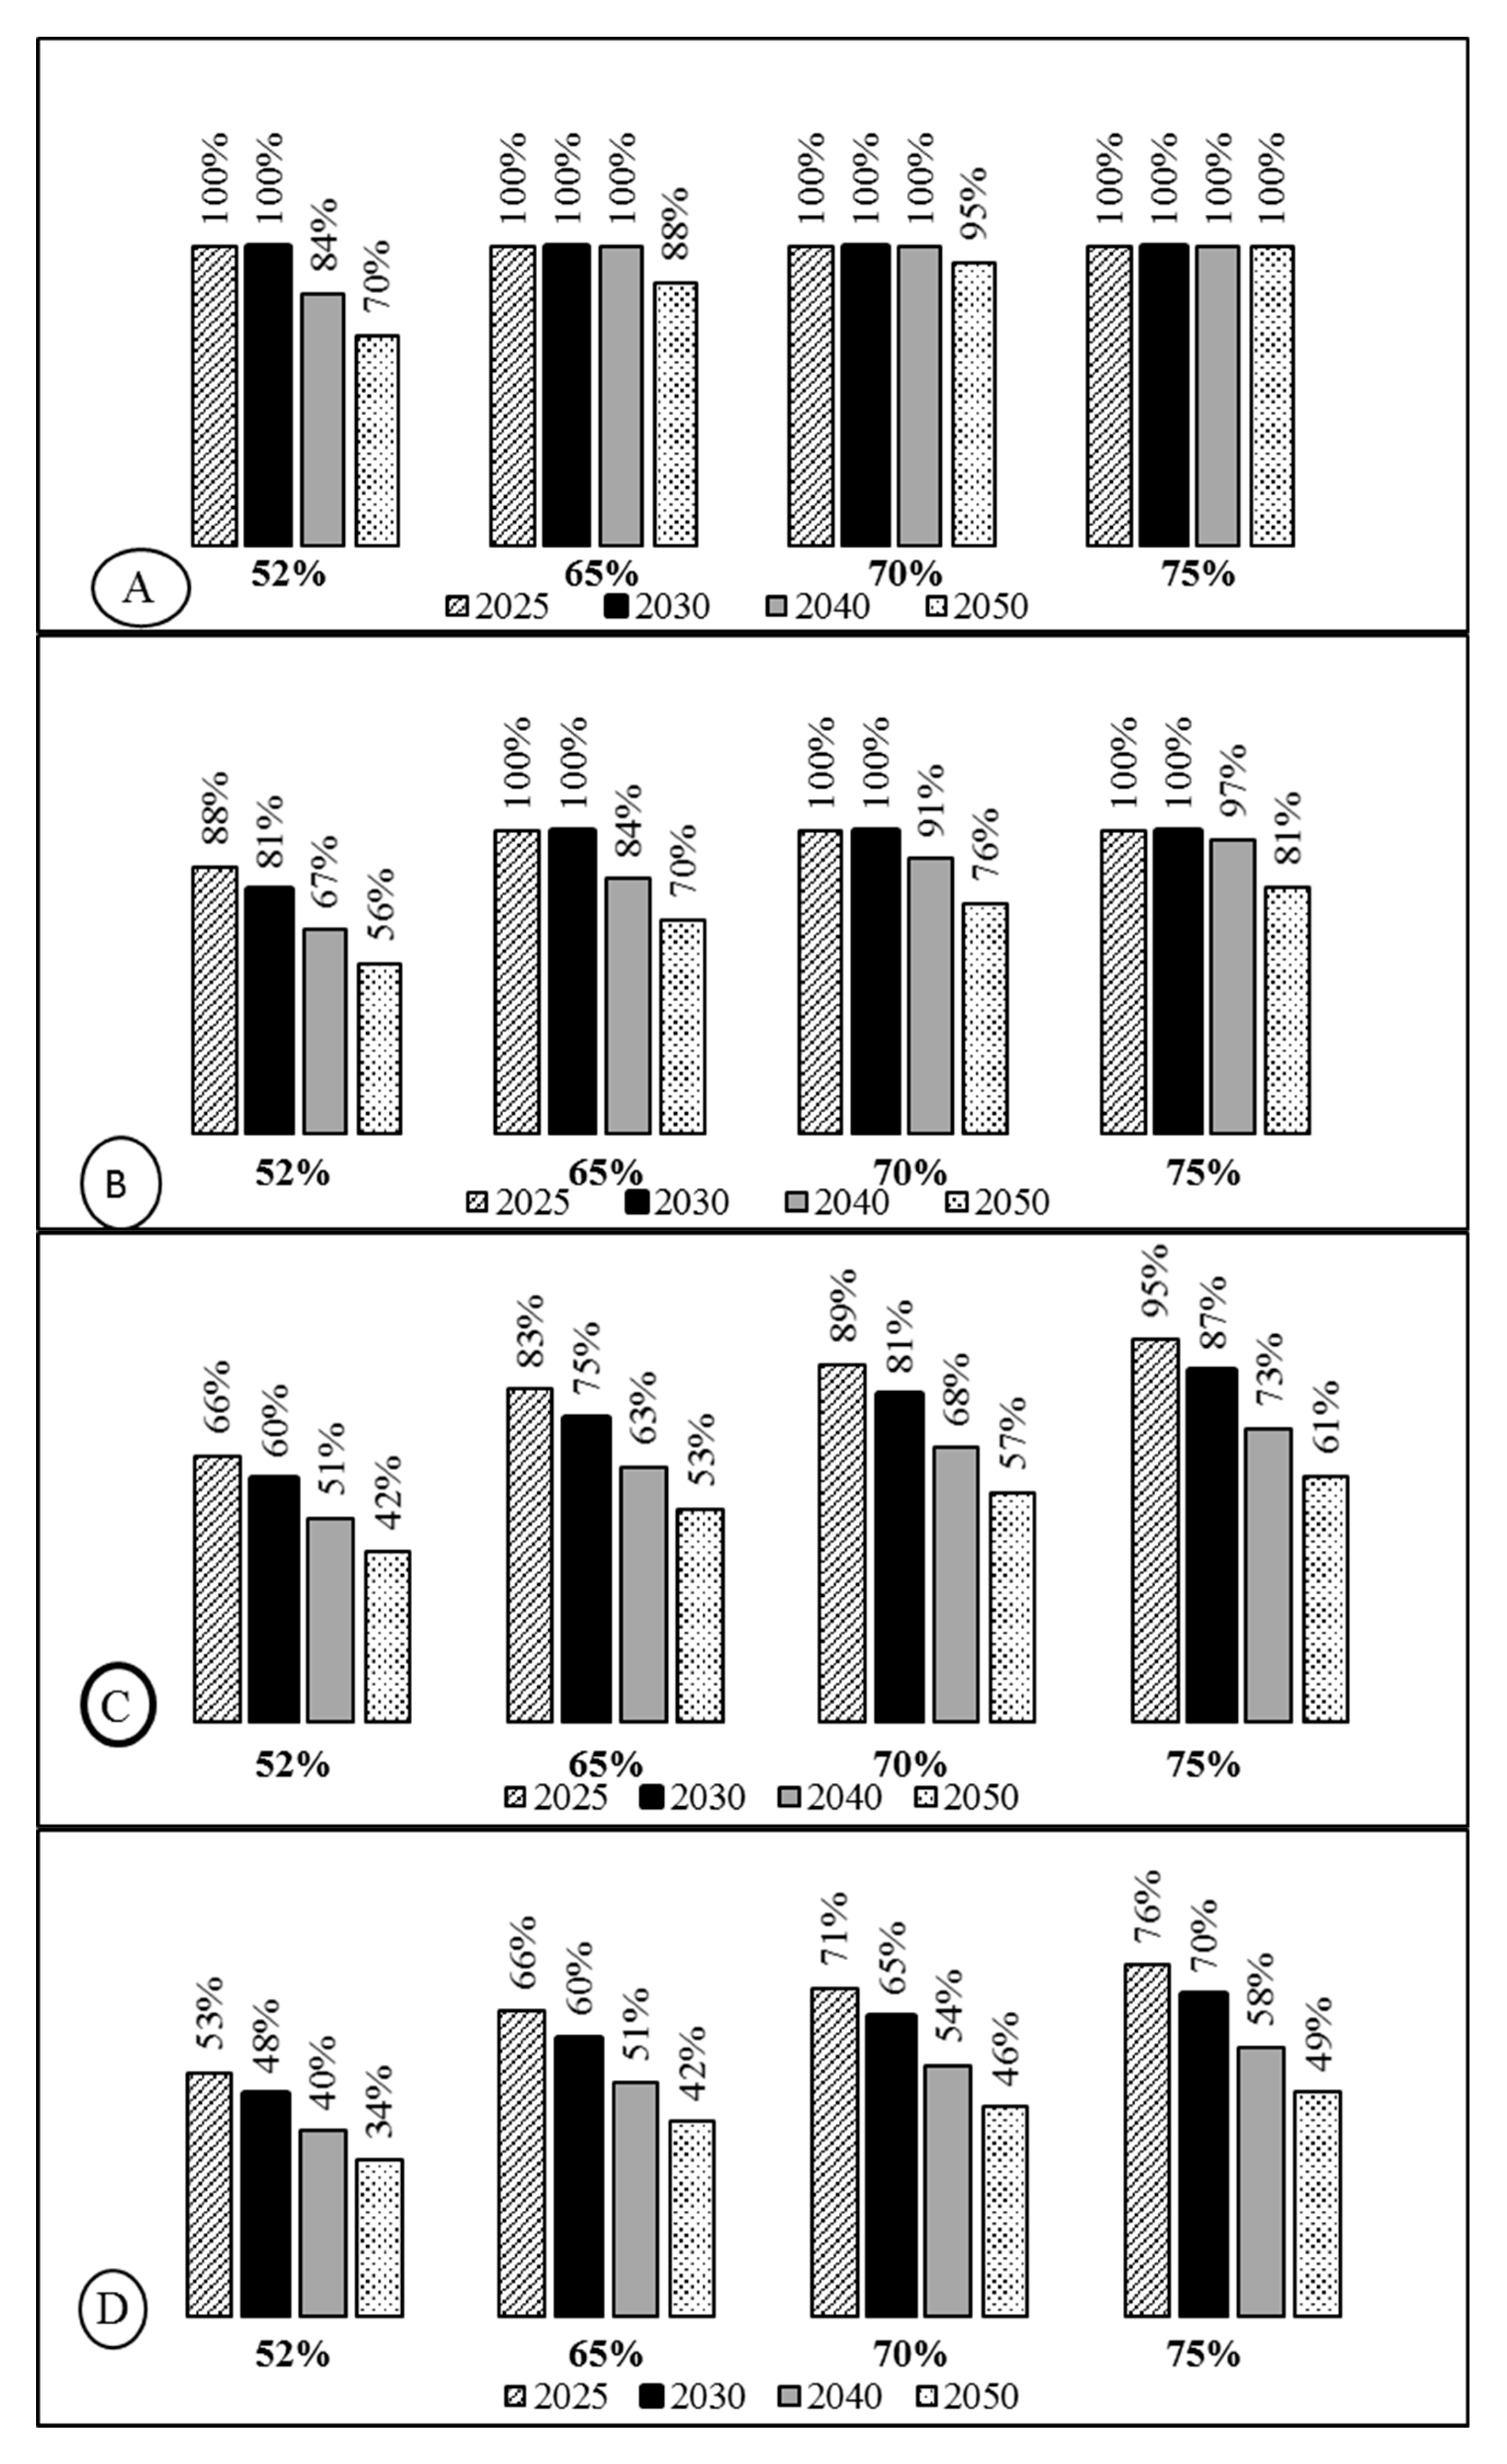
3.2. Future Scenarios
4. Conclusions
Author Contributions
Funding
Institutional Review Board Statement
Informed Consent Statement
Data Availability Statement
Conflicts of Interest
References
- Oberascher, M.; Rauch, W.; Sitzenfrei, R. Towards a smart water city: A comprehensive review of applications, data requirements, and communication technologies for integrated management. Sustain. Cities Soc. 2022, 76, 103442. [Google Scholar]
- Chen, X.; Li, F.; Li, X.; Hu, Y.; Hu, P. Evaluating and mapping water supply and demand for sustainable urban ecosystem management in Shenzhen, China. J. Clean. Prod. 2020, 251, 119754. [Google Scholar] [CrossRef]
- Binks, A.N.; Kenway, S.J.; Lant, P.A. The effect of water demand management in showers on household energy use. J. Clean. Prod. 2017, 157, 177–189. [Google Scholar] [CrossRef]
- Chang, F.-J.; Guo, S. Advances in Hydrologic Forecasts and Water Resources Management. Water 2020, 12, 1819. [Google Scholar] [CrossRef]
- Chandran, S.; Thiruchelve, S.R.; Dhanasekarapandian, M. Integrated urban water resources management strategy for a smart city in India. Water Supply 2021, 21, 736–749. [Google Scholar] [CrossRef]
- Pallavi, S.; Yashas, S.R.; Anilkumar, K.M.; Shahmoradi, B.; Shivaraju, H.P. Comprehensive Understanding of Urban Water Supply Management: Towards Sustainable Water-socio-economic-health-environment Nexus. Water Resour. Manag. 2021, 35, 315–336. [Google Scholar] [CrossRef]
- Ren, J.; Khayatnezhad, M. Evaluating the stormwater management model to improve urban water allocation system in drought conditions. Water Supply 2021, 21, 1514–1524. [Google Scholar] [CrossRef]
- Rahbar, K.; Riasi, A. Performance enhancement and optimization of solar chimney power plant integrated with transparent photovoltaic cells and desalination method. Sustain. Cities Soc. 2019, 46, 101441. [Google Scholar]
- Bacău, S.; Domingo, D.; Palka, G.; Pellissier, L.; Kienast, F. Integrating strategic planning intentions into land-change simulations: Designing and assessing scenarios for Bucharest. Sustain. Cities Soc. 2022, 76, 103446. [Google Scholar]
- Jabari, F.; Ghaebi, H.; Mohammadi-Ivatloo, B.; Mohammadpourfard, M.; Bannae-Sharifian, M.B. Design, worst case study, and sensitivity analysis of a net-zero energy building for sustainable urban development. Sustain. Cities Soc. 2020, 54, 101991. [Google Scholar]
- Guay, L.; Britto, A.L. Les enjeux sociaux de l’eau: Comparaisons internationales. Cah. Géogr. Qué. 2017, 61, 415–425. [Google Scholar] [CrossRef]
- Abdelbaki, C.; Touaibia, B. Apport des systèmes d’information géographique et de la modélisation hydraulique dans la gestion des réseaux d’alimentation en eau potable. Cas Group. Urbain Tlemcen 2014, 5, 52–60. [Google Scholar] [CrossRef]
- Mouatadid, S.; Adamowski, J. Using extreme learning machines for short-term urban water demand forecasting. Urban Water J. 2017, 14, 630–638. [Google Scholar] [CrossRef]
- Zhang, D.W.; Ni, G.; Cong, Z.; Chen, T.; Zhang, T. Statistical interpretation of the daily variation of urban water consumption in Beijing, China. Hydrol. Sci. J. 2013, 59, 181–192. [Google Scholar] [CrossRef]
- House-Peters, L.A.; Chang, H. Urban water demand modeling: Review of concepts, methods, and organizing principles. Water Resour. Res. 2011, 47, W05401. [Google Scholar] [CrossRef]
- Amisigo, B.A.; McCluskey, A.; Swanson, R. Modeling Impact of Climate Change on Water Resources and Agriculture Demand in the Volta Basin and other Basin Systems in Ghana. Sustainability 2015, 7, 6957–6975. [Google Scholar] [CrossRef]
- Mourad, K.A.; Alshihabi, O. Assessment of future Syrian water resources supply and demand by the WEAP model. Hydrol. Sci. J. 2016, 61, 393–401. [Google Scholar] [CrossRef]
- Sandoval-Solis, S.; Ortiz Partida, J.P.; Floyd, L. Multi-Objective Water Planning in a Poor Water Data Region: Aragvi River Basin. Sustainability 2022, 14, 3649. [Google Scholar] [CrossRef]
- Rajosoa, A.S.; Abdelbaki, C.; Mourad, K.A. Water assessment in transboundary river basins: The case of the Medjerda River Basin. Sustain. Water Resour. Manag. 2021, 7, 88. [Google Scholar] [CrossRef]
- Rajosoa, A.S.; Abdelbaki, C.; Mourad, K.A. Assessing the impact of climate change on the Medjerda River Basin. Arab. J. Geosci. 2022, 15, 1052. [Google Scholar] [CrossRef]
- Gao, J.; Christensen, P.; Li, W. Application of the WEAP model in strategic environmental assessment: Experiences from a case study in an arid/semi-arid area in China. J. Environ. Manag. 2017, 198, 363–371. [Google Scholar] [CrossRef]
- Sun, L.; Zhou, X.; Gu, A. Effects of Climate Change on Hydropower Generation in China Based on a WEAP Model. Sustainability 2022, 14, 5467. [Google Scholar] [CrossRef]
- Benblidia, M. L’Efficience d’Utilisation de l’Eau et Approche Economique. Etude Nationale, Algérie; Plan Bleu, Centre d’Activités Régionales PNUE/PAM: Marseille, France, 2011; p. 24. [Google Scholar]
- Abdelbaki, C.; Touaibia, B.; Mahmoudi, H.; Djelloul Smir, S.M.; Allal, M.A.; Goosen, M. Efficiency and performance of a drinking water supply network for an urban cluster at Tlemcen Algeria. Desalin. Water Treat. 2014, 52, 2165–2173. [Google Scholar] [CrossRef]
- Bessedik, M. Pratiques de l’Eau en Situation de Pénurie dans la Ville de Tlemcen; Editions Universitaires Européennes: Sarrebruck, Germany, 2011. [Google Scholar]
- Tortajada, C.; González-Gómez, F.; Biswas, A.K.; Buurman, J. Water demand management strategies for water-scarce cities: The case of Spain. Sustain. Cities Soc. 2019, 45, 649–656. [Google Scholar] [CrossRef]
- ONS. Armature Urbaine. Recensement Générale de la Population et de l’Habitat de 2008; Office National des Statistiques Alger: Algiers, Algeria, 2011; 214p.
- Collignon, B.; Bensaoula, F. L’exploitation des aquifères karstiques des Monts de Tlemcen (Algérie) comme réserve stratégique en cas de sécheresse pluriannuelle grave. In Proceedings of the Colloque International Sécheresses, Etiages et Déficits en Eau, Paris, France, 11–13 December 2019. [Google Scholar]
- Vanham, D.; del Pozo, S.; Pekcan, A.G.; Keinan-Boker, L.; Trichopoulou, A.; Gawlik, B.M. Water consumption related to different diets in Mediterranean cities. Sci. Total Environ. 2016, 573, 96–105. [Google Scholar] [CrossRef] [PubMed]
- Shiklomanov, I.A. Appraisal and Assessment of World Water Resources. Water Int. 2000, 25, 11–32. [Google Scholar] [CrossRef]
- Domene, E.; Sauri, D. Urbanisation and water consumption: Influencing factors in the metropolitan region of Barcelona. Urban Stud. 2006, 43, 1605–1623. [Google Scholar] [CrossRef]
- Villarin, M.C. Methodology based on fine spatial scale and preliminary clustering to improve multivariate linear regression analysis of domestic water. Appl. Geogr. 2019, 103, 22–39. [Google Scholar]
- Gómez-Llanos, E.; Durán-Barroso, P.; Robina-Ramírez, R. Analysis of consumer awareness of sustainable water consumption by the water footprint concept. Sci. Total Environ. 2018, 721, 137743. [Google Scholar] [CrossRef]
- Arranz, R.; McCartney, M. Application of the Water Evaluation and Planning (WEAP) Model to Assess Future Water Demands and Resources in the Olifants Catchment, South Africa; International Water Management Institute: Colombo, Sri Lanka, 2007; 103 (IWMI Working Paper 116). [Google Scholar]
- Leong, W.K.; Lai, S.H. Application of Water Evaluation and Planning Model for Integrated Water Resources Management: Case Study of Langat River Basin, Malaysia. International Technical Postgraduate Conference. IOP Conf. Ser. Mater. Sci. Eng. 2017, 210, 012024. [Google Scholar] [CrossRef]
- Biswas, A.K.; Tortajada, C.; Izquierdo, R. Water Management in 2020 and Beyond; Springer: Berlin/Heidelberg, Germany, 2009. [Google Scholar] [CrossRef]
- Jain, S.K.; Singh, V.P. Water Resources Systems Planning and Management; Developments in Water Science; Elsevier: Amsterdam, The Netherlands, 2003; Volume 51, 882p. [Google Scholar]
- Boukhari, S.; Djebbar, Y. Les services d’eau potable et d’assainissement face aux exigences du développement durable, cas de la ville de Souk-Ahras. In Proceedings of the Séminaire d’Echange International aux Interfaces du Développement Durable, Bejaïa, Algeria, 21–22 June 2011. [Google Scholar]
- Agathokleous, A.; Christodoulou, S. The impact of intermittent water supply policies on urban water distribution networks. Procedia Eng. 2016, 162, 204–211. [Google Scholar] [CrossRef]
- Koop, S.H.A.; van Leeuwen, C.J. Assessment of the Sustainability of Water Resources Management: A Critical Review of the City Blueprint Approach. Water Resour. Manag. 2015, 29, 5649–5670. [Google Scholar] [CrossRef]
- Colombo, A.F.; Lee, P.; Karney, B.W. A selective literature review of transient-based leak detection methods. J. Hydro-Environ. Res. 2009, 2, 212–227. [Google Scholar] [CrossRef]
- Arasteh, M.A.; Farjami, Y. New Hydro-economic System Dynamics and Agent-based Modeling for Sustainable Urban Groundwater Management: A Case Study of Dehno, Yazd Province, Iran. Sustain. Cities Soc. 2021, 72, 103078. [Google Scholar] [CrossRef]
- Bloetscher, F.; Heimlich, B.; Meeroff, D.E. Development of an adaptation toolbox to protect southeast Florida water supplies from climate change. Environ. Rev. 2011, 19, 397–417. [Google Scholar] [CrossRef]
- Brooks, D.B. An operational definition of water demand management. Int. J. Water Resour. Dev. 2006, 22, 521–528. [Google Scholar] [CrossRef]
- Gleick, P.H. Global freshwater resources: Soft-path solutions for the 21st century. Science 2003, 302, 1524–1528. Available online: http://www.jstor.org/stable/3835774 (accessed on 9 June 2021). [CrossRef] [PubMed]
- Niu, W.J.; Feng, Z.K. Evaluating the performances of several artificial intelligence methods in forecasting daily streamflow time series for sustainable water resources management. Sustain. Cities Soc. 2021, 64, 102562. [Google Scholar]
- Janhunen, E.; Vimpari, J.; Junnila, S. Evaluation of the financial benefits of a ground-source heat pump pool with demand-side management: Is smart profitable for real estate? Sustain. Cities Soc. 2022, 78, 103604. [Google Scholar]
- Liu, Y.; Zhang, Q.; Huang, L. Information Gap-based Scheduling Strategy of a Multi-Energy Retailer with Integrated Demand Response Program. Sustain. Cities Soc. 2021, 78, 103605. [Google Scholar] [CrossRef]
- Pluchinotta, I.; Pagano, A.; Vilcan, T.; Ahilan, S.; Kapetas, L.; Maskrey, S.; Krivtsov, V.; Thorne, C.; O’Donnell, E. A participatory system dynamics model to investigate sustainable urban water management in Ebbsfleet Garden City. Sustain. Cities Soc. 2021, 67, 102709. [Google Scholar]


| UWDC (L/c/d) | Water Saving | User Satisfaction |
|---|---|---|
| 120 | ++++ | + |
| 150 | +++ | ++ |
| 200 | ++ | +++ |
| 250 | + | ++++ |
| Water Resources (m3/d) | Population | Annual Growth Rate (%) | Network Efficiency (%) | UWDC (L/c/d) | |
|---|---|---|---|---|---|
| Groundwater | 13,827 | 298,488 | 1.8 | 52 | 120 |
| Surface water | 22,206 | 65 | 150 | ||
| Desalination | 51,377 | 70 | 200 | ||
| Total | 87,410 | 75 | 250 | ||
| Conventional Water Volume (m3/d) | 17,000 | 36,000 | 65,000 | 100,000 |
|---|---|---|---|---|
| Network efficiency (%) | 52 | 65 | 70 | 75 |
| Urban water demand per capita (UWDC) (L/c/d) | 120 | 150 | 200 | 250 |
| Population in 2050 | 537,779 | |||
| Conventional Water 103 m3/d | Network Efficiency (%) | UWDC (L/c/d) | |||||||||||
| 17 | 36 | 65 | 100 | 52 | 65 | 70 | 75 | 120 | 150 | 200 | 250 | ||
| Scenarios 1 to 16 | Number of scenarios | 1 | 3 | 5 | 7 | 0 | 3 | 5 | 8 | 9 | 6 | 1 | 0 |
| Minimum value | Maximum value | ||||||||||||
| Volume produced m3/d | 86,045 | 143,408 | |||||||||||
| Vol. unconventional m3/d | 0 | 71,556 | |||||||||||
| Production cost M$/year | 22.6 | 45.3 | |||||||||||
| Cost of leaks M$/year | 6.6 | 12.9 | |||||||||||
| Price 1 m3 product $/m3 | 0.72 | 1.11 | |||||||||||
| Price 1 m3 consume. $/m3 | 0.96 | 1.47 | |||||||||||
| Conventional water 103 m3/d | Network efficiency (%) | UWDC (L/c/d) | |||||||||||
| 17 | 36 | 65 | 100 | 52 | 65 | 70 | 75 | 120 | 150 | 200 | 250 | ||
| Scenarios 17 to 32 | Number of scenarios | 1 | 3 | 5 | 7 | 2 | 4 | 5 | 5 | 5 | 4 | 5 | 2 |
| Minimum value | Maximum value | ||||||||||||
| Volume produced m3/d | 92,191 | 179,260 | |||||||||||
| Vol. unconventional m3/d | 24,103 | 114,260 | |||||||||||
| Production cost M$/year | 36.8 | 67.1 | |||||||||||
| Cost of leaks M$/year | 11.0 | 20.6 | |||||||||||
| Price 1 m3 product $/m3 | 0.81 | 1.13 | |||||||||||
| Price 1 m3 consume. $/m3 | 1.24 | 1.82 | |||||||||||
| Conventional water 103 m3/d | Network efficiency (%) | UWDC (L/c/d) | |||||||||||
| 17 | 36 | 65 | 100 | 52 | 65 | 70 | 75 | 120 | 150 | 200 | 250 | ||
| Scenarios 33 to 48 | Number of scenarios | 5 | 5 | 3 | 3 | 4 | 5 | 4 | 3 | 2 | 4 | 5 | 5 |
| Minimum value | Maximum value | ||||||||||||
| Volume produced m3/d | 124,103 | 206,838 | |||||||||||
| Vol. unconventional m3/d | 55,128 | 162,260 | |||||||||||
| Production cost M$/year | 48.0 | 75.5 | |||||||||||
| Cost of leaks M$/year | 15.0 | 27.1 | |||||||||||
| Price 1 m3 product $/m3 | 0.89 | 1.15 | |||||||||||
| Price 1 m3 consume. $/m3 | 1.36 | 2.18 | |||||||||||
| Conventional water 103 m3/d | Network efficiency (%) | UWDC (L/c/d) | |||||||||||
| 17 | 36 | 65 | 100 | 52 | 65 | 70 | 75 | 120 | 150 | 200 | 250 | ||
| Scenarios 49 to 64 | Number of scenarios | 6 | 5 | 3 | 2 | 10 | 4 | 2 | 0 | 6 | 5 | 3 | 2 |
| Minimum value | Maximum value | ||||||||||||
| Volume produced m3/d | 155,128 | 258,547 | |||||||||||
| Vol. unconventional m3/d | 106,838 | 241,547 | |||||||||||
| Production cost M$/year | 61.6 | 110.3 | |||||||||||
| Cost of leaks M$/year | 23.3 | 52.9 | |||||||||||
| Price 1 m3 product $/m3 | 0.97 | 1.17 | |||||||||||
| Price 1 m3 consume. $/m3 | 1.59 | 2.25 | |||||||||||
| Scenario Number | 1 | 9 | 17 | 34 | 51 | 63 | 64 |
|---|---|---|---|---|---|---|---|
| Network efficiency (%) | 75 | 75 | 70 | 65 | 65 | 52 | 52 |
| UWDC (L/c/d) | 120 | 120 | 200 | 150 | 250 | 250 | 250 |
| Volume of water produced (m3/d) | 86,045 | 86,045 | 153,651 | 124,103 | 206,838 | 258,547 | 258,547 |
| Conventional water volume (m3/d) | 100,000 | 36,000 | 100,000 | 36,000 | 65,000 | 36,000 | 17,000 |
| Unconventional water volume (m3/d) | 0 | 50,045 | 53,651 | 88,103 | 141,838 | 222,547 | 241,547 |
| Production cost (M$/year) | 22.6 | 31.4 | 49.8 | 48.0 | 79.2 | 106.9 | 110.3 |
| Cost of leaks (M$/year) | 6.6 | 7.8 | 14.9 | 16.8 | 27.7 | 51.3 | 52.9 |
| Price 1 m3 produced ($/m3) | 0.72 | 1.00 | 0.89 | 1.06 | 1.05 | 1.13 | 1.17 |
| Price 1 m3 consumed ($/m3) | 0.96 | 1.33 | 1.27 | 1.63 | 1.61 | 2.18 | 2.25 |
Disclaimer/Publisher’s Note: The statements, opinions and data contained in all publications are solely those of the individual author(s) and contributor(s) and not of MDPI and/or the editor(s). MDPI and/or the editor(s) disclaim responsibility for any injury to people or property resulting from any ideas, methods, instructions or products referred to in the content. |
© 2023 by the authors. Licensee MDPI, Basel, Switzerland. This article is an open access article distributed under the terms and conditions of the Creative Commons Attribution (CC BY) license (https://creativecommons.org/licenses/by/4.0/).
Share and Cite
Bessedik, M.; Abdelbaki, C.; Tiar, S.M.; Badraoui, A.; Megnounif, A.; Goosen, M.; Mourad, K.A.; Baig, M.B.; Alataway, A. Strategic Decision-Making in Sustainable Water Management Using Demand Analysis and the Water Evaluation and Planning Model. Sustainability 2023, 15, 16083. https://doi.org/10.3390/su152216083
Bessedik M, Abdelbaki C, Tiar SM, Badraoui A, Megnounif A, Goosen M, Mourad KA, Baig MB, Alataway A. Strategic Decision-Making in Sustainable Water Management Using Demand Analysis and the Water Evaluation and Planning Model. Sustainability. 2023; 15(22):16083. https://doi.org/10.3390/su152216083
Chicago/Turabian StyleBessedik, Madani, Chérifa Abdelbaki, Sidi Mohamed Tiar, Abderrahim Badraoui, Abdesselam Megnounif, Mattheus Goosen, Khaldoon A. Mourad, Mirza Barjees Baig, and Abed Alataway. 2023. "Strategic Decision-Making in Sustainable Water Management Using Demand Analysis and the Water Evaluation and Planning Model" Sustainability 15, no. 22: 16083. https://doi.org/10.3390/su152216083