
Integration of Energy Simulations and Life Cycle Assessment in Building Refurbishment: An Affordability Comparison of Thermal Insulation Materials through a New Sustainability Index


Abstract
1. Introduction
2. Materials and Methods
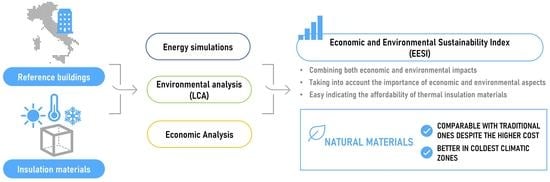
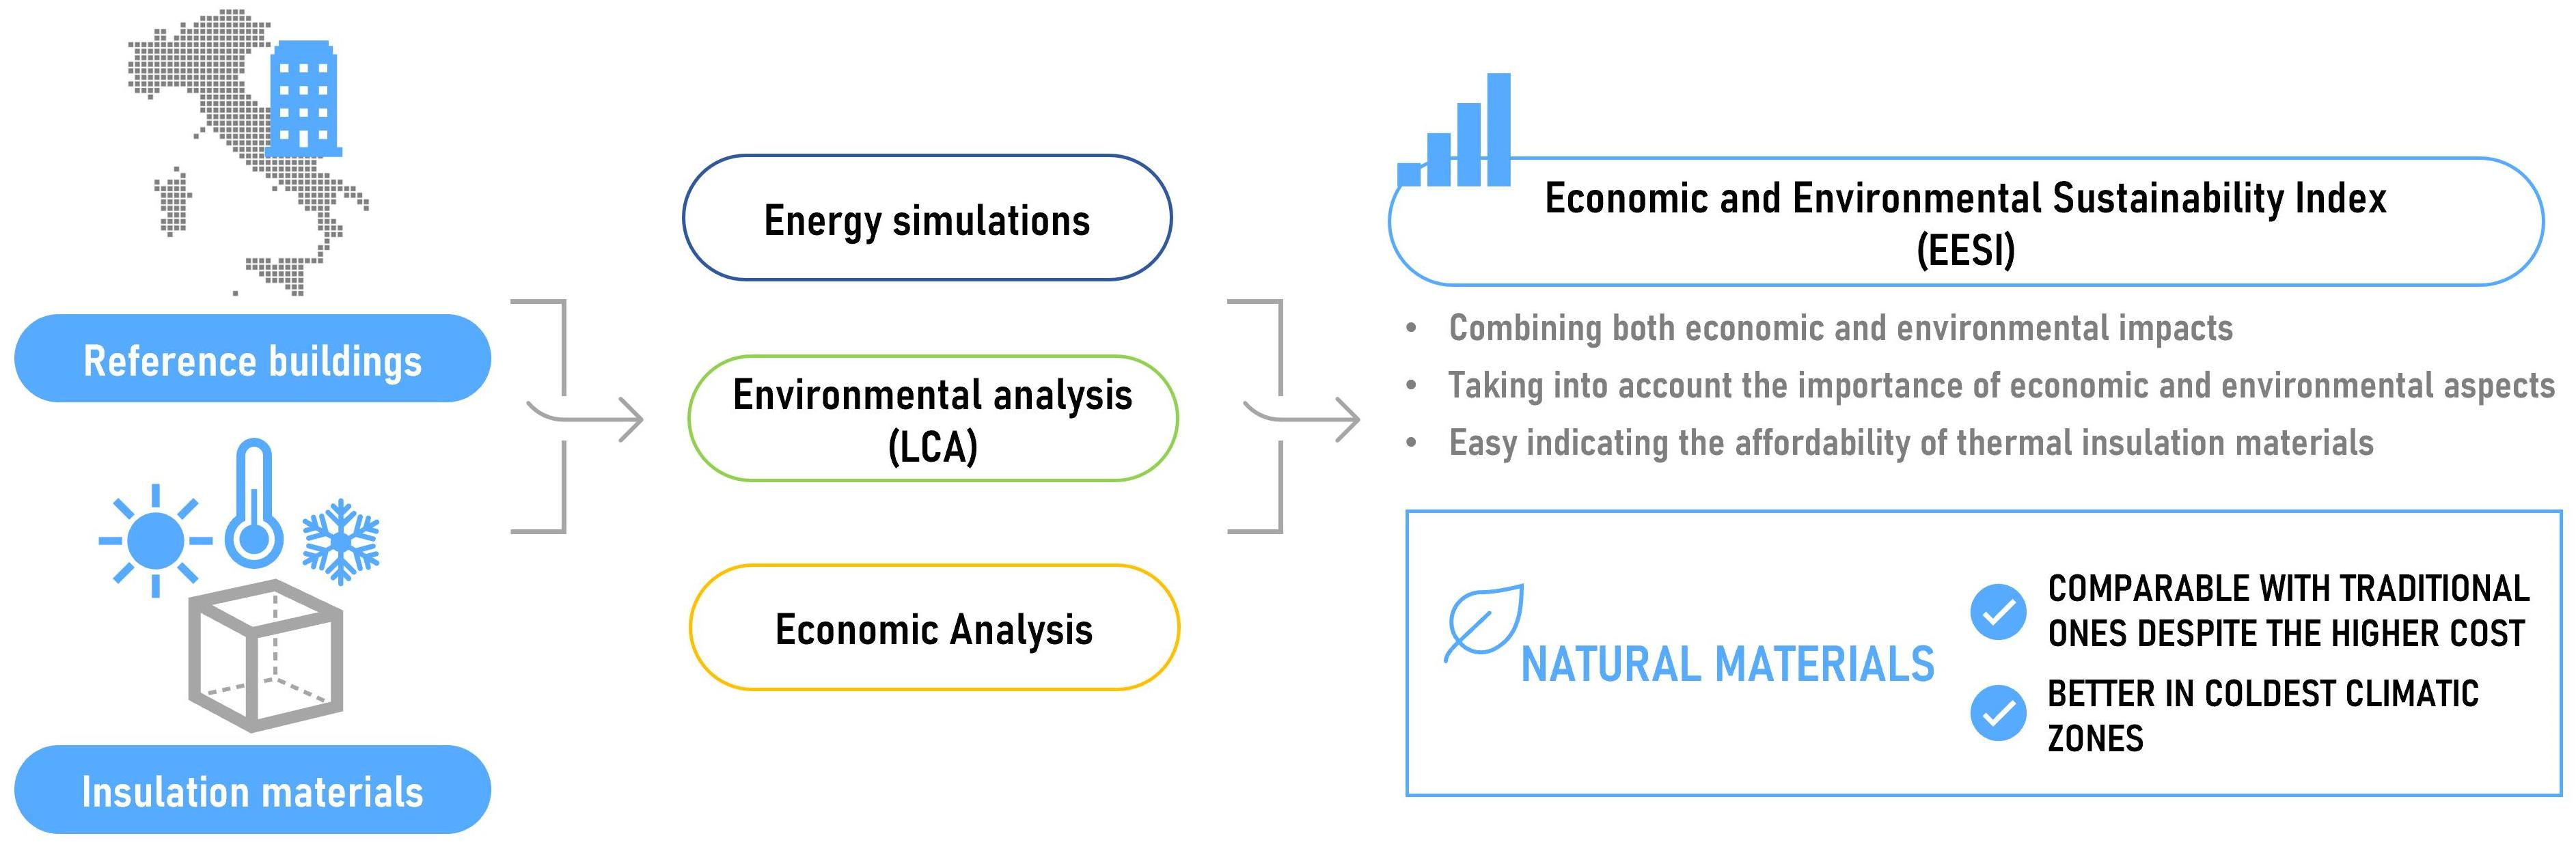
2.1. Research Procedure
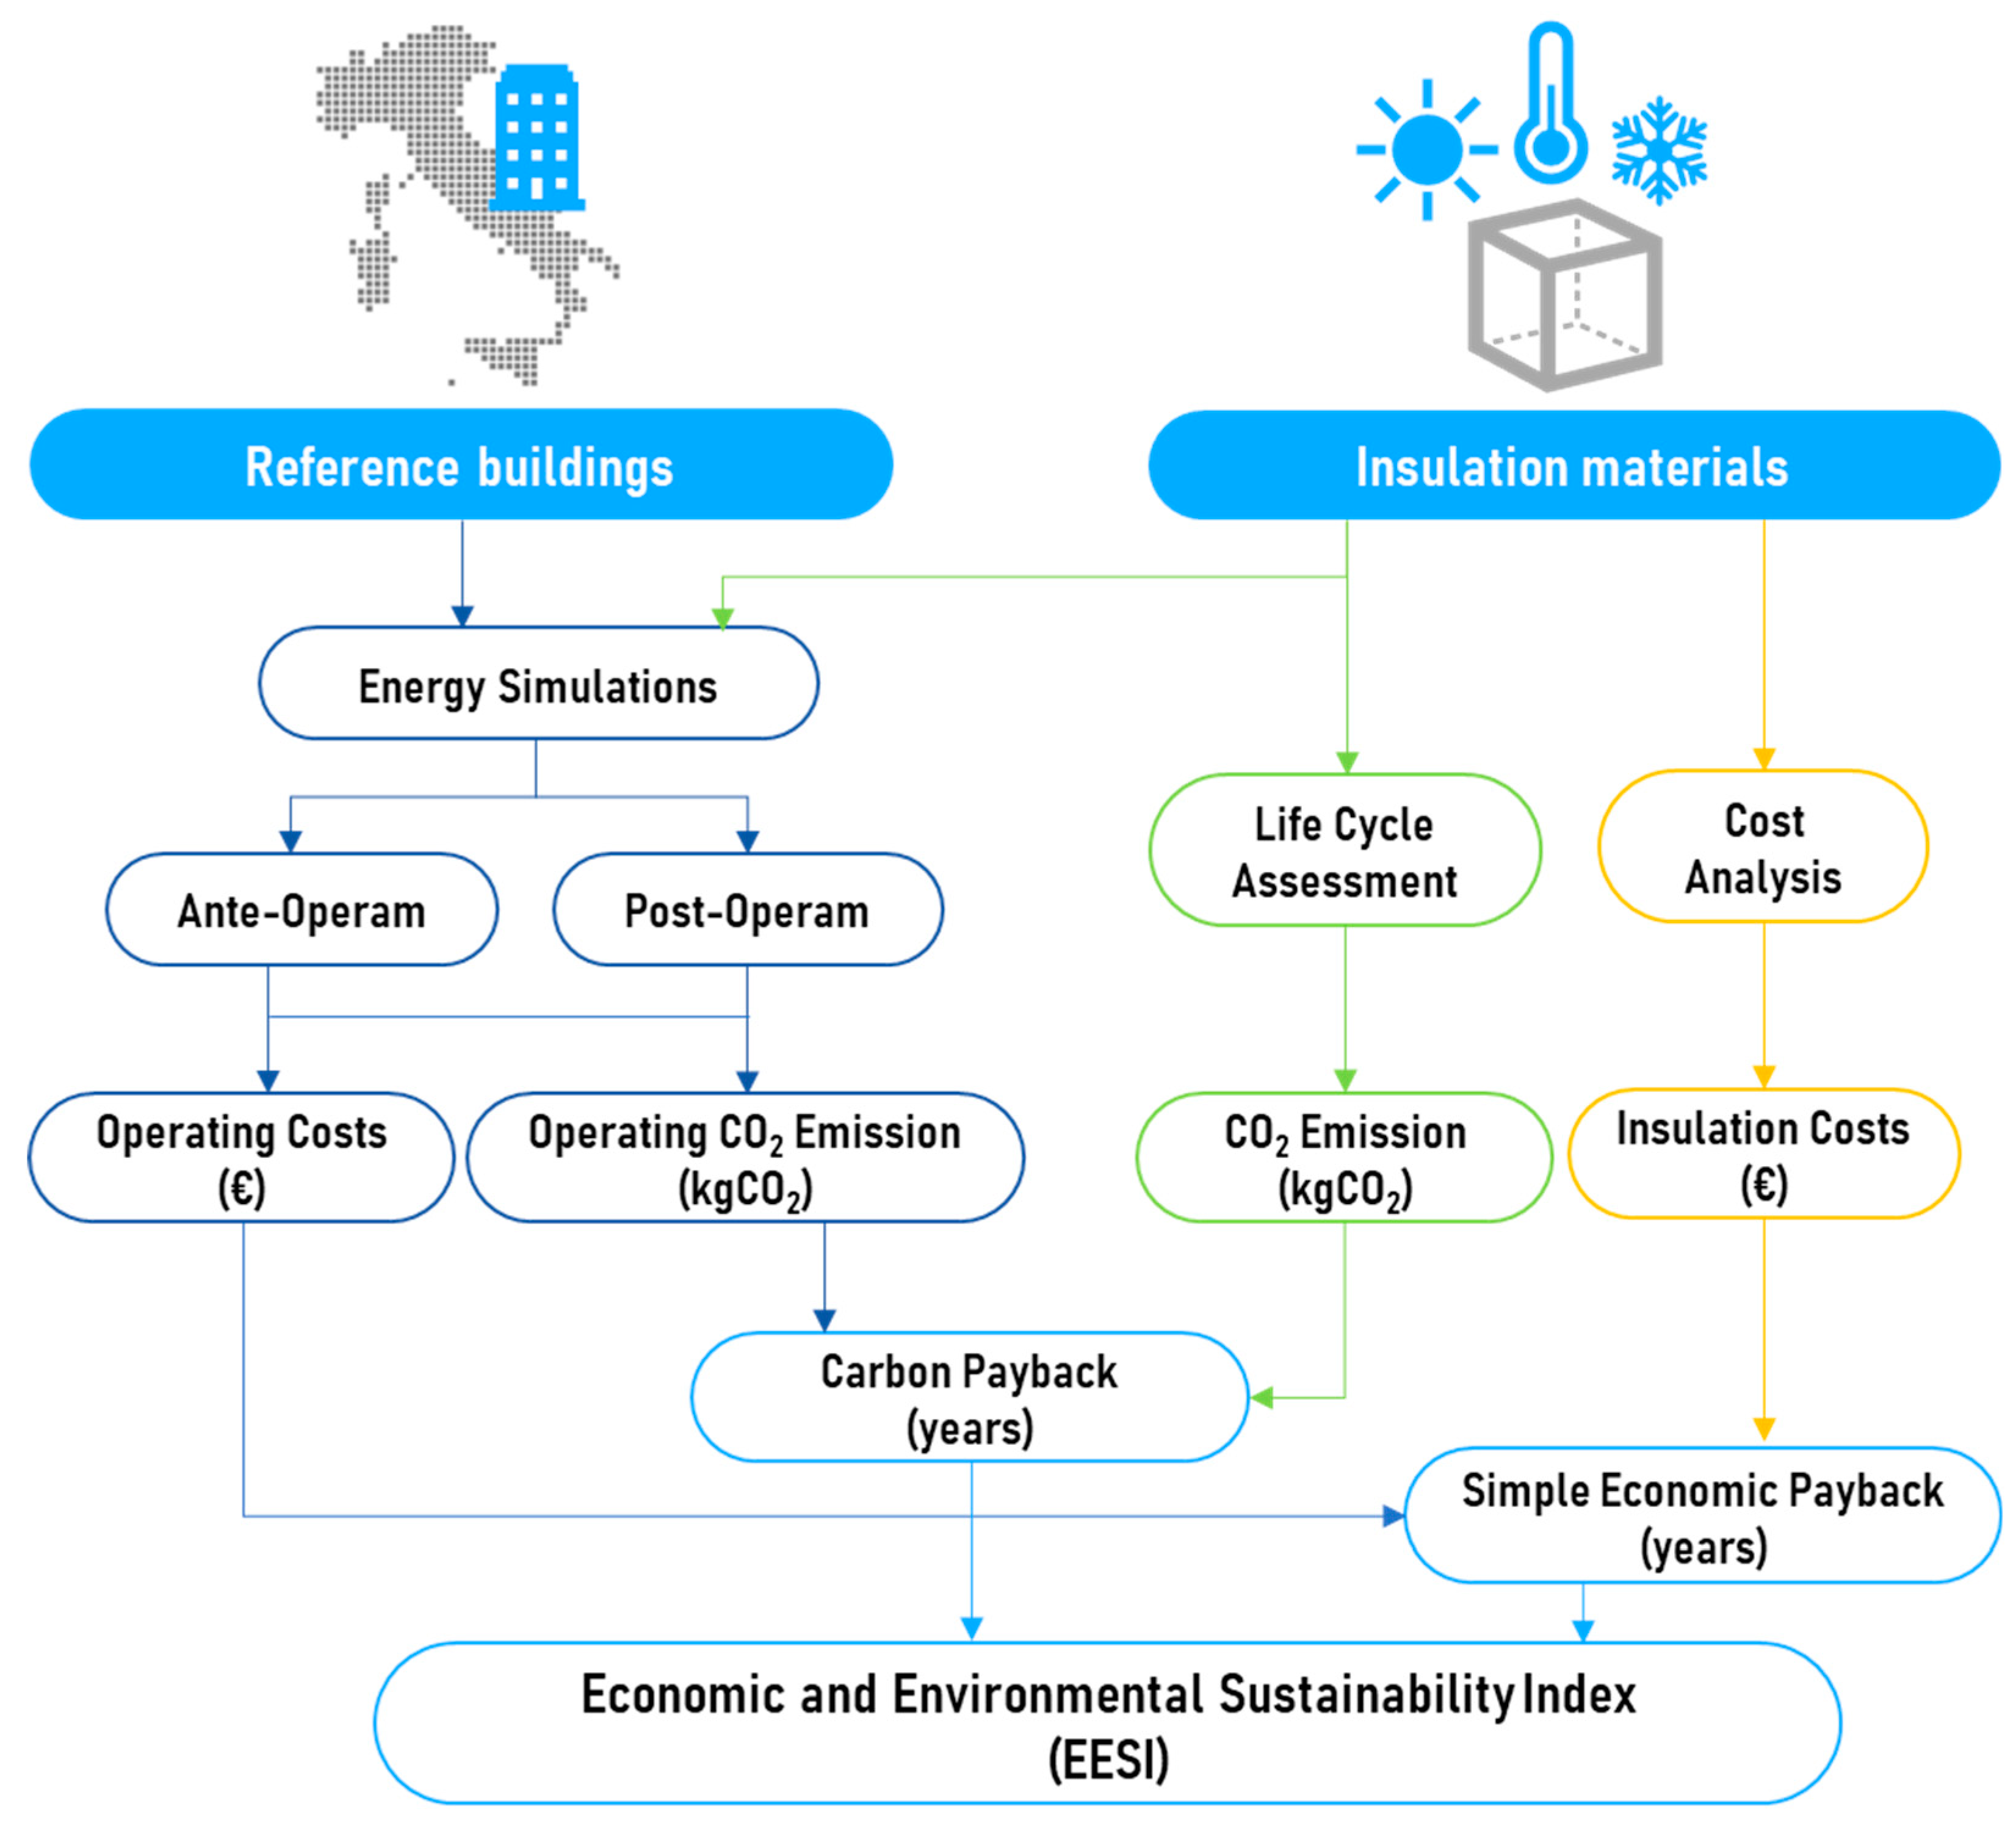
2.2. Reference Buildings Definition and Energy Simulations
2.3. Economic Analysis
2.4. Environmental Analysis
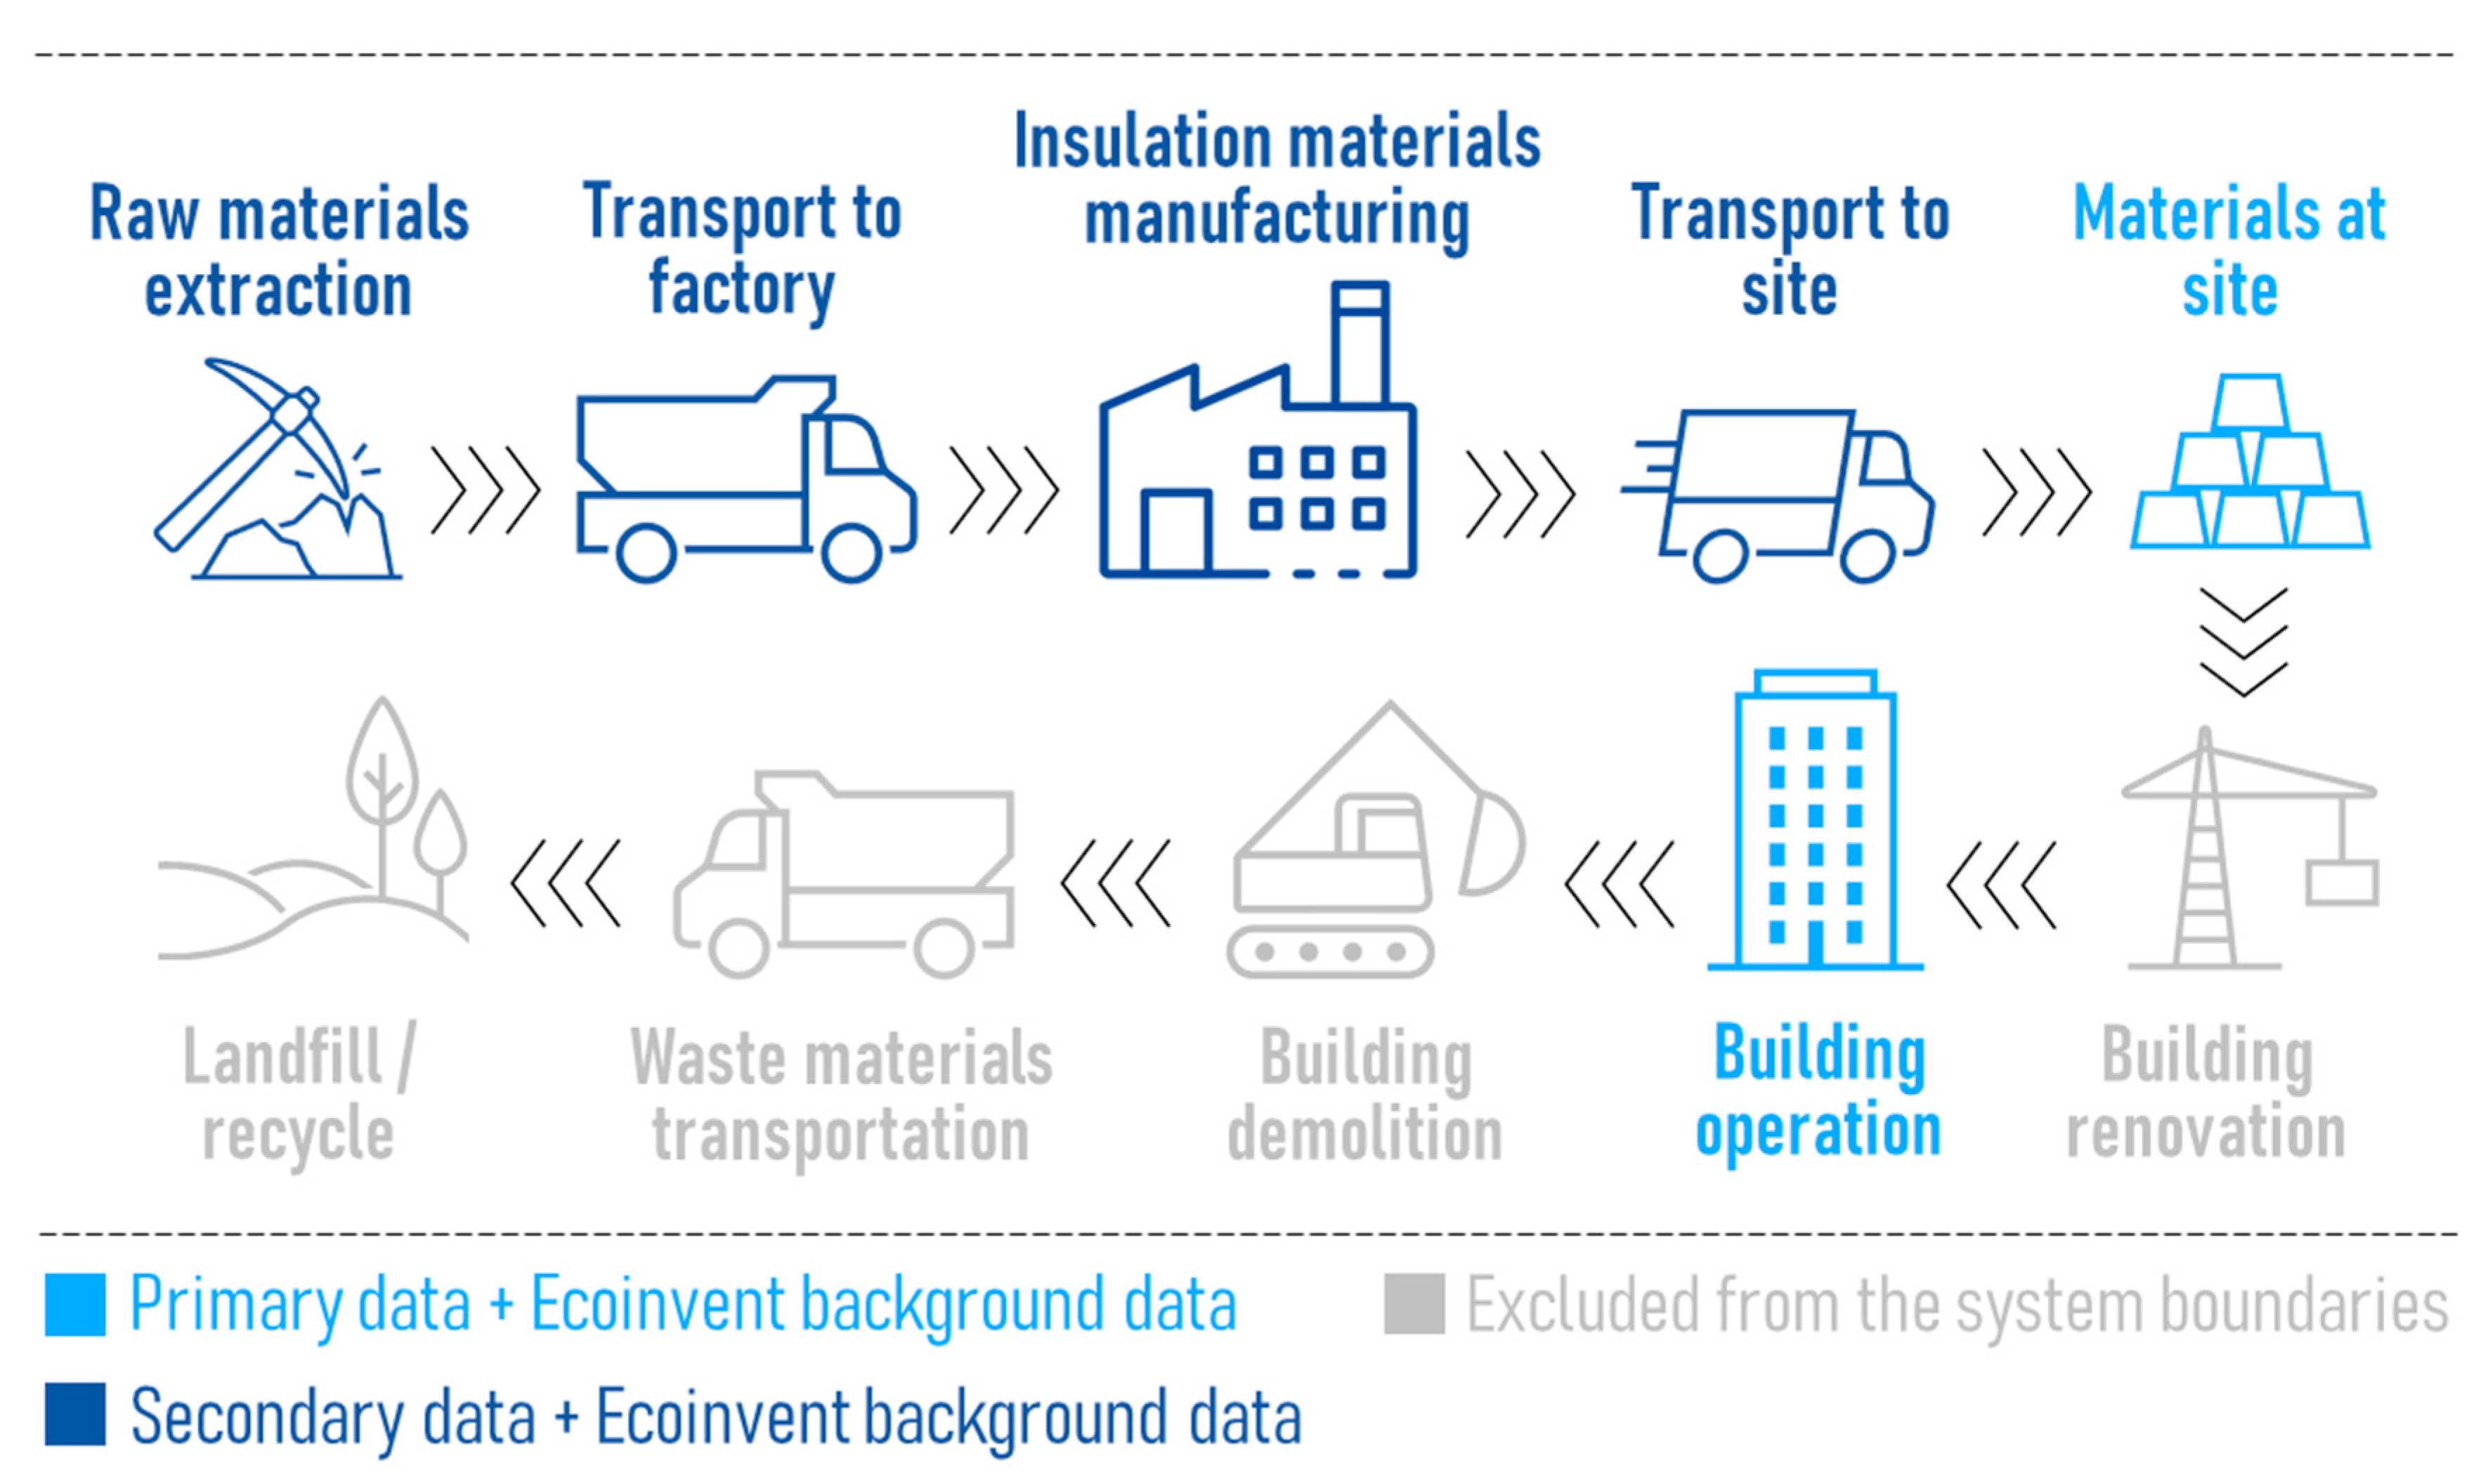
- Goal and scope definition: the goal of this research was to perform a comparative LCA of different materials generally used for external thermal insulation of buildings, in order to highlight their life cycle environmental impacts in the various climatic zones of the Italian territory and, therefore, to enable the identification of the ones to be recommended for the environmentally friendly renovation of buildings in each of these zones. The considered conventional and natural materials are the ones described in the previous sections. All the “downstream” phases of the building life cycle were excluded from the system boundaries since, due to the expected long life of the insulation materials and the building itself after refurbishment, they are considered not relevant for the aim of the study, while among the “upstream” phases, the building refurbishment activities (including all the related materials, such as for instance anchoring systems and plaster) were neglected since they can be considered comparable for all the studied insulation materials (Figure 4). Since taking into account the desired function and the different physical properties of the materials is crucial for a proper comparison, the choice of the functional unit (FU) is particularly relevant to limit the uncertainty and avoid inaccurate/not reliable/not understandable results [39]. The FU was therefore defined as 1 m2 of the wall surface with a thermal transmittance compliant with the Italian legal limit for the reference climatic zone;
- Life cycle inventory (LCI): both primary and secondary inventory data, coupled with the background dataset of the Ecoinvent v3.8 [40] included in the SimaPro v9.3 software [41], were used to carry out the study. In particular, data regarding the materials flows as well as data resulting from energy modeling referred to the selected FU were used as primary LCI data, while secondary data were used for all the other phases/processes included in the system boundaries (Figure 4);
- Life cycle impact assessment (LCIA): the environmental impacts associated with the investigated materials were evaluated focusing on the climate change impact category, using the Intergovernmental Panel on Climate Change (IPCC) 2021 method [42,43] and thus expressing their significance in terms of carbon dioxide equivalents (CO2eq).
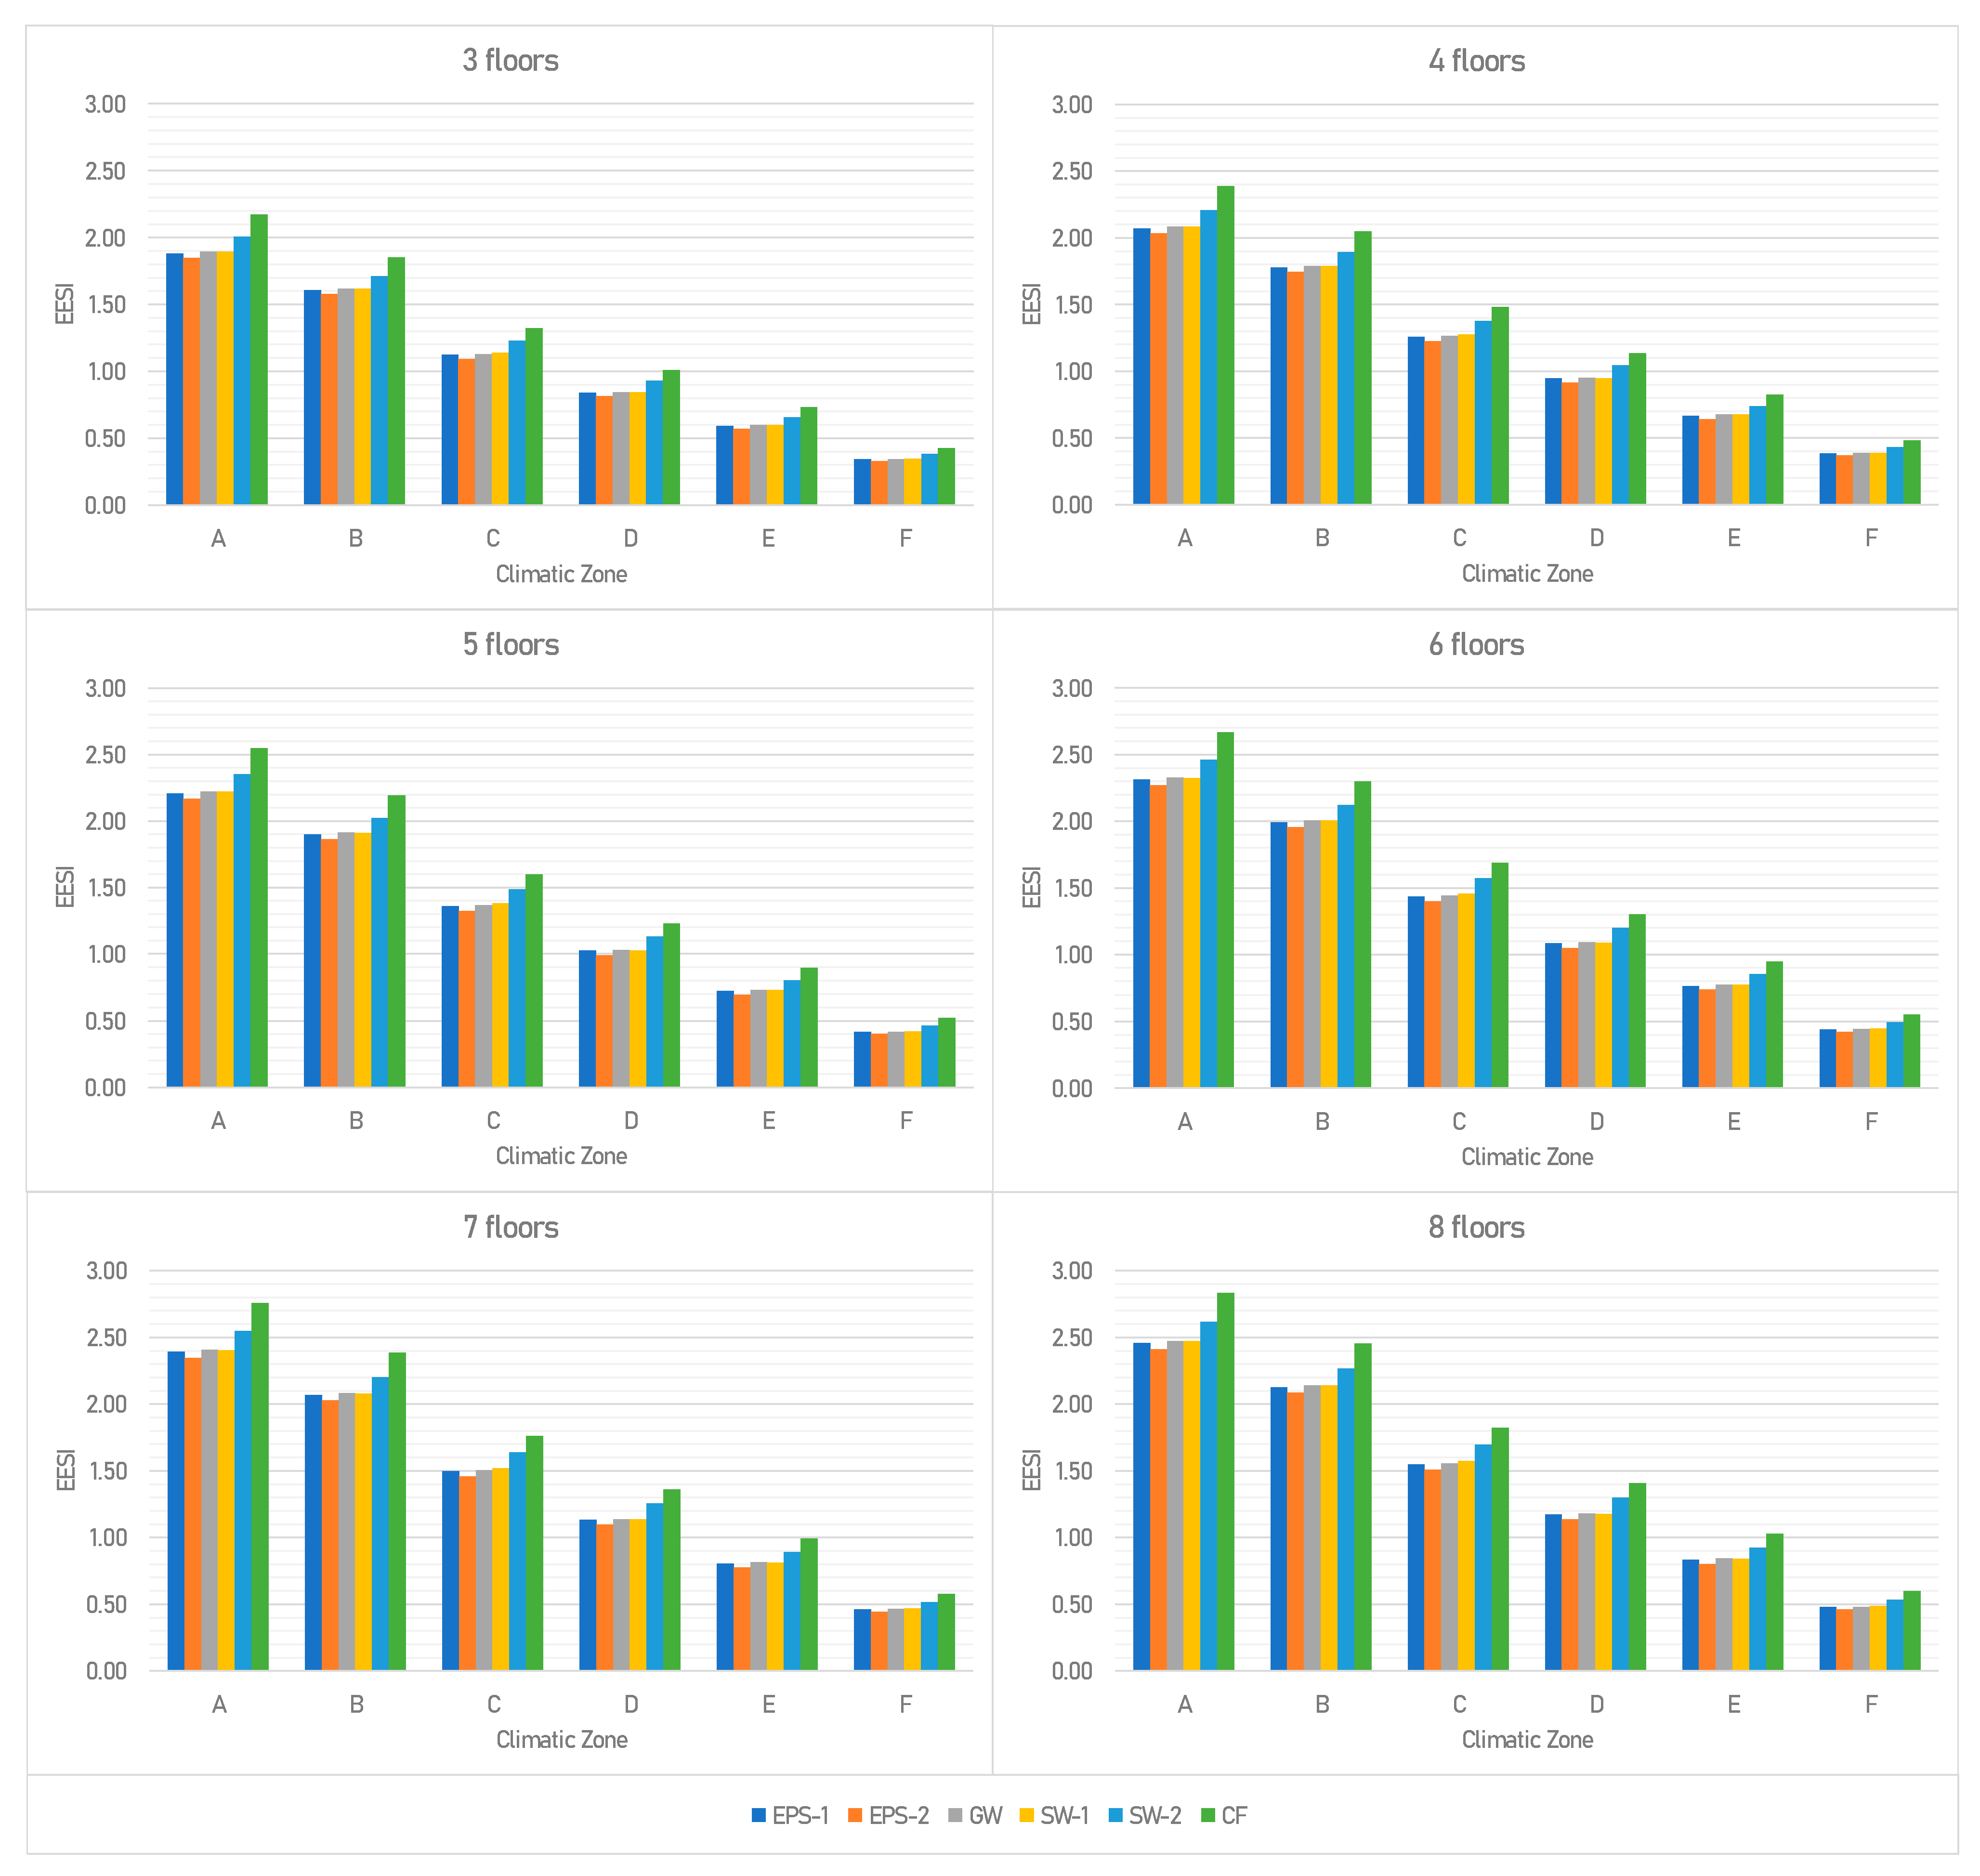
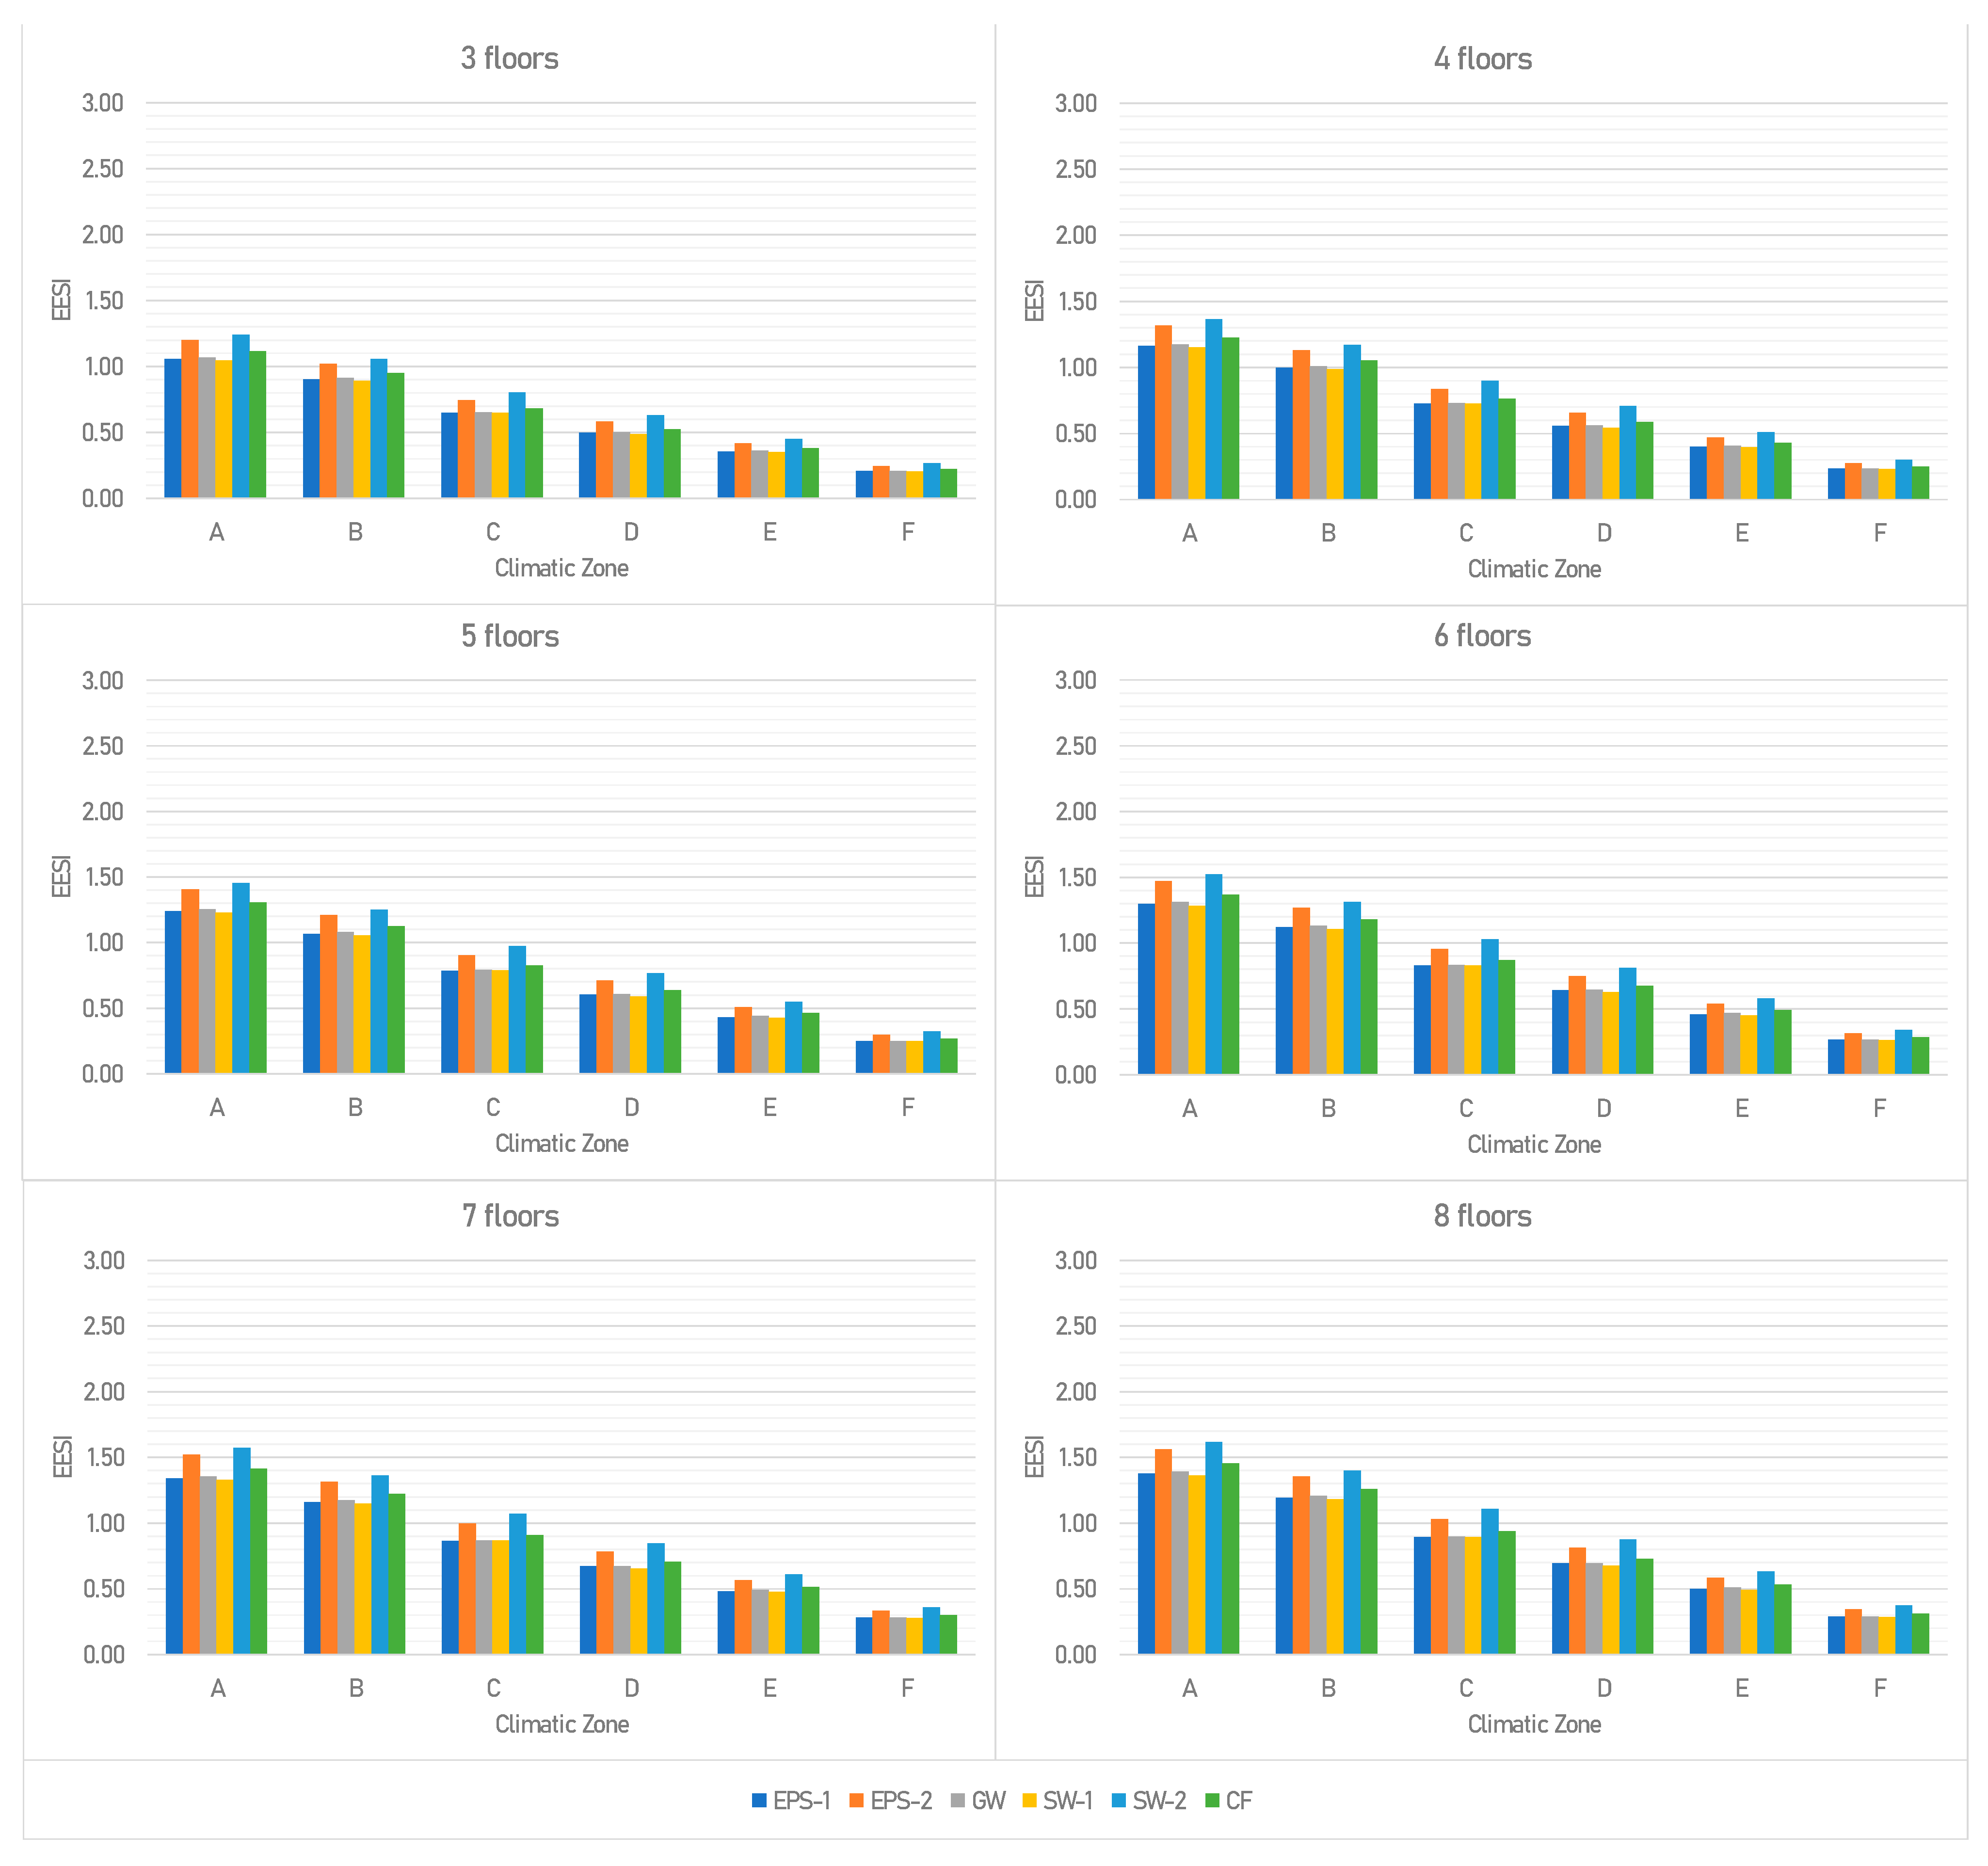
2.5. Economic and Environmental Sustainability Index (EESI)
3. Results and Discussion
- Scenario 1: This scenario represents the current situation when insulation materials are chosen, i.e., at the same energy performance of buildings, the choice is solely based on economic considerations. Therefore, in this scenario wEPBT was set equal to 1 and wCPBT equal to 0;
- Scenario 2: This represents the ideal conditions, i.e., at the same energy performance of buildings, the choice depends on both economic and environmental aspects. Therefore, in this ideal scenario, wEPBT was set equal to 0.5 and wCPBT equal to 0.5.
4. Conclusions
Author Contributions
Funding
Institutional Review Board Statement
Informed Consent Statement
Data Availability Statement
Acknowledgments
Conflicts of Interest
Nomenclature
| ARERA | Italian Regulatory Authority for Energy, Networks, and Environment |
| BU | Building units |
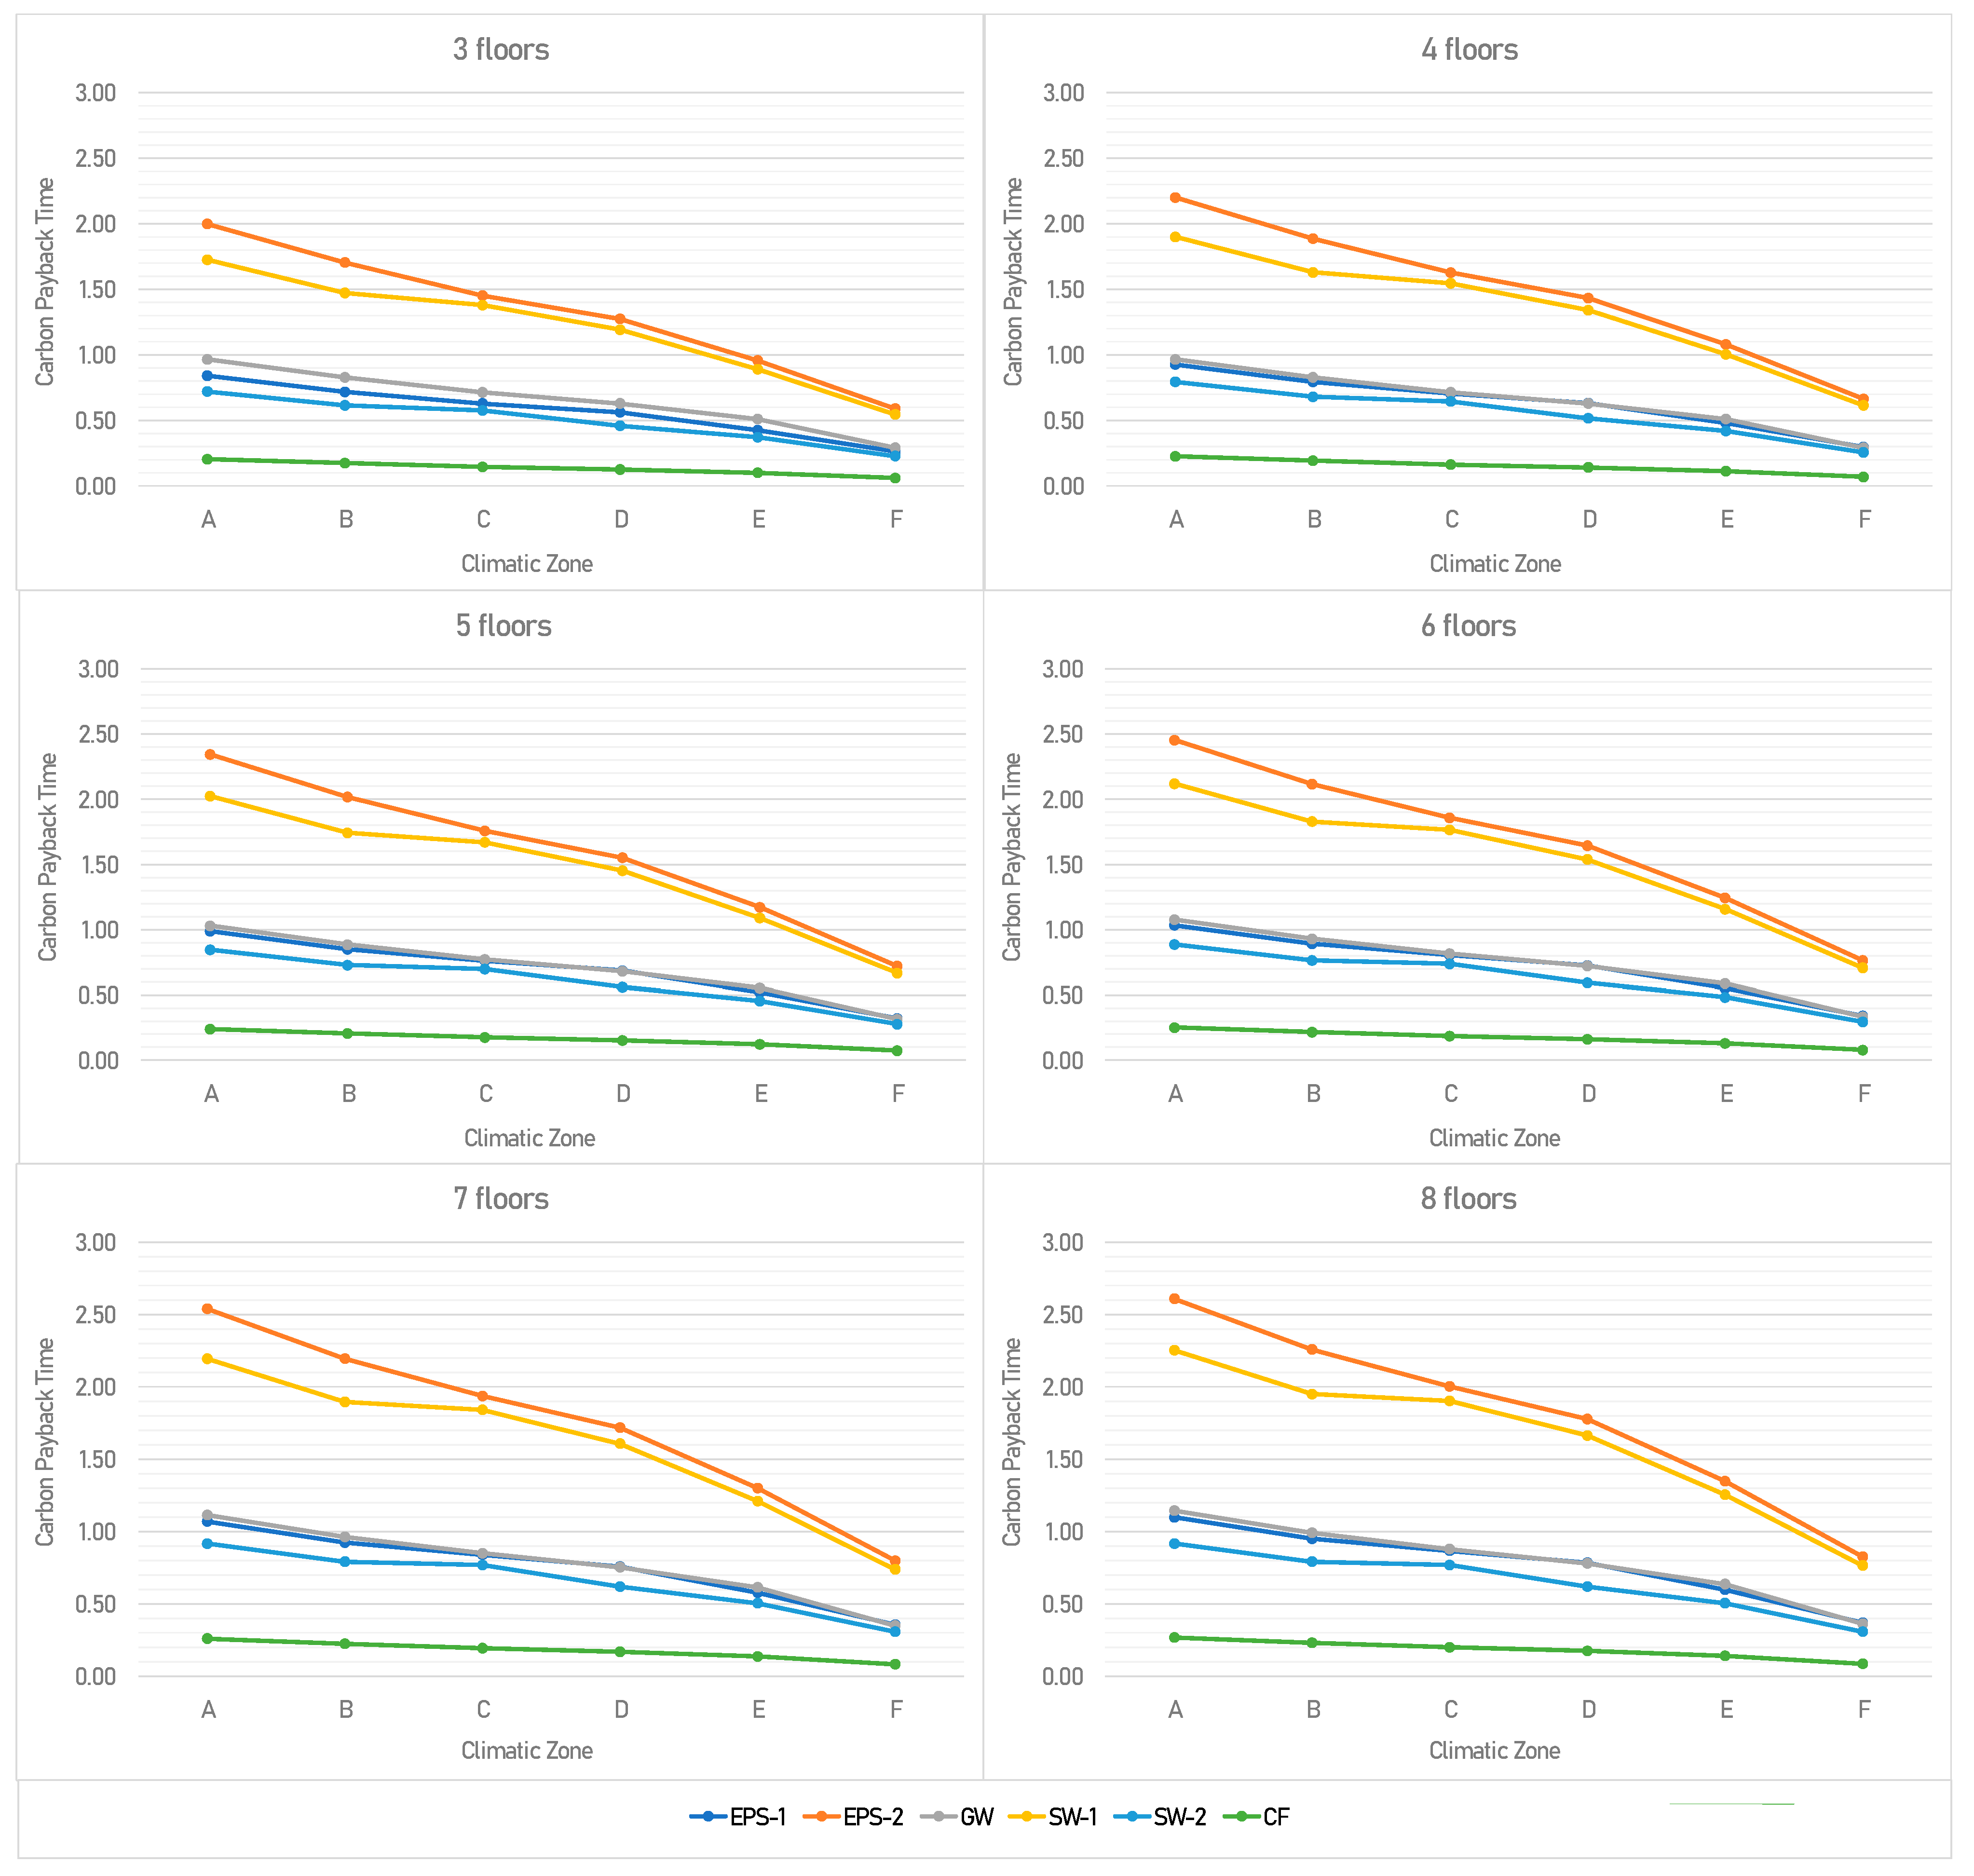
| CPBT | Carbon payback time |
| CF | Cellulose fiber |
| DPR | Decree of President of Republic |
| EESI | Economic and Environmental Sustainability Index |
| ENEA | Italian National Agency for new Technology Energy and Sustainable Economic Development |
| EPBT | Economic payback time |
| EPC | Energy Performance Certificate |
| EPS | Polystyrene foam slab |
| FU | Functional unit |
| GHG | Greenhouse gas |
| GW | Glass wool |
| HDD | Heating degree days |
| HVAC | Heating ventilation air conditioning |
| IEA | International Energy Agency |
| LCA | Life cycle assessment |
| MFH | Multi-family house |
| s | Thickness |
| SIAPE | Informative System on Energy Performance Certificates |
| SW | Stone wool |
| w | weight |
| XPS | Extruded expanded polystyrene |
| λ | Thermal conductivity |
| ρ | Density |
Appendix A

| Materials (-) | Climatic Zone (-) | Gas Natural Consumption per Gross Dispersant Surface (Sm3/m2) | |||||||||||
|---|---|---|---|---|---|---|---|---|---|---|---|---|---|
| Ante-Operam | Post-Operam | ||||||||||||
| 3 | 4 | 5 | 6 | 7 | 8 | 3 | 4 | 5 | 6 | 7 | 8 | ||
| EPS-1 | A | 17.8 | 15.8 | 14.5 | 13.7 | 13.1 | 12.6 | 4.5 | 3.7 | 3.2 | 2.9 | 2.6 | 2.4 |
| B | 21.3 | 18.9 | 17.4 | 16.3 | 15.6 | 15.1 | 5.7 | 4.8 | 4.2 | 3.8 | 3.5 | 3.3 | |
| C | 30.4 | 26.9 | 24.8 | 23.3 | 22.3 | 21.5 | 7.5 | 6.5 | 5.9 | 5.4 | 5.1 | 4.9 | |
| D | 40.4 | 35.8 | 33.0 | 31.0 | 29.7 | 28.6 | 9.1 | 8.0 | 7.3 | 6.8 | 6.4 | 6.2 | |
| E | 57.5 | 51.0 | 47.0 | 44.3 | 42.4 | 40.9 | 12.4 | 11.0 | 10.1 | 9.6 | 9.2 | 8.9 | |
| F | 98.5 | 87.4 | 80.5 | 75.9 | 72.6 | 70.0 | 19.6 | 17.3 | 15.9 | 15.0 | 14.3 | 13.8 | |
| EPS-2 | A | 18.0 | 15.9 | 14.6 | 13.8 | 13.2 | 12.7 | 4.6 | 3.7 | 3.2 | 2.9 | 2.6 | 2.4 |
| B | 21.5 | 19.0 | 17.5 | 16.5 | 15.7 | 15.2 | 5.8 | 4.8 | 4.2 | 3.8 | 3.5 | 3.3 | |
| C | 30.6 | 27.1 | 25.0 | 23.5 | 22.5 | 21.7 | 7.6 | 6.5 | 5.9 | 5.5 | 5.2 | 4.9 | |
| D | 40.7 | 36.1 | 33.2 | 31.3 | 29.9 | 28.8 | 9.2 | 8.0 | 7.3 | 6.8 | 6.5 | 6.2 | |
| E | 57.9 | 51.4 | 47.4 | 44.6 | 42.7 | 41.2 | 12.4 | 11.1 | 10.2 | 9.6 | 9.2 | 8.9 | |
| F | 99.2 | 88.0 | 81.1 | 76.5 | 73.1 | 70.6 | 19.8 | 17.5 | 16.1 | 15.1 | 14.4 | 13.9 | |
| GW | A | 17.8 | 15.7 | 14.5 | 13.7 | 13.0 | 12.6 | 4.5 | 3.7 | 3.2 | 2.8 | 2.6 | 2.4 |
| B | 21.3 | 18.8 | 17.3 | 16.3 | 15.6 | 15.0 | 5.7 | 4.8 | 4.2 | 3.8 | 3.5 | 3.3 | |
| C | 30.3 | 26.8 | 24.7 | 23.3 | 22.2 | 21.4 | 7.5 | 6.5 | 5.8 | 5.4 | 5.1 | 4.9 | |
| D | 40.3 | 35.7 | 32.9 | 31.0 | 29.6 | 28.5 | 9.1 | 7.9 | 7.2 | 6.8 | 6.4 | 6.2 | |
| E | 57.3 | 50.9 | 46.9 | 44.2 | 42.3 | 40.8 | 12.3 | 11.0 | 10.1 | 9.5 | 9.1 | 8.8 | |
| F | 98.2 | 87.1 | 80.3 | 75.7 | 72.4 | 69.9 | 19.6 | 17.3 | 15.9 | 14.9 | 14.3 | 13.7 | |
| SW-1 | A | 17.8 | 15.7 | 14.5 | 13.6 | 13.0 | 12.6 | 4.5 | 3.7 | 3.2 | 2.8 | 2.6 | 2.4 |
| B | 21.3 | 18.8 | 17.3 | 16.3 | 15.6 | 15.0 | 5.7 | 4.8 | 4.2 | 3.8 | 3.5 | 3.3 | |
| C | 30.3 | 26.8 | 24.7 | 23.2 | 22.2 | 21.4 | 7.5 | 6.5 | 5.8 | 5.4 | 5.1 | 4.9 | |
| D | 40.3 | 35.7 | 32.8 | 30.9 | 29.5 | 28.5 | 9.1 | 7.9 | 7.2 | 6.8 | 6.4 | 6.2 | |
| E | 57.3 | 50.8 | 46.8 | 44.1 | 42.2 | 40.7 | 12.3 | 10.9 | 10.1 | 9.5 | 9.1 | 8.8 | |
| F | 98.1 | 87.0 | 80.2 | 75.6 | 72.3 | 69.8 | 19.6 | 17.3 | 15.9 | 14.9 | 14.2 | 13.7 | |
| SW-2 | A | 17.8 | 15.7 | 14.5 | 13.6 | 13.0 | 12.6 | 4.5 | 3.7 | 3.2 | 2.8 | 2.6 | 2.4 |
| B | 21.3 | 18.8 | 17.3 | 16.3 | 15.6 | 15.0 | 5.7 | 4.8 | 4.2 | 3.8 | 3.5 | 3.3 | |
| C | 30.3 | 26.8 | 24.7 | 23.2 | 22.2 | 21.4 | 7.5 | 6.5 | 5.8 | 5.4 | 5.1 | 4.9 | |
| D | 40.3 | 35.7 | 32.8 | 30.9 | 29.5 | 28.5 | 9.1 | 7.9 | 7.2 | 6.8 | 6.4 | 6.2 | |
| E | 57.3 | 50.8 | 46.8 | 44.1 | 42.2 | 40.7 | 12.3 | 10.9 | 10.1 | 9.5 | 9.1 | 8.8 | |
| F | 98.1 | 87.0 | 80.2 | 75.6 | 72.3 | 69.8 | 19.6 | 17.3 | 15.9 | 14.9 | 14.2 | 13.7 | |
| CF | A | 17.7 | 15.7 | 14.5 | 13.6 | 13.0 | 12.5 | 4.5 | 3.7 | 3.2 | 2.8 | 2.6 | 2.4 |
| B | 21.2 | 18.8 | 17.3 | 16.3 | 15.5 | 15.0 | 5.7 | 4.8 | 4.2 | 3.8 | 3.5 | 3.3 | |
| C | 30.2 | 26.8 | 24.7 | 23.2 | 22.2 | 21.4 | 7.5 | 6.5 | 5.8 | 5.4 | 5.1 | 4.9 | |
| D | 40.2 | 35.6 | 32.8 | 30.9 | 29.5 | 28.5 | 9.1 | 7.9 | 7.2 | 6.8 | 6.4 | 6.2 | |
| E | 57.2 | 50.7 | 46.8 | 44.1 | 42.1 | 40.7 | 12.3 | 10.9 | 10.1 | 9.5 | 9.1 | 8.8 | |
| F | 98.0 | 86.9 | 80.1 | 75.5 | 72.2 | 69.7 | 19.5 | 17.3 | 15.9 | 14.9 | 14.2 | 13.7 | |
| Materials (-) | Climatic Zone (-) | Electric Energy Consumption per Gross Dispersant Surface (kWh/m2) | |||||||||||
|---|---|---|---|---|---|---|---|---|---|---|---|---|---|
| Ante-Operam | Post-Operam | ||||||||||||
| 3 | 4 | 5 | 6 | 7 | 8 | 3 | 4 | 5 | 6 | 7 | 8 | ||
| EPS-1 | A | 37.1 | 32.9 | 30.3 | 28.5 | 27.2 | 26.3 | 9.4 | 7.7 | 6.7 | 5.9 | 5.4 | 5.0 |
| B | 44.4 | 39.3 | 36.2 | 34.0 | 32.5 | 31.3 | 11.9 | 9.9 | 8.7 | 7.9 | 7.3 | 6.8 | |
| C | 63.3 | 56.0 | 51.6 | 48.6 | 46.4 | 44.8 | 15.6 | 13.5 | 12.2 | 11.3 | 10.7 | 10.2 | |
| D | 84.1 | 74.5 | 68.6 | 64.6 | 61.8 | 59.6 | 19.0 | 16.6 | 15.1 | 14.1 | 13.4 | 12.9 | |
| E | 119.6 | 106.1 | 97.9 | 92.2 | 88.2 | 85.1 | 25.7 | 22.9 | 21.1 | 19.9 | 19.1 | 18.4 | |
| F | 205.0 | 181.9 | 167.7 | 158.0 | 151.1 | 145.8 | 40.9 | 36.1 | 33.2 | 31.2 | 29.8 | 28.7 | |
| EPS-2 | A | 37.4 | 33.1 | 30.5 | 28.7 | 27.4 | 26.5 | 9.5 | 7.8 | 6.7 | 6.0 | 5.5 | 5.1 |
| B | 44.7 | 39.6 | 36.4 | 34.3 | 32.8 | 31.6 | 12.0 | 10.0 | 8.8 | 7.9 | 7.3 | 6.9 | |
| C | 63.8 | 56.5 | 52.0 | 48.9 | 46.8 | 45.1 | 15.7 | 13.6 | 12.3 | 11.4 | 10.8 | 10.3 | |
| D | 84.8 | 75.1 | 69.1 | 65.1 | 62.2 | 60.0 | 19.1 | 16.7 | 15.2 | 14.2 | 13.5 | 13.0 | |
| E | 120.5 | 107.0 | 98.6 | 93.0 | 88.9 | 85.8 | 25.9 | 23.0 | 21.3 | 20.1 | 19.2 | 18.6 | |
| F | 206.6 | 183.3 | 168.9 | 159.2 | 152.2 | 147.0 | 41.2 | 36.4 | 33.4 | 31.4 | 30.0 | 28.9 | |
| GW | A | 37.0 | 32.8 | 30.2 | 28.4 | 27.1 | 26.2 | 9.4 | 7.7 | 6.6 | 5.9 | 5.4 | 5.0 |
| B | 44.3 | 39.2 | 36.1 | 34.0 | 32.4 | 31.3 | 11.9 | 9.9 | 8.7 | 7.9 | 7.3 | 6.8 | |
| C | 63.1 | 55.9 | 51.5 | 48.5 | 46.3 | 44.6 | 15.6 | 13.5 | 12.2 | 11.3 | 10.7 | 10.2 | |
| D | 83.9 | 74.3 | 68.5 | 64.5 | 61.6 | 59.4 | 18.9 | 16.5 | 15.1 | 14.1 | 13.4 | 12.8 | |
| E | 119.3 | 105.9 | 97.6 | 92.0 | 88.0 | 84.9 | 25.7 | 22.8 | 21.1 | 19.9 | 19.0 | 18.4 | |
| F | 204.5 | 181.4 | 167.2 | 157.6 | 150.7 | 145.5 | 40.8 | 36.0 | 33.1 | 31.1 | 29.7 | 28.6 | |
| SW-1 | A | 37.0 | 32.8 | 30.1 | 28.4 | 27.1 | 26.2 | 9.4 | 7.7 | 6.6 | 5.9 | 5.4 | 5.0 |
| B | 44.2 | 39.2 | 36.0 | 33.9 | 32.4 | 31.2 | 11.9 | 9.9 | 8.7 | 7.9 | 7.3 | 6.8 | |
| C | 63.0 | 55.8 | 51.4 | 48.4 | 46.2 | 44.6 | 15.6 | 13.5 | 12.2 | 11.3 | 10.7 | 10.2 | |
| D | 83.8 | 74.2 | 68.4 | 64.4 | 61.5 | 59.3 | 18.9 | 16.5 | 15.1 | 14.1 | 13.4 | 12.8 | |
| E | 119.2 | 105.7 | 97.5 | 91.9 | 87.9 | 84.8 | 25.6 | 22.8 | 21.0 | 19.9 | 19.0 | 18.4 | |
| F | 204.3 | 181.2 | 167.0 | 157.4 | 150.5 | 145.3 | 40.8 | 36.0 | 33.1 | 31.1 | 29.6 | 28.6 | |
| SW-2 | A | 37.0 | 32.8 | 30.1 | 28.4 | 27.1 | 26.2 | 9.4 | 7.7 | 6.6 | 5.9 | 5.4 | 5.0 |
| B | 44.2 | 39.2 | 36.0 | 33.9 | 32.4 | 31.2 | 11.9 | 9.9 | 8.7 | 7.9 | 7.3 | 6.8 | |
| C | 63.0 | 55.8 | 51.4 | 48.4 | 46.2 | 44.6 | 15.6 | 13.5 | 12.2 | 11.3 | 10.7 | 10.2 | |
| D | 83.8 | 74.2 | 68.4 | 64.4 | 61.5 | 59.3 | 18.9 | 16.5 | 15.1 | 14.1 | 13.4 | 12.8 | |
| E | 119.2 | 105.7 | 97.5 | 91.9 | 87.9 | 84.8 | 25.6 | 22.8 | 21.0 | 19.9 | 19.0 | 18.4 | |
| F | 204.3 | 181.2 | 167.0 | 157.4 | 150.5 | 145.3 | 40.8 | 36.0 | 33.1 | 31.1 | 29.6 | 28.6 | |
| CF | A | 36.9 | 32.7 | 30.1 | 28.3 | 27.1 | 26.1 | 9.4 | 7.7 | 6.6 | 5.9 | 5.4 | 5.0 |
| B | 44.2 | 39.1 | 36.0 | 33.9 | 32.3 | 31.2 | 11.9 | 9.9 | 8.7 | 7.8 | 7.3 | 6.8 | |
| C | 63.0 | 55.8 | 51.3 | 48.3 | 46.2 | 44.5 | 15.6 | 13.4 | 12.1 | 11.3 | 10.6 | 10.2 | |
| D | 83.7 | 74.2 | 68.3 | 64.3 | 61.4 | 59.3 | 18.9 | 16.5 | 15.0 | 14.1 | 13.3 | 12.8 | |
| E | 119.1 | 105.6 | 97.4 | 91.8 | 87.8 | 84.7 | 25.6 | 22.8 | 21.0 | 19.8 | 19.0 | 18.3 | |
| F | 204.0 | 181.0 | 166.8 | 157.2 | 150.3 | 145.1 | 40.7 | 35.9 | 33.0 | 31.0 | 29.6 | 28.5 | |
| Materials (-) | Climatic Zone (-) | CO2 Emission per Gross Dispersant Surface (kgCO2/m2) | |||||||||||
|---|---|---|---|---|---|---|---|---|---|---|---|---|---|
| Ante-Operam | Post-Operam | ||||||||||||
| 3 | 4 | 5 | 6 | 7 | 8 | 3 | 4 | 5 | 6 | 7 | 8 | ||
| EPS-1 | A | 8.1 | 7.2 | 6.6 | 6.2 | 5.9 | 5.7 | 2.1 | 1.7 | 1.5 | 1.3 | 1.2 | 1.1 |
| B | 9.7 | 8.6 | 7.9 | 7.4 | 7.1 | 6.9 | 2.6 | 2.2 | 1.9 | 1.7 | 1.6 | 1.5 | |
| C | 13.8 | 12.2 | 11.3 | 10.6 | 10.1 | 9.8 | 3.4 | 3.0 | 2.7 | 2.5 | 2.3 | 2.2 | |
| D | 18.4 | 16.3 | 15.0 | 14.1 | 13.5 | 13.0 | 4.1 | 3.6 | 3.3 | 3.1 | 2.9 | 2.8 | |
| E | 26.2 | 23.2 | 21.4 | 20.2 | 19.3 | 18.6 | 5.6 | 5.0 | 4.6 | 4.4 | 4.2 | 4.0 | |
| F | 44.8 | 39.8 | 36.6 | 34.5 | 33.0 | 31.9 | 8.9 | 7.9 | 7.3 | 6.8 | 6.5 | 6.3 | |
| EPS-2 | A | 8.2 | 7.2 | 6.7 | 6.3 | 6.0 | 5.8 | 2.1 | 1.7 | 1.5 | 1.3 | 1.2 | 1.1 |
| B | 9.8 | 8.7 | 8.0 | 7.5 | 7.2 | 6.9 | 2.6 | 2.2 | 1.9 | 1.7 | 1.6 | 1.5 | |
| C | 13.9 | 12.3 | 11.4 | 10.7 | 10.2 | 9.9 | 3.4 | 3.0 | 2.7 | 2.5 | 2.4 | 2.3 | |
| D | 18.5 | 16.4 | 15.1 | 14.2 | 13.6 | 13.1 | 4.2 | 3.7 | 3.3 | 3.1 | 3.0 | 2.8 | |
| E | 26.3 | 23.4 | 21.6 | 20.3 | 19.4 | 18.8 | 5.7 | 5.0 | 4.7 | 4.4 | 4.2 | 4.1 | |
| F | 45.2 | 40.1 | 36.9 | 34.8 | 33.3 | 32.1 | 9.0 | 8.0 | 7.3 | 6.9 | 6.6 | 6.3 | |
| GW | A | 8.1 | 7.2 | 6.6 | 6.2 | 5.9 | 5.7 | 2.1 | 1.7 | 1.5 | 1.3 | 1.2 | 1.1 |
| B | 9.7 | 8.6 | 7.9 | 7.4 | 7.1 | 6.8 | 2.6 | 2.2 | 1.9 | 1.7 | 1.6 | 1.5 | |
| C | 13.8 | 12.2 | 11.2 | 10.6 | 10.1 | 9.8 | 3.4 | 2.9 | 2.7 | 2.5 | 2.3 | 2.2 | |
| D | 18.3 | 16.2 | 15.0 | 14.1 | 13.5 | 13.0 | 4.1 | 3.6 | 3.3 | 3.1 | 2.9 | 2.8 | |
| E | 26.1 | 23.1 | 21.3 | 20.1 | 19.2 | 18.6 | 5.6 | 5.0 | 4.6 | 4.3 | 4.2 | 4.0 | |
| F | 44.7 | 39.7 | 36.6 | 34.5 | 32.9 | 31.8 | 8.9 | 7.9 | 7.2 | 6.8 | 6.5 | 6.3 | |
| SW-1 | A | 8.1 | 7.2 | 6.6 | 6.2 | 5.9 | 5.7 | 2.1 | 1.7 | 1.4 | 1.3 | 1.2 | 1.1 |
| B | 9.7 | 8.6 | 7.9 | 7.4 | 7.1 | 6.8 | 2.6 | 2.2 | 1.9 | 1.7 | 1.6 | 1.5 | |
| C | 13.8 | 12.2 | 11.2 | 10.6 | 10.1 | 9.7 | 3.4 | 2.9 | 2.7 | 2.5 | 2.3 | 2.2 | |
| D | 18.3 | 16.2 | 14.9 | 14.1 | 13.4 | 13.0 | 4.1 | 3.6 | 3.3 | 3.1 | 2.9 | 2.8 | |
| E | 26.1 | 23.1 | 21.3 | 20.1 | 19.2 | 18.5 | 5.6 | 5.0 | 4.6 | 4.3 | 4.2 | 4.0 | |
| F | 44.7 | 39.6 | 36.5 | 34.4 | 32.9 | 31.8 | 8.9 | 7.9 | 7.2 | 6.8 | 6.5 | 6.2 | |
| SW-2 | A | 8.1 | 7.2 | 6.6 | 6.2 | 5.9 | 5.7 | 2.1 | 1.7 | 1.4 | 1.3 | 1.2 | 1.1 |
| B | 9.7 | 8.6 | 7.9 | 7.4 | 7.1 | 6.8 | 2.6 | 2.2 | 1.9 | 1.7 | 1.6 | 1.5 | |
| C | 13.8 | 12.2 | 11.2 | 10.6 | 10.1 | 9.7 | 3.4 | 2.9 | 2.7 | 2.5 | 2.3 | 2.2 | |
| D | 18.3 | 16.2 | 14.9 | 14.1 | 13.4 | 13.0 | 4.1 | 3.6 | 3.3 | 3.1 | 2.9 | 2.8 | |
| E | 26.1 | 23.1 | 21.3 | 20.1 | 19.2 | 18.5 | 5.6 | 5.0 | 4.6 | 4.3 | 4.2 | 4.0 | |
| F | 44.7 | 39.6 | 36.5 | 34.4 | 32.9 | 31.8 | 8.9 | 7.9 | 7.2 | 6.8 | 6.5 | 6.2 | |
| CF | A | 8.1 | 7.1 | 6.6 | 6.2 | 5.9 | 5.7 | 2.0 | 1.7 | 1.4 | 1.3 | 1.2 | 1.1 |
| B | 9.7 | 8.5 | 7.9 | 7.4 | 7.1 | 6.8 | 2.6 | 2.2 | 1.9 | 1.7 | 1.6 | 1.5 | |
| C | 13.8 | 12.2 | 11.2 | 10.6 | 10.1 | 9.7 | 3.4 | 2.9 | 2.7 | 2.5 | 2.3 | 2.2 | |
| D | 18.3 | 16.2 | 14.9 | 14.1 | 13.4 | 13.0 | 4.1 | 3.6 | 3.3 | 3.1 | 2.9 | 2.8 | |
| E | 26.0 | 23.1 | 21.3 | 20.1 | 19.2 | 18.5 | 5.6 | 5.0 | 4.6 | 4.3 | 4.1 | 4.0 | |
| F | 44.6 | 39.6 | 36.5 | 34.4 | 32.9 | 31.7 | 8.9 | 7.9 | 7.2 | 6.8 | 6.5 | 6.2 | |
| Materials (-) | Climatic Zone (-) | Payback Time (years) | |||||||||||
|---|---|---|---|---|---|---|---|---|---|---|---|---|---|
| Economic | Carbon | ||||||||||||
| 3 | 4 | 5 | 6 | 7 | 8 | 3 | 4 | 5 | 6 | 7 | 8 | ||
| EPS-1 | A | 6.02 | 6.63 | 7.07 | 7.40 | 7.65 | 7.86 | 0.84 | 0.93 | 0.99 | 1.03 | 1.07 | 1.10 |
| B | 5.14 | 5.68 | 6.08 | 6.38 | 6.62 | 6.81 | 0.72 | 0.79 | 0.85 | 0.89 | 0.92 | 0.95 | |
| C | 3.59 | 4.02 | 4.35 | 4.59 | 4.79 | 4.95 | 0.63 | 0.70 | 0.76 | 0.80 | 0.84 | 0.87 | |
| D | 2.69 | 3.03 | 3.28 | 3.47 | 3.63 | 3.75 | 0.56 | 0.63 | 0.68 | 0.73 | 0.76 | 0.78 | |
| E | 1.89 | 2.13 | 2.31 | 2.45 | 2.57 | 2.66 | 0.43 | 0.48 | 0.52 | 0.55 | 0.58 | 0.60 | |
| F | 1.09 | 1.23 | 1.34 | 1.42 | 1.48 | 1.53 | 0.26 | 0.30 | 0.32 | 0.34 | 0.36 | 0.37 | |
| EPS-2 | A | 5.91 | 6.51 | 6.93 | 7.26 | 7.51 | 7.71 | 2.00 | 2.20 | 2.34 | 2.45 | 2.54 | 2.61 |
| B | 5.04 | 5.58 | 5.97 | 6.26 | 6.49 | 6.68 | 1.71 | 1.89 | 2.02 | 2.12 | 2.20 | 2.26 | |
| C | 3.50 | 3.92 | 4.23 | 4.47 | 4.67 | 4.82 | 1.45 | 1.63 | 1.76 | 1.86 | 1.94 | 2.00 | |
| D | 2.60 | 2.93 | 3.17 | 3.36 | 3.51 | 3.63 | 1.27 | 1.43 | 1.55 | 1.64 | 1.72 | 1.78 | |
| E | 1.82 | 2.05 | 2.23 | 2.37 | 2.47 | 2.56 | 0.96 | 1.08 | 1.17 | 1.24 | 1.30 | 1.35 | |
| F | 1.05 | 1.18 | 1.28 | 1.36 | 1.42 | 1.47 | 0.59 | 0.66 | 0.72 | 0.76 | 0.80 | 0.83 | |
| GW | A | 6.07 | 6.68 | 7.12 | 7.45 | 7.71 | 7.92 | 0.88 | 0.97 | 1.03 | 1.08 | 1.11 | 1.15 |
| B | 5.18 | 5.72 | 6.12 | 6.42 | 6.66 | 6.85 | 0.75 | 0.83 | 0.89 | 0.93 | 0.96 | 0.99 | |
| C | 3.61 | 4.05 | 4.37 | 4.62 | 4.82 | 4.98 | 0.64 | 0.71 | 0.77 | 0.82 | 0.85 | 0.88 | |
| D | 2.70 | 3.04 | 3.29 | 3.49 | 3.64 | 3.77 | 0.56 | 0.63 | 0.68 | 0.72 | 0.75 | 0.78 | |
| E | 1.92 | 2.16 | 2.35 | 2.49 | 2.60 | 2.70 | 0.45 | 0.51 | 0.55 | 0.59 | 0.62 | 0.64 | |
| F | 1.10 | 1.24 | 1.34 | 1.42 | 1.48 | 1.54 | 0.26 | 0.29 | 0.32 | 0.34 | 0.35 | 0.36 | |
| SW-1 | A | 6.42 | 7.06 | 7.53 | 7.88 | 8.15 | 8.37 | 1.73 | 1.90 | 2.03 | 2.12 | 2.19 | 2.25 |
| B | 5.48 | 6.06 | 6.48 | 6.80 | 7.05 | 7.25 | 1.47 | 1.63 | 1.74 | 1.83 | 1.90 | 1.95 | |
| C | 3.93 | 4.41 | 4.76 | 5.03 | 5.25 | 5.42 | 1.38 | 1.55 | 1.67 | 1.77 | 1.84 | 1.90 | |
| D | 2.98 | 3.35 | 3.62 | 3.84 | 4.01 | 4.15 | 1.19 | 1.34 | 1.45 | 1.54 | 1.61 | 1.66 | |
| E | 2.10 | 2.37 | 2.57 | 2.72 | 2.85 | 2.95 | 0.89 | 1.00 | 1.09 | 1.16 | 1.21 | 1.25 | |
| F | 1.22 | 1.37 | 1.49 | 1.58 | 1.65 | 1.71 | 0.55 | 0.62 | 0.67 | 0.71 | 0.74 | 0.77 | |
| SW-2 | A | 6.06 | 6.67 | 7.11 | 7.44 | 7.70 | 7.91 | 0.72 | 0.79 | 0.85 | 0.89 | 0.92 | 0.94 |
| B | 5.17 | 5.72 | 6.11 | 6.42 | 6.65 | 6.84 | 0.62 | 0.68 | 0.73 | 0.76 | 0.79 | 0.82 | |
| C | 3.65 | 4.09 | 4.41 | 4.66 | 4.86 | 5.03 | 0.58 | 0.65 | 0.70 | 0.74 | 0.77 | 0.80 | |
| D | 2.70 | 3.03 | 3.28 | 3.48 | 3.63 | 3.76 | 0.46 | 0.52 | 0.56 | 0.59 | 0.62 | 0.64 | |
| E | 1.91 | 2.16 | 2.34 | 2.48 | 2.60 | 2.69 | 0.37 | 0.42 | 0.46 | 0.48 | 0.51 | 0.52 | |
| F | 1.11 | 1.25 | 1.35 | 1.43 | 1.50 | 1.55 | 0.23 | 0.26 | 0.28 | 0.30 | 0.31 | 0.32 | |
| CF | A | 6.95 | 7.65 | 8.15 | 8.53 | 8.83 | 9.07 | 0.20 | 0.23 | 0.24 | 0.25 | 0.26 | 0.27 |
| B | 5.93 | 6.56 | 7.01 | 7.36 | 7.63 | 7.85 | 0.17 | 0.19 | 0.21 | 0.22 | 0.23 | 0.23 | |
| C | 4.23 | 4.74 | 5.12 | 5.41 | 5.64 | 5.83 | 0.15 | 0.16 | 0.18 | 0.19 | 0.19 | 0.20 | |
| D | 3.23 | 3.63 | 3.93 | 4.17 | 4.35 | 4.51 | 0.13 | 0.14 | 0.15 | 0.16 | 0.17 | 0.18 | |
| E | 2.34 | 2.64 | 2.86 | 3.03 | 3.17 | 3.29 | 0.10 | 0.11 | 0.12 | 0.13 | 0.14 | 0.14 | |
| F | 1.36 | 1.54 | 1.67 | 1.77 | 1.85 | 1.91 | 0.06 | 0.07 | 0.08 | 0.08 | 0.08 | 0.09 | |
| Number of Floors (-) | Materials (-) | Economic and Environmental Sustainability Index (EESI) (-) | |||||||||||
|---|---|---|---|---|---|---|---|---|---|---|---|---|---|
| Scenario 1 | Scenario 2 | ||||||||||||
| A | B | C | D | E | F | A | B | C | D | E | F | ||
| 3 | EPS-1 | 1.88 | 1.61 | 1.12 | 0.84 | 0.59 | 0.34 | 1.06 | 0.90 | 0.65 | 0.50 | 0.35 | 0.21 |
| EPS-2 | 1.85 | 1.58 | 1.09 | 0.81 | 0.57 | 0.33 | 1.20 | 1.02 | 0.75 | 0.58 | 0.42 | 0.25 | |
| GW | 1.90 | 1.62 | 1.13 | 0.84 | 0.60 | 0.34 | 1.07 | 0.91 | 0.65 | 0.50 | 0.36 | 0.21 | |
| SW-1 | 1.89 | 1.62 | 1.14 | 0.84 | 0.60 | 0.35 | 1.05 | 0.89 | 0.65 | 0.48 | 0.35 | 0.20 | |
| SW-2 | 2.01 | 1.71 | 1.23 | 0.93 | 0.66 | 0.38 | 1.24 | 1.06 | 0.80 | 0.63 | 0.45 | 0.27 | |
| CF | 2.17 | 1.85 | 1.32 | 1.01 | 0.73 | 0.43 | 1.11 | 0.95 | 0.68 | 0.52 | 0.38 | 0.22 | |
| 4 | EPS-1 | 2.07 | 1.78 | 1.26 | 0.95 | 0.67 | 0.39 | 1.16 | 1.00 | 0.73 | 0.56 | 0.40 | 0.23 |
| EPS-2 | 2.03 | 1.74 | 1.23 | 0.91 | 0.64 | 0.37 | 1.32 | 1.13 | 0.84 | 0.65 | 0.47 | 0.28 | |
| GW | 2.09 | 1.79 | 1.26 | 0.95 | 0.68 | 0.39 | 1.18 | 1.01 | 0.73 | 0.56 | 0.41 | 0.23 | |
| SW-1 | 2.08 | 1.79 | 1.28 | 0.95 | 0.67 | 0.39 | 1.15 | 0.99 | 0.73 | 0.54 | 0.39 | 0.23 | |
| SW-2 | 2.21 | 1.89 | 1.38 | 1.05 | 0.74 | 0.43 | 1.36 | 1.17 | 0.90 | 0.71 | 0.51 | 0.30 | |
| CF | 2.39 | 2.05 | 1.48 | 1.14 | 0.82 | 0.48 | 1.23 | 1.05 | 0.76 | 0.59 | 0.43 | 0.25 | |
| 5 | EPS-1 | 2.21 | 1.90 | 1.36 | 1.02 | 0.72 | 0.42 | 1.24 | 1.07 | 0.78 | 0.61 | 0.43 | 0.25 |
| EPS-2 | 2.17 | 1.86 | 1.32 | 0.99 | 0.70 | 0.40 | 1.40 | 1.21 | 0.90 | 0.71 | 0.51 | 0.30 | |
| GW | 2.22 | 1.91 | 1.37 | 1.03 | 0.73 | 0.42 | 1.25 | 1.08 | 0.79 | 0.61 | 0.44 | 0.25 | |
| SW-1 | 2.22 | 1.91 | 1.38 | 1.03 | 0.73 | 0.42 | 1.23 | 1.06 | 0.78 | 0.59 | 0.43 | 0.25 | |
| SW-2 | 2.35 | 2.02 | 1.49 | 1.13 | 0.80 | 0.47 | 1.45 | 1.25 | 0.97 | 0.77 | 0.55 | 0.32 | |
| CF | 2.55 | 2.19 | 1.60 | 1.23 | 0.89 | 0.52 | 1.31 | 1.12 | 0.82 | 0.64 | 0.46 | 0.27 | |
| 6 | EPS-1 | 2.31 | 1.99 | 1.44 | 1.09 | 0.77 | 0.44 | 1.30 | 1.12 | 0.83 | 0.64 | 0.46 | 0.27 |
| EPS-2 | 2.27 | 1.96 | 1.40 | 1.05 | 0.74 | 0.43 | 1.47 | 1.27 | 0.95 | 0.75 | 0.54 | 0.32 | |
| GW | 2.33 | 2.01 | 1.44 | 1.09 | 0.78 | 0.44 | 1.31 | 1.13 | 0.83 | 0.64 | 0.47 | 0.27 | |
| SW-1 | 2.32 | 2.00 | 1.46 | 1.09 | 0.78 | 0.45 | 1.28 | 1.11 | 0.83 | 0.62 | 0.45 | 0.26 | |
| SW-2 | 2.46 | 2.12 | 1.57 | 1.20 | 0.85 | 0.49 | 1.52 | 1.31 | 1.03 | 0.81 | 0.58 | 0.34 | |
| CF | 2.67 | 2.30 | 1.69 | 1.30 | 0.95 | 0.55 | 1.37 | 1.18 | 0.87 | 0.67 | 0.49 | 0.29 | |
| 7 | EPS-1 | 2.39 | 2.07 | 1.50 | 1.13 | 0.80 | 0.46 | 1.34 | 1.16 | 0.86 | 0.67 | 0.48 | 0.28 |
| EPS-2 | 2.35 | 2.03 | 1.46 | 1.10 | 0.77 | 0.44 | 1.52 | 1.32 | 0.99 | 0.78 | 0.56 | 0.33 | |
| GW | 2.41 | 2.08 | 1.51 | 1.14 | 0.81 | 0.46 | 1.36 | 1.17 | 0.87 | 0.67 | 0.49 | 0.28 | |
| SW-1 | 2.41 | 2.08 | 1.52 | 1.14 | 0.81 | 0.47 | 1.33 | 1.15 | 0.87 | 0.65 | 0.48 | 0.28 | |
| SW-2 | 2.55 | 2.20 | 1.64 | 1.25 | 0.89 | 0.52 | 1.57 | 1.36 | 1.07 | 0.85 | 0.61 | 0.36 | |
| CF | 2.76 | 2.38 | 1.76 | 1.36 | 0.99 | 0.58 | 1.42 | 1.22 | 0.91 | 0.70 | 0.51 | 0.30 | |
| 8 | EPS-1 | 2.46 | 2.13 | 1.55 | 1.17 | 0.83 | 0.48 | 1.38 | 1.19 | 0.89 | 0.69 | 0.50 | 0.29 |
| EPS-2 | 2.41 | 2.09 | 1.51 | 1.13 | 0.80 | 0.46 | 1.56 | 1.35 | 1.03 | 0.81 | 0.59 | 0.34 | |
| GW | 2.47 | 2.14 | 1.56 | 1.18 | 0.84 | 0.48 | 1.39 | 1.21 | 0.90 | 0.70 | 0.51 | 0.29 | |
| SW-1 | 2.47 | 2.14 | 1.57 | 1.18 | 0.84 | 0.48 | 1.36 | 1.18 | 0.89 | 0.68 | 0.49 | 0.29 | |
| SW-2 | 2.62 | 2.27 | 1.70 | 1.30 | 0.92 | 0.53 | 1.62 | 1.40 | 1.11 | 0.88 | 0.63 | 0.37 | |
| CF | 2.83 | 2.45 | 1.82 | 1.41 | 1.03 | 0.60 | 1.45 | 1.26 | 0.94 | 0.73 | 0.53 | 0.31 | |
References
- European Commission. Communication from the Commission to the European Parliament, the European Council, the Council, the European Economic and Social Committee and the Committee of the Regions. The European Green Deal. 2019. Available online: https://eur-lex.europa.eu/resource.html?uri=cellar:b828d165-1c22-11ea-8c1f-01aa75ed71a1.0002.02/DOC_1&format=PDF (accessed on 23 November 2022).
- GlobalABC; IEA.; UNEP. GlobalABC Roadmap for Buildings and Construction 2020–2050. 2020. Available online: https://www.iea.org/reports/globalabc-roadmap-for-buildings-and-construction-2020-2050 (accessed on 22 November 2022).
- United Nations Environment Program. 2021 Global Status Report for Buildings and Construction. Towards a Zero-Emissions, Efficient and Resilient Buildings and Construction Sector. 2021. Available online: https://globalabc.org/resources/publications/2021-global-status-report-buildings-and-construction (accessed on 23 November 2022).
- Aquino, A.; Scrucca, F.; Bonamente, E. Sustainability of Shallow Geothermal Energy for Building Air-Conditioning. Energies 2021, 14, 7058. [Google Scholar] [CrossRef]
- Villasmil, W.; Fischer, L.J.; Worlitschek, J. A review and evaluation of thermal insulation materials and methods for thermal energy storage systems. Renew. Sustain. Energy Rev. 2019, 103, 71–84. [Google Scholar] [CrossRef]
- Cabeza, L.F.; Castell, A.; Medrano, M.; Martorell, I.; Pérez, G.; Fernández, I. Experimental study on the performance of insulation materials in Mediterranean construction. Energy Build. 2010, 42, 630–636. [Google Scholar] [CrossRef]
- International Energy Agency. Cost-Effective Energy and Carbon Emissions Optimization in Building Renovation (Annex 56). Guidebook for Professional Home Owners. 2017. Available online: https://www.iea-ebc.org/Data/publications/EBC_Annex_56_Guidebook_Professional_Home_Owners.pdf (accessed on 3 November 2022).
- International Energy Agency. Methodology for Cost-Effective Energy and Carbon Emissions Optimization in Building Renovation (Annex 56). Energy in Buildings and Communities Programme. 2017. Available online: https://www.iea-ebc.org/Data/publications/EBC_Annex_56_Methodology_Cost-Effective_Energy_Carbon_Emissions_Optimization_Building_Renovation.pdf (accessed on 3 November 2022).
- International Energy Agency. Tools and Procedures to Support Decision Making for Cost-Effective Energy and Carbon Emissions Optimization in Building Renovation (Annex 56). Energy in Buildings and Communities Programme. 2017. Available online: https://www.iea-ebc.org/Data/publications/EBC_Annex_56_Tools_Procedures_Support_Decision_Making.pdf (accessed on 3 November 2022).
- Almeria, M.; Ferreira, M. Cost effective energy and carbon emissions optimization in building renovation (Annex 56). Energy Build. 2017, 152, 718–738. [Google Scholar]
- Ministry of Ecological Transition, Department of Energy and Climate. The National Energy Situation in 2020. 2021. Available online: https://dgsaie.mise.gov.it/pub/sen/relazioni/relazione_annuale_situazione_energetica_nazionale_dati_2020.pdf (accessed on 23 November 2022). (In Italian)
- ENEA. Annual Report on Energy Efficiency over the Country. 2021. Available online: https://www.efficienzaenergetica.enea.it/component/jdownloads/?task=download.send&id=511&catid=40&Itemid=101 (accessed on 23 November 2022). (In Italian).
- Government of the Italian Republic. Interministerial Decree 26 June 2015—Application of the Energy Performance Calculatiuon Methods and Definition of Prescriptions and Minimum Requirements of Buildings. Official Gazette of the Italian Republic N. 39. 2015. Available online: https://www.gazzettaufficiale.it/eli/gu/2015/07/15/162/so/39/sg/pdf (accessed on 19 July 2022). (In Italian).
- Italian Standardization Body. UNI TS 11300-1. Energy Performance of Buildings—Part 1: Evaluation of Energy Need for Space Heating and Cooling; Italian National Unification Body (UNI): Milan, Italy, 2014. (In Italian) [Google Scholar]
- Italian Standardization Body. UNI TS 11300-2. Energy Performance of Buildings—Part 2: Evaluation of Primary Energy Need and of System Efficiencies for Space Heating, Domestic Hot Water Production, Ventilation and Lighting for Non-Residential Buildings; Italian National Unification Body (UNI): Milan, Italy, 2019. (In Italian) [Google Scholar]
- Italian Standardization Body. UNI TS 11300-3. Energy Performance of Buildings—Part 3: Evaluation of Primary Energy and System Efficiencies for Space; Italian National Unification Body (UNI): Milan, Italy, 2010. (In Italian) [Google Scholar]
- Italian Standardization Body. UNI TS 11300-4. Energy Performance of Buildings—Part 4: Renewable Energy and Other Generation Systems for Space Heating and Domestic hot Water Production; Italian National Unification Body (UNI): Milan, Italy, 2016. (In Italian) [Google Scholar]
- Italian Standardization Body. UNI TS 11300-5. Energy Performance of Buildings—Part 5: Evaluation of Energy Performance for the Classification of Building; Italian National Unification Body (UNI): Milan, Italy, 2016. (In Italian) [Google Scholar]
- Palladino, D.; Scrucca, F.; Calabrese, N.; Barberio, G.; Ingrao, C. Durum-Wheat Straw Bales for Thermal Insulation of Buildings: Findings from a Comparative Energy Analysis of a Set of Wall-Composition Samples on the Building Scale. Energies 2021, 14, 5508. [Google Scholar] [CrossRef]
- Palladino, D.; Iatauro, D.; Signoretti, P. Application of hourly dynamic method for nZEB buildings in Italian context: Analysis and comparisons in national calculation procedure framework. E3S Web Conf. 2021, 321, 12. [Google Scholar] [CrossRef]
- Hardy, A.; Glew, D. An analysis of errors in the Energy Performance certificate database. Energy Policy 2019, 129, 1168–1178. [Google Scholar] [CrossRef]
- Pasichnyi, O.; Wallin, J.; Levihn, F.; Shahrokni, H.; Kordas, O. Energy performance certificates—New opportunities for data-enabled urban energy policy instruments? Energy Policy 2019, 127, 486–499. [Google Scholar] [CrossRef]
- Jenkins, D.; Simpson, S.; Peacock, A. Investigating the consistency and quality of EPC ratings and assessments. Energy 2017, 138, 480–489. [Google Scholar] [CrossRef]
- Ingrao, C.; Scrucca, F.; Tricase, C.; Asdrubali, F. A comparative Life Cycle Assessment of external wall-compositions for cleaner construction solutions in buildings. J. Clean. Prod. 2016, 124, 283–298. [Google Scholar] [CrossRef]
- Füchsl, S.; Rheude, F.; Röder, H. Life cycle assessment (LCA) of thermal insulation materials: A critical review. Clean. Mater. 2022, 5, 100119. [Google Scholar] [CrossRef]
- Kono, J.; Goto, Y.; Ostermeyer, Y.; Frischknecht, R.; Wallbaum, H. Factors for ecoefficiency improvement of thermal insulation materials. Key Eng. Mater. 2016, 678, 1–13. [Google Scholar] [CrossRef]
- Sierra-Pérez, J.; Boschmonart-Rives, J.; Dias, A.C.; Gabarrell, X. Environmental implications of the use of agglomerated cork as thermal insulation in buildings. J. Clean. Prod. 2016, 126, 97–107. [Google Scholar] [CrossRef]
- Maalouf, C.; Ingrao, C.; Scrucca, F.; Moussa, T.; Bourdot, A.; Tricase, C.; Presciutti, A.; Asdrubali, F. An energy and Carbon Footprint assessment upon the usage of hemp-lime concrete and recycled-PET façades for office facilities in France and Italy. J. Clean. Prod. 2018, 170, 1640–1653. [Google Scholar] [CrossRef]
- Scrucca, F.; Ingrao, C.; Maalouf, C.; Moussa, T.; Polidori, G.; Messineo, A.; Arcidiacono, C.; Asdrubali, F. Energy and carbon footprint assessment of production of hemp hurds for application in buildings. Environ. Impact Assess. Rev. 2020, 84, 106417. [Google Scholar] [CrossRef]
- Moussa, T.; Maalouf, C.; Ingrao, C.; Scrucca, F.; Costantine, G.; Asdrubali, F. Bio-based and recycled-waste materials in buildings: A study of energy performance of hemp-lime concrete and recycled-PET façades for office facilities in France and Italy. Sci. Technol. Built Environ. 2018, 24, 492–501. [Google Scholar] [CrossRef]
- Hauschild, M.Z.; Rosenbaum, R.K.; Olsen, S.I. Life Cycle Assessment, 1st ed.; Springer International Publishing: Gewerbestrasse, Switzerland, 2018; 1216p. [Google Scholar] [CrossRef]
- Esteghamati, M.Z.; Sharifnia, H.; Ton, D.; Asiatico, P.; Reichard, G.; Flint, M.M. Sustainable early design exploration of mid-rise office buildings with different subsystems using comparative life cycle assessment. J. Build. Eng. 2022, 48, 104004. [Google Scholar] [CrossRef]
- Palladino, D.; Pagliaro, F.; Del Fatto, V.; Lavinia, C.; Margiotta, F.; Colasuonno, L. LA 1.15-State of the art of national building stock and Energy Performance Certification (EPC) analysis. Program Agreement Ministry of Economic Development – ENEA. Three-year Implementation Plan 2019-2021 1st-year. Electrical System Research. 2019. RdS/PTR2019/037. Available online: https://www.enea.it/it/Ricerca_sviluppo/documenti/ricerca-di-sistema-elettrico/adp-mise-enea-2019-2021/tecnologie-efficienza-risparmio-edifici/report-rds_ptr_2019_037.pdf (accessed on 3 November 2022). (In Italian).
- National Institute of Statistics. National Census of the Population, Buildings, Energy Consumptions. 2011. Available online: http://dati.istat.it/ (accessed on 23 November 2022). (In Italian).
- Italian National Agency for New Technologies, Energy and Sustainable Economic Development (ENEA). Annual Report on National Incentives Systems for Energy Efficiency and Use of Renewable Energy Sources in Existing Buildings. 2021. Available online: https://www.efficienzaenergetica.enea.it/component/jdownloads/?task=download.send&id=510&catid=40&Itemid=101 (accessed on 30 November 2022). (In Italian).
- Regulatory Authority for Energy Network and the Environment (ARERA in Italian). 2022. Available online: https://www.arera.it/it/com_stampa/22/221103.htm (accessed on 29 November 2022). (In Italian).
- ISO 14040; Environmental Management e Life Cycle Assessment—Principles and Framework. ISO: Geneva, Switzerland, 2006.
- ISO 14044; Environmental Management e Life Cycle Assessment—Requirements and Guidelines. ISO: Geneva, Switzerland, 2006.
- Scrucca, F.; Baldassarri, C.; Baldinelli, G.; Bonaente, E.; Rinaldi, S.; Rotili, A.; Barbanera, M. Uncertainty in LCA: An estimation of practitioner-related effects. J. Clean. Prod. 2020, 268, 122304. [Google Scholar] [CrossRef]
- Wernet, G.; Bauer, C.; Steubing, B.; Reinhard, J.; Moreno-Ruiz, E.; Weidema, B. The ecoinvent database version 3 (part I): Overview and methodology. Int. J. Life Cycle Assess. 2016, 21, 1218–1230. [Google Scholar] [CrossRef]
- SimaPro Software. Available online: https://simapro.com/ (accessed on 22 November 2022).
- PRé Sustainability. SimaPro Database Manual—Methods Library. Available online: https://simapro.com/wp-content/uploads/2021/12/DatabaseManualMethods930.pdf (accessed on 3 November 2022).
- IPCC; Climate Change. The Physical Science Basis. Contribution of Working Group I to the Sixth Assessment Report of the Intergovernmental Panel on Climate Change; Masson-Delmotte, V., Zhai, P., Pirani, A., Connors, S.L., Péan, C., Berger, S., Caud, N., Chen, Y., Goldfarb, L., Gomis, M.I., Eds.; Cambridge University Press: Cambridge, UK; New York, NY, USA, 2021; in press. [Google Scholar] [CrossRef]
- Bektas Ekici, B.; Aytac Gulten, A.; Aksoy, U.T. A study on the optimum insulation thicknesses of various types of external walls with respect to different materials, fuels and climate zones in Turkey. Appl. Energy 2012, 92, 211–217. [Google Scholar] [CrossRef]
- Malka, L.; Kuriqi, A.; Haxhimusa, A. Optimum insulation thickness design of exterior walls and overhauling cost to enhance the energy efficiency of Albanian’s buildings stock. J. Clean. Prod. 2022, 281, 135160. [Google Scholar] [CrossRef]
- Ardente, F.; Beccali, M.; Cellura, M.; Mistretta, M. Energy and environmental benefits in public buildings as a result of retrofit actions. Renew. Sustain. Energy Rev. 2011, 15, 460–470. [Google Scholar] [CrossRef]
- Alsayed, M.-F.; Tayeh, R.A. Life cycle cost analysis for determining optimal insulation thickness in Palestinian buildings. J. Build. Eng. 2019, 22, 101–112. [Google Scholar] [CrossRef]
- Onan, C. Determination of the Thermal Insulation for the Model Building Approach and the Global Effects in Turkey. Adv. Mech. Eng. 2014, 6, 960278. [Google Scholar] [CrossRef]
- Akan, A.E. Determination and Modeling of Optimum Insulation Thickness for Thermal Insulation of Buildings in All City Centers of Turkey. Int. J. Thermophys. 2021, 42, 49. [Google Scholar] [CrossRef]
- Basińska, M.; Kaczorek, D.; Koczyk, H. Economic and Energy Analysis of Building Retrofitting Using Internal Insulations. Energies 2021, 14, 2446. [Google Scholar] [CrossRef]
- Bolattürk, A. Determination of optimum insulation thickness for building walls with respect to various fuels and climate zones in Turkey. Appl. Therm. Eng. 2006, 26, 1301–1309. [Google Scholar] [CrossRef]
- Mohammadpourkarbasi, H.; Sharples, S. Eco retrofitting very old dwellings: Current and future energy and carbon performance for two UK cities. In Proceedings of the 29th Conference, Sustainable Architecture for a Renewable Future, Munich, Germany, 10–12 September 2013. [Google Scholar]
- Energy and environmental payback times for an NZEB retrofit. Build. Environ. 2019, 147, 461–472. [CrossRef]
- Asdrubali, F.; Venanzi, D.; Evangelisti, L.; Guattari, C.; Grazieschi, G.; Matteucci, P.; Roncone, M. An Evaluation of the Environmental Payback Times and Economic Convenience in an Energy Requalification of a School. Buildings 2021, 11, 12. [Google Scholar] [CrossRef]


| Number of Floors (-) | Number of Building Units (-) | Net Surfaces (m2) | Heated Volume (m3) | Dispersant Surface (m2) |
|---|---|---|---|---|
| 3 | 12 | 1020 | 3315 | 572 |
| 4 | 16 | 1360 | 4386 | 751 |
| 5 | 20 | 1700 | 5457 | 930 |
| 6 | 24 | 2040 | 6528 | 1109 |
| 7 | 28 | 2380 | 7599 | 1289 |
| 8 | 32 | 2720 | 8670 | 1468 |
| Components | Thermal Transmittance (W/m2K) |
|---|---|
| Wall | 2.13 |
| Ceiling/floor | 1.47 |
| Roof | 1.63 |
| Windows | 2.00 |
| Materials | λ (W/mK) | ρ (kg/m3) | |
|---|---|---|---|
| Polystyrene foam slab with graphite, 6% recycled | EPS-1 | 0.031 | 20 |
| Polystyrene foam slab | EPS-2 | 0.033 | 33 |
| Glass wool | GW | 0.034 | 25 |
| Stone wool | SW-1 | 0.035 | 40 |
| Stone wool high-bulk density | SW-2 | 0.036 | 100 |
| Cellulose fiber | CF | 0.038 | 45 |
| Thermal Insulation Materials | Climatic Zone | |||||
|---|---|---|---|---|---|---|
| A | B | C | D | E | F | |
| EPS-1 | 0.07 | 0.07 | 0.09 | 0.11 | 0.12 | 0.13 |
| EPS-2 | 0.08 | 0.08 | 0.10 | 0.12 | 0.13 | 0.14 |
| GW | 0.08 | 0.08 | 0.10 | 0.12 | 0.14 | 0.14 |
| SW-1 | 0.08 | 0.08 | 0.11 | 0.13 | 0.14 | 0.15 |
| SW-2 | 0.08 | 0.08 | 0.11 | 0.12 | 0.14 | 0.15 |
| CF | 0.09 | 0.09 | 0.11 | 0.13 | 0.15 | 0.16 |
| Insulation Materials | Common Activities (€/m2) | Insulation Materials (€/m3) |
|---|---|---|
| EPS-1 | 75.0 | 105.3 |
| EPS-2 | 75.0 | 72.9 |
| GW | 75.0 | 99.4 |
| SW-1 | 75.0 | 98.0 |
| SW-2 | 75.0 | 159.3 |
| CF | 75.0 | 222.2 |
| Thermal Insulation Materials | Climatic Zone | |||||
|---|---|---|---|---|---|---|
| A | B | C | D | E | F | |
| EPS-1 | 5.09 | 5.09 | 6.55 | 8.01 | 8.73 | 9.46 |
| EPS-2 | 12.19 | 12.19 | 15.24 | 18.29 | 19.81 | 21.34 |
| GW | 5.30 | 5.30 | 6.62 | 7.95 | 9.27 | 9.27 |
| SW-1 | 4.35 | 4.35 | 5.98 | 6.52 | 7.61 | 8.16 |
| SW-2 | 10.41 | 10.41 | 14.32 | 16.92 | 18.22 | 19.52 |
| CF | 1.24 | 1.24 | 1.51 | 1.78 | 2.06 | 2.20 |
Disclaimer/Publisher’s Note: The statements, opinions and data contained in all publications are solely those of the individual author(s) and contributor(s) and not of MDPI and/or the editor(s). MDPI and/or the editor(s) disclaim responsibility for any injury to people or property resulting from any ideas, methods, instructions or products referred to in the content. |
© 2023 by the authors. Licensee MDPI, Basel, Switzerland. This article is an open access article distributed under the terms and conditions of the Creative Commons Attribution (CC BY) license (https://creativecommons.org/licenses/by/4.0/).
Share and Cite
Scrucca, F.; Palladino, D. Integration of Energy Simulations and Life Cycle Assessment in Building Refurbishment: An Affordability Comparison of Thermal Insulation Materials through a New Sustainability Index. Sustainability 2023, 15, 1412. https://doi.org/10.3390/su15021412
Scrucca F, Palladino D. Integration of Energy Simulations and Life Cycle Assessment in Building Refurbishment: An Affordability Comparison of Thermal Insulation Materials through a New Sustainability Index. Sustainability. 2023; 15(2):1412. https://doi.org/10.3390/su15021412
Chicago/Turabian StyleScrucca, Flavio, and Domenico Palladino. 2023. "Integration of Energy Simulations and Life Cycle Assessment in Building Refurbishment: An Affordability Comparison of Thermal Insulation Materials through a New Sustainability Index" Sustainability 15, no. 2: 1412. https://doi.org/10.3390/su15021412
APA StyleScrucca, F., & Palladino, D. (2023). Integration of Energy Simulations and Life Cycle Assessment in Building Refurbishment: An Affordability Comparison of Thermal Insulation Materials through a New Sustainability Index. Sustainability, 15(2), 1412. https://doi.org/10.3390/su15021412