Article

The Effects of Spill Pressure on the Migration and Remediation of Dense Non-Aqueous Phase Liquids in Homogeneous and Heterogeneous Aquifers

1
Guangdong Provincial Research Center for Environment Pollution Control and Remediation Materials, College of Life Science and Technology, Jinan University, Guangzhou 510632, China
2
Guangdong Provincial Academy of Environmental Science, Guangzhou 510045, China
3
Key Laboratory of Surficial Geochemistry, Department of Hydrosciences, School of Earth Sciences and Engineering, Nanjing University, Ministry of Education, Nanjing 210023, China
4
Guangdong Yixin Ecological Technology Co., Ltd., Guangzhou 510055, China
5
Guangdong Key Laboratory of Environmental Pollution and Health, School of Environment, Jinan University, Guangzhou 510632, China
6
School of Water Conservancy and Environment, University of Jinan, Jinan 250022, China
*
Author to whom correspondence should be addressed.
These authors contributed equally to this work and should be considered co-first authors.
Sustainability 2023, 15(17), 13072; https://doi.org/10.3390/su151713072
Submission received: 7 July 2023 / Revised: 16 August 2023 / Accepted: 23 August 2023 / Published: 30 August 2023
(This article belongs to the Special Issue Risk Assessment of Surface Water and Groundwater Contamination)

Abstract

:
The spill pressure of the contaminant source is an important factor affecting the amount, location, form, and behavior of the dense non-aqueous phase liquids (DNAPLs) that plume in a contaminated subsurface environment. In this study, perchloroethylene (PCE) infiltration, distribution and, remediation via a surfactant-enhanced aquifer remediation (SEAR) technique for a PCE spill event are simulated to evaluate the effects of the spill pressure of the contaminant source on the DNAPLs’ behavior in two-dimensional homogeneous and heterogeneous aquifers. Five scenarios with different spill pressures of contamination sources are considered to perform the simulations. The results indicate that the spill pressure of the contaminant source has an obvious influence on the distribution of DNAPLs and the associated efficiency of remediation in homogeneous and heterogeneous aquifers. As the spill pressure increases, more and more contaminants come into the aquifer and the spread range of contamination becomes wider and wider. Simultaneously, the remediation efficiency of contamination also decreases from 93.49% to 65.90% as the spill pressure increases from 33.0 kPa to 41.0 kPa for a heterogeneous aquifer with 200 realizations. The simulation results in both homogeneous and heterogeneous aquifers show the same influence of the spill pressure of the contaminant source on PCE behaviors in the two-dimensional model. This study indicates that the consideration of the spill pressure of the contaminant sources (such as underground petrol tanks, underground oil storage, underground pipeline, and landfill leakage) is essential for the disposal of contaminant leakage in the subsurface environment. Otherwise, it is impossible to accurately predict the migration and distribution of DNAPLs and determine the efficient scheme for the removal of contaminant spills in groundwater systems.

Graphical Abstract

1. Introduction

Groundwater is a precious natural resource for humankind’s survival and development, which has played an important role in our life and industry [1,2,3,4,5,6,7]. In recent years, with the rapid development of the societal economy, petrochemical industries, facilities, and related economies (such as gas stations, underground pipelines, and petrochemical corporations) are advancing quickly [8,9,10,11,12]. These petrochemical developments have provided more convenience for human beings and are a continually motivating force for our societal economy. However, these factories and facilities have become great potential sources of groundwater contamination and have caused serious damage to the subsurface environment [6,7,11,13,14,15,16,17,18,19,20]. When dense non-aqueous liquids (DNAPLs) are released into aquifers, groundwater resources are seriously contaminated [21,22]. Also, as a kind of typical persistent organic pollutant (POP), DNAPLs can be absorbed as residual contaminants in aquifers and serve as long-term sources of groundwater contamination [23]. As a result, conventional remediation techniques have proven to be ineffective and unsuccessful in the remediation of groundwater contamination caused by POPs [3,4,13,24]. Surfactant-enhanced aquifer remediation (SEAR) is proposed to overcome the limitations of the traditional pump and treat technology, which can significantly improve the remediation efficiency of DNAPL-contaminated homogeneous and heterogeneous aquifers and greatly shorten the remediation period [24,25,26,27]. The threat to human health and ecosystems caused by DNAPLs has become a major subsurface environmental problem due to their carcinogenicity, teratogenicity, and mutagenicity [20,21,28,29,30]. Therefore, DNAPL contamination in groundwater can lead to negative impacts on the subsurface ecological environment, human health, and the sustainable development of our society and economy.
The migration, distribution, and fate of DNAPLs in the subsurface environment is controlled by various factors including the leakage rate of the contamination source, the physicochemical properties of DNAPLs, the flow velocity of groundwater, the spatial heterogeneity of aquifers, the presence of organic acids and bases, etc. Numerical simulation and laboratory experiments have been used to explore the factors affecting DNAPL behaviors in the aquifer [1,2,3,4,6,7,17,31]. The study on field-scale heterogeneity indicated that the spill release rate has an obvious effect on the infiltration and entrapment of DNAPL [1,2,3,4,5,6]. Various studies have addressed the influence of groundwater flow velocity on DNAPL movement in the subsurface environment [7,16,17,32,33]. The groundwater flow can increase the infiltration rate and promote downward migration in aquifers. Moreover, soil moisture dynamics, fluid and porous media properties, and textural and wettability variations have important influences on DNAPL migration and plume development in saturated aquifers [2,15,34]. Furthermore, the remediation process of DNAPL contamination is influenced by many factors, such as the heterogeneity of porous media, scale and dimensionality, and dip-angle orientations [3,4,13,35,36]. However, the influence of the spill pressure of the contamination source on DNAPL migration and remediation via SEAR under the subsurface environment has not been investigated by existing studies so far.
The goal of this study is to determine the impact of the spill pressure of the contamination source on DNAPL migration, distribution, and corresponding remediation efficiency for a PCE spill event. A DNAPL migration and remediation model for a PCE spill is developed using a multicomponent, multiphase model simulator UTCHEM. Firstly, an aquifer is assumed to be homogeneous and five scenarios are set up to test the effect of the spill pressure on PCE migration, distribution, and the associated efficiency of remediation. Afterward, sequential Gaussian simulation (SGS) is used to generate 200 realizations of porosity distribution to simulate a natural aquifer composed of heterogeneous porous media. The distributions of permeability and the entry pressure of heterogeneous aquifers are achieved via the microstructure of porous media based on the fractal method [31,37]. Then, PCE migration, distribution, and remediation via SEAR are simulated utilizing UTCHEM for these 200 realizations under five different conditions of spill pressure to reveal the corresponding effect on contaminant behaviors in heterogeneous aquifers. This research provides an understanding of spill pressure on the movement, form, and plume development of contaminants in the subsurface environment and promotes the more effective control and remediation for the disposal of subsurface contaminant leakage, which is significant for carrying out the protection of the groundwater resource and the subsurface environment.

2. Materials and Methods

2.1. Modeling DNAPL Releasing with Different Spill Pressures in a Contaminated Aquifer

The purpose of this study is to explore the effects of spill pressure on DNAPL migration and remediation. The two-dimensional sandy aquifer is assumed to be homogeneous and PCE is released from underground contamination sources with spill pressure (Figure S1). The aquifer is 115 m × 30 m with a width of 20 m. In the simulation, the aquifer is discretized into 115 × 30 grids with dimensions of 1 m × 1 m × 20 m. The porous media contained in the homogeneous aquifer are homogeneous sands. The porosity, longitudinal and transverse dispersivities of the aquifer are 0.21, 1.0, and 0.1 m, respectively. The top and bottom boundaries are set as no-flow conditions. The left and right boundaries are set as constant pressure conditions. In this aquifer, groundwater flows from the left border to the right border with a hydraulic gradient of 0.005. The depth of the spill position is 4.5 m in the middle of the aquifer. The PCE spill period lasts 30 days and five scenarios with spill pressure of respective 33.0 kPa, 35.0 kPa, 37.0 kPa, 39.0 kPa, and 41.0 kPa are set up to explore the effects of spill pressure on the PCE behaviors. After the PCE spill period, PCE infiltrates and migrates freely in the aquifer for 170 days. Afterward, 4% surfactant solution is injected into the aquifer to flush the PCE plume at a constant rate of 80 m3/day for 200~250 days. At last, clean water is injected into the aquifer to flush the contaminants over 150 days. After surfactant injection, the contaminated aquifer is flushed with water over a long time of 150 days. The densities of water, PCE, and surfactant are 1.00 g/cm3, 1.63 g/cm3, and 1.15 g/cm3, respectively. Simultaneously, the viscosity of water and PCE are 1.00 cP and 0.89 cP. PCE solubility is 240 mg/L and the interfacial tension between PCE and water is 45 dyn/cm. The permeability and entry pressure are obtained using the fractal method [31]. Five scenarios are simulated using a multicomponent, multiphase model simulator UTCHEM [38] to reveal the effect of the spill pressure on DNAPL behaviors in the subsurface environment. The residual water saturation and PCE saturation are 0.24 and 0.17. The endpoints of water and PCE are 0.486 and 0.65 in the BC model simulating the relationship between relative permeability and saturation, respectively. Simultaneously, the exponents of water and PCE are 2.7 and −0.52.
Significantly, a realistic aquifer is composed of heterogeneous porous media. To explore the influence of the spill pressure of the contamination source on DNAPL behaviors in the heterogeneous aquifer, the aquifer is assumed to be heterogeneous and SGS is used to generate 200 realizations of a heterogeneous porosity field. The porous media contained in the heterogeneous aquifer are mixed with different grades of sands. The average value and standard deviation of the porosity field are 0.21 and 0.06. The correlation lengths along horizontal and vertical directions are 20 m. Permeability and entry pressure are calculated according to the fractal method based on the suitable microstructure of porous media. The parameters in the fractal method are achieved from Table S1 according to experiments [31]. Boundary conditions of heterogeneous aquifers are the same as those of homogeneous aquifers. Afterward, five scenarios of PCE releasing into the underground environment with spill pressures of 33.0 kPa, 35.0 kPa, 37.0 kPa, 39.0 kPa, and 41.0 kPa are simulated based on 200 realizations to investigate the effects of spill pressure on PCE migration, distribution, and remediation efficiency in heterogeneous aquifers.

2.2. Implementing the Surfactant-Enhanced Aquifer Remediation

Due to low solubility, viscosity, and high density, the remediation of DNAPL contamination in the subsurface environment is quite challenging. Among all remediation techniques used for groundwater contamination, surfactant-enhanced aquifer remediation (SEAR) has been proven to be very effective in removing DNAPLs from aquifers [20,39,40,41,42]. Pump and treat (PAT) technology is a traditional remediation method used for the treatment of groundwater contamination. However, the remediation period of PAT is quite long and the corresponding cost is expensive with limited remediation effects. Other remediation technology like in situ chemical oxidation (ISCO) is suitable for the degradation of soluble contaminants in groundwater, while the remediation efficiency is very limited for DNAPL contamination. When SEAR is applied to a contaminated aquifer, surfactants can enhance the solubility and mobility of DNAPLs trapped in porous media. Afterward, the contaminants can be significantly removed from the aquifer by pumping groundwater [43,44,45]. Tween 80, persulfate, and citrate are usually used as surface-active agents in SEAR technology. The surfactant solution is injected into the contaminated aquifer through injection wells and then flushed through the entrapped DNAPLs. Additionally, the contaminants are removed from the aquifer through extraction wells.

2.3. Quantifying the Permeability and Entry Pressure

Porous media are treated as fractal media containing a bundle of tortuous capillary tubes. The microstructure of porous media is regarded as the right square pyramid microstructure (RSPM) (Figure S2). Indeed, the permeability and entry pressure of porous media can be obtained through the fractal method as follows [31,37]:
k = ϕ n η
P b = ω d o 1 n n
where k is the permeability of porous media; Pb is the entry pressure of porous media; ϕ = π δ D f 128 ( 4 D f ) ( 8 4 D f π δ D f ) 4 D f 2 D f ; Df is the fractal dimension of porous media; δ is a constant parameter; η = 4 D f 2 D f ; do is the median diameter of the pore; ω = cosθ; F is a parameter related to the tortuous capillary tube and groundwater flow direction; σ is the surface tension of the fluid; and θ is the contact angle between the liquid phase and solid phase.
The median diameter of the pore for RSPM can be calculated as:
d o = λ r 1 + λ r 2 + λ r 3 + Δ L r 4
where λ r 1 = 2 R v n 3 ( 1 n ) 3 ; λ r 2 = 2 L r 2 π R v 2 π ; λ r 3 = 2 3 4 L r 2 π R v 2 2 π ; Δ L r = R v ( 8 π 3 ( 1 n ) 3 2 ) ; L r = R v 8 π 3 2 ( 1 n ) 3 ; and Rv is the radius of the solid particles of porous media.

2.4. Dealing with the Heterogeneity of Porous Media

To simulate the realistic heterogeneous aquifer in nature, SGS is utilized in this study. SGS is widely used to characterize heterogeneous reservoirs which can capture the heterogeneous character of reservoirs and supply more accurate heterogeneity estimates compared to traditional interpolation approaches. The variance and mean value of the observed data are preserved through SGS to quantify and assess uncertainty. SGS is a stochastic simulation to generate multiple equiprobable realizations using the sequential principle and the Gaussian method rather than simply estimating the mean. Significantly, SGS has become popular in predicting the spatial distribution and assessing the uncertainty of porous media. In most cases, 40–400 realizations are suggested to estimate the uncertainty of heterogeneous reservoirs [46,47].

3. Results and Discussion

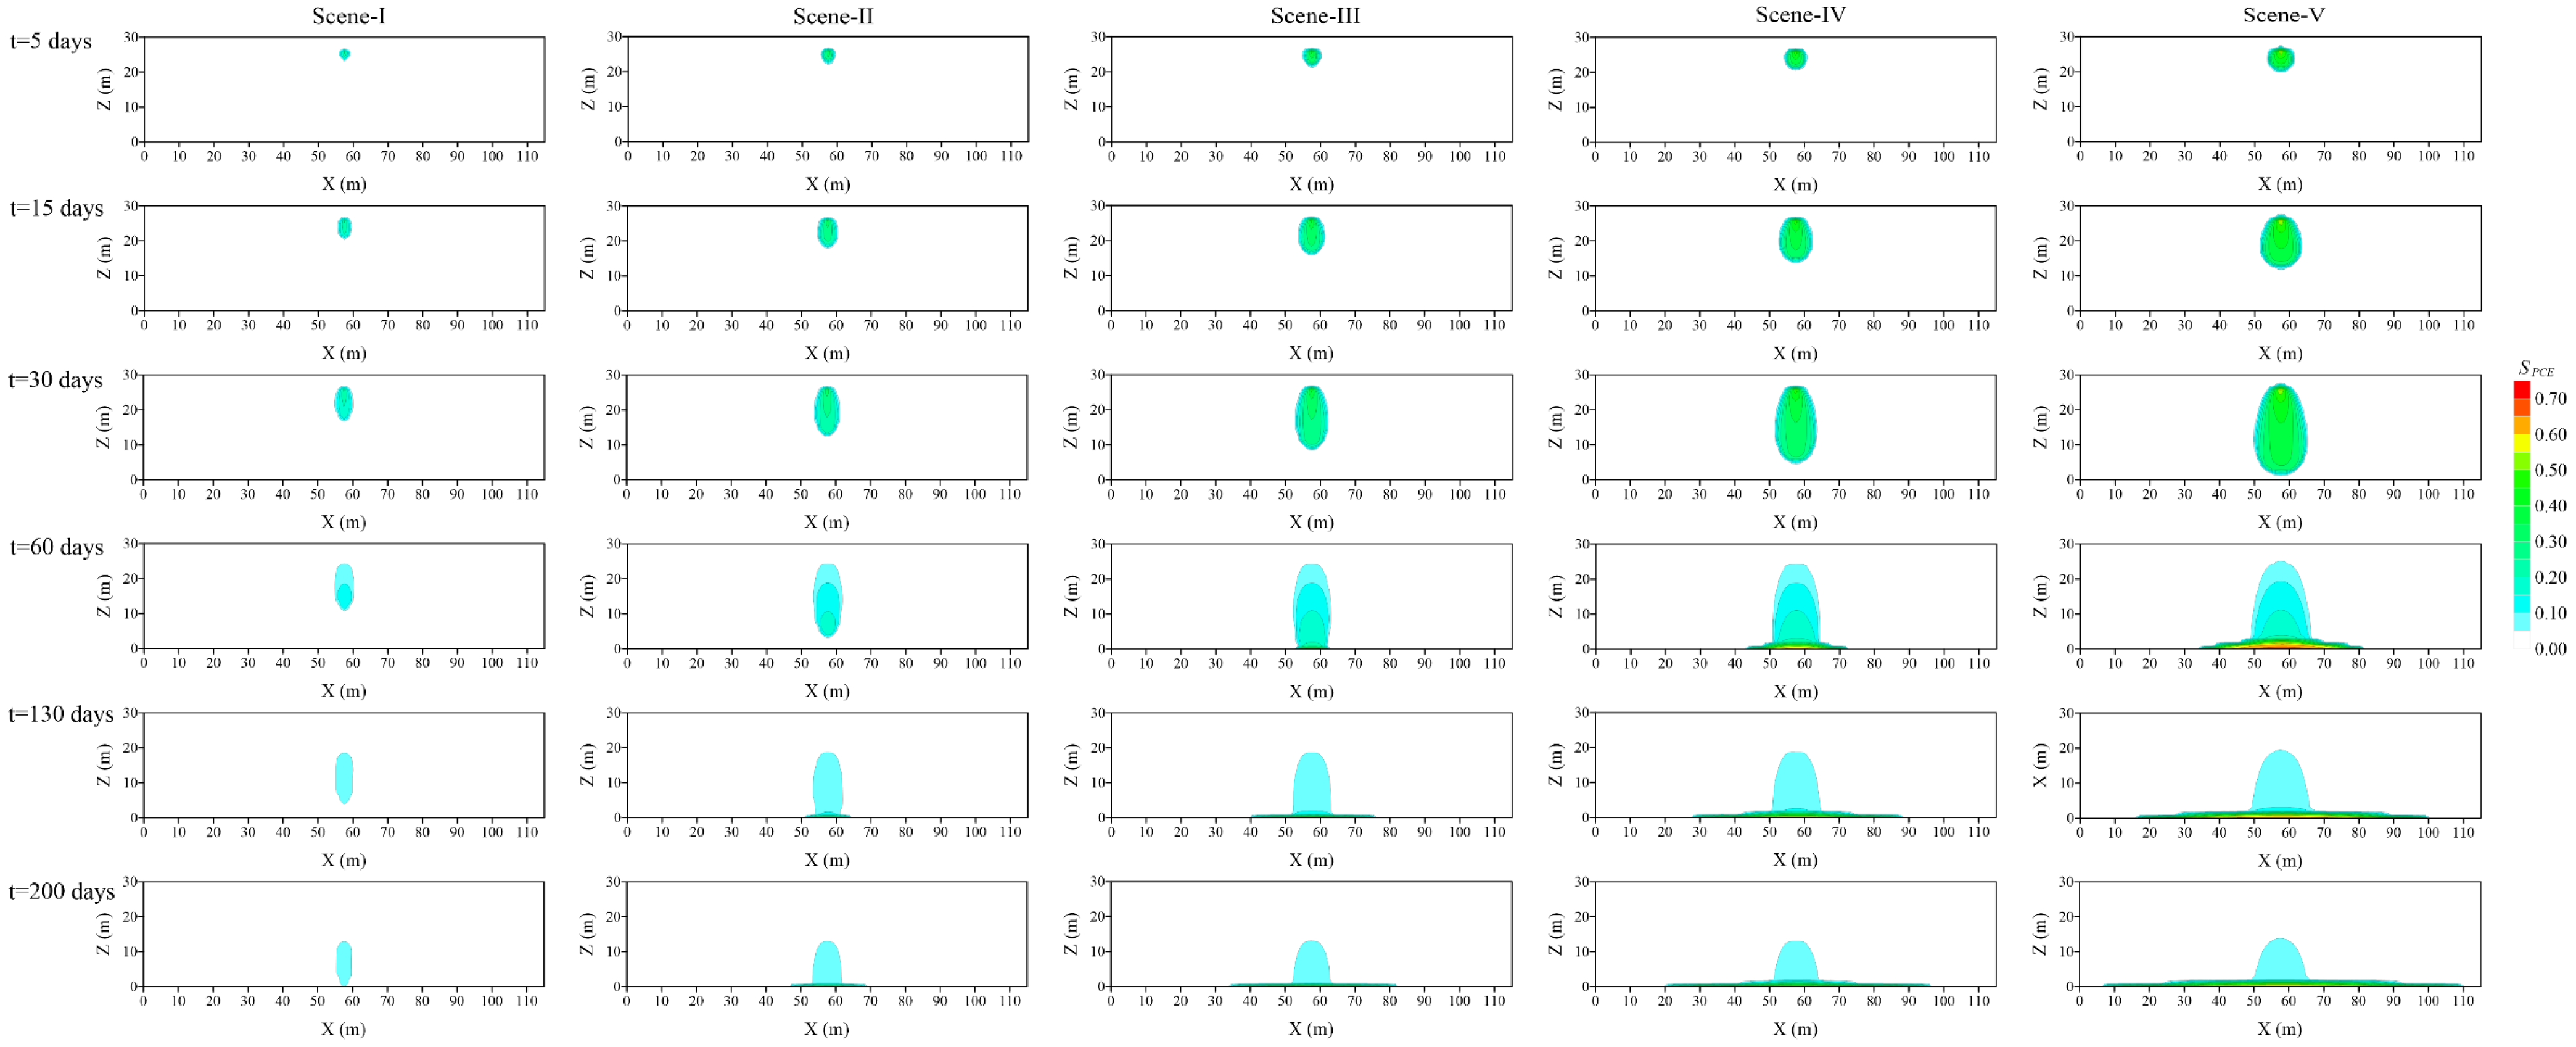
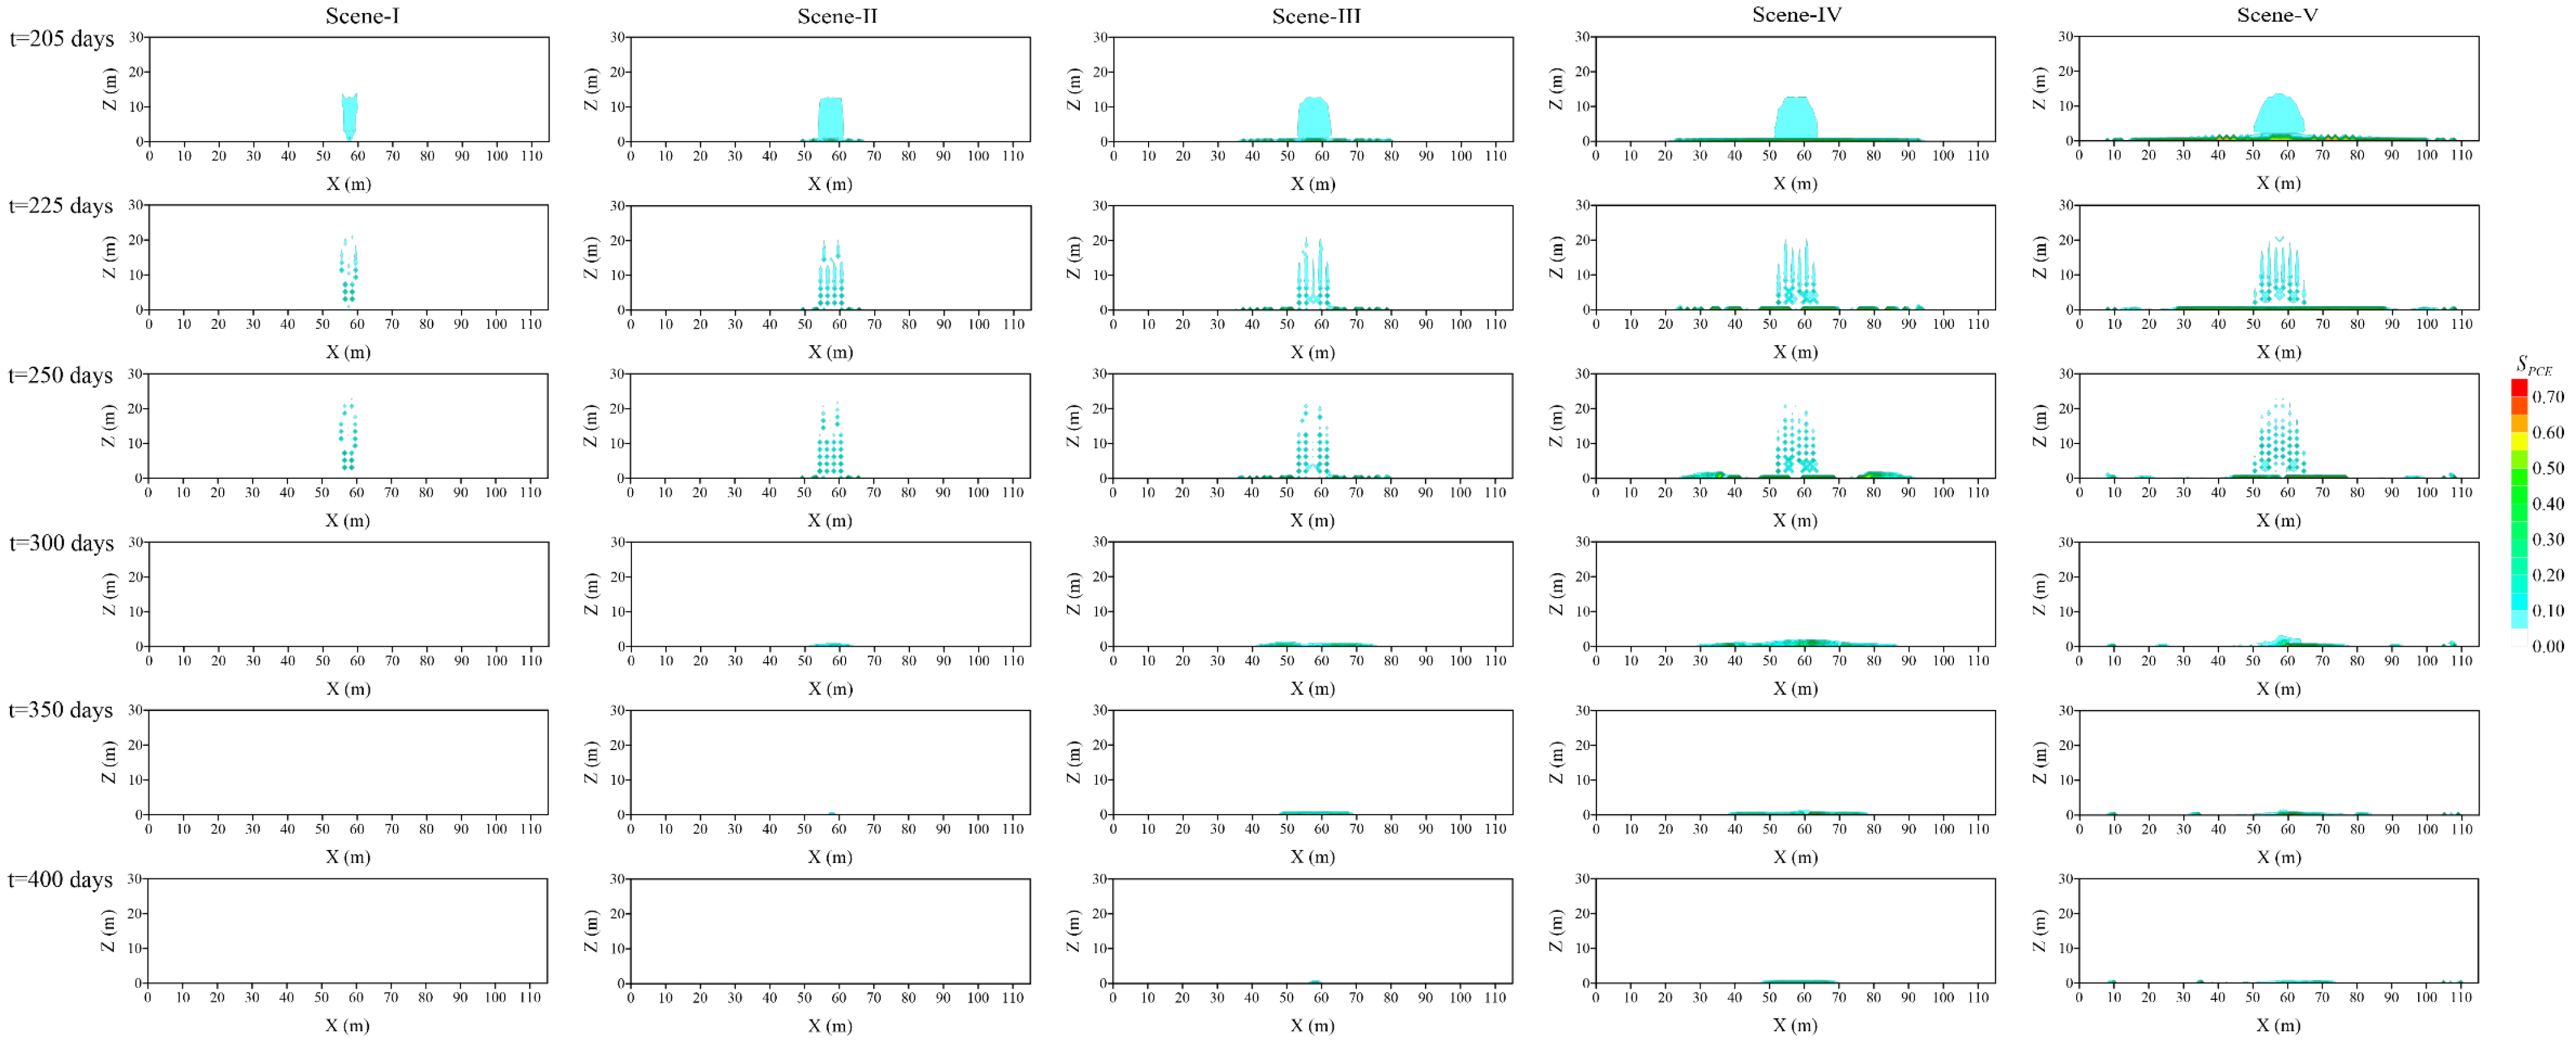
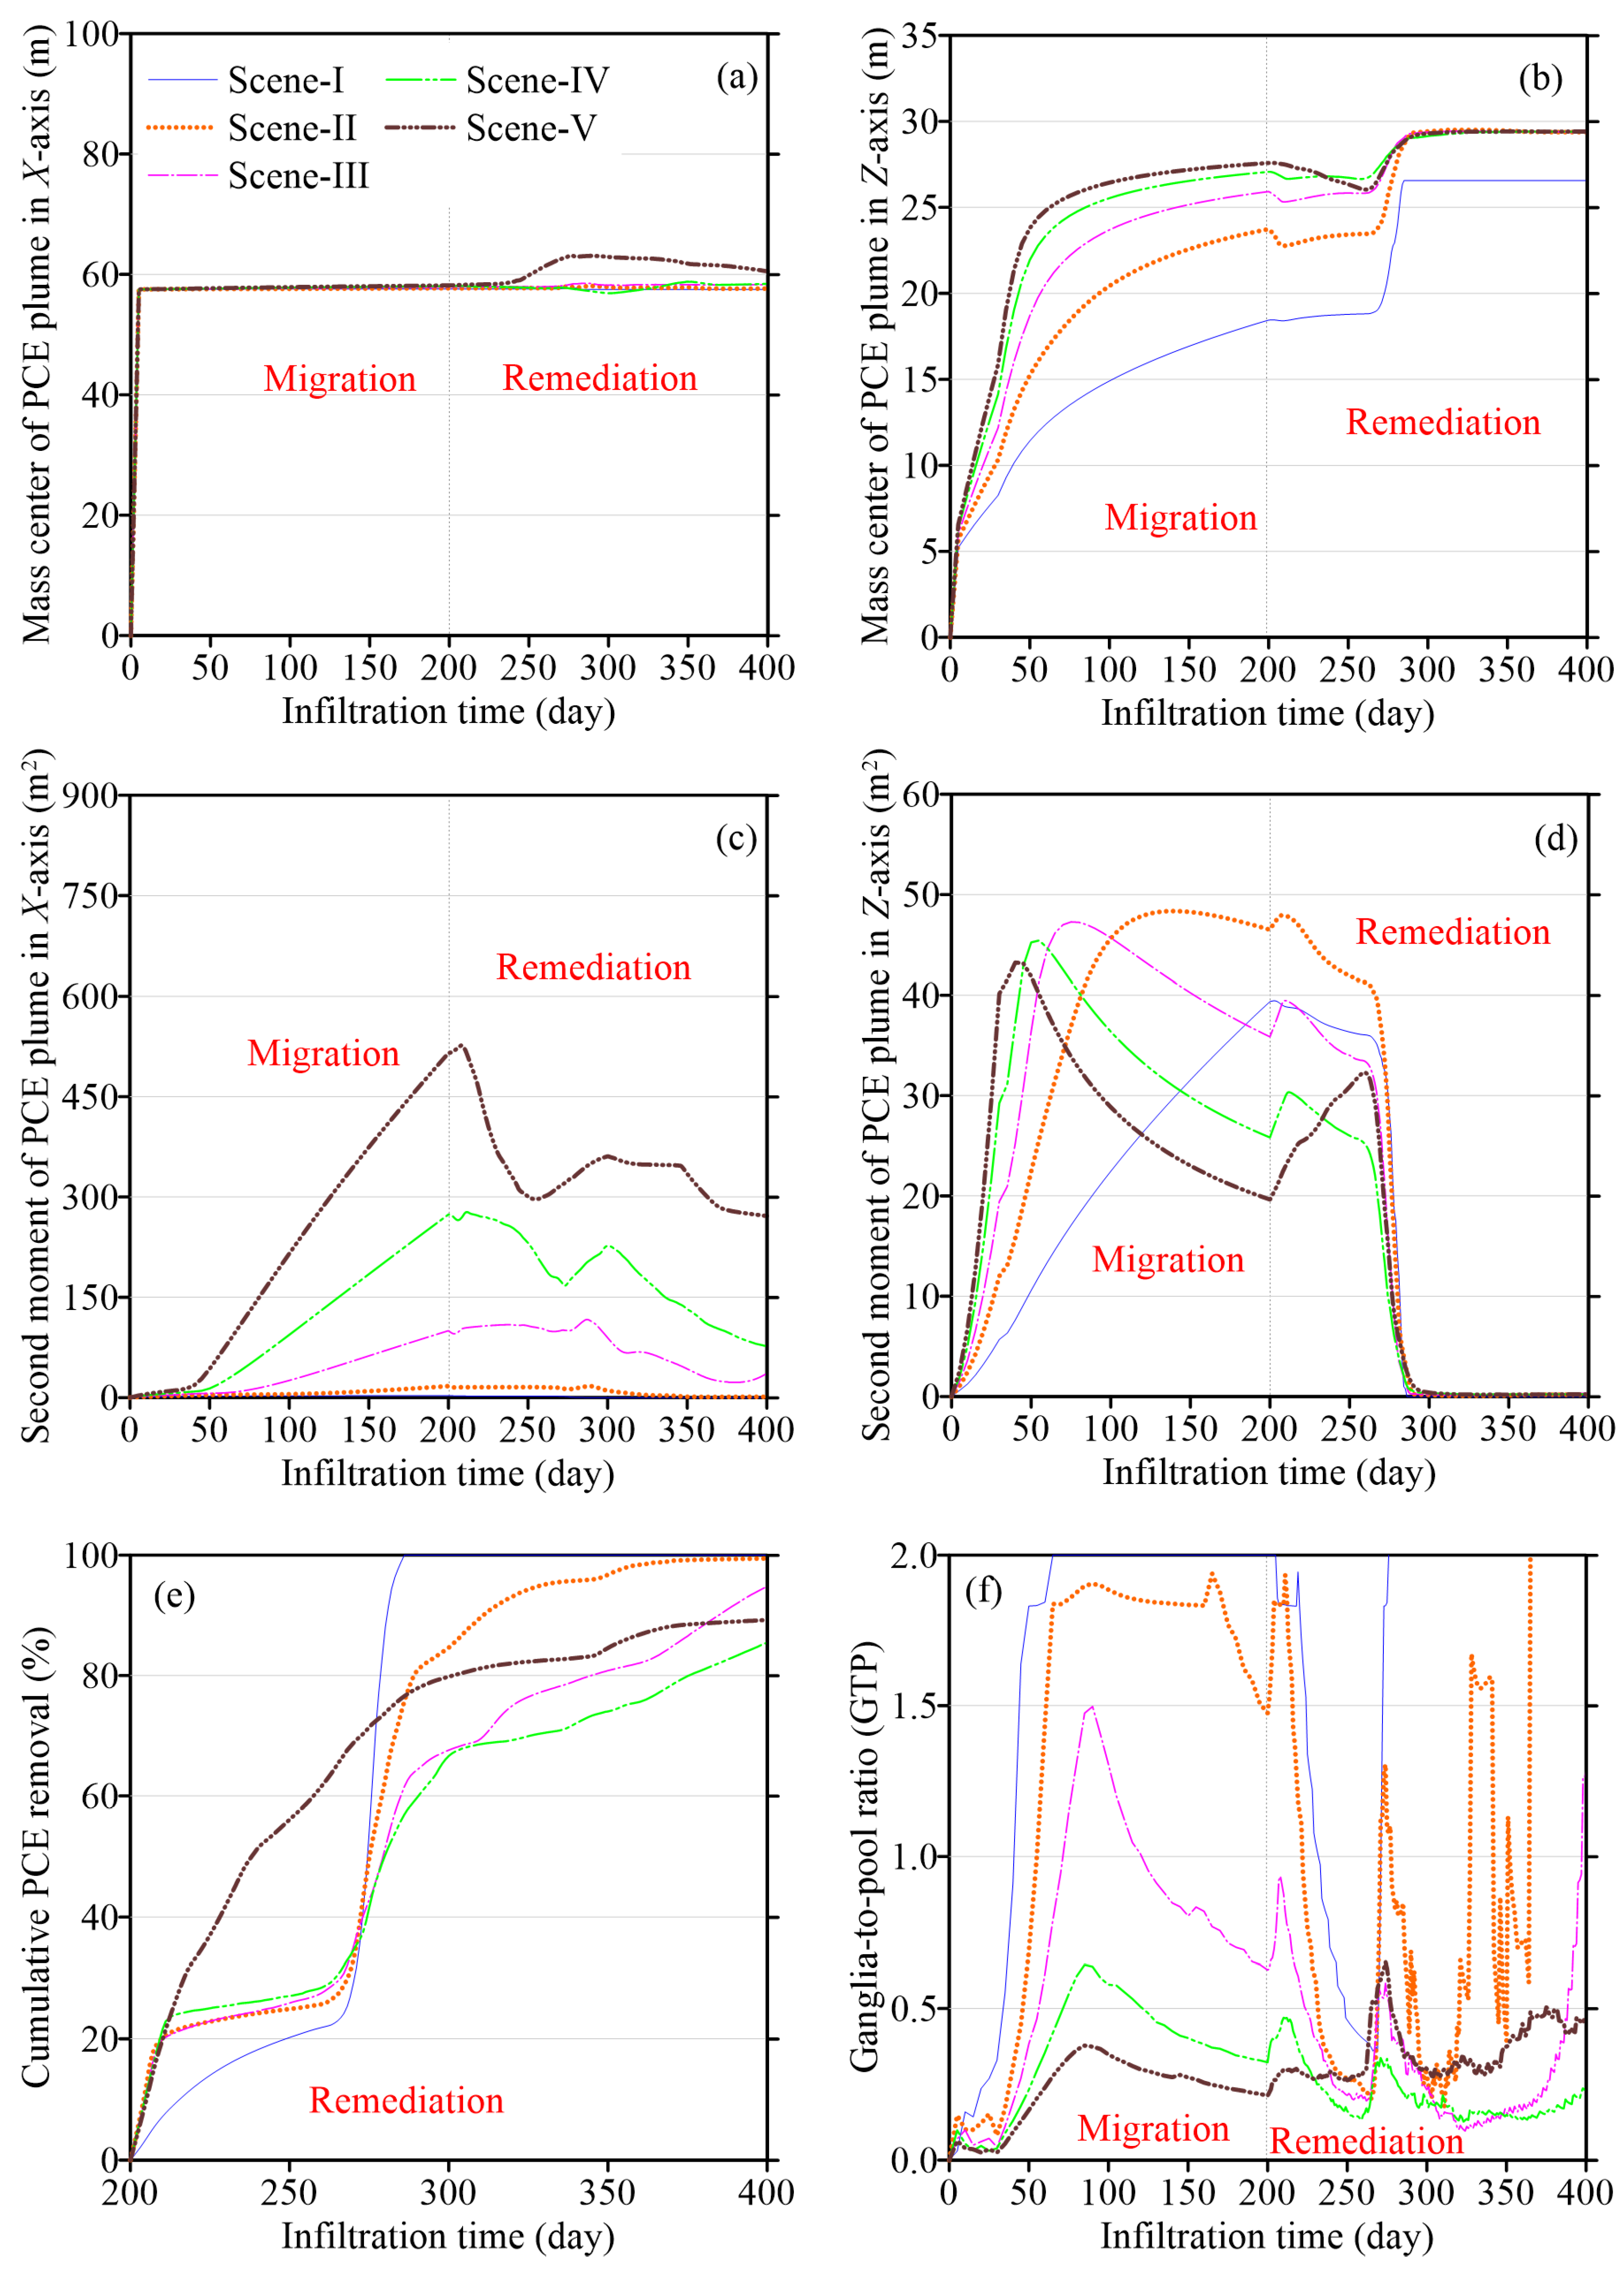
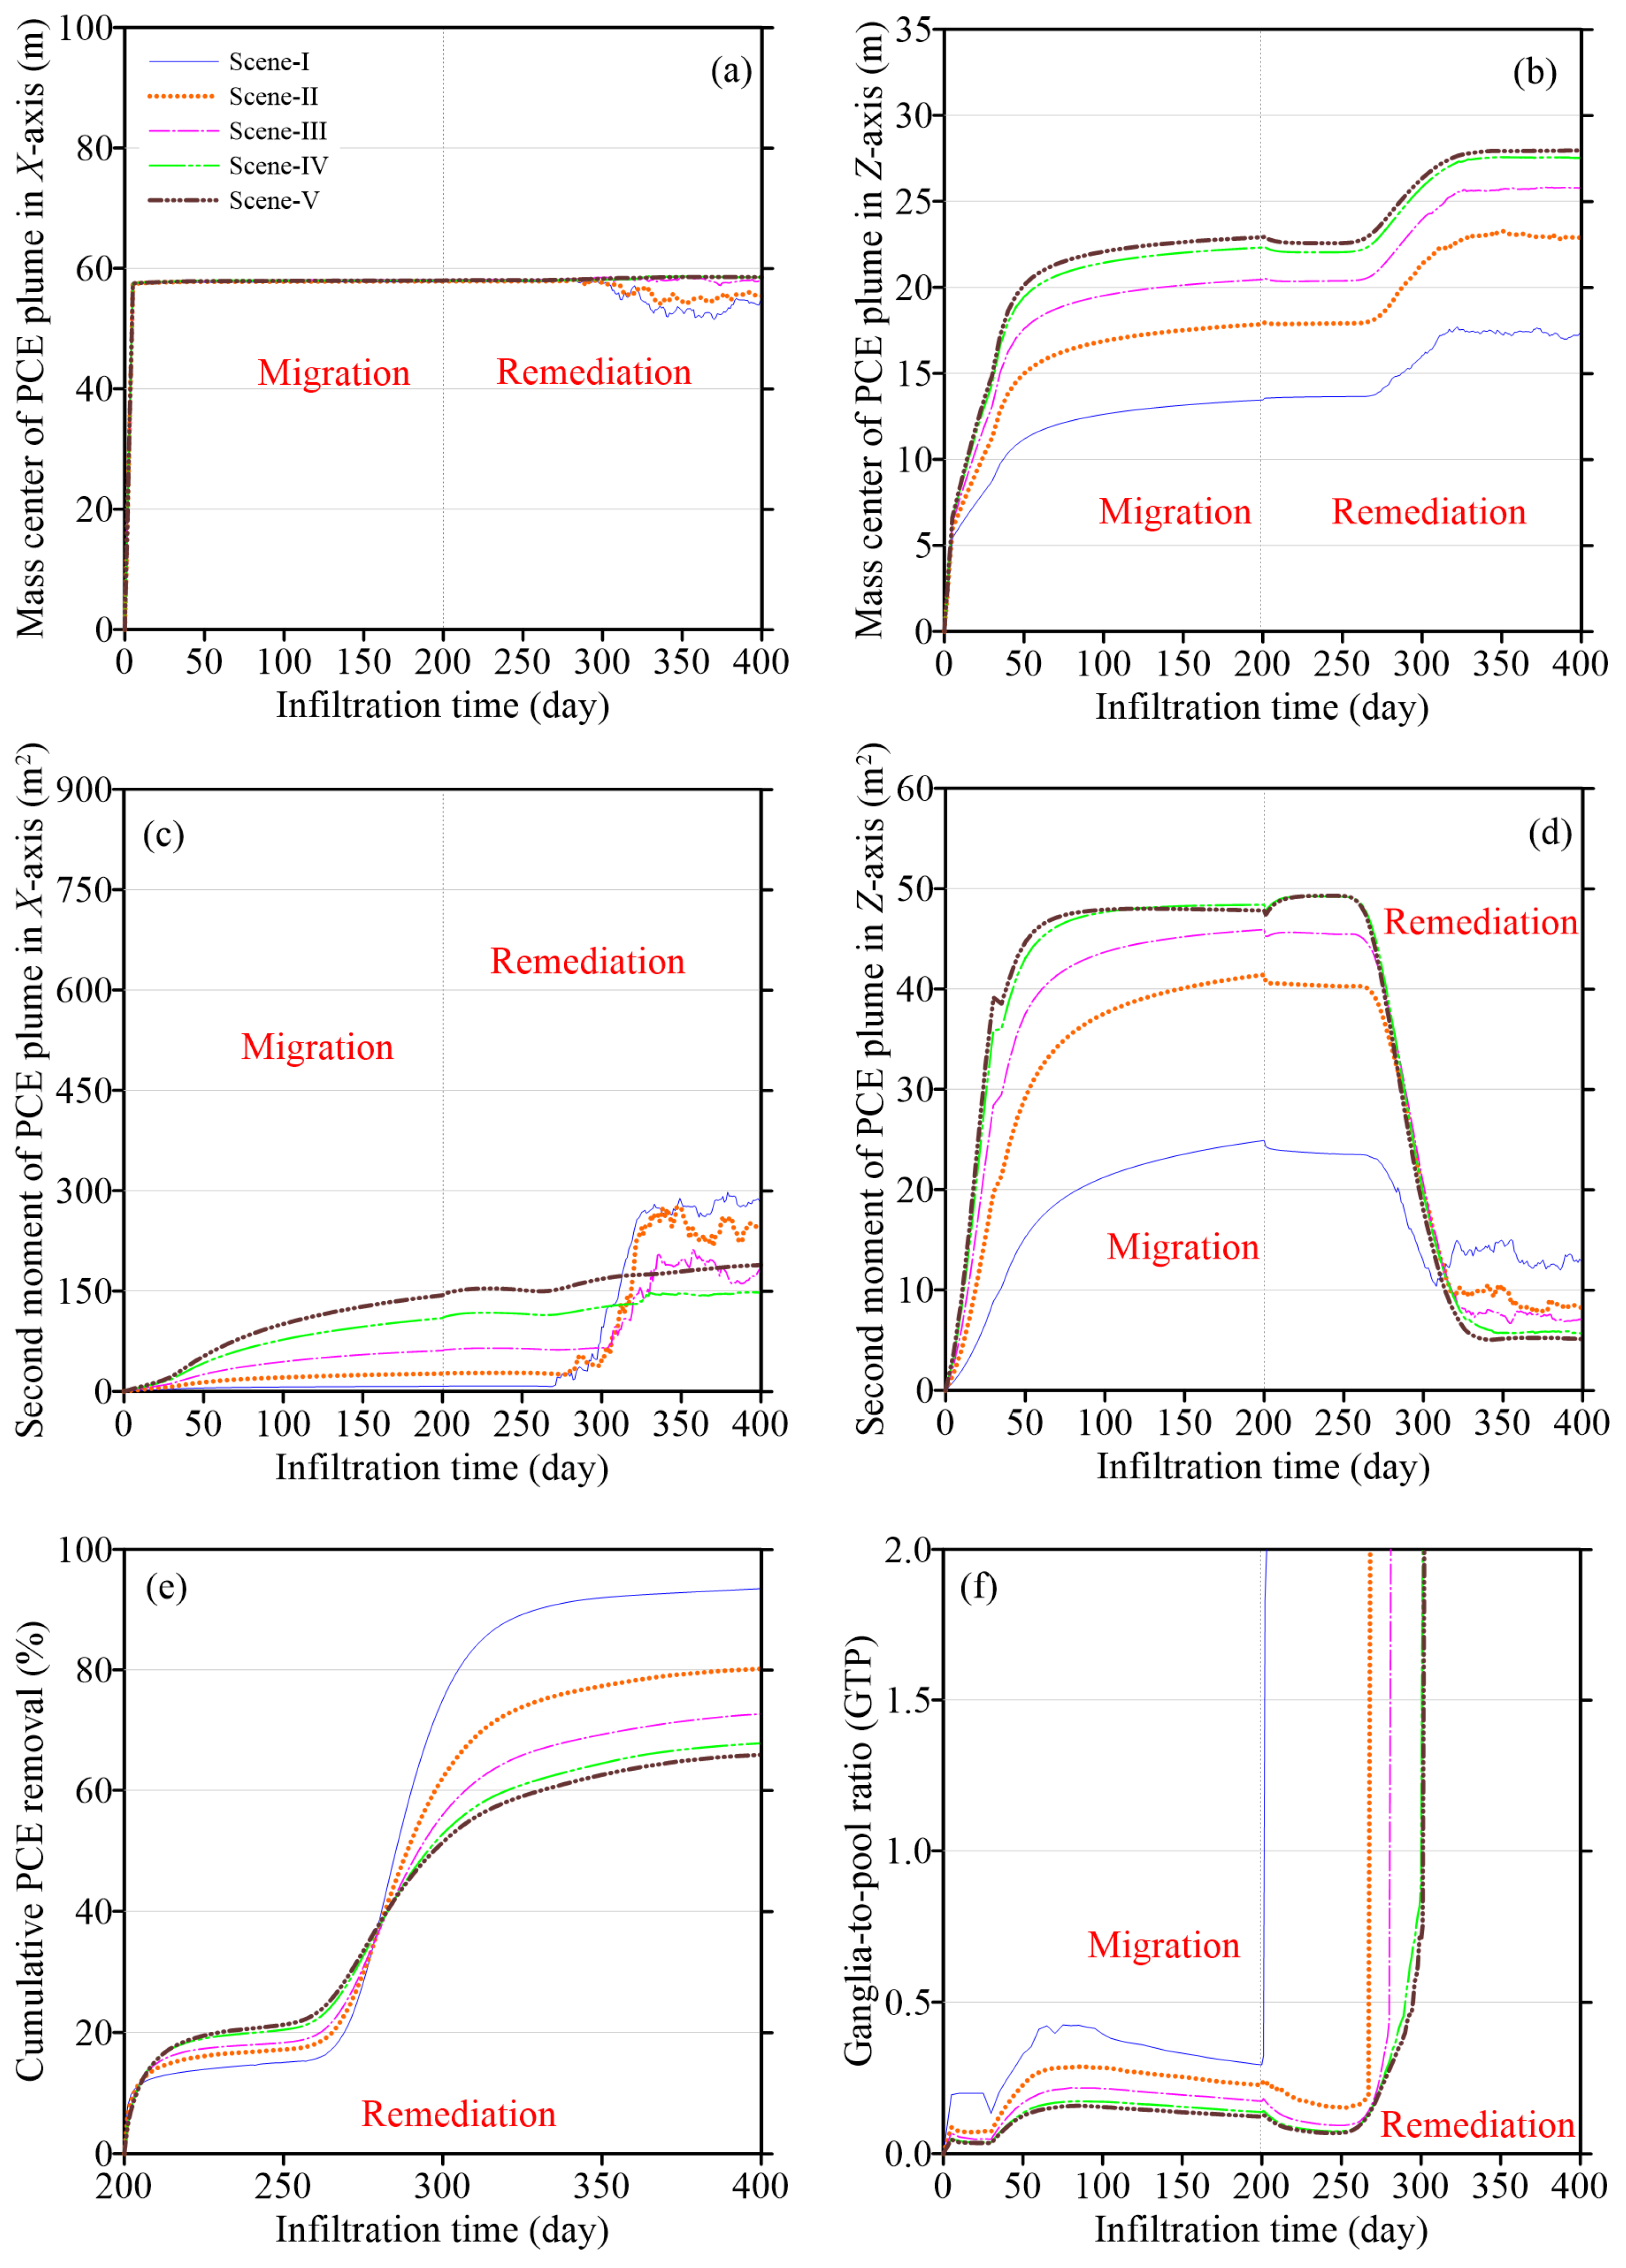
3.1. The Effect of Spill Pressure on DNAPL Migration and Remediation in the Homogeneous Aquifer

The simulation results of PCE migration for five scenarios with different spill pressures of contamination sources are shown in Figure 1. Different scenarios have different results of PCE migration and distribution under different spill pressures. The PCE plumes infiltrate faster in the vertical direction. The PCE releases from the upper layer of the aquifer under spill pressure. Afterward, PCE spreads from the spillage position to the lower layer in the subsurface environment. At t = 5 days, PCE distribution is shaped like a drop of water and spread as if a balloon is being inflated. As time goes on, PCE plume becomes bigger and bigger (the second moment of PCE plume in the X-axis increases from 3.02 m2 to 515.22 m2 during t = 5~200 days for scenario-V). However, the shapes of the PCE distribution in scenarios with higher spill pressure are wider than the PCE plume in scenarios with lower spill pressure. For scenario-V, the PCE plume touches the bottom of the aquifer and accumulates at the bottom with a wider final range (103 m). Nevertheless, the PCE plume of scenario-I with low spill pressure only touches the bottom of the aquifer but does not accumulate. From the simulated results of PCE migration and distribution, the spill pressure has an important considerable influence on PCE behaviors in homogeneous aquifers.
The results of PCE remediation via SEAR for five scenarios in a homogeneous aquifer are illustrated in Figure 2. As depicted in Figure 2, the trapped PCE contaminants in the aquifer are almost cleaned with surfactant flushing (the cumulative PCE removal rate is close to 100%). The surfactant is injected into the aquifer from the right and left injection wells (Figure S1). The surfactant flows from the two injection wells to the middle of the aquifer to flush the entrapped PCE in the aquifer. Afterward, the PCE and surfactant are pumped away from the middle extraction well. The remained PCE quantity in the aquifer at t = 400 days increases as the spill pressure of the contamination source rises. Figure 2 reveals that the presence of the spill pressure of the contamination source increases the remained PCE quantity in the homogeneous aquifer after SEAR application, resulting in a decrease in corresponding remediation efficiency in the homogeneous aquifer (the remediation efficiency decreases from 100% to 79.83% as the spill pressure increases from 33.0 kPa to 41.0 kPa at t = 300 days). These results indicate that the spill pressure also has an obvious effect on the remediation process and remediation efficiency of DNAPL contamination in homogeneous aquifers, which should be considered for the prediction of the DNAPL distribution and associated remediation scheme design to improve the effect of subsurface environmental treatment.
To reveal the difference in PCE behaviors between different scenarios, six indexes are calculated from the simulation results (Figure 3). The variations of PCE mass center in the horizontal spread of five scenarios are very similar and do not show obvious differences (Figure 3a). Nevertheless, the depths of the PCE mass center are different for five scenarios during the migration and remediation periods (Figure 3b). The vertical infiltration of scenario-V has the highest speed while the PCE plume infiltrates slowly for scenario-I, implying the infiltration speed in the vertical direction increases with the rise in spill pressure. The differences among the five scenarios are more obvious for the second moment of the PCE plume (Figure 3c,d). The scenarios with a higher spill pressure (39.0 kPa and 41.0 kPa) of the contamination source have a higher second moment of the PCE plume along the horizontal direction (Figure 3c). Simultaneously, the variation of the second moment of the PCE plume in the vertical direction is different (Figure 3d). The second moment of the PCE plume in the vertical direction of scenario-I increases continuously during migration periods and decreases during remediation periods. However, for scenario-II, scenario-III, scenario-IV, and scenario-V, the second moment of the PCE plume in the vertical direction firstly increases and then decreases during the migration period. After the migration period, the second moment of the PCE plume in the vertical direction decreases during the remediation period. The remediation efficiency of the scenarios with a high spill pressure (39.0 kPa and 41.0 kPa) is less than the remediation efficiency of the scenarios with a low spill pressure (33.0 kPa and 35.0 kPa) (Figure 3e). Furthermore, the ganglia-to-pool ratio (GTP) [20] of the five scenarios exhibits a similar tendency during the migration and remediation periods (Figure 3f). During the migration period, the GTP first increases due to the fact that the PCE saturation is low and then decreases as the PCE mass increases and accumulates in the aquifer. During the remediation period, the GTP variation shows obvious oscillations. Surfactants can increase the solubility and mobility of the PCE and decrease the PCE saturation in aquifers. On the other hand, the PCE mass is removed from the aquifer by surfactant flushing continuously during the remediation period. As a result, the GTP value increases and decreases in rotation. Significantly, the GTP of the scenarios with a higher spill pressure (39.0 kPa and 41.0 kPa) achieves smaller values, implying that the spill pressure leads to a decrease in the GTP value of the PCE plume.

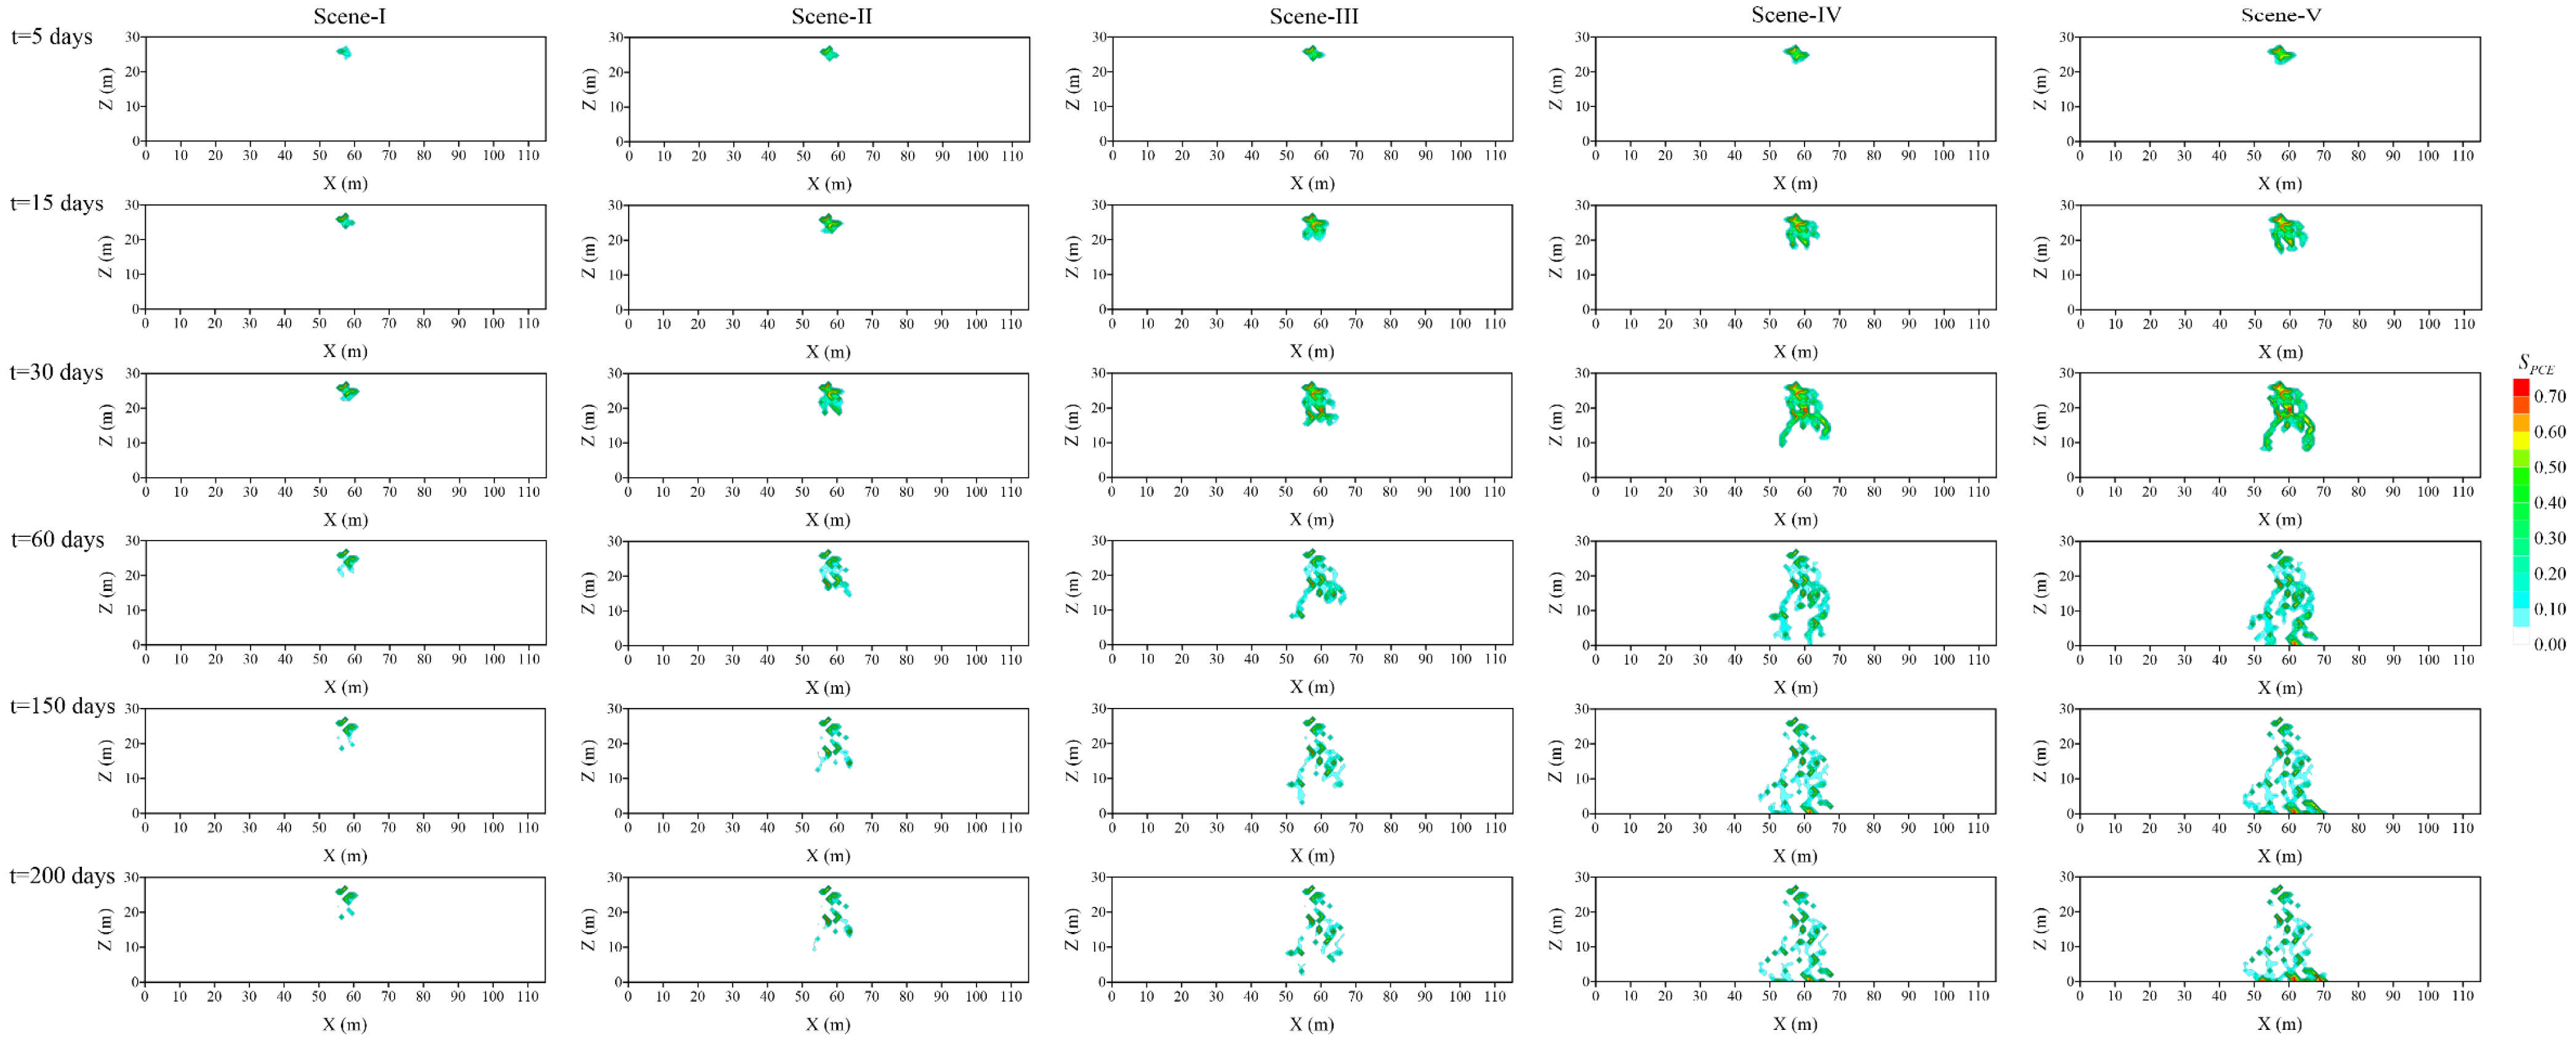
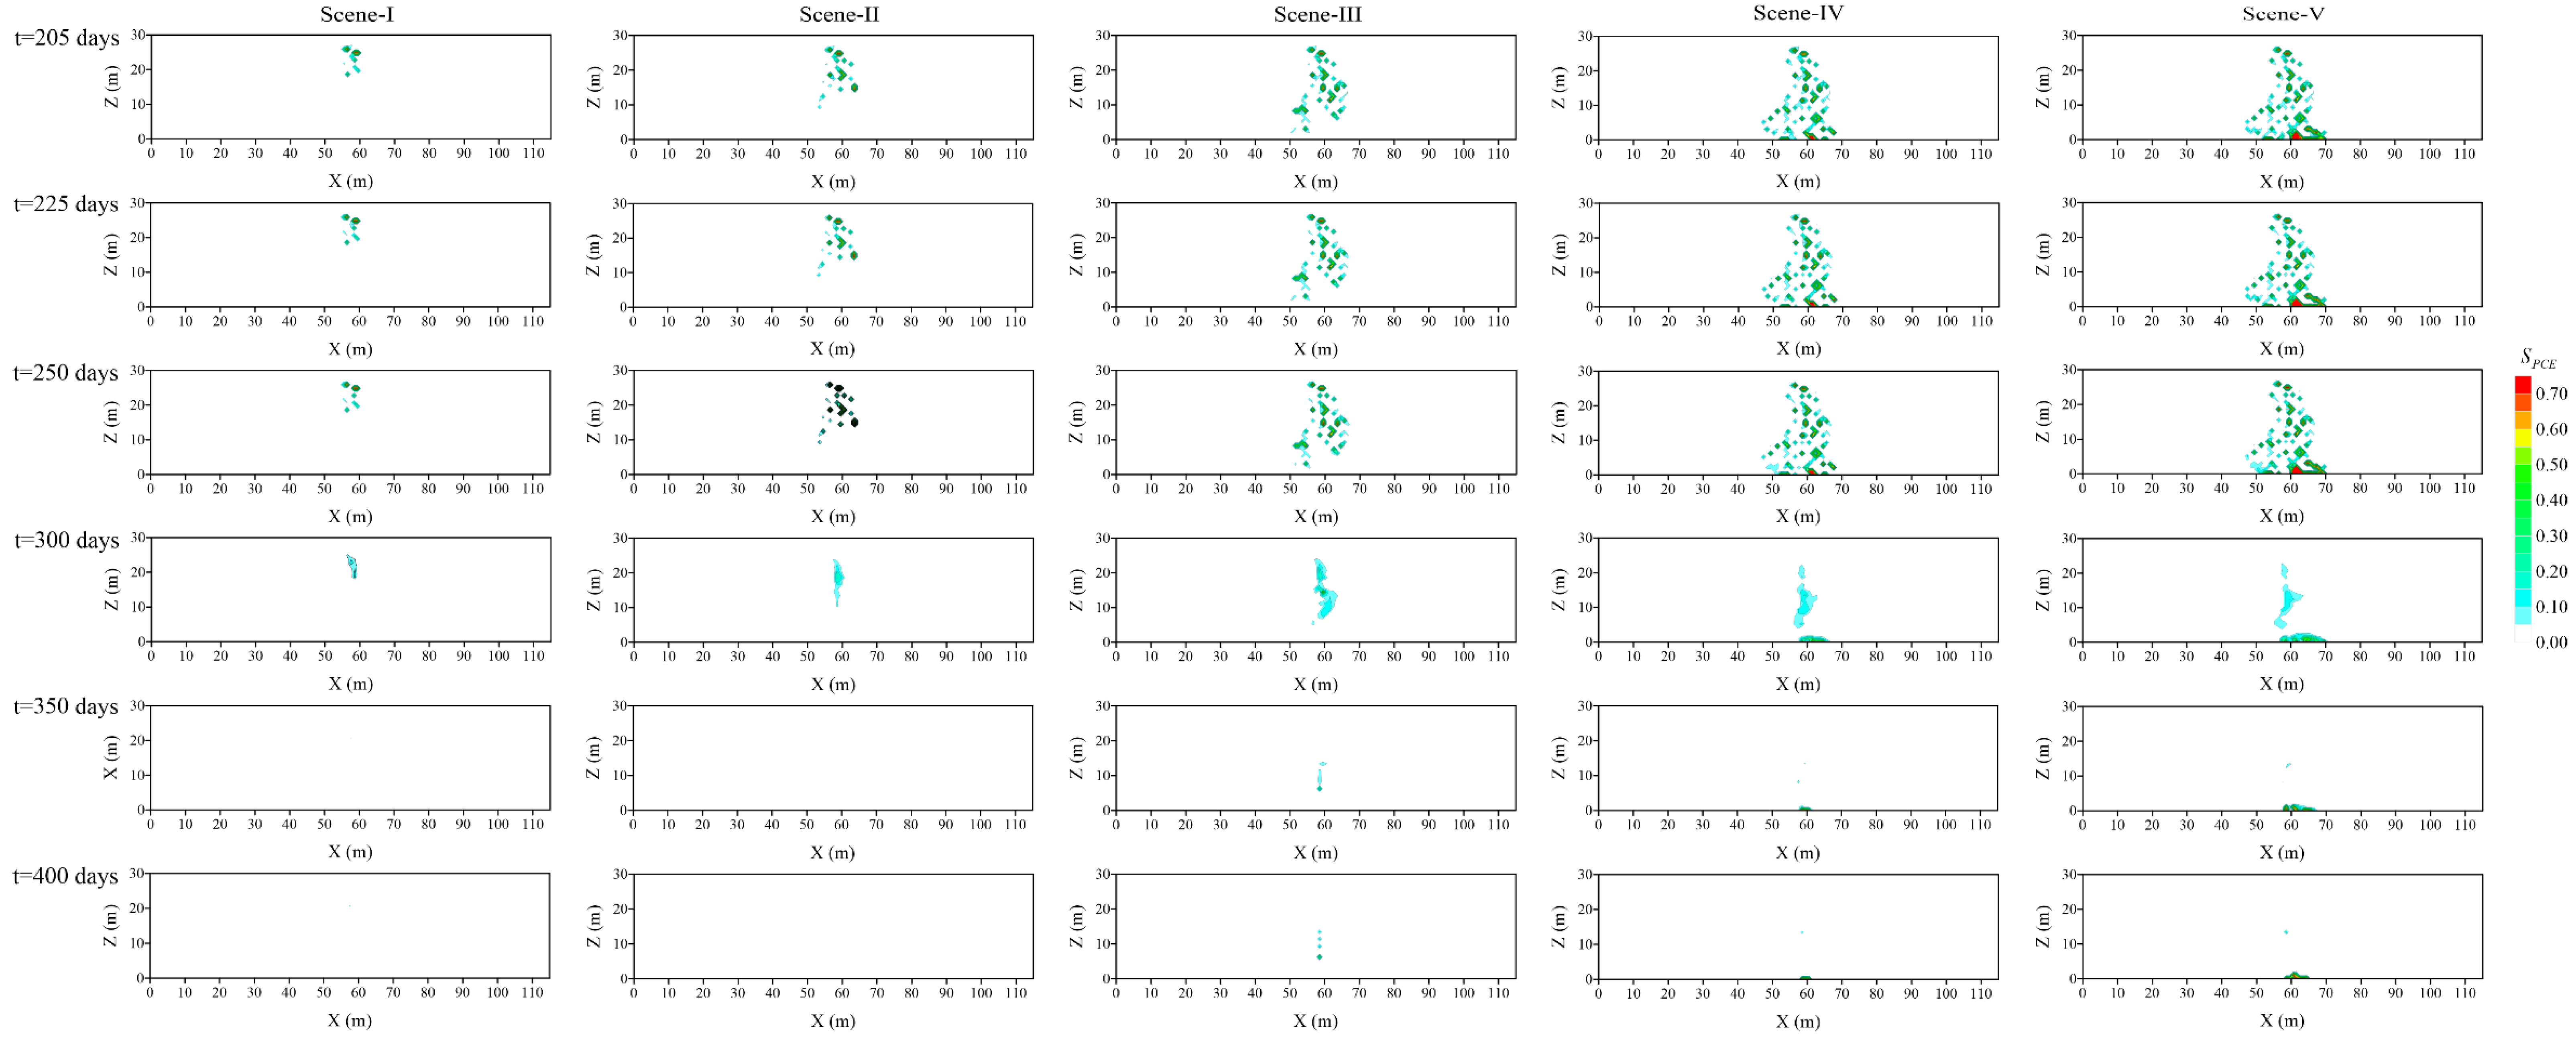
3.2. The Effect of Spill Pressure on DNAPL Behaviors in the Heterogeneous Aquifer

To investigate the spill pressure of the contamination source on DNAPL behaviors in the heterogeneous aquifer, the PCE migration and remediation are simulated in random porosity fields with 200 realizations. A single simulation from 200 realizations is presented in Figure 4 and Figure 5 to provide a quantitative description of DNAPL migration, distribution, and remediation in a particular heterogeneous aquifer. Significantly, the heterogeneity makes PCE migration and distribution more irregular. The PCE migrates along preferential pathways in heterogeneous aquifers with increasing variability in mass distribution. As shown in Figure 4, the PCE vertical infiltration speed and the plume range along horizontal and vertical directions all increase with the spill pressure of the contamination sources. These results reveal that a large spill pressure of an underground contamination source promotes both the lateral and vertical movement of the PCE in heterogeneous aquifers. Under the effect of spill pressure, the PCE can infiltrate quickly and reaches the deeper position of the aquifer with a more irregular morphology of the PCE body and an increased plume.
The PCE remediation process of a single realization for five scenarios is presented in Figure 5. The PCE distribution shows a similar pattern of the results in Figure 5. The entrapped PCE mass is cleaned up efficiently with the shortest time for scenario-I. At t = 300 days, all trapped PCE mass is almost removed for scenario-I. With spill pressure increasing, the residual PCE mass increases and the contaminated heterogeneous aquifer is more difficult to remediate. For scenario-V, with the highest spill pressure, some PCE mass still remains at the bottom of the aquifer after a long remediation period (t = 200~400 days), which indicates that the spill pressure of the underground contamination source should be considered for subsurface environmental treatment.
For the simulation based on random porosity fields, a more meaningful description of the effect of spill pressure on DNAPL behavior in a heterogeneous system requires the examination of a series of realizations. The average results of 200 realizations for five scenarios are shown in Figure 6a–f, illustrating the variability in PCE migration, distribution, and remediation efficiency among five scenarios with different spill pressures. The simulation based on sufficient realizations of random porosity fields provides an approximation to the entire estimate of all possible realizations of the heterogeneous aquifer and corresponding DNAPL behaviors under the effect of spill pressure. Moreover, a more complete understanding of the average results of PCE migration, distribution, and remediation can be obtained under heterogeneous conditions.
The center of PCE mass in the horizontal axis based on 200 realizations presents a similar tendency for the five scenarios (Figure 6a). However, the depth of the PCE mass in scenario-V is the largest (the mass center of the PCE plume in the Z-axis is 27.95 m at t = 400 days) compared to scenarios with a lower spill pressure (Figure 6b), indicating that the higher spill pressure can promote faster PCE infiltration along the vertical direction. For the second moment of the PCE plume in both the horizontal and vertical directions, the average values of the five scenarios based on 200 realizations are different. With a rise in spill pressure, the second moment of the PCE plume becomes larger, while fluctuations appear during the remediation period due to the surfactant flushing of the contaminants in the heterogeneous aquifer. As a matter of fact, scenario-I (33.0 kPa) achieves the highest remediation efficiency (93.49% at t = 400 days) and scenario-V (41.0 kPa) obtains the lowest remediation efficiency (65.90% at t = 400 days) (Figure 6e), implying that spill pressure can lower the remediation efficiency of the subsurface environmental treatment. The GTP of all five scenarios increases in the migration process first and then decreases slightly. When SEAR is applied to remove the trapped PCE in the aquifer, the GTP increases abruptly on a vast scale. From the view of the entire process, the GTP value decreases as the spill pressure rises so that scenario-V has the smallest GTP value, implying that the spill pressure leads to a decrease in the GTP and promotes the accumulation of PCE contaminants in the aquifer.
Figure 7a–f shows the results of six indexes at the end of the migration period (T = 200 day) and the end of the remediation period (T = 400 day) for PCE behaviors in the homogeneous aquifer and the average results of 200 realizations of the heterogeneous aquifer. From Figure 7a, it is clear that the spill pressure has no obvious effect on the center of the PCE mass in the horizontal direction. Nevertheless, the depths of the PCE mass center for homogeneous and heterogeneous conditions all exhibit an increasing trend as the spill pressure rises (Figure 7b), which indicates that the spill pressure of the underground contamination source can enhance PCE’s vertical migration. The second moment of the PCE plume in the horizontal direction mostly grows as the spill pressure increases, while the average of 200 realizations at T = 400 days shows a slight decreasing trend after SEAR remediation (Figure 7c). Furthermore, the second moment of the PCE plume in the vertical direction not only increases but also decreases with the spill pressure (Figure 7d). Apparently, the remediation efficiency and the GTP are influenced by the spill pressure. From the spill pressure of 33 kPa to 41 kPa, both the remediation efficiency and the GTP decrease (Figure 7e,f). These results reveal that the spill pressure increases the difficulty of contamination remediation and the GTP of the DNAPL plume, which promotes the accumulation of the DNAPL pool in the aquifer. However, this study only investigates the effects of the spill pressure of the contaminant source on DNAPL behavior in two-dimensional aquifers. As a matter of fact, natural aquifers are three-dimensional. Future work will explore the influences of the spill pressure of contaminant sources on DNAPL migration and remediation via SEAR in three-dimensional heterogeneous aquifers.

4. Conclusions

This study was performed to investigate the effects of the spill pressure of underground contamination sources on DNAPL behaviors in subsurface environments. Five scenarios with different spill pressures of underground contamination sources were simulated using UTCHEM in contaminated homogeneous and heterogeneous aquifers. A total of 200 realizations of heterogeneous porosity fields, permeability, and entry pressure fields were generated using the SGS method and the fractal method. The results suggest that the degree of spill pressure has an apparent effect on the model predictions. The simulations performed in a homogeneous aquifer and at different levels of spill pressure reveal a clear increase in PCE accumulation and spread with increasing spill pressure, and a corresponding decrease in remediation efficiency. The simulation based on 200 realizations of heterogeneous aquifers indicates that the spill pressure of underground contamination sources also has an important effect on DNAPL behaviors in heterogeneous aquifers. The simulations show a strong effect of spill pressure on DNAPL migration, distribution, and remediation, resulting in a decrease in remediation efficiency and GTP value, and an increase in the vertical spreading speed, penetration depth, the second moment of the PCE plume, and remediation difficulty. These trends are clear for both homogeneous and heterogeneous aquifers, suggesting that the initial spill pressure of underground contamination pressure is critical for the prediction of contaminant migration, distribution, and remediation in groundwater systems.

Supplementary Materials

The following supporting information can be downloaded at: https://www.mdpi.com/article/10.3390/su151713072/s1, Table S1: The properties of different kinds of sand; Figure S1: Schematic setup of contaminated aquifer; Figure S2: The microstructure of porous media.

Author Contributions

Z.C.: conceptualization, methodology, writing—original draft, and project administration; G.L.: conceptualization, methodology, and writing—original draft; M.W.: conceptualization, methodology, writing—review and editing, funding acquisition, and project administration; Y.H.: conceptualization and methodology; C.M.: conceptualization and methodology; Q.L.: conceptualization and methodology; J.W. (Jianfeng Wu): conceptualization and methodology; J.W. (Jichun Wu): conceptualization and methodology; B.X.H.: conceptualization and methodology. All authors have read and agreed to the published version of the manuscript.

Funding

This research was supported by the Natural Science Foundation of Guangzhou City (no. 202201010414), the Natural Science Foundation of Guangdong Province (nos. 2022A1515010273, 2023A1515012228), and the National Key Research and Development Plan of China (no. 2019YFC1804302).

Data Availability Statement

The data will be made available on request.

Conflicts of Interest

The authors declare no conflict of interest.

References

  1. Ibrahim, S.I.; Yadav, P.K.; Dwiandani, A.; Liedl, R.; Dietrich, P. An approach for quantification of the heterogeneity of DNAPL source zone geometries. J. Contam. Hydrol. 2022, 251, 104096. [Google Scholar]
  2. Valletti, N.; Budroni, M.A.; Albanese, P.; Marchettini, N.; Sanchez-Dominguez, M.; Lagzi, I.; Rossi, F. Hydrodynamically-enhanced transfer of dense non-aqueous phase liquids into an aqueous reservoir. Water Res. 2023, 231, 119608. [Google Scholar] [PubMed]
  3. Feo, A.; Celico, F.; Zanini, A. Migration of DNAPL in Saturated Porous Media: Validation of High-Resolution Shock-Capturing Numerical Simulations through a Sandbox Experiment. Water 2023, 15, 1471. [Google Scholar] [CrossRef]
  4. Maire, J.; Fatin-Rouge, N. Surfactant foam flushing for in situ removal of DNAPLs in shallow soils. J. Hazard. Mater. 2017, 321, 247–255. [Google Scholar] [CrossRef] [PubMed]
  5. Wu, M.; Cheng, Z.; Wu, J.F.; Wu, J.C. Quantifying representative elementary volume of connectivity for translucent granular materials by light transmission micro-tomography. J. Hydrol. 2017, 545, 12–27. [Google Scholar] [CrossRef]
  6. Lin, K.S.; Mdlovu, N.V.; Chen, C.Y.; Chiang, C.L.; Dehvari, K. Degradation of TCE, PCE, and 1,2–DCE DNAPLs in contaminated groundwater using polyethylenimine-modified zero-valent iron nanoparticles. J. Clean. Prod. 2018, 175, 456–466. [Google Scholar]
  7. Tatti, F.; Papini, M.P.; Sappa, G.; Raboni, M.; Arjmand, F.; Viotti, P. Contaminant back-diffusion from low-permeability layers as affected by groundwater velocity: A laboratory investigation by box model and image analysis. Sci. Total Environ. 2018, 622–623, 164–171. [Google Scholar] [CrossRef]
  8. Baldwin, B.R.; Taggart, D.; Chai, Y.Z.; Wandor, D.; Biernacki, A.; Sublette, K.L.; Wilson, J.T.; Walecka-Hutchison, C.; Coladonato, C.; Goodwin, B. Bioremediation Management Reduces Mass Discharge at a Chlorinated DNAPL Site. Groundw. Monit. Remediat. 2017, 37, 58–70. [Google Scholar] [CrossRef]
  9. Cianflone, S.P.L.; Dickson, S.E.; Mumford, K.G. On the Importance of Gravity in DNAPL Invasion of Saturated Horizontal Fractures. Groundwater 2017, 55, 27–37. [Google Scholar] [CrossRef]
  10. Kim, H.J.; Leitch, M.; Naknakorn, B.; Tilton, R.D.; Lowry, G.V. Effect of emplaced nZVI mass and groundwater velocity on PCE dechlorination and hydrogen evolution in water-saturated sand. J. Hazard. Mater. 2017, 322, 136–144. [Google Scholar]
  11. Mo, L.T.; Ye, S.J.; Wu, J.C.; Stahl, R.G., Jr.; Grosso, N.R.; Wang, J.C. Field application at a DNAPL-contaminated site in Nanjing and discussion of a source search algorithm based on stochastic modeling and Kalman filter. Environ. Earth Sci. 2017, 76, 92. [Google Scholar] [CrossRef]
  12. Maire, J.; Joubert, A.; Kaifas, D.; Invernizzi, T.; Marduel, J.; Colombano, S.; Cazaux, D.; Marion, C.; Klein, P.Y.; Dumestre, A.; et al. Assessment of flushing methods for the removal of heavy chlorinated compounds DNAPL in an alluvial aquifer. Sci. Total Environ. 2018, 612, 1149–1158. [Google Scholar] [CrossRef] [PubMed]
  13. Feng, C.; Liu, F.; Huang, F.Y.; Chen, L.P.; Bi, E.P. Dense nonaqueous phase liquids back diffusion controlled by biodegradation and heterogeneous sorption-desorption. J. Clean. Prod. 2023, 382, 135370. [Google Scholar]
  14. Wang, Z.B.; Lu, W.X.; Chang, Z.B.; Luo, J.N. A combined search method based on a deep learning combined surrogate model for groundwater DNAPL contamination source identification. J. Hydrol. 2023, 616, 128854. [Google Scholar] [CrossRef]
  15. Khasi, S.; Fayazi, A.; Kantzas, A. Break-up and mobilization of DNAPL by acoustic excitation: Experimental evidence and pore network modeling. Chemosphere 2023, 325, 138345. [Google Scholar] [CrossRef] [PubMed]
  16. Feo, A.; Pinardi, R.; Artoni, A.; Celico, F. Three-Dimensional High-Precision Numerical Simulations of Free-Product DNAPL Extraction in Potential Emergency Scenarios: A Test Study in a PCE-Contaminated Alluvial Aquifer (Parma, Northern Italy). Sustainability 2023, 15, 9166. [Google Scholar] [CrossRef]
  17. Erning, K.; Grandel, S.; Dahmke, A.; Schäfer, D. Simulation of DNAPL infiltration and spreading behaviour in the saturated zone at varying flow velocities and alternating subsurface geometries. Environ. Earth Sci. 2012, 65, 1119–1131. [Google Scholar] [CrossRef]
  18. Marzougui, S.; Schäfer, G.; Dridi, L. Prediction of Vertical DNAPL Vapour Fluxes in Soils Using Quasi-Analytical Approaches: Bias Related to Density-Driven and Pressure-Gradient-Induced Advection. Water Air Soil Pollut. 2012, 223, 5817–5840. [Google Scholar]
  19. McMillan, L.A.; Rivett, M.O.; Wealthall, G.P.; Zeeb, P.; Dumble, P. Monitoring well utility in a heterogeneous DNAPL source zone area: Insights from proximal multilevel sampler wells and sampling capture-zone modelling. J. Contam. Hydrol. 2018, 210, 15–30. [Google Scholar] [CrossRef]
  20. Wu, M.; Wu, J.F.; Wu, J.C.; Hu, B.X. A three-dimensional model for quantification of the representative elementary volume of tortuosity in granular porous media. J. Hydrol. 2018, 557, 128–136. [Google Scholar]
  21. Cochennec, M.; Davarzani, H.; Davit, Y.; Colombano, S.; Ignatiadis, I.; Masselot, G.; Quintard, M. Impact of gravity and inertia on stable displacements of DNAPL in highly permeable porous media. Adv. Water Resour. 2022, 162, 104139. [Google Scholar] [CrossRef]
  22. Omirbekov, S.; Colombano, S.; Alamooti, A.; Batikh, A.; Cochennec, M.; Amanbek, Y.; Ahmadi-Senichault, A.; Davarzani, H. Experimental study of DNAPL displacement by a new densified polymer solution and upscaling problems of aqueous polymer flow in porous media. J. Contam. Hydrol. 2023, 252, 104120. [Google Scholar] [PubMed]
  23. Wang, Y.; Bian, J.; Sun, X.; Ruan, D.; Gu, Z. Sensitivity-dependent dynamic searching approach coupling multi-intelligent surrogates in homotopy mechanism for groundwater DNAPL-source inversion. J. Contam. Hydrol. 2023, 255, 104151. [Google Scholar]
  24. Herzog, B.M.; Kleinknecht, S.M.; Haslauer, C.P.; Klaas, N. Experimental upscaling analyses for a surfactant-enhanced in-situ chemical oxidation (S-ISCO) remediation design. J. Contam. Hydrol. 2023, 258, 104230. [Google Scholar] [PubMed]
  25. Wang, Z.J.; Yang, Z.B.; Hu, R.; Chen, Y.F. Mass transfer during surfactant-enhanced DNAPL remediation: Pore-scale experiments and new correlation. J. Hydrol. 2023, 621, 129586. [Google Scholar] [CrossRef]
  26. Liang, X.; Li, Y.; Bai, J.; Dong, J.; Li, W.D.; Mo, Y.Y.; Jiang, D.H.; Zhang, W.H. Feasibility evaluation of novel anionic-nonionic gemini surfactants for surfactant-enhanced aquifer remediation. J. Clean. Prod. 2023, 393, 136338. [Google Scholar] [CrossRef]
  27. Walker, D.I.; Cápiro, N.L.; Chen, E.; Anderson, K.; Pennell, K.D. Micellar solubilization of binary organic liquid mixtures for surfactant enhanced aquifer remediation. J. Surfact. Deterg. 2023, 26, 357–368. [Google Scholar] [CrossRef]
  28. Bob, M.M.; Brooks, M.C.; Mravik, S.C.; Wood, A.L. A modified light transmission visualization method for DNAPL saturation measurements in 2-D models. Adv. Water Resour. 2008, 31, 727–742. [Google Scholar] [CrossRef]
  29. Liang, C.; Lai, M.C. Trichloroethylene degradation by zero valent iron activated persulfate oxidation. Environ. Earth Sci. 2008, 25, 1071–1077. [Google Scholar] [CrossRef]
  30. Liang, C.; Hsieh, C.L. Evaluation of surfactant flushing for remediating EDC-tar contamination. J. Contam. Hydrol. 2015, 177–178, 158–166. [Google Scholar] [CrossRef]
  31. Wu, M.; Cheng, Z.; Wu, J.F.; Wu, J.C. Effects of inner heterogeneity on long-term DNAPL migration in porous media. Environ. Earth Sci. 2017, 76, 791. [Google Scholar] [CrossRef]
  32. Kamon, M.; Endo, K.; Kawabata, J.; Inui, T.; Katsumi, T. Two-dimensional DNAPL migration affected by groundwater flow in unconfined aquifer. J. Hazard. Mater. 2004, 110, 1–12. [Google Scholar] [CrossRef] [PubMed]
  33. Bian, J.M.; Ruan, D.M.; Wang, Y.; Sun, X.Q.; Gu, Z.Q. Bayesian ensemble machine learning-assisted deterministic and stochastic groundwater DNAPL source inversion with a homotopy-based progressive search mechanism. J. Hydrol. 2023, 624, 129925. [Google Scholar] [CrossRef]
  34. Yoon, H.; Oostrom, M.; Wietsma, T.W.; Werth, C.J.; Valocchi, A.J. Numerical and experimental investigation of DNAPL removal mechanisms in a layered porous medium by means of soil vapor extraction. J. Contam. Hydrol. 2009, 109, 1–13. [Google Scholar] [CrossRef] [PubMed]
  35. Page, J.W.E.; Soga, K.; Illangasekare, T. The significance of heterogeneity on mass flux from DNAPL source zones: An experimental investigation. J. Contam. Hydrol. 2007, 94, 215–234. [Google Scholar] [CrossRef]
  36. Yang, Z.B.; Zandin, H.; Niemi, A.; Fagerlund, F. The role of geological heterogeneity and variability in water infiltration on non-aqueous phase liquid migration. Environ. Earth Sci. 2013, 68, 2085–2097. [Google Scholar] [CrossRef]
  37. Ahn, K.J.; Seferis, J.C. Simultaneous measurements of permeability and capillary pressure of thermosetting matrices in woven fabric reinforcements. Polym. Compos. 1991, 12, 146–152. [Google Scholar] [CrossRef]
  38. Delshad, M.; Pope, G.A.; Sepehrnoori, K. A compositional simulator for modeling surfactant enhanced aquifer remediation, 1 Formation. J. Contam. Hydrol. 1996, 23, 303–327. [Google Scholar] [CrossRef]
  39. Di Lorenzo, T.; Borgoni, R.; Ambrosini, R.; Cifoni, M.; Galassi, D.; Petitta, M. Occurrence of volatile organic compounds in shallow alluvial aquifers of a Mediterranean region: Baseline scenario and ecological implications. Sci. Total Environ. 2015, 538, 712–723. [Google Scholar] [CrossRef]
  40. Lee, M.; Kang, H.; Do, W. Application of nonionic surfactant-enhanced in situ flushing to a diesel contaminated site. Water Res. 2005, 39, 139–146. [Google Scholar] [CrossRef]
  41. Suchomel, E.J.; Pennell, K.D. Reductions in contaminant mass discharge following partialmass removal from DNAPL source zones. Environ. Sci. Technol. 2006, 40, 6110–6116. [Google Scholar] [CrossRef] [PubMed]
  42. Ciampi, P.; Esposito, C.; Bartsch, E.; Alesi, E.J.; Papini, M.P. Pump-and-treat (P&T) vs groundwater circulation wells (GCW): Which approach delivers more sustainable and effective groundwater remediation? Environ. Res. 2023, 234, 116538. [Google Scholar] [PubMed]
  43. Schaefer, C.E.; White, E.B.; Lavorgna, G.M.; Annable, M.D. Dense nonaqueous-phase liquid architecture in fractured bedrock: Implications for treatment and plume longevity. Environ. Sci. Technol. 2016, 50, 207–213. [Google Scholar] [CrossRef] [PubMed]
  44. Wang, L.; Mi, J.; Guo, Z. A modified lattice Bhatnagar–Gross–Krook model for convection heat transfer in porous media. Int. J. Heat Mass Transfer. 2016, 94, 269–291. [Google Scholar] [CrossRef]
  45. Weathers, T.S.; Harding-Marjanovic, K.; Higgins, C.P.; Alvarez-Cohen, L.; Sharp, J.O. Perfluoroalkyl acids inhibit reductive dechlorination of Trichloroethene by repressing dehalococcoides. Environ. Sci. Technol. 2016, 50, 240–248. [Google Scholar] [CrossRef]
  46. Eggleston, J.R.; Rojstaczer, S.A.; Peirce, J.J. Identification of hydraulic conductivity structure in sand and gravel aquifers: Cape Cod data set. Water Resour. Res. 1996, 32, 1209–1222. [Google Scholar] [CrossRef]
  47. Hu, K.; White, R.; Chen, D.; Li, B.; Li, W. Stochastic simulation of water drainage at the field scale and its application to irrigation management. Agr. Water Manag. 2007, 89, 123–130. [Google Scholar] [CrossRef]
Figure 1. Simulated PCE saturation in a homogeneous aquifer during the migration period (t = 0~200 days) for five scenarios with different spill pressures for contamination sources (X-axis represents horizontal direction, Z-axis represents vertical direction).
Sustainability 15 13072 g001
Figure 2. Simulated PCE saturation in the homogeneous aquifer during the remediation period (t = 200~400 days) for five scenarios (X-axis represents the horizontal direction, Z-axis represents the vertical direction).
Sustainability 15 13072 g002
Figure 3. The indexes varying with time for the homogeneous aquifer: (a) Mass center of PCE plume in X-axis. (b) Mass center of PCE plume in Z-axis. (c) Second moment of PCE plume in X-axis. (d) Second moment of PCE plume in Z-axis. (e) Contamination removal rate. (f) The ganglia-to-pool ratio (GTP).
Sustainability 15 13072 g003
Figure 4. Simulated contaminant plume for individual realization during migration period (t = 0~200 days) for five scenarios with different spill pressures for contamination sources (X-axis represents horizontal direction, Z-axis represents vertical direction).
Sustainability 15 13072 g004
Figure 5. Simulated contaminant plume for individual realization during remediation period (t = 200~400 days) under different conditions of spill pressure (X-axis represents horizontal direction, Z-axis represents vertical direction).
Sustainability 15 13072 g005
Figure 6. The average values of 200 realizations for six indexes varying with time: (a) Mass center of PCE plume in X-axis. (b) Mass center of PCE plume in Z-axis. (c) Second moment of PCE plume in X-axis. (d) Second moment of PCE plume in Z-axis. (e) Contamination removal rate. (f) The ganglia-to-pool ratio (GTP).
Sustainability 15 13072 g006
Figure 7. (af) The change of six indexes with spill pressures of contamination sources.
Sustainability 15 13072 g007
Disclaimer/Publisher’s Note: The statements, opinions and data contained in all publications are solely those of the individual author(s) and contributor(s) and not of MDPI and/or the editor(s). MDPI and/or the editor(s) disclaim responsibility for any injury to people or property resulting from any ideas, methods, instructions or products referred to in the content.

