Review

Decision Support Systems Based on Gaseous Emissions and Their Impact on the Sustainability Assessment at the Livestock Farm Level: An Evaluation from the User’s Side

1
Department of Natural Resources Development and Agricultural Engineering, Agricultural University of Athens, Iera Odos 75, 11855 Athens, Greece
2
Leibniz-Institute for Agricultural Engineering and Bioeconomy (ATB), 14469 Potsdam, Germany
3
Soils and Environment Research Centre, Irish Food and Agriculture Development Authority (TEAGASC), Johnstown Castle, Y35 TC97 Wexford, Ireland
4
Faculty of Civil Engineering, Architecture and Environmental Engineering, University of Zielona Góra, 65-417 Zielona Góra, Poland
*
Authors to whom correspondence should be addressed.
Sustainability 2023, 15(17), 13041; https://doi.org/10.3390/su151713041
Submission received: 28 July 2023 / Revised: 22 August 2023 / Accepted: 23 August 2023 / Published: 29 August 2023

Abstract

:
To achieve national and global air quality and climate change objectives, the agricultural sector increasingly requires dependable decision support tools for gaseous emissions at the farm level. We evaluated thirteen greenhouse gas (GHG)-based decision support systems (DSS), considering criteria such as not only the accessibility, user-friendliness, stakeholder involvement, sustainability methodology, and modeling aspects, but also the input parameters and outputs provided, all crucial for decision making. While most DSSs provide information for facilitating their use, only four are suitable for inexperienced users, and stakeholder participation in DSS development is infrequent. The dominant methodology for farm-level GHG estimation is IPCC 2006, with quantitative models primarily used for indicators’ assessment. Scenario and contribution analyses are the prevailing decision support approaches. Soil, crop, and fertilizer types are the most implemented non-livestock-related inputs, while climate- and feed-related costs are the least required. All DSSs assess farm-level mitigation measures, but less than half offer sustainability consultation. These tools promote environmental sustainability by evaluating mitigation strategies, disseminating farm sustainability information, and guiding sustainable farm management. Yet, challenges such as disparate estimation methods, result variations, comparison difficulties, usability concerns, steep learning curves, the lack of automation, the necessity for multiple tools, the limited integration of the results, and changing regulations hinder their wider adoption.

1. Introduction

GHG emissions have a negative impact on the environmental sustainability of farm systems and globally [1]. In the year 2020, the agri-food sector was responsible for 31% of the global anthropogenic GHG emissions estimated in terms of carbon dioxide equivalents (CO2 eq) [2]. Specifically, the agri-food sector emitted 21%, 53%, and 78% of the global CO2, CH4, and N2O gases, respectively [2]. In addition, in the year 2020, sources from livestock production systems (i.e., enteric fermentation, manure management, and manure left on pasture) emitted approximately 4 billion tons of CO2 eq, corresponding to 54% of the GHG emissions from agriculture, forestry, and land use (AFOLU) [3]. CO2, CH4, and N2O emissions from the agricultural sector and their cumulative effect on climate change’s impact can be assessed by employing the global warming potentials (GWPs in kg CO2 eq per kg of gas emission) of these gases [4,5,6]. The IPCC guidelines provide the most widely accepted methodological approach for estimating GHG emissions from livestock systems at the country level which, due to the definition of the relevant emission factors, could also be used at the farm level [7]. GHG emissions constitute a significant group of indicators for the sustainability assessment of agricultural systems [4,8,9]. Emission management has a strong impact on environmental sustainability, not only related to climate change, but also to pollution and air quality [10].
Today, there is a growing urgency to convey accurate information regarding GHG emissions and the impact of mitigation practices at the individual livestock farm level to a diverse range of interested parties [11,12,13]. Apart from the increased effect of livestock production on global GHG emissions, the willingness for the direct promotion of mitigation actions in a sustainable way for the livestock farmer dictates this need. Moreover, it is nearly unfeasible for farmers to obtain accurate measurements of GHG emissions—and not only of these emissions—from all potential sources at the livestock farm level. Consequently, there is an anticipated rise in the significance of software-based farm-scale decision support systems (DSSs) centered on GHG emissions [14]. These tools aim to provide targeted, comprehensible advice to the user for acting in the direction of reducing GHG emissions from the farming system of interest. The wider use of DSSs related to agriculture by the targeted end-users is an important challenge, since the use of these tools, even by qualified and well-trained users, is still limited [11,15]. The GHG DS tools are not used by the majority of livestock farmers, since it is not yet obligatory for them to have knowledge of the GHG emitted from their farms. Moreover, GHG DS tools have been developed relatively recently in relation to the other agricultural DSSs (e.g., crop inputs management and herd management) [16,17].
It is critical to study the major characteristics of the estimation methodologies and the impact of GHG and other pollutants (e.g., ammonia) on sustainability. This would lead to a further understanding on how to improve existing emission-based DS tools. A number of previously published works has reviewed the sustainability assessment methods of relevant tools [18,19,20,21,22,23,24,25,26,27,28]. Among these, two works have further compared the results between GHG-based DSSs and sustainability assessment tools [18,26]. Two of these works have also referred to GHG emissions as an environmental sustainability indicator without further analyzing the emission estimation methodology and the results [18,23]. Other reviews have focused on examining the GHG emissions’ estimation methodology [11,15,22,29,30,31,32,33,34,35,36]. Nevertheless, the connection between the size of the GHG emissions and the impact on three-pillar sustainability has not been adequately elaborated. Most of the review papers in the literature evaluated the agricultural GHG emissions’ calculators or the sustainability assessment tools, without attempting to form a connection between the GHG emissions’ estimation with the sustainability assessment procedure. Nevertheless, decision making is to be better associated with a group of sustainability indicators, including GHG emissions and their mitigation [37]. Furthermore, the majority of the evaluations do not focus on the connection between the stakeholders and the tools (i.e., the stakeholder involvement in the tools’ development and the user-centric characteristics of tools). There seems to be a lack of a user-centric perspective on evaluation methodologies. In addition, a combined evaluation of the general characteristics, inputs, and outputs of the tools is not common. In most of the cases, the outputs or the general characteristics or the methodology of the tools are not evaluated, or the evaluation is focused more on one of these three aspects [18,38].
This review article uses a unified evaluation methodology for DSSs that do not have the same functions, usage, inputs, and outputs, though they present the impact of the farming practices on farm-scale gas emissions (mostly GHGs). Therefore, the main target of this review is to evaluate DS tools that use different processes, methodologies, and outputs but have the same objective of examining farm-scale gas emissions. More specifically, a review of available farm-scale GHG-based DS tools will be provided, as well as their characterization with respect to the emissions included and the factors determining these emissions. Various aspects of the DS tools which are related to the estimation of gaseous emissions, the user interface, and their functions will be analyzed. Furthermore, the most frequently employed categories of inputs (i.e., categories of parameters but also separate parameters) and outputs (i.e., categories and separate indicators) of the DS tools are selected, and checklists regarding the consideration or not of these parameters from the tools are presented.

2. Materials and Methods

2.1. Selection of DS Tools

This research employed the following search engines: Scopus, Google Scholar, Science Direct, and ResearchGate. For the best possible search results, the following keywords were used: ‘decision support tool’ AND ‘greenhouse gases’ AND ‘livestock’, ‘greenhouse gases assessment tools’ AND ‘livestock’, ‘decision support tool’ AND ‘greenhouse gases’ AND ‘livestock’ AND ‘sustainability’, and ‘’sustainability’’ AND ‘’greenhouse gases assessment tools’’. The use of the aforementioned keywords ensured that search results widely covered the tools related to the objectives of the study. Google Search Engine was further used for identifying reports from relevant research projects.
This procedure led to the selection of 16 peer-reviewed articles published in scientific journals (13 of them referred to DS tools and their methods’ evaluation, while, for 2 of them, the main focus was not on DS tools (e.g., conducting life cycle assessments to inform environmental decision making in commercial dairy farming, and exploration of sustainability assessment methodologies for food systems) [11,15,18,20,22,23,24,29,31,32,33,36,39,40,41,42]; as well, there were 8 papers reviewing tools individually [43,44,45,46,47,48,49,50], 11 papers based on case studies [19,51,52,53,54,55,56,57,58,59,60], 3 evaluation reports as an outcome of scientific projects (CCAFS, Alberta Government-Growing Forward 2, CLEANED-VCs), and 5 evaluation reports for DS tools or methods from other tool developers or scientific groups [26,34,61,62,63]). This work comprised the guidance for selecting not only the 13 DS tools to be evaluated (see Supplementary Material Table S1 for details) but also their evaluation criteria. The 13 DS tools finally selected were the following: Cool Farm Tool v2.0, FarmAC v1.8, Overseer v5.4, Carbon Navigator–Dairy, Carbon Navigator–Beef, KSNL – Kriteriensystem Nachhaltige Landwirtschaft, RISE v3.0–Response-Inducing Sustainability Evaluation, BEK v1.0—Berechnungsstandard für einzelbetriebliche Klimabilanzen in der Landwirtschaft, HOLOS v4.0, EX-ACT v9.0, GLEAM v2.0 (GLEAM-I), SAFA v2.2.41, and DLG—Nachhaltigkeitsstandard (based on REPRO).
In the DS tools’ selection, three important factors were considered: (a) the wide reference of these tools in the results of this search (using increased number of citations); (b) the collected proposals from the partners of the European project that this study acknowledges (ERA-NET MELS, www.mels-project.eu), and (c) the accessibility of these tools for further use by the authors of this study; personal use (i.e., experiencing the tools’ functionalities) of each one of these DS tools was considered to be of high importance in order to achieve a proper documentation of their evaluation. The tools selected for evaluation varied in terms of their main purposes for the end-user: (a) education (e.g., regarding sustainability assessment concepts in agricultural sector) (i.e., SAFA and RISE), (b) GHG emission estimation (i.e., Overseer, FarmAC, Cool Farm Tool, BEK, Carbon Navigator–Dairy, and Carbon Navigator–Beef), (i.e., HOLOS, GLEAM, EX-ACT, and RISE), (c) Scoring (e.g., provision of sustainability scores) (i.e., SAFA, RISE, KSNL, and DLG), and d) certification (e.g., certification of tool use and sustainability certification) (i.e., RISE, KSNL, and DLG). Thus, the majority of the tools were used by the authors of this study in order to experience their functionalities and complete this evaluation from the end-users’ perspective, to the extent that this is possible. However, some tools (KSNL, DLG, and RISE) were only evaluated based on evidence from literature [18,19,20,21,24,48,61,64,65,66] and their user guides, as a purchase of license was required to experience their complete versions. At this point, it should be noted that the two Carbon Navigator tools (Dairy and Beef) will be evaluated as one, due to the similarity of their functions.

2.2. DS Tools’ Classification

DS tools were initially grouped based on whether they assess indicators in more than one sustainability pillar. Three groups can therefore be considered (Figure 1): (a) the emissions’ calculators, which focus on the estimation of various emissions at the farm level; (b) tools which provide estimates for two sustainability pillars (emissions’ calculators also providing economic values about costs and profits), and (c) tools which deal with supplying the user with a view of farm sustainability for all pillars.

2.3. Evaluation of DS Tools

2.3.1. Descriptive Evaluation

This evaluation phase is based on other review papers [4,13,17,18,19,20,21,22,23,24,25,26,27,29,30,31] and review projects [38,40,42,62,63] relevant to the farm-level GHG-based DSSs. The characteristic of this part of the evaluation lies in the descriptive way the criteria are addressed. To connect the GHG emissions’ estimation with the sustainability assessment procedure, the calculators are simultaneously used in this evaluation with the multi-pillar sustainability assessment tools, focusing on the conversion of GHG emission values into sustainability impact indicators. The five criteria finally included in this descriptive evaluation were in accordance with [67].

2.3.2. Checklists

A checklist is a direct, clearly understood, and methodical way to collect and present data, that guarantees error management at a high level [68]. Checklists are used in order to provide information regarding the use and presence of critical inputs for estimations and sustainability definition [11,18,30,32,35,69]. In this procedure, all required inputs and generated outputs from the DS tools evaluated were listed and categorized. As a result, the most frequently employed categories of inputs (i.e., categories of parameters but also separate parameters) and outputs (i.e., categories and separate indicators) of the DS tools [11,18,30,32,35,69] were selected and a checklist for the tools is prepared. This checklist refers to whether the list of inputs and outputs in this report have been incorporated into the sustainability assessment in each tool or not. The input categories and outputs were also selected based on the work initially presented in [67].

3. Results

3.1. Descriptive Evaluation

3.1.1. Criterion 1: Degree of Accessibility

Table 1 provides information with respect to the degree of accessibility for the DS tools examined. It illustrates that the majority of the tools could be used without purchasing a license: five of them are free to download, seven of them are free for online use, and one (i.e., RISE) could be both downloaded as an application or used online. Additionally, the terms ‘freeware’ (software that is free to use for the public) and ‘open-source’ (software that provides an opportunity for the public to use and modify its code freely) were used to describe the type of software used.
The sub-criterion ‘registration required’ refers to the user’s need to register and whether the permission of the developer or owner is required for the use of the tool. For the majority of DS tools, registration is required. In the cases where permission from the tool developer is required, the most common method of communication is via e-mail.

3.1.2. Criterion 2: User-Friendliness

Five different sub-criteria were associated with the criterion of user-friendliness. The first one is the ‘level of expertise’, and it is connected to the user’s qualifications which are needed in order to work with the DS tool (e.g., ability to use a computer, applications, and web browsers; to undertake programming; etc.). Three types of expertise levels are considered: (a) the ‘inexperienced’ user—qualified only with the basic skills of using a computer and its functions; (b) the ‘experienced’ user—qualified with all the skills regarding computer use apart from programming knowledge; and (c) the ‘expert’ user—qualified with experience in computer use and experience in programming. An ‘inexperienced’ user could easily work with tools that have a user-friendly interface with many information prompts and that provide well-informed guidance.
The DS tools RISE, HOLOS, EX-ACT, KSNL, BEK, and GLEAM target more experienced users than the previously reported tools. RISE requires a comprehension of the user guide to use the tool efficiently, while the user should be aware of its compatibility with only Internet Explorer. The HOLOS tool is available for download and includes two versions—the ‘standard’ and the ‘research’ version—that are introduced in an extended user guide. Working with EX-ACT requires a download from the FAO’s website and knowledge on how to use MS Excel. BEK requires a general understanding of every GHG emission estimation parameter; additionally, the user has to download the proper Excel file among a lot of choices. The fact that KSNL is a complex of tools makes it more difficult to use its functions properly. The user interface in the GLEAM tool seems to be complex enough for inexperienced users (it is not feasible for the user to directly adapt to this interface). FarmAC requires expert users; programming knowledge would be needed to locate and handle the errors associated with the use of the tool.
The ‘degree of information provision—website’ (not presented in Table 2) refers to the amount of information which can be collected from the tool’s website and its adequacy. Three categories of websites could be considered: (a) the ‘totally informative’—detailed information and guidance is provided; (b) the ‘semi-informative’—additional information and guidance would be required, and (c) the ‘non-informative’—lacks important information and guidance. Eleven DS tools could be ranked as ‘totally informative’, because it is clear for the users how to acquire all the information and guidance they need. The websites of KSNL and BEK were classified as ‘semi-informative’. For KSNL, there is only one webpage with little information on the website of the Kuratorium für Technik und Bauwesen in der Landwirtschaft e.V. (KTBL). The webpage of BEK is more informative (also available on the website of KTBL). Nevertheless, the information provided on the webpage is inadequate for a complete understanding of the tool’s functions.
The next sub-criterion considered was the ‘degree of information provision’ in the DS tool’s user interface (not presented in Table 2). Three degrees of information provision were distinguished, taking into account the description and use of the parameters (inputs and results) of DS tools: (a) ‘totally informative’—tools whose interface provides many types of information to the user (e.g., information prompts and information texts); (b) ‘semi-informative’—tools whose user interface provides less information, and (c) ‘non-informative’—tools whose user interface does not provide any information. The majority of the DS tools in this evaluation could be classified as ‘totally informative’. FarmAC was the only tool classified as ‘semi-informative’. The user interface in FarmAC does not provide adequate user guidance about the inputs.
The fourth sub-criterion was the ‘provision of manuals/guidance’ to the user (e.g., provision of PDF file, user guide only available, etc.) (not presented in Table 2). All the DS tools provided such guidance to the users.
Regarding the ‘degree of simplicity’ associated with the tool, three degrees of simplicity can be distinguished: (a) ‘simple’—a tool with simple and easy steps from input completion to result reception, distinct information, and clear use, and is well-structured; (b) ‘semi-simple’—a tool which provides the aforementioned characteristics but to a lesser extent, and (c) ‘complex’—a tool whose use is unclear or requires special user qualifications. Table 2 suggests that KSNL, BEK, and FarmAC could not be ranked as ‘simple’. KSNL was reviewed as ‘semi-simple’; the co-existence and interaction of the four different tools, as well as the existence of an incomplete guide and the lack of relevant website information are the main reasons for defining its degree of simplicity this way. FarmAC use is based on programming knowledge in order to parametrize the tool and correct the errors.
The sub-criterion ‘presentation of results’ includes three types of presented results: (a) aggregated results, (b) scores, and (c) graphs. Aggregated results could represent the sum of the indicators’ estimates (e.g., total annual methane emissions at the farm level as a result of animal enteric fermentation and manure management chain) or an indicator estimate (e.g., kg CO2 equivalent/year as the sum of the GWPs associated with all annual GHG emissions at the farm level). Scores comprise the levels of the sustainability indicators’ performance for a specific farming system (e.g., a qualitative rating of the GHG emissions’ reduction achieved). With regard to a graphical representation of the results, various types of graphs are provided to the user (e.g., column and pie charts). Table 2 suggests that all the DS tools examined provide aggregated results, while the majority of them further provide a graphical representation of the results.
The sub-criterion ‘available results for downloading or saving’ includes information on whether the user can download (or not) or save the received results, and, if yes, the types of files which can be made available to the user. Table 2 shows that the majority of the DS tools provide the ability for the user to download the results in MS Excel spreadsheets.
The sub-criterion ‘data-entry error management’ refers to the way the DS tool responds in the case where errors are associated with the insertion of inputs by the user. The majority of the DS tools evaluated could readily handle errors. However, in FarmAC, programming knowledge would be required to locate the source of the error and, subsequently, handle it. Regarding error recovery, no functionality problems were observed after error correction in all DS tools. However, in FarmAC, the user might need to restart their input after an error.
Regarding the final sub-criterion ‘design of the user interface’, a well-designed user interface would include the following characteristics: clarity of information; the convenient placement of all choices to be selected and inputs of information; simple, complete, and distinct tables; and the convenient placement of figures/graphs. Considering the aforementioned characteristics, there seems to be potential for improvement in all the DS tools evaluated. This could also be understood via a simple comparison between the current and previous versions of the tools. The DS tools that include half or more of the aforementioned characteristics could be categorized as tools with ‘smaller weaknesses’.

3.1.3. Criterion 3: Stakeholders

The criterion ‘stakeholders’ involves three separate sub-criteria describing (Table 3): (a) the agriculture sub-sector for which the DS tool is representative; (b) the target groups which have an interest in using the DS tool, and (c) whether stakeholders are involved in the development of the DS tool or not.
With respect to the sub-criterion ‘agriculture sub-sector represented’, six DS tools, including all multi-pillar sustainability assessment tools, could be used for more than one livestock category. Cool Farm Tool, FarmAC, Overseer, HOLOS, and EX-ACT can also provide estimations for separate crop production systems. Carbon Navigator (Dairy/Beef) and GLEAM focus on estimates for livestock production systems.
The sub-criterion ‘target group’ refers to the groups of people/stakeholders who could be interested in using the DS tool. The majority of the tools could be used by any user who is familiar with the agri-food sector. FarmAC is a tool which is especially designed for researchers, university students, or higher-level education users. KSNL and BEK seem to target livestock farm consultants and users with knowledge of the sustainability assessment process.
The third and last sub-criterion is associated with ‘stakeholders’ involvement’ in the development of the DS tool. It is used to answer one of the most important questions with respect to the tool development (as the aim of the tool is to be used by the targeted stakeholders): ‘Were various interested parties involved in the tool’s development’? Five out of thirteen DS tools have been tested by interested stakeholders. Especially, in the case of HOLOS, there is a function that provides an opportunity to the user to send feedback about their experience with the tool.

3.1.4. Criterion 4: Sustainability Assessment Methodology

Four different sub-criteria were distinguished for evaluating DS tools in the context of the criterion ‘methodology for sustainability assessment’ (Table 4).
The sub-criterion ‘level of sustainability assessment’ in each DS tool deals with the number of sustainability pillars and the number of indicators included in each tool and further specifies the types of sustainability pillars (providing more information than Figure 1). Three classes can be distinguished: (a) single-pillar/single-indicator; (b) single-pillar/multi-indicator; and (c) multi-pillar/multi-indicator (by default).
The sub-criterion ‘types of gas emissions (farm level)’ specified whether all GHG emissions of interest for the Agricultural Sector (i.e., CO2, N2O, and CH4), as well as NH3 emissions, are estimated or not. Table 4 suggests that the majority of the DS tools provide information for the GHG emissions at the farm level as an output. They provide estimates of all the GHG emissions separately (i.e., as CO2, N2O, and CH4 emissions), but also estimates of CO2 equivalents (i.e., one indicator considering all GHG emissions). FarmAC, KSNL, HOLOS, and BEK provide estimates for both GHG and NH3 emissions into the air. RISE estimates the GHG emissions and the risk of NH3 emissions based on three factors: (a) animal production, (b) the management of organic fertilizers, and (c) mineral fertilizers.
Regarding the ‘estimation methodology’ which is followed in each tool for assessing the gas emission indicators, all tools provide estimates of GHG emissions by using elements of the IPCC 2006 methodology (Table 4). In the majority of the tools, Tier 1 and 2 methodologies were used to estimate the GHG emissions at the farm level (e.g., Tier 2 for methane emission due to enteric fermentation and country-specific emission factors).
Possible options for the ‘decision support approach’ sub-criterion were the following [18]: contribution analysis, progress monitoring, benchmarking, scenario analysis, action plans, comparative assessment, and knowledge transfer. In most of the DS tools, scenario analysis and contribution analysis are both applied. That is because, in all these DS tools, the user could start with a specific scenario (e.g., corresponding to the current farm practices) and various scenarios could be tested by modifying the user inputs (e.g., dairy farm with feed crop production, only crop production, and pig farm without feed crop production). Furthermore, via a contribution analysis, the contribution to a total aggregated indicator is provided (e.g., the contribution of every annual GHG emission from each source in the farm to the total annual GWP at the farm level) [73]. The majority of the DS tools examined provide the ability of progress monitoring (i.e., a user could use the tool several times for the same project by saving the inputs). In online tools, the scenario which was created can be saved online in the tool’s data storage, while, in the tools with software to download, the progress can be saved to the user’s computer hard disk, using the tool’s desktop application. Moreover, the majority of the DS tools provide the user with the ability to perform an automatic comparative assessment of the results. Two groups of DS tools could be distinguished: the ‘comparative assessment’ and the ‘non-comparative assessment’ tools. In the first group (includes Cool Farm Tool, Overseer, Carbon Navigator (Dairy/Beef), DLG, SAFA, KSNL, RISE, HOLOS, GLEAM, and EX-ACT), the user automatically receives comparisons in the same interface/software window (e.g., in graphs, aggregated scores, etc.) between two or more outputs. In the second group (i.e., FarmAC and BEK), an automatic comparative assessment is not provided. However, the latter DS tools could be used for ‘manual’ relevant comparative assessments. Finally, any tool accompanied with guidebooks and with an informative user interface (see user-friendliness criterion) could be considered to perform knowledge transfer. The explanation of the tools’ methodology, parameters, and indicators, as well as livestock system production processes, via a guidebook, with scientifically established information, is considered to perform better in knowledge transfer.

3.1.5. Criterion 5: Modeling Aspects

Table 5 presents modeling aspects for the DS tools evaluated in this report. Four different sub-criteria were distinguished for the modeling aspects’ criterion.
The software of the DS tool includes the programmed model. Three groups are distinguished: (a) online software; (b) offline software, and (c) both online and offline software.
Furthermore, two types of modeling approaches can be distinguished: quantitative and semi-quantitative. The quantitative modeling approach uses algorithms in order to reach the indicators’ estimates (software output) from the user inputs. The semi-quantitative approach does not include the emissions’ calculations but assesses their impact on the environmental sustainability pillar via a scoring approach. Most of the DS tools use the quantitative modeling approach. RISE, KSNL, SAFA, and DLG (multi-pillar DS tools) employ a semi-quantitative type of modeling.
With respect to the ‘transparency of the modeling method’, a DS tool was considered transparent when it provided adequate information with regard to its indicators’ estimation, as well as scoring procedures. A tool was considered semi-transparent when it provided information about the methodology, but not adequate enough to reproduce all estimation/scoring procedures.

3.2. Checklists

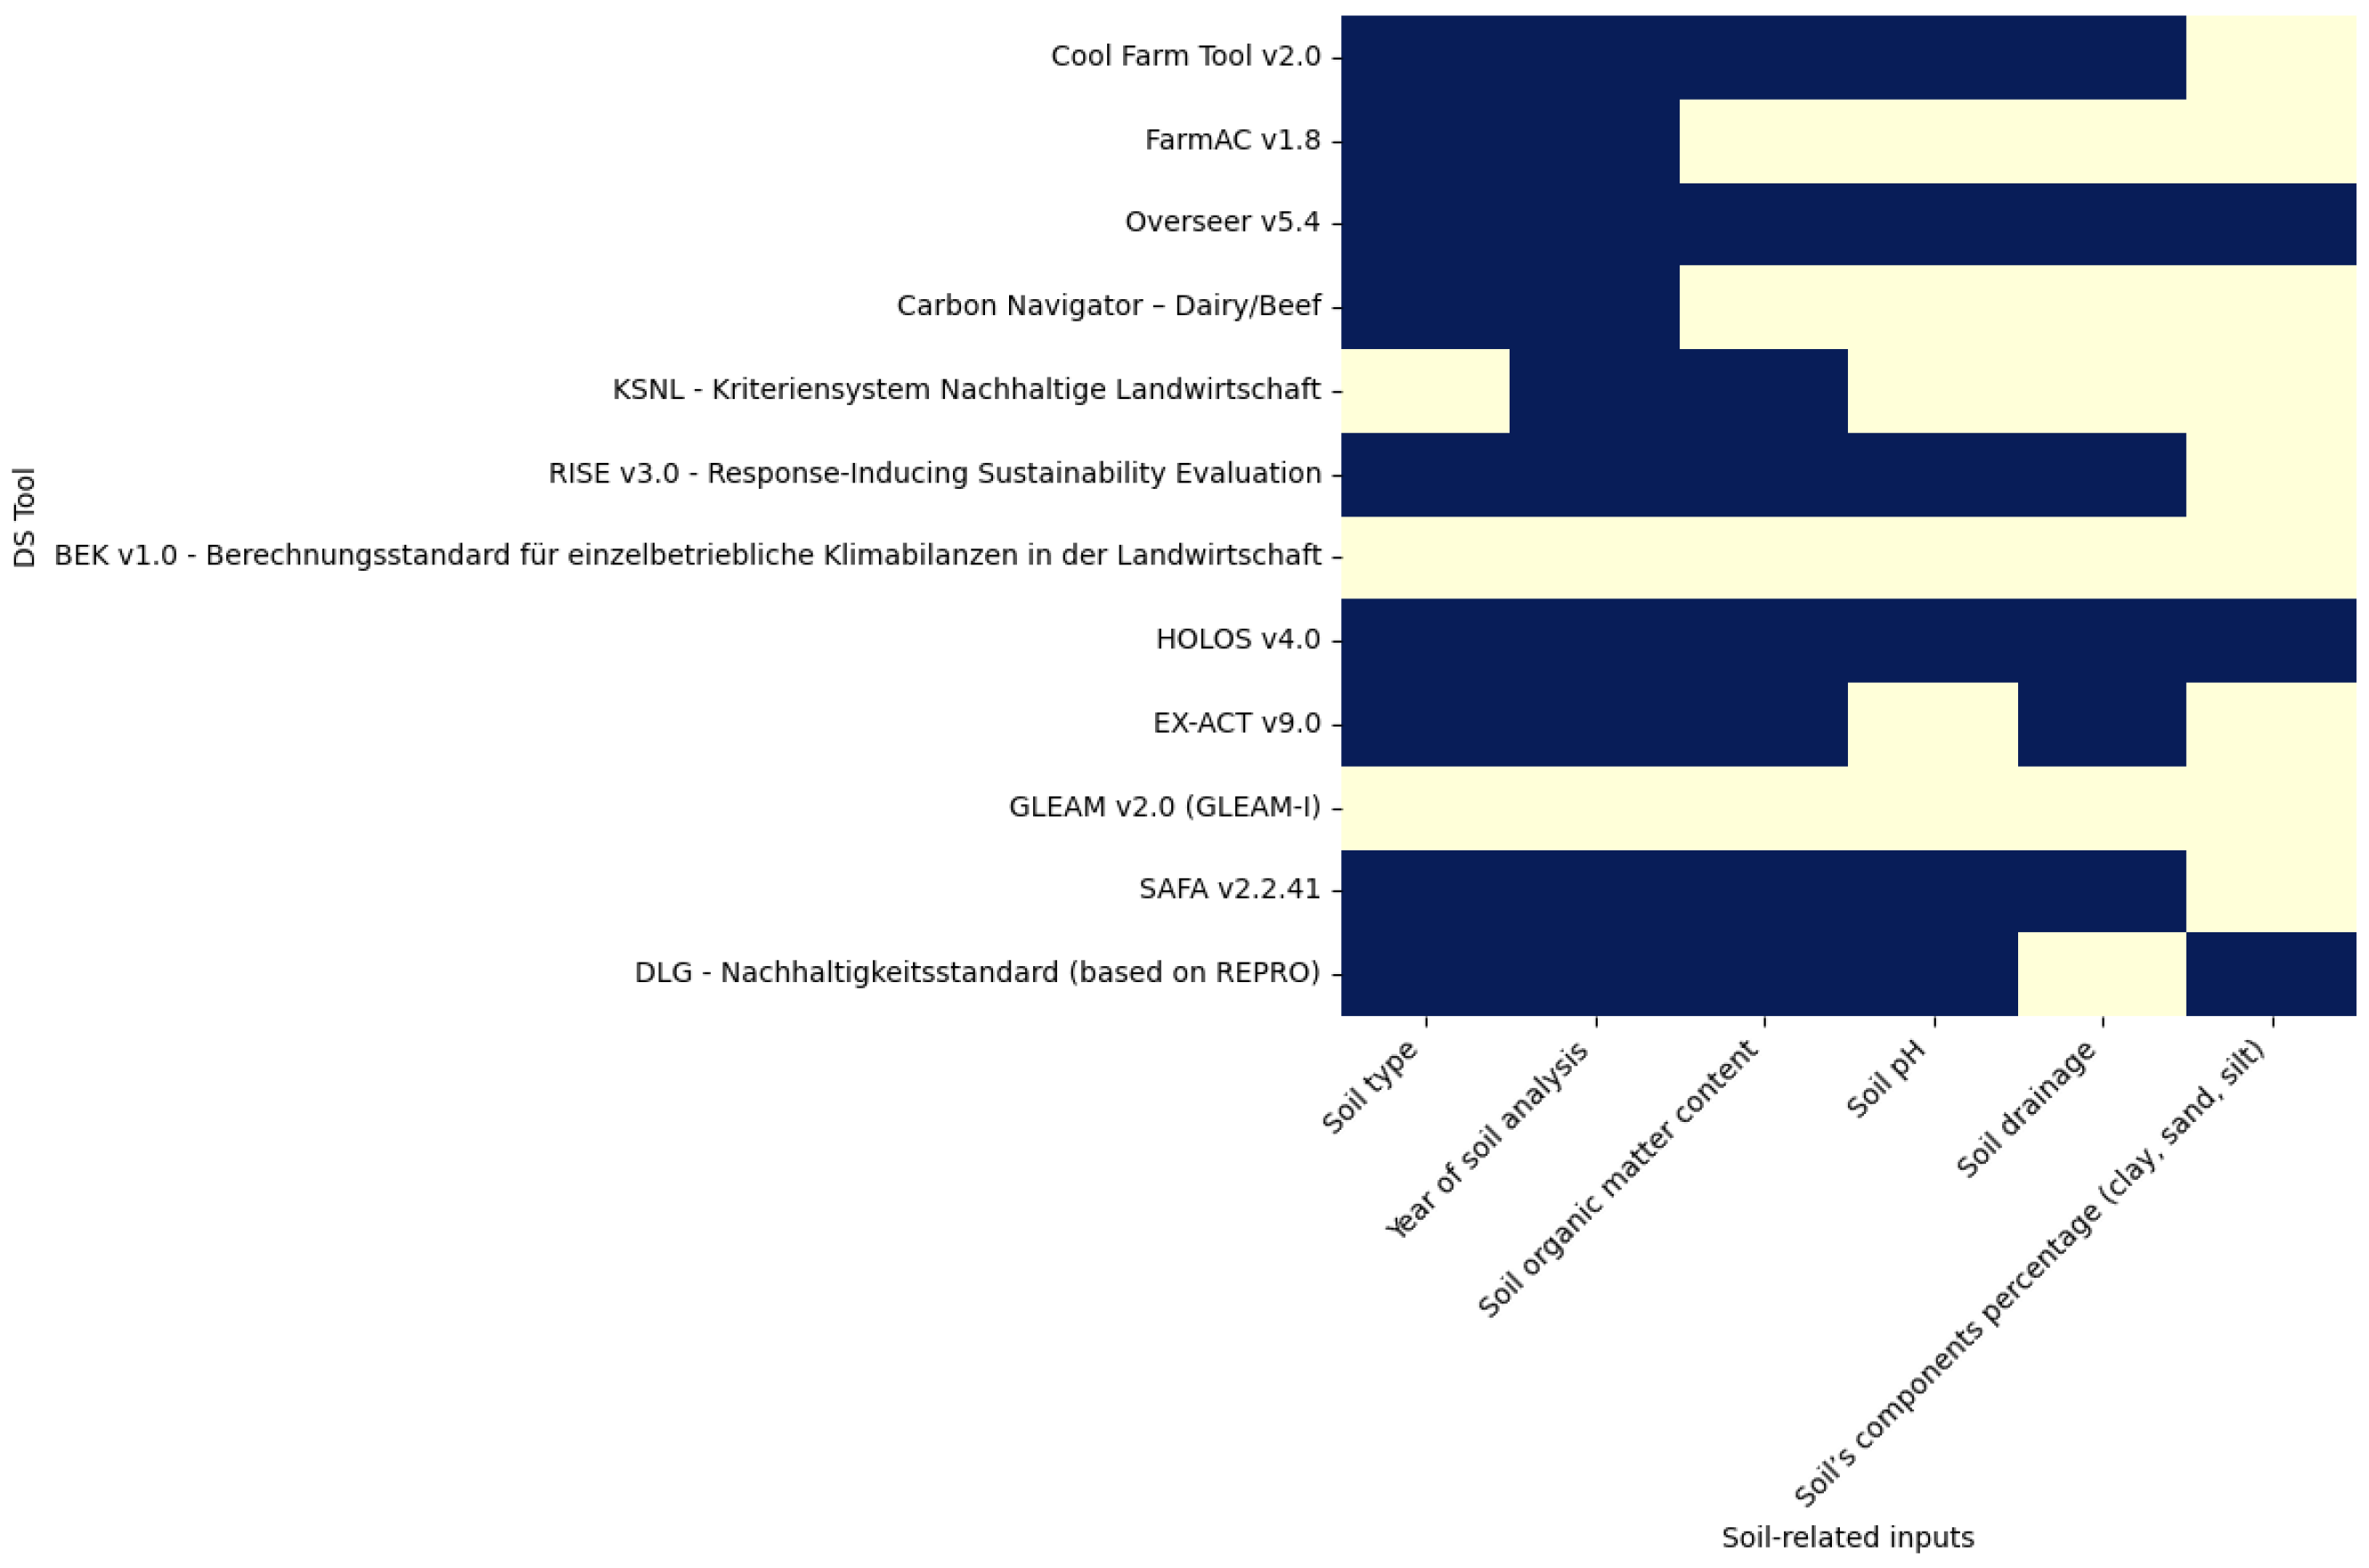
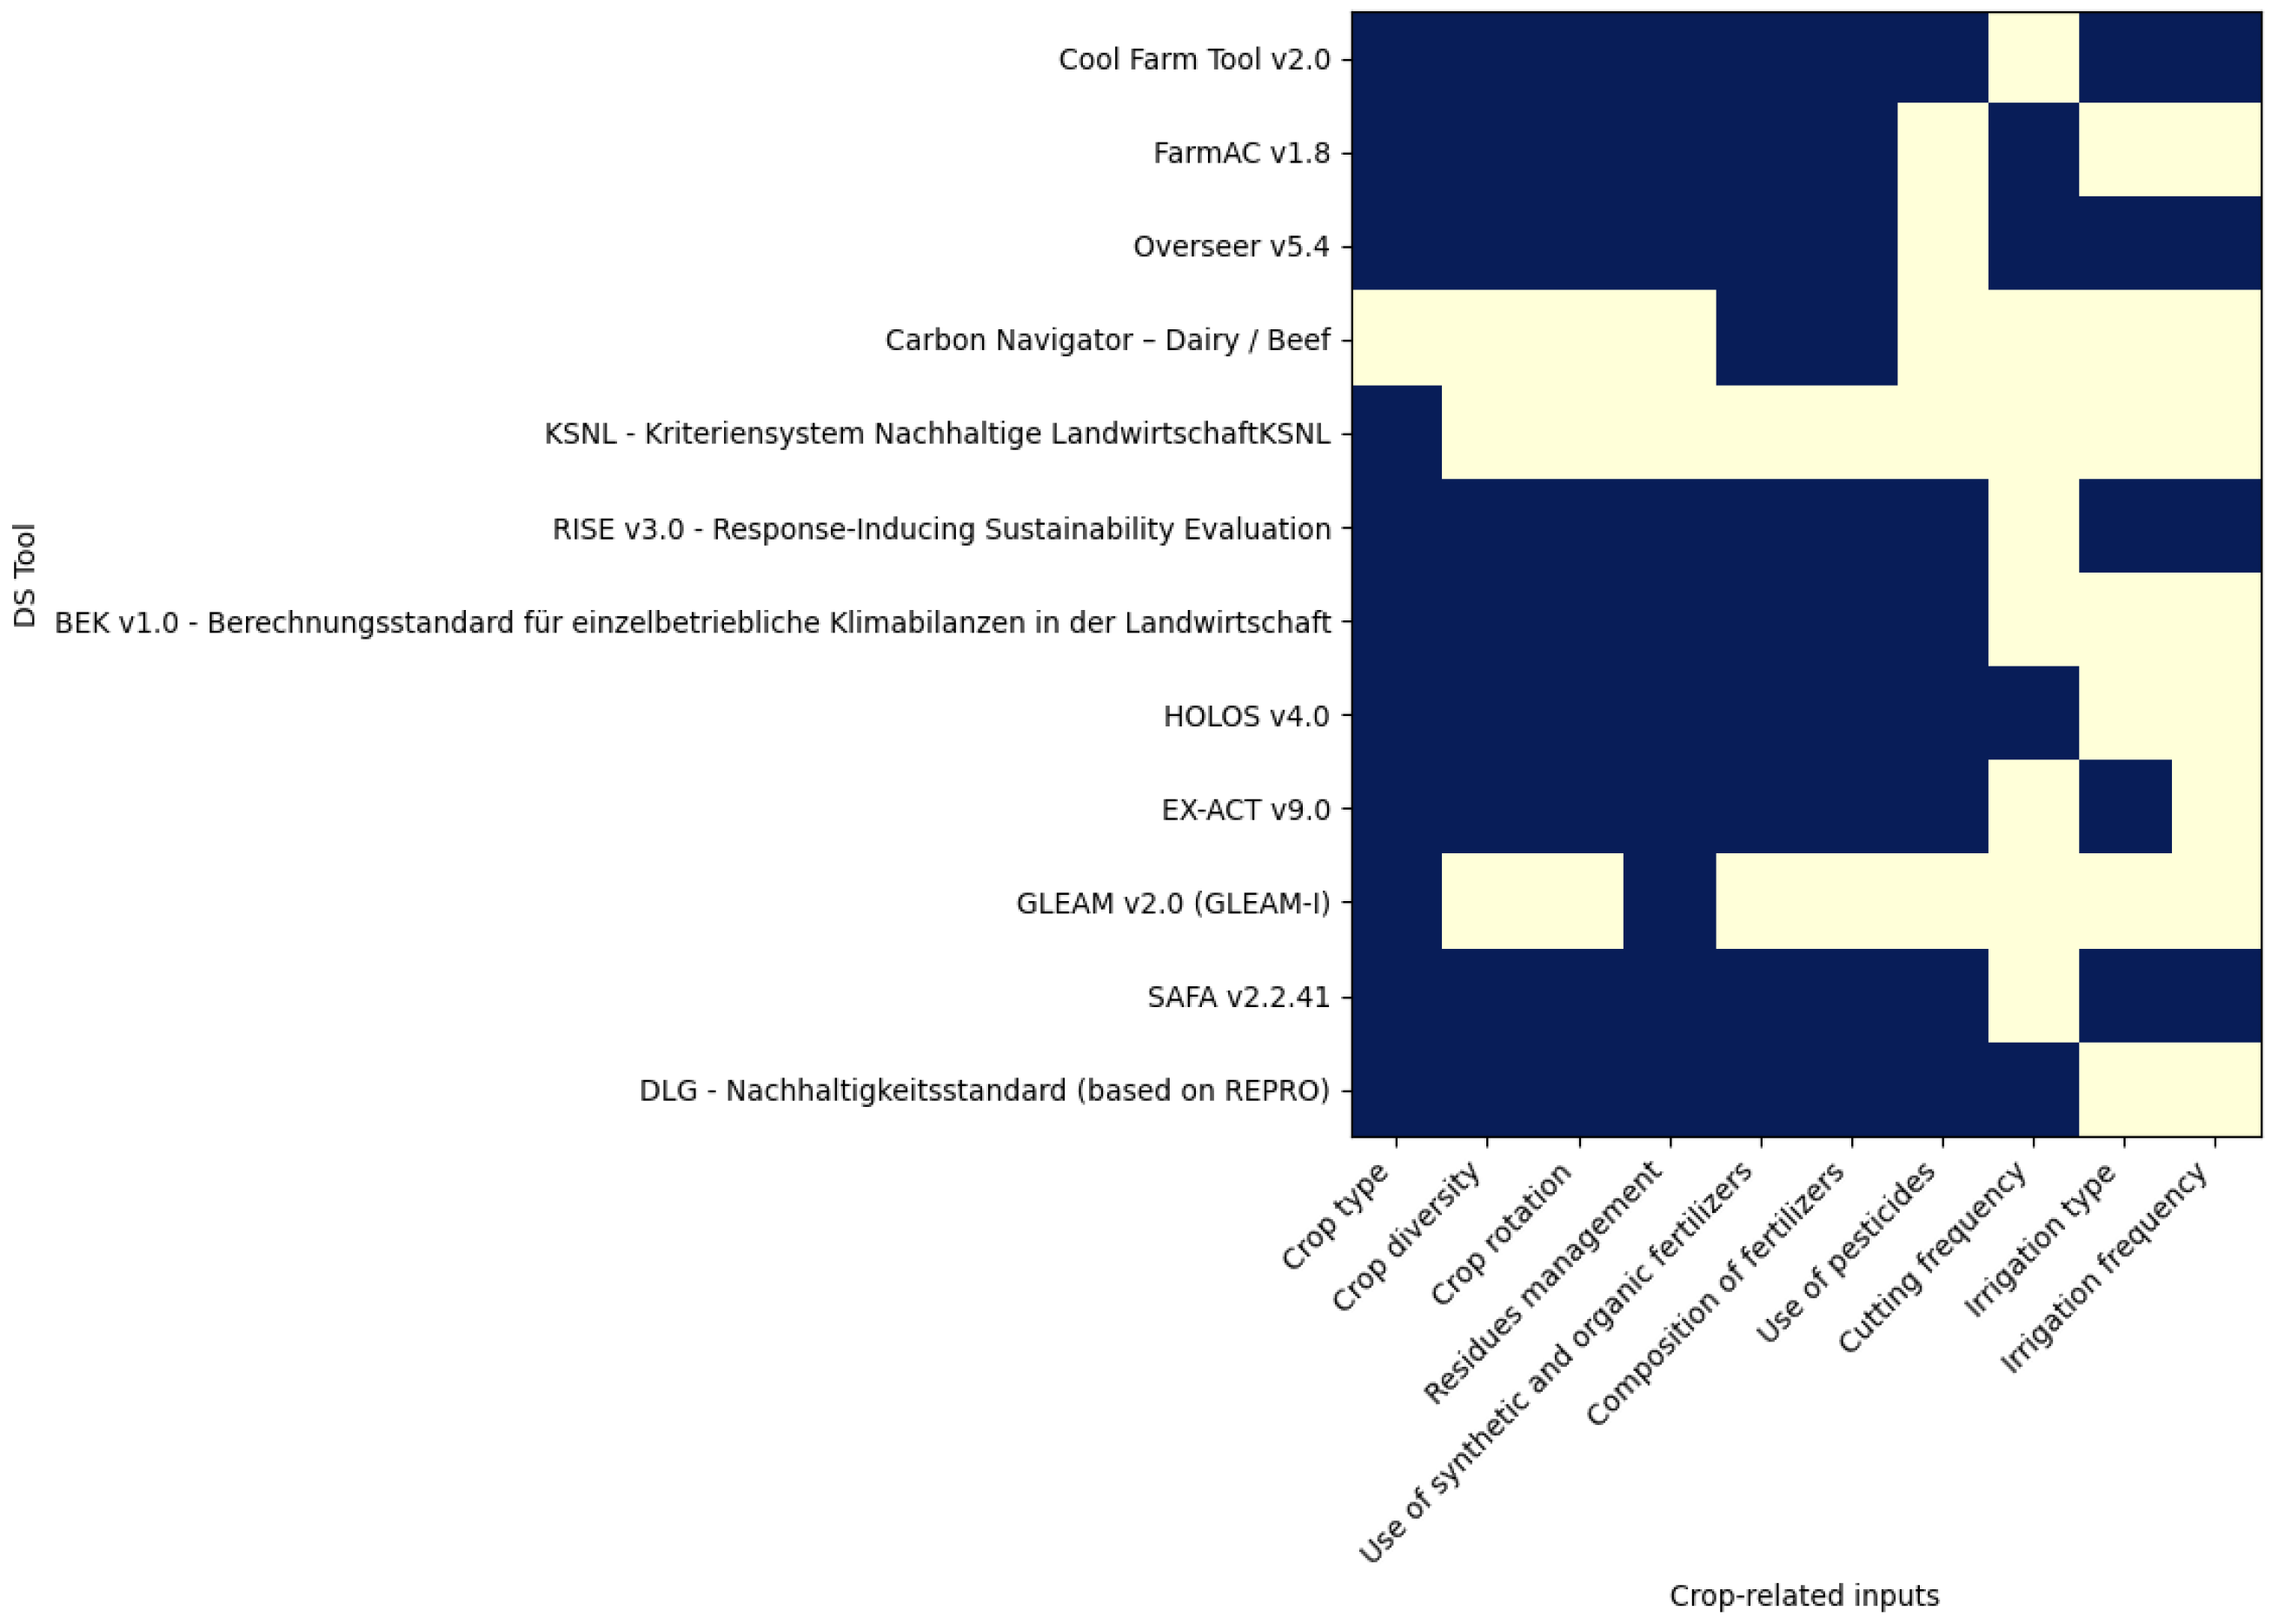
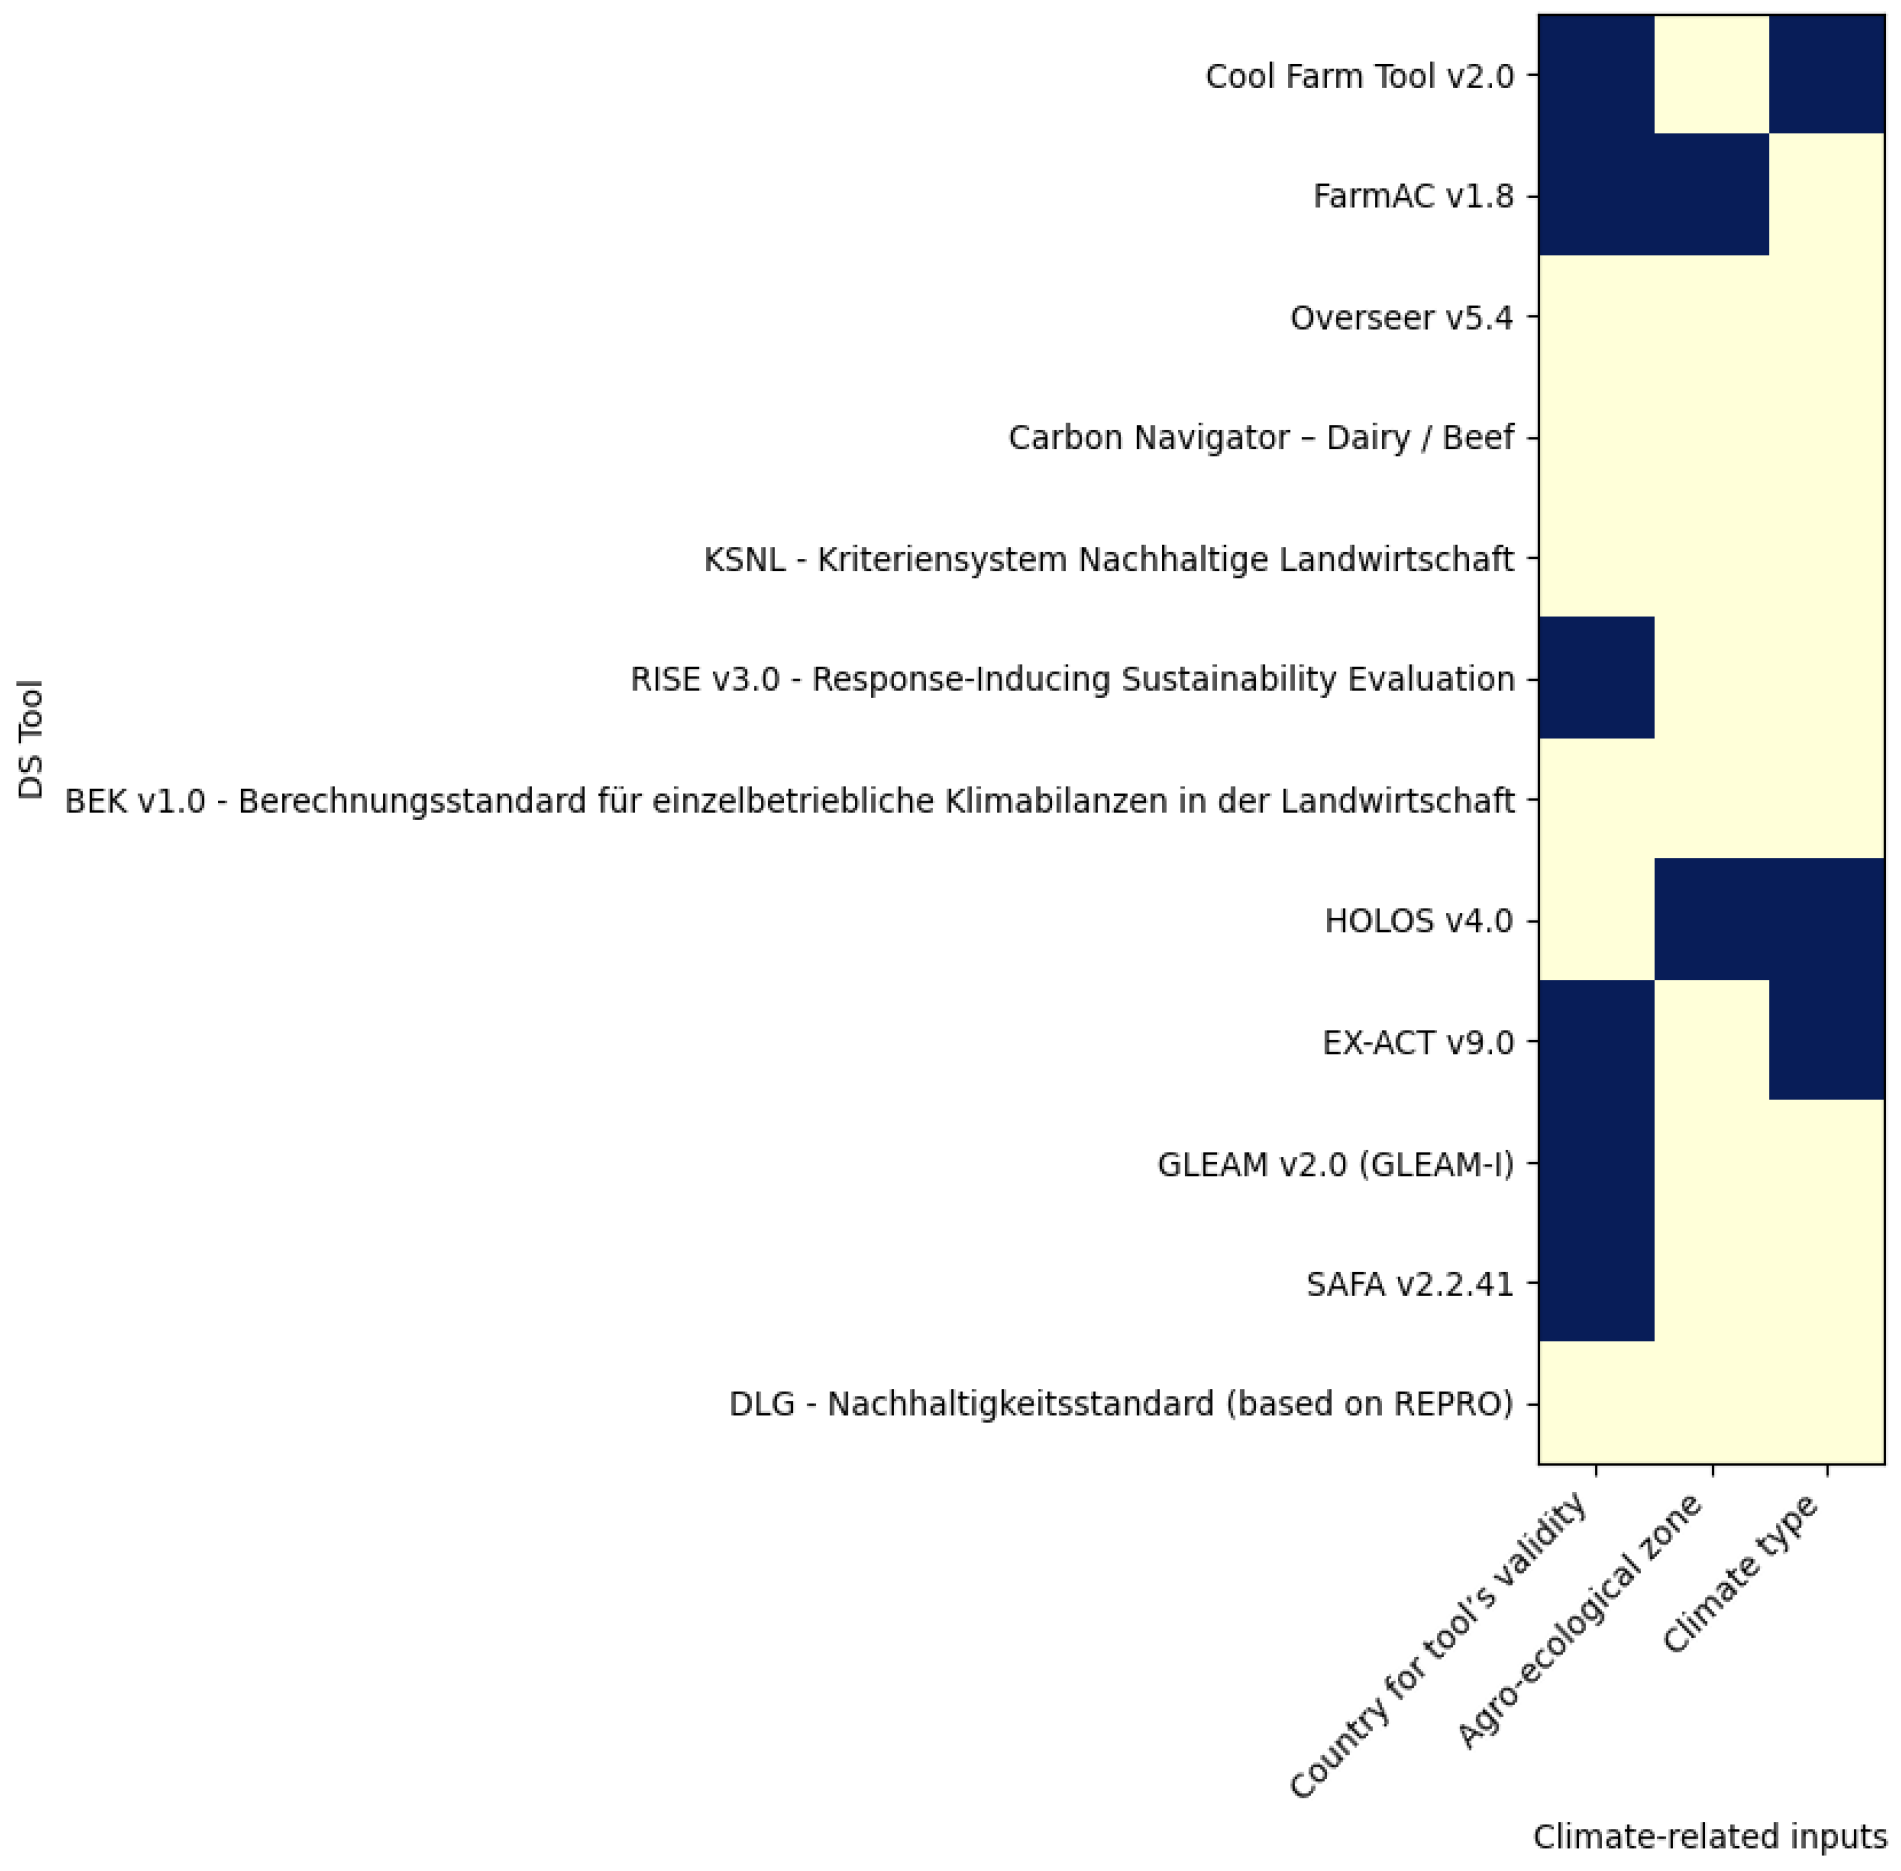
3.2.1. Inputs of DS Tools

Four categories of inputs can be distinguished: (a) soil-related; (b) crop-related; (c) climate-related, and (d) livestock-related).

Soil-Related Inputs

Most of the DS tools evaluated include the input of ‘soil type’ (Figure 2). However, there seem to be differences with respect to the way in which soil types are characterized in the various tools. Cool Farm Tool includes three soil types (i.e., clay, silt, and sandy) while FarmAC has seventeen different soil types (e.g., fine sandy soil, clayey sandy soil ≤40% fine sand, etc.). Overseer includes a full description of the soil (e.g., map reference, soil group, and soil texture). The Carbon Navigator (Dairy/Beef) tools require the user to manually add the soil type in an input sheet. In RISE, six categories of soil type (e.g., clay, sandy soils, etc.) are considered. HOLOS includes information about the ratios of clay and sand in every chosen area. Finally, EX-ACT includes six types of soils (e.g., sandy soils, volcanic soils, etc.).
The laboratory results of soil analysis comprise inputs for some of the DS tools evaluated and can be added in specifically pre-formed templates. Regarding the ‘year of the soil analysis’, only Overseer has a specific input. The closer the year of the soil analysis is to the desired year for estimation, the higher the time-representativeness of the received outputs (and, eventually, their quality). Furthermore, HOLOS provides the most recent soil national data via a soil satellite map.
‘Soil organic matter (SOM)’ is an indicator of soil structure, soil health, drainage, nutrient availability, and biological quality [74]. Two tools require SOM as an input: Cool Farm Tool and RISE. RISE defines SOM as an important parameter for GHG emission estimation. Overseer provides information about the percentage of organic C in its results. EX-ACT requires the soil carbon stocks (t C/ha) of the cultivated area, forest area, and the grassland as inputs, if country-specific data are available.
‘Soil pH and soil drainage’ can be further related to the estimation of GHG emissions. These inputs are required in Cool Farm Tool and Overseer. HOLOS derives this information from its soil map. Regarding soil drainage, HOLOS derives a description about how ‘well’ or ‘badly’ drained a soil is. Although RISE uses the IPCC Tier 1 methodology, it requires this information (e.g., for estimating the soil reaction indicator).

Crop-Related Inputs

Figure 3 presents the crop-related inputs (i.e., crop types and cultivation processes) to the DS tools evaluated.
‘Crop type’ refers to the kind of feed crops cultivated on-farm or imported as feed inputs. Almost all tools require this type of input for estimating GHG emissions at the farm level.
‘Crop diversity’ refers to the number of different crops grown in an agricultural field at the farm level. Crop diversity is required in the majority of DS tools.
In Carbon Navigator (Dairy/Beef), livestock is mostly fed via grazing. This does not mean that, essentially, crop diversity is not considered. In pastures, crop diversity is high. However, for modeling purposes, simplifications are usually made.
‘Crop rotation’ at the farm level could be available in all DS tools as they provide the user with the ability to save such information. The types of crops produced in the years of interest are needed for GHG emission estimation on an annual basis.
Associated with ‘crop residue management’ (e.g., burning, animal feed, composting, etc.), several tools require selecting accordingly, in the case of burning crop residues (exception: Carbon Navigator (Dairy/Beef) and KSNL).
Reporting the use of ‘synthetic and organic fertilizers’ is a requirement for all the DS tools evaluated, apart from GLEAM and KSNL. The (excessive) use of fertilizers is responsible for nutrient leaching and GHG emissions (i.e., N2O) from soil.
The ‘cutting frequency’ of crops which are cut more than once in one cultivation period (e.g., clover and alfalfa) is also a crop-related input. Cutting frequency affects the crop yield and, therefore, the emissions per unit of crop produced annually. This input is required from two tools: FarmAC, HOLOS, and Overseer. In Overseer, this information is completed in a calendar. In FarmAC, sowing and harvest can be completed for all the crops in a farm and are saved in a specific template. Finally, in HOLOS, the user can add this information in the crop section.
Irrigation infrastructure and energy consumption in irrigation indirectly affect the GHG emissions. ‘Irrigation type’ (e.g., pivot, rain gun, flooding, and drip) could, therefore, comprise another crop-related input. Cool Farm Tool, Overseer, RISE, and EX-ACT require such a type of input. FarmAC requires reporting the use of irrigation or not. HOLOS requires the total amount of water consumption per cultivated crop.
‘Irrigation frequency’ indirectly affects GHG emissions (e.g., via the amount of electricity used during the irrigation process). Cool Farm Tool, Overseer, and RISE require this type of input.

Climate-Related Inputs

Figure 4 presents the climate-related inputs which are taken into account for the estimation of GHG emissions in the DS tools evaluated.
‘Country for the DS tool’s validity’ refers to the countries where the tool could be implemented. Overseer, Carbon Navigator (Dairy/Beef), KSNL, BEK, and HOLOS are developed for one country’s specific conditions and the GHG emissions’ estimation is adapted to the climatic conditions existing in this country. The rest of the tools could be used in several countries.
With regard to the ‘consideration of different agro-ecological zones’ and ‘climate type’ in the GHG emissions’ estimation procedure, only FarmAC takes into account different agro-ecological zones, as these are defined by FAO and IIASA [75]. HOLOS includes the ecozones in Canada. Climate types are considered by Cool Farm Tool, and HOLOS and EX-ACT.

Livestock-Related Inputs

Figure 5 shows the various inputs considered in the DS tools evaluated, which are related to the livestock which is reared on farm.
All the tools use the livestock species as an input, both for estimations (i.e., Cool Farm Tool, FarmAC, Overseer, Carbon Navigator (Dairy/Beef), KSNL, BEK, GLEAM, DLG, and HOLOS) or/and as general information (i.e., KSNL and SAFA).
The various breeds of livestock are a determining factor of the livestock performance. Livestock breed is an input that is used for six tools (i.e., Cool Farm Tool, FarmAC, Overseer, Carbon Navigator (Dairy/Beef), and RISE) in order to estimate the GHG emissions, the productivity, and the feed consumption. The various breeds are associated with different characteristics. For example, Holstein Friesian cattle are more productive than Jersey cattle from a milk yield point of view. Nevertheless, the milk produced by Jersey cattle is associated with a higher fat and protein content [76]. Regarding the tools, the Cool Farm tool estimates the DMI per animal stage according to the breed. Additionally, FarmAC uses the breeds’ live weight in various algorithms such as the estimation of the energy needs for the maintenance of an animal and the endogenous urinary protein production. Finally, the dry matter intake for dairy cows is estimated using the live weight and the fat content of milk [7].
‘Age of livestock’ in months or in days, depending on the livestock category, is usually required. It is important for the assessment of productivity and the feed requirements of an animal. For example, the average weight gain of cattle may increase from their first day of life until the fiftieth day, and then slightly decrease, although the feed intake increases every week [77]. Another example is the fluctuation of dairy cows’ productivity while being provided almost the same amount of feed, as the cow gets older. The milk yield seems to increase until the fifth lactating period, and then a decrease is noticed [78]. The input ‘stage in livestock development’ (e.g., for cattle: heifers and dairy cows) is required by all DS tools, apart from EX-ACT.
GHG emissions at the livestock farm level are highly dependent on the manure management chain. Two basic types of inputs are considered: The first type refers to the ‘on-farm manure management’ (i.e., manure type, manure handling in livestock housing, manure storage outside housing, and on-farm manure processing). Carbon Navigator (Dairy/Beef) considers slurry spreading and manure deposition during grazing. The type of manure storage installation is further required in Cool Farm Tool, Overseer, RISE, HOLOS, BEK, EX-ACT, and GLEAM. The second type of input refers to the field application of manure. The field application of manure can be considered to be taking place on-farm in the case where feed crop cultivation or/and pastures are under the control of the livestock farmer. Manure field application is required by ten tools as an input.
Regarding the inputs related to feed, the first type refers to the ration supplied to the various livestock categories reared on the farm. Emissions resulting from enteric fermentation and the management of manure are linked to both the quantity and composition of the livestock’s diet (e.g., crude protein content of rations determines nitrogen emissions from the manure management chain). Cool Farm Tool, FarmAC, GLEAM, and Overseer comprise DS tools with a detailed ration template (e.g., feed component, percentage of feed component, and kg Dry Matter/animal/day). Carbon Navigator (Dairy/Beef) requires information both for housing and grazing periods (e.g., duration of the grazing period, and quantity of concentrates and feed supplements). HOLOS only requires the crude protein of the feed. BEK only requires the feed component. Cool Farm Tool, HOLOS, and Overseer require the cost of the feed (e.g., cost of seeds, fertilizers, etc. in on-farm crop production). Additionally, the user could include other types of costs (e.g., purchased animals, energy, fuel, or/and water).
Livestock productivity is an input which is related to the GHG emissions, and it is used by the majority of the tools examined. Products like milk, meat, wool, etc. per head and time (e.g., kg of milk per dairy cow per year) are included in the livestock productivity. RISE uses inputs like dry matter intake, the number of animals, and the storage type of manure, but not animal productivity, for estimating the GHG emissions.

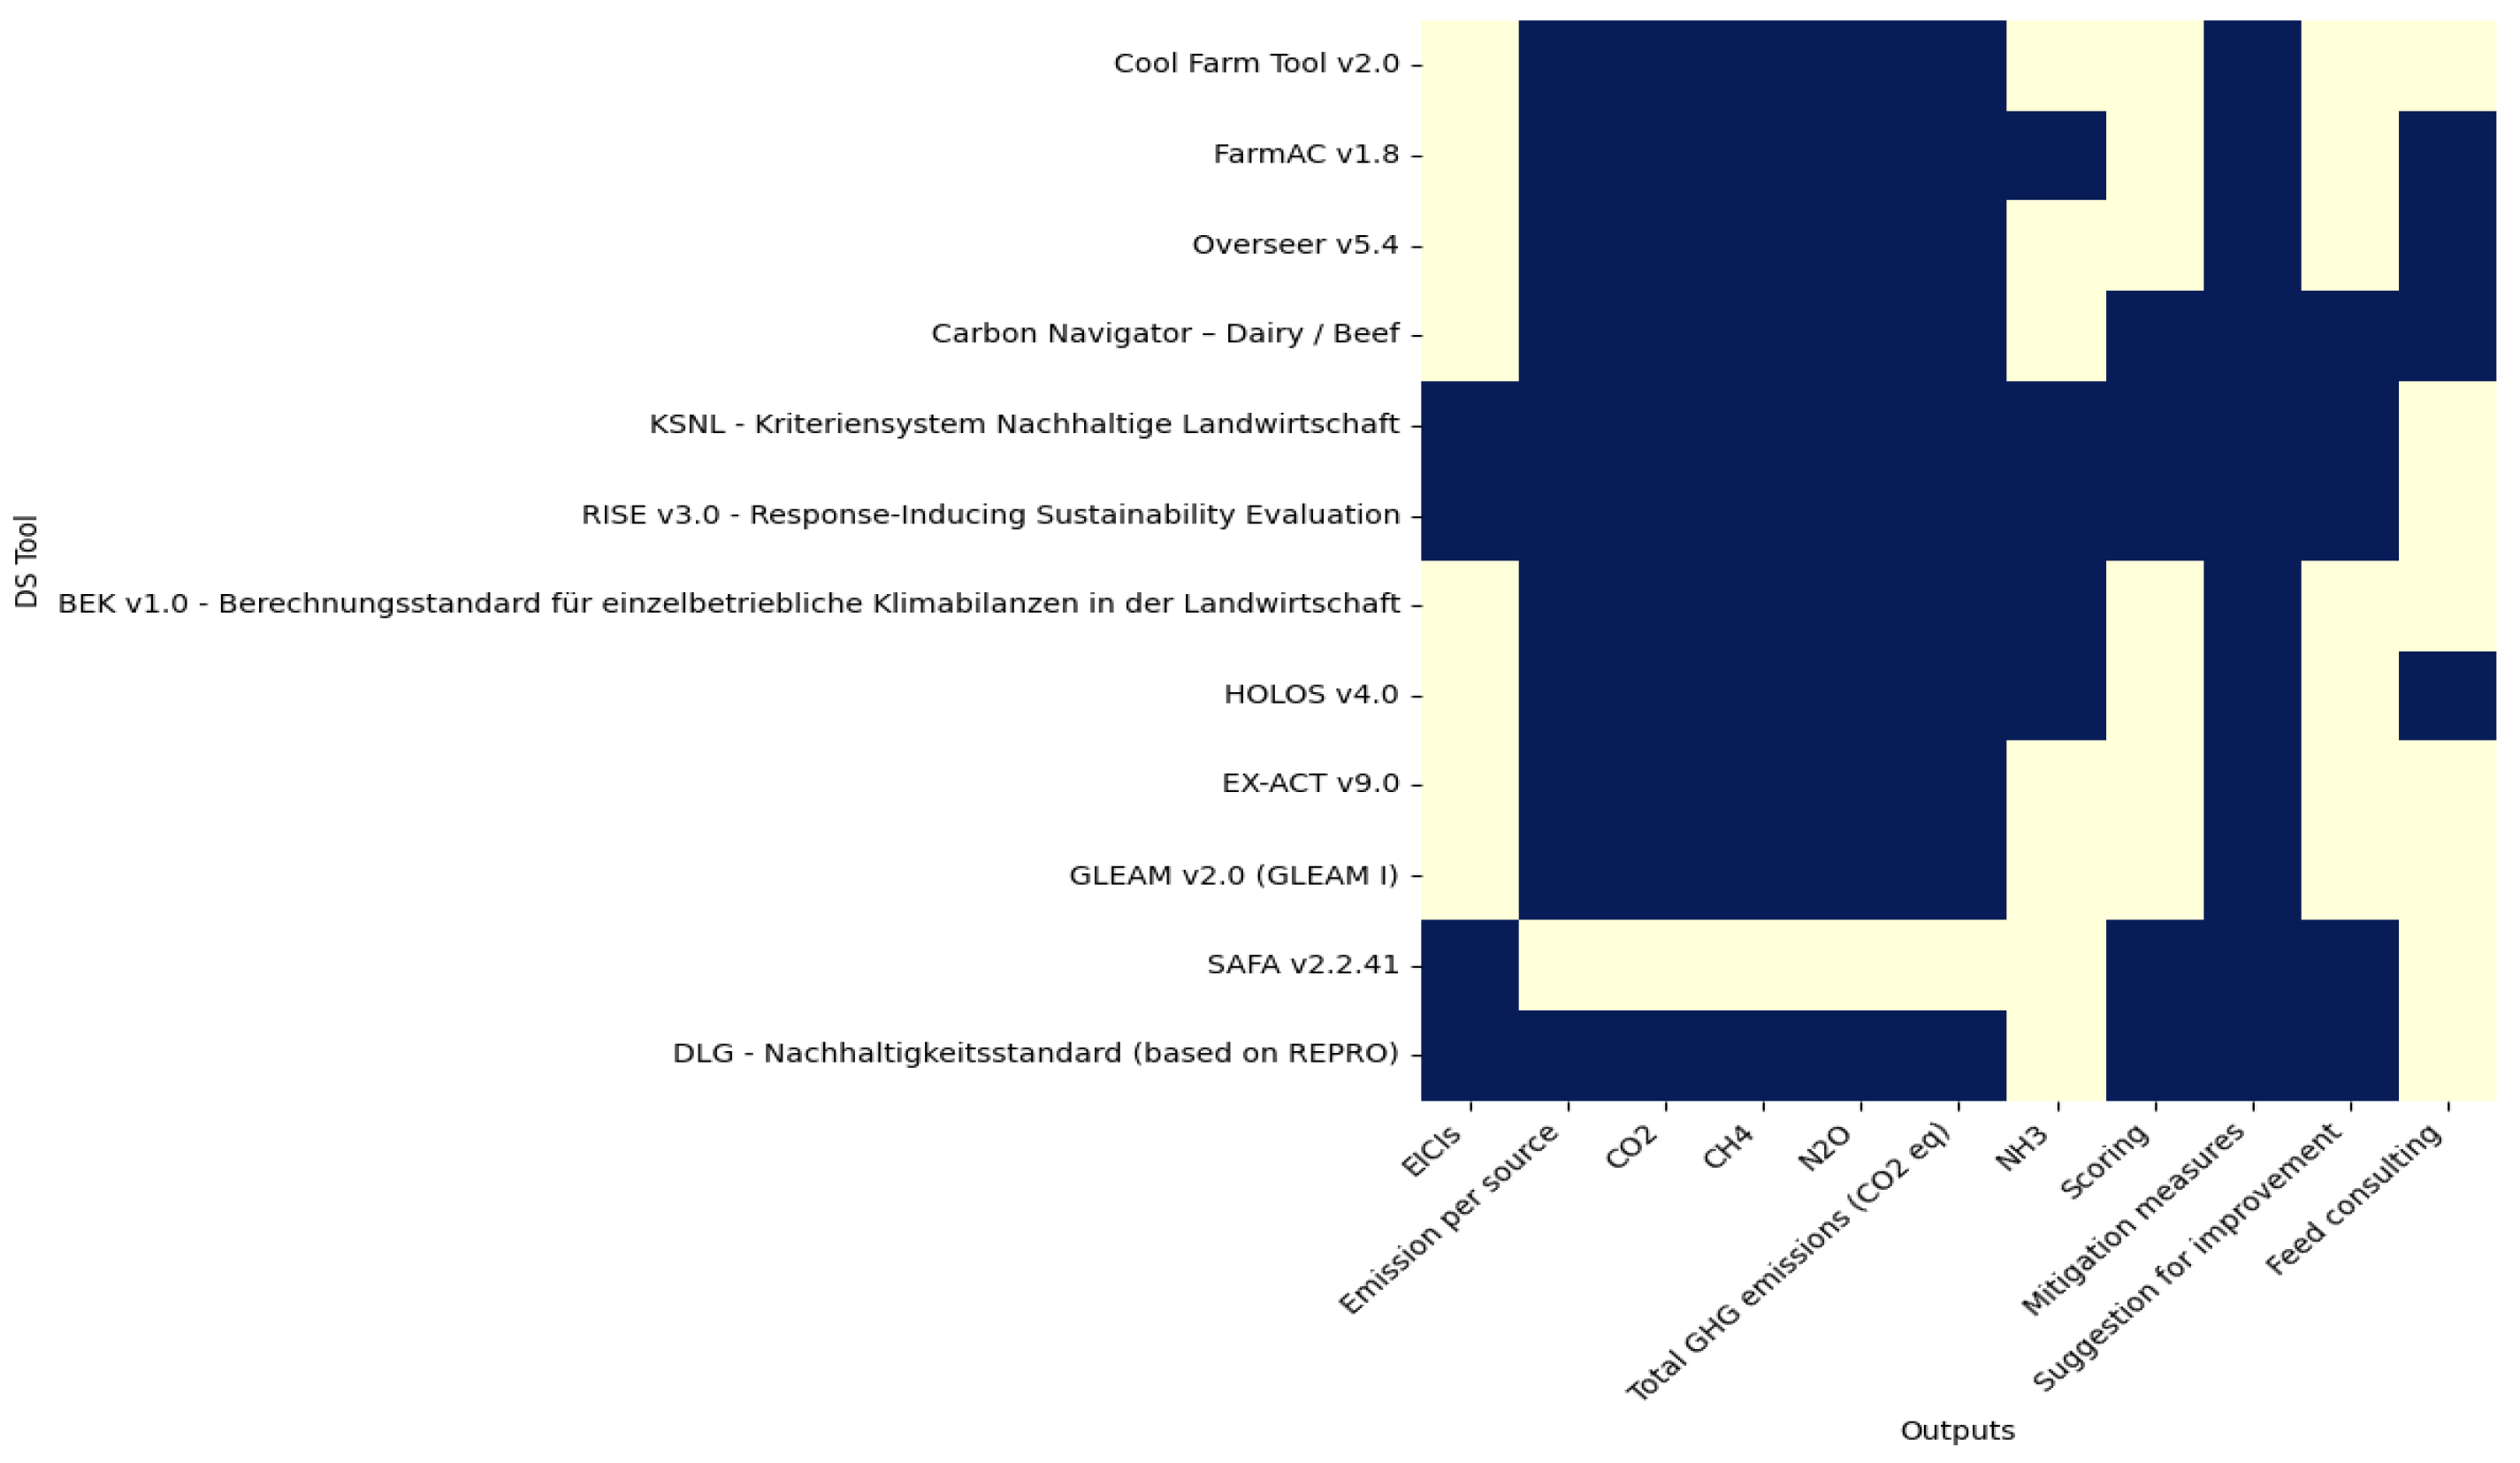
3.2.2. Outputs of DS Tools

Figure 6 shows not only the outputs in the evaluated DS tools which are related to emissions into the air, but also other types of advice (e.g., regarding livestock feed).
Four of the tools estimate environmental impact category indicators (EICIs) apart from a climate-change-related indicator. These tools provide estimates also for other environmental impact categories such as acidification, eutrophication, land use, etc.
The sources of on-farm emissions mostly examined in the DS tools evaluated are soil (Cool Farm Tool, FarmAC, Overseer, RISE, EX-ACT, and GLEAM), enteric fermentation in livestock (Cool Farm Tool, FarmAC, Overseer, Carbon Navigator (Dairy/Beef), RISE, HOLOS, EX-ACT, and GLEAM), manure excretion and storage (Cool Farm Tool, FarmAC, Overseer, Carbon Navigator (Dairy/Beef), RISE, HOLOS, EX-ACT, and GLEAM), and energy emissions (Cool Farm Tool, Overseer, RISE, HOLOS, EX-ACT, and GLEAM).
Four types of outputs refer to the ‘GHG emissions separately’ (i.e., CO2, CH4, and N2O) expressed in kg or/and tons per year, as well as to the ‘total GHG emissions on an annual basis’ expressed in kg or/and tons CO2 eq per year. All the DS tools (except SAFA) provide these types of outputs. SAFA requires CO2 eq per year as input to quantify a “GHG Balance” indicator.
Performance scores are provided using a qualitative scale (e.g., from good to bad, and low to high). The examination and suggestion of on-farm GHG emission mitigation measures is performed via two ways: (1) The direct description and selection of mitigation measures (i.e., Carbon Navigator (Dairy/Beef), SAFA, and EX-ACT): the tools refer specifically to the GHG emission mitigation methods and the user is invited to use them. In the case of SAFA, there is an extended list of mitigation practices that the user can access in order to provide scores to the relevant indicator (i.e., GHG Mitigation Practices). (2) The indirect consideration of mitigation measures (Cool Farm Tool, FarmAC, Overseer, HOLOS, GLEAM, and RISE,): the user is able to modify values in various parameters known to be associated with a mitigation effect (e.g., manure management method and feed) and check the effect on the relevant indicator value (e.g., 100-year global warming potential, in kg CO2 eq.). Furthermore, various tools (i.e., Carbon Navigator (Dairy/Beef), KSNL, RISE, SAFA, and DLG) provide as output a report with suggestions of alternative actions which could lead to an improved sustainability performance score or/and a reduction in on-farm gas emissions. In all these tools (except SAFA), apart from this report, users can send their information and receive an additional report by the tool’s experts for a better exploitation of the tool’s use and results. SAFA provides suggestions regarding the proper and the worst on-farm strategies associated with each indicator via the user interface.
Although not a GHG emission, NH3 is considered especially important due to its elevated release in the manure management chain. NH3 emissions are further partly responsible for indirect N2O emissions. FarmAC, KSNL, RISE, BEK, and HOLOS comprise the tools providing NH3 emissions as a separate output.
With the feature of feed consulting, advice is provided regarding the development of livestock rations. FarmAC provides the herd energy requirements (e.g., energy intake, energy used for maintenance, and energy used for milk production) as an output and the user could use this information, complemented with other relevant information (e.g., other nutritional requirements of livestock and feed intake capacity) to perform feed management. HOLOS provides a feed estimate report and suggests the livestock dry matter intake (in kg per head per day). Carbon Navigator (Dairy/Beef) tools provide the nutritional and energy requirements of livestock to the user and advice regarding the length of the grazing season. Overseer provides a warning message when non-balanced rations are supplied to the livestock capital reared.

4. Discussion

4.1. Aims of Using a Gas-Emission-Based DS Tool

The most important objective when using a gas-emission-based DS tool is getting informed with regard to which on-farm management strategies could improve the sustainability of a livestock farm. In this respect, the user aims to receive results that are comprehensive, specific, and practical to the livestock farm of interest from user-friendly software-based tools [79,80] which are developed by trustworthy groups of professionals and have already successfully been used for similar purposes by other people in their wider working environment [79]. Furthermore, the user expects to see an improvement in decision making during the production process (e.g., mitigation methods of emissions, the emissions sources, and their amount), as a result of the interaction with a DSS. This interaction between the user and the tool should be adjustable and versatile based on the changing requirements of the user at any given time [79,81].

4.2. Current Use of DSSs in the Livestock Sector

Today, DSSs in agriculture are mostly used by stakeholders in order to make informed decisions about the management of agricultural producing systems and processes (e.g., livestock management, livestock welfare, and economical management), by using the results of the relevant scientific research [21]. Widely used DSSs in animal production specifically focus on livestock population management, livestock welfare, and management of farm economics, and not often on improvement of environmental performance. Easily communicable and practical advice for the sustainability improvement of livestock production systems, also taking into account the environmental pillar of sustainability, is required for livestock farmers and other relevant stakeholders’ support (e.g., livestock farmers’ advisors for providing advice with regard to improving both the livestock farm’s economic and environmental performance, policy makers for compilation of regulations for the reduction of environmental pollution, etc.) [82]. As a result, the need for reliable, modern, and accessible decision support systems, which can effectively illustrate the importance of GHG and other pollutants’ emissions for the sustainability of these systems, emerges. The current and previous works indicate that various tools that use GHG and other pollutants’ emissions estimations for decision making are available. The use of these tools needs to be further justified and promoted to the potential stakeholders (i.e., livestock farmers, livestock farmers’ advisors, inventory compilers, and policy makers) by further highlighting their strengths and addressing their weaknesses.

4.3. Assurance of Wider Use of Emission-Based DSSs

Two purposes of the DS tools evaluated in this study are recognized: firstly, to estimate the GHG and NH3 emissions from the livestock farm, and, secondly, to evaluate its sustainability. These evaluations help identify the strengths and weaknesses of the farm, as well as the major sources of GHG and NH3 emissions.
There are several DS tools available, such as KSNL, RISE, DLG, and the Carbon Navigator (Dairy/Beef) tools, that provide detailed advice reports to the user. However, these reports are the result of data management by the tool’s expert groups and lack automated, easy-to-understand advice for the user.
In the case of the GHG emission calculators (without a consulting provision), the user must possess the experience and knowledge to comprehend the results. Additionally, they must conduct tests using various mitigation methods to determine the most effective approach.
Regarding the multi-pillar sustainability assessment tools (i.e., SAFA, DLG, RISE, and KSNL), users receive a sustainability score that enables them to understand the strengths and weaknesses of their farms. However, the tools do not provide specific automated advice on how to modify their practices for a better farm sustainability performance, but some of them (i.e., KSNL and RISE) provide consultation services by specialized staff.
The focus on inputs readily available at the farm level (or that are easy to acquire) is considered of importance, as it suggests facilitation in working with the DS tool by the end-user and minimizes the chances of abandoning the use of the tool [79]. It is important to underline that entering data and receiving outputs from these tools require a lot of time in most cases, which is unsuitable for the farmers’ and advisors’ daily working schedule. As a result, DSSs associated with less time consumption should be developed to attract stakeholders who work manually or/and away from the office (e.g., crop cultivation, farm management, and agricultural advisors) and do not have much time to spend on the use of a DS tool [81,83,84,85,86]. To make DSS tools more effective, they should be developed with a user-friendly interface that allows the user to enter their farm’s data in minimal time. It is important to note that user input could be minimized through the automation of data collection through remote-sensing techniques (e.g., pasture growing measurement, animal tracking system, electronic ear tags, electronic weighing system, and camera monitoring) [87,88]. The remote-sensing techniques’ editing and the integration of the data in a DSS environment are developed by big data analytics [88]. Furthermore, apart from the minimization of the input values inserted, the quality and the quantity of the data are major characteristics of the sensor system, since the sensors collect a huge amount of accurate real-time data [89]. When input insertion is reduced and inputs are deemed less reliable (e.g., approximate data declaration), the tool will provide less accurate results which will be less closely linked to the conditions found on a specific farm. This is because some users may find the process of entering data laborious and may not complete all forms, leading to less reliable outputs and decreased accuracy. An example could be the use of FarmAC, since this tool provides the ability of parametrization to the user. Consequently, should the user input farm-specific data into the tool rather than relying on its default settings, the output will be more tailored to the specific characteristics of that farm.
The ultimate goal of a widely used DSS tool is to provide practical and instant advice to end-users. Rather than providing a high number of non-comprehensible outputs, such as external arithmetic reports, the tool should provide precise and concrete advice. This will ensure that users can easily understand the outputs and act upon them. In order for a DS tool to be widely adopted, its usability should be improved, and it should provide reliable, well-targeted, and easily comprehensible outputs [79]. Achieving this will guarantee that users can quickly access the advice they need, leading to increased use of the tool [79].
Thus, the increase in the DS tool’s usability, combined with reliable and well-targeted and comprehensible outputs, could be an assurance of its wide use [90]. Easy understanding by the average end-user is closely related to the simplicity that the sustainability outputs are provided [79]. Ideally, a proper form of results could be a pointed report of the emergence of the problems (e.g., high GHG emissions) and the solutions (e.g., mitigation method), in a well-written and comprehensive report. The simplification of the results is a doubtful action since their complicated nature is difficult to manage. The conversion of the inputs into actionable recommendations for the end-user is of high importance for the adoption of such DS tools. Furthermore, it is of increased importance for a DS tool to shift from scientific outputs into practical advice [90]. More specifically, livestock producers should receive information and training in order to understand the usability of the DS tool in improving the sustainability of their farms, and, most notably, to apply them.
The inputs and outputs of a tool relate to the aim of the tool. In addition to having some common aims and functions, many tools have considerable differences which account for discrepancies in their final results. For example, GHG calculators like Cool Farm Tool, FarmAC, Overseer, HOLOS, Carbon Navigator (Dairy/Beef), GLEAM, and EX-ACT aim to provide information about GHG emissions. FarmAC and Overseer can also estimate nitrogen and carbon circles while they contribute to the decision making related to these. Overseer presents information about the phosphorus cycle. On the hand, the sustainability assessment tools (KSNL, SAFA, RISE, and DLG) provide information about the sustainability impact of GHG emissions, and some of these DS tools (KSNL and RISE) also estimate the GHG emissions.
The constant enhancement of communication between the DS tool’s developers and data providers (e.g., HOLOS) for the future updating and upgrading of the tools is of major importance [81,85,86]. If a tool is not user-friendly (as defined in Section 3.1.2, Table 2) and the outputs are difficult to interpret, then the tool might be abandoned in the future. Furthermore, if interested end-users participate in the development of a DS tool, this will lead to a tool design which satisfies their expectations and considers the reality of the systems they manage [90]. A direct, targeted, and simple communication of the relevant information is necessary for a DS tool which would be preferred by the end-users in the livestock sector (e.g., farmers and farmers’ advisors) [90]. Furthermore, the tools’ potential to add value to agricultural products and services should be clearly presented and established [91]. Moreover, sustainability practices should be connected to the economic value (e.g., cost, profit, and incentives), of the agricultural enterprise, in order to be adopted by the producers [92]. Finally, the tool’s user interface and programming group should promote the economic value (e.g., additional product value, enhancement of decision making, and better advice) of using a DSS contrary to the time-consuming processes of learning to use and using a DSS. This promotion will lead to an increase in the number of potential end-users [81,85,86].

4.4. Benefits from the Use of Emission-Based DS Tools

The use of such DS tools could promote the assessment of the effect of various farm-scale mitigation strategies (direct: Carbon Navigator (Dairy/Beef), SAFA, and SMART; indirect: FarmAC, Cool Farm tool, Overseer, HOLOS, KSNL, DLG-REPRO, RISE, BEK, EX-ACT, and GLEAM) and, therefore, the environmental sustainability of livestock farming systems [11,22]. Additionally, their use could stimulate the dissemination of information about the farms’ sustainability indicators and the effect of the mitigation strategies, and has the potential to lead to better-informed stakeholders and, consequently, better farm management [93]. These tools could also contribute to the education of livestock farmers regarding GHG emissions, the environmental sustainability of their system, and its improvement. This is one of the most important steps in order to achieve environmental sustainability improvement, as well-informed farmers are more willing to adopt innovative modifications in the management of their production systems and their decision making, leading to an improvement of farm resources management [93].

4.5. Weaknesses of the Emission-Based DS Tools

A significant weakness of DS tools is the absence of a common estimation methodology among the various tools when estimating common indicators for the same set of data. Although many tools use the IPCC 2006 methodology, they differ in many aspects, such as the use of different Tier methodologies for parameter calculation (e.g., CH4 and N2O emissions from manure handling, and enteric CH4 emissions), default values for certain parameters, previous versions of estimation methodologies, and varying emission factors. Studies comparing DSS estimation parameters and results using the same data have highlighted these differences [85,94].
Furthermore, there are variations between the indicator results generated by a DS tool, associated with the estimation methodology for the various indicators [33]. For example, more complex estimation methods (e.g., higher IPCC Tiers) for GHG emissions are developed for higher data availability, resulting in more reliable results and lower uncertainties. In the GHG emissions’ estimation methods, variations between the indicator results, that were estimated by the tools, arise from the activity data used as inputs, climate data, and emission factors that may differ in each location [33].
Another weakness of some of the examined DS tools (i.e., FarmAC and BEK) is the difficulty in the comparison of the results, since the user cannot directly receive the results of two or more scenarios, simultaneously. However, in these tools, the user is able to manually compare results of different scenarios, by running each scenario separately.
Moreover, a large group of the potential users (i.e., farmers) may have limited time and background of relevance, which may make it challenging for them to use and comprehend the sustainability-related outputs of these systems [81,95]. It is of importance that new methods and functions related to the presentation of the outputs be examined and developed in order to provide a more user-friendly and comprehensible DS tool interface. Another weakness is that the majority of these tools require time for the user to comprehend their way of use and their utility and adjust the use to a specific farm case study. Furthermore, even if a user is experienced in the use of the tool, a lot of time is required to collect the data from a farm in order to effectively use the tool. This is a result of the nature of the farmers’ job, since time spent in the office is limited and record keeping for the relevant information at the farm level is not the usual case. The latter is true, especially for developing countries, and less of an issue for other more developed countries, where farm records are needed for various reasons, such as being compliant with national environmental legislation (e.g., Ireland) [94].
Furthermore, obtaining more information to develop a sustainability assessment or estimation based on multiple parameters when using DS tools can be expensive. Nevertheless, it cannot be neglected that spending time on using a DS tool could be beneficial for the users, as they further work with the characteristics of their individual farming systems and investigate farm practices and measures specific to the farm, that can improve the DS tool’s indicators’ values.
Many tools have a significant weakness in the lack of automated and specific advice. While these tools generate extensive reports of numerical values and graphical results, they do not provide precise and concrete recommendations for the user. For instance, it is more effective for the user to receive a report that compares all mitigation methods and provides a short description of possible modifications of practices on-farm rather than comparing the results of different mitigation methods by changing the input data and rerunning the tool. Automated advice would be particularly essential since the tools that offer suggestions for taking actions (i.e., Carbon Navigator (Dairy/Beef), KSNL, RISE, SAFA, and DLG) require the user to fill out an input form or use a tool, and the analysis of the results is performed by a team of experts instead of the tool itself.
Additionally, every tool provides a different type of output; as a result, the user has to use more than one tool in order to obtain an estimation of the GHG emissions, ΝH3 emissions, and multi-pillar sustainability assessment. On the other hand, the creation of a tool including all of these functions is a difficult task for a DS tool’s programming and developing group. As it is presented in the current work, there are a few tools with a paid license (RISE and KSNL) that combine all these results, but the information related to the estimation procedure for GHG and NH3 emission outputs is limited in comparison with the free-access and other paid tools that do not combine all these results.
The implementation of the Green Deal by the EU will lead to changes in national legislation and an increased emphasis on environmental regulations. Therefore, collecting and analyzing data on inputs and outputs will become essential to meet these new requirements.
However, generating extensive and analytical results requires a significant amount of input, making it a useful tool for professionals such as farmer advisors, researchers, national inventory compilers, and national authorities who have the time to examine all aspects of farms. At present, the vital role of advisors to farmers is instrumental in encouraging the extensive adoption of DS tools, given their close working engagement with farmers and the practical application of their guidance in daily farm activities [91].

4.6. Addition of This Work to the Current State of the Art

In this study, various DS tools were utilized (when available) to comprehend and assess the impact of GHG emissions from livestock farming systems on the environment. The DS tools were employed to generate different scenarios based on real data. In cases where a license was needed to access the DS tools, information from case studies, methodology publications, audiovisuals, and guidebooks were utilized to comprehend the tools’ functionalities. It will be essential, in future work, to use all the evaluated tools with the insertion of real data in order to present the parallel use of the tools (GHG calculators and sustainability assessment tools) and the extracted result from this process. The reliability of real data and access without limitations to all the DS tools are the major reasons to develop this process.
This work further promotes the simultaneous examination of multi-pillar sustainability assessment DS tools and GHG emissions’ calculators in order to provide a broader perspective about the impact of GHG emissions on the environmental sustainability of a livestock farming system. The majority of the DS tools are focused either on the calculation of the GHG emissions or on the sustainability assessment of the farming system in general.
Assessing environmental sustainability involves considering a multitude of indicators or groups of indicators. It is crucial to estimate GHG emissions accurately and convert this estimation into a sustainability impact, as the goal is to establish socially, economically, and environmentally sustainable livestock farms. The impact of GHG emissions on the environmental performance of livestock farms is significant, as evidenced by scientific publications relevant to farm environmental performance.
The different multi-pillar sustainability assessment DS tools examined in this study have varying perspectives on the weight of GHG emissions in environmental sustainability. For example, SAFA considers GHG emissions as 50% of the atmosphere theme, which is one of six themes of environmental sustainability. On the other hand, in DLG, GHG emissions are one of nine ecology indicators and the only indicator of climate impacts, one of five sectors analyzed for environmental sustainability. KSNL has a distinct category for GHGs, which is one of six categories in environmentally friendly agriculture reports. RISE assigns less impact on environmental sustainability to GHGs, considering them as one out of three indicators of the Energy and Climate theme, which is one out of six themes.
It is, therefore, of importance that consensus is achieved regarding the relative weight of GHG emissions on the total environmental performance score of livestock production systems [85,94,95,96,97,98]. Examples of such initiatives include the development of the Product Environmental Footprint methodology (Life-Cycle-Assessment-based methodology) and, more specifically, the normalization and weighting approaches adopted there, in order to estimate the total environmental scores of European production systems [99,100]. GHG emissions also impact policy, as a CO2 tax is being discussed in the EU and globally to manage GHG emissions and the global warming effect [101,102].
Finally, this review paper introduces a significant amount of unique information, including 23 descriptive criteria, 27 inputs, and 8 outputs, which are evaluated in an innovative manner that places a particular emphasis on GHG emissions. The comprehensive approach taken in this review includes the use of both checklists and descriptive tables that provide an extended explanation of each tool and their comparison to others. The findings of this work have the potential to serve as a valuable resource for future users seeking guidance in selecting the most suitable tool(s) for their assessment projects. The selection of the DS tool would depend on the objectives of the assessment project. The evaluation criteria cover a range of factors, including available inputs, geographic scope, desired results, language, level of expertise, economic feasibility, and others, which are described in detail within this review.

4.7. Considerations for a Prototype GHG-Based DS Tool

This evaluation could serve as an initiation point for the creation of a prototype DS tool focused on farm-level sustainability. To build this tool, key elements include system definition, integrating recently updated emission estimation methodologies like the 2019 refinement of the IPCC 2006 Guidelines and Tier 2 approaches, as well as incorporating newly developed models for estimating emission factors. Additionally, enhancing it with scoring methods to yield more sustainability indicators as outputs and offering automated user consultation for decision support are recommended components for this prototype DSS. This tool is proposed to encompass GHG and NH3 emissions from all farm-related sources, including potential control over feed crop production by the livestock farmer. Furthermore, it should account for soil carbon sequestration in relation to the nitrogen (N) and carbon (C) cycles. To achieve this, inputs from all the input categories described for the emission calculator tools would be necessary.

5. Conclusions

In this paper, various aspects of the selected DS tools which are related to the estimation of GHG and ammonia emissions, the sustainability assessment, the user interface, and their functions were analyzed, and the consideration or not of the most frequently employed categories of inputs and outputs from these tools were reported. The promotion of environmental sustainability via the assessment of the effect of various mitigation strategies, and the stimulation of the dissemination of information about farms’ sustainability improvement and farm management in the direction of sustainability improvement are important benefits of using such DS tools. The lack of a direct advice provision for addressing environmental problems at the farm level is an important weakness for some of the DS tools examined. The weaknesses of these DS tools encompass discrepancies in the estimation methodologies, variations in the results, challenges in the results comparison, usability issues, time-intensive learning curves, the lack of automated recommendations, the need for multiple tools, limited result integration, and the changing regulatory landscape. It was finally elaborated that the interested end-user will need to increasingly be placed at the center of the attention of the developers of such tools if their adoption is to be increased.
A contemporary GHG-based DS tool at the livestock farm level would encompass the following components:
  • Clearly defined system boundaries;
  • The utilization of recently published emission estimation algorithms (e.g., the 2019 refinement of the IPCC 2006 Guidelines and Tier 2 methodologies) and region-specific emission factors;
  • The inclusion of GHG and NH3 emissions;
  • The integration of mitigation options spanning all emission sources at the farm level (including control over feed crop production, if managed by the livestock farmer) and the consideration of soil carbon sequestration within the context of the nitrogen (N) and carbon (C) cycles.
It would further meet the following criteria:
  • Feature an online user interface;
  • Provide ease of access;
  • Target inexperienced users while offering comprehensive usage guidelines and methodological transparency;
  • Seek input from stakeholders prior to release;
  • Demonstrate multinational applicability;
  • Disseminate information through guidance documentation;
  • Employ scenario analysis, contribution analysis, and progress tracking as a decision support approach;
  • Present the impact on sustainability using a scoring system;
  • Address strategies for mitigating farm-level emissions.
As the EU introduces new expectations and guidance on agricultural sustainability under the Green Deal, the use of DS tools will become increasingly important in meeting these requirements. While obtaining detailed results through DS tools may be time-consuming, the benefits of utilizing these tools will become even more apparent in the long run.

Supplementary Materials

The following supporting information can be downloaded at: https://www.mdpi.com/article/10.3390/su151713041/s1, Table S1: General information about the GHG-based DS tools assessed. References [103,104,105,106,107,108,109,110,111,112,113,114,115,116,117,118,119,120,121] are cited in Supplementary Materials.

Funding

This research has been co-financed by the European Regional Development Fund of the European Union and Greek national funds through the Operational Program Competitiveness, Entrepreneurship, and Innovation 2014–2020, under the call “European R&T Cooperation–Act of Granting Greek Bodies that Successfully Participated in Joint Calls for Proposals of the European ERA-NET Networks 2019b” (MELS project, project code: T11ΕΡA4-00076), by the German Federal Ministry of Food and Agriculture (BMEL) through the Federal Office for Agriculture and Food (BLE), and by the Irish Department of Agriculture, Food, and the Marine. The “MELS” project was funded under the Joint Call 2018 ERA-GAS (Grant N° 696356), SusAn (Grant N° 696231), and ICT-AGRI 2 (Grant N° 618123) on “Novel technologies, solutions, and systems to reduce the greenhouse gas emissions in animal production systems”. The authors further acknowledge the support of this work by the project “SMART AGRICULTURE AND CIRCULAR BIO-ECONOMY–SmartBIC.” (MIS MIS5047106) which is implemented under the Action “Reinforcement of the Research and Innovation Infrastructure”, funded by the Operational Programme “Competitiveness, Entrepreneurship and Innovation” (NSRF 2014-2020) and co-financed by Greece and the European Union (European Regional Development Fund).

Institutional Review Board Statement

Not applicable.

Informed Consent Statement

Not applicable.

Data Availability Statement

No new data was created or analyzed in this study. Data sharing is not applicable to this article.

Acknowledgments

The authors wish to express their gratitude for the valuable input from the collaborators of the MELS project (www.mels-project.eu), who played a pivotal role in gathering and suggesting country-specific GHG-based decision support tools for assessment in this study.

Conflicts of Interest

The authors declare no conflict of interest.

References

  1. IPCC. N2O Emissions From Managed Soils, and CO2 Emissions From Lime and Urea Application. In 2019 Refinement to the 2006 IPCC Guidelines for National Greenhouse Gas Inventories; IPCC: Geneva, Switzerland, 2019; pp. 1–48. [Google Scholar]
  2. FAO. Greenhouse gas emissions from agrifood systems. In Global, Regional and Country Trends, 2000–2020; FAOSTAT Analytical Brief Series No. 50; FAO: Rome, Italy, 2022. [Google Scholar]
  3. FAO. Faostat Database. License: CC BY-NC-SA 3.0 IGO. Available online: https://www.fao.org/faostat/en/#data/GT (accessed on 21 August 2023).
  4. Caro, D.; Davis, S.J.; Bastianoni, S.; Caldeira, K. Global and Regional Trends in Greenhouse Gas Emissions from Livestock. Clim. Chang. 2014, 126, 203–216. [Google Scholar] [CrossRef]
  5. Goglio, P.; Smith, W.N.; Grant, B.B.; Desjardins, R.L.; Gao, X.; Hanis, K.; Tenuta, M.; Campbell, C.A.; McConkey, B.G.; Nemecek, T.; et al. A Comparison of Methods to Quantify Greenhouse Gas Emissions of Cropping Systems in LCA. J. Clean. Prod. 2018, 172, 4010–4017. [Google Scholar] [CrossRef]
  6. Reisinger, A.; Clark, H. How Much Do Direct Livestock Emissions Actually Contribute to Global Warming? Glob. Chang. Biol. 2018, 24, 1749–1761. [Google Scholar] [CrossRef]
  7. 2019 Refinement to the 2006 IPCC Guidelines for National Greenhouse Gas Inventories. Available online: https://www.ipcc.ch/report/2019-refinement-to-the-2006-ipcc-guidelines-for-national-greenhouse-gas-inventories/ (accessed on 27 July 2023).
  8. Grossi, G.; Goglio, P.; Vitali, A.; Williams, A.G. Livestock and Climate Change: Impact of Livestock on Climate and Mitigation Strategies. Anim. Front. 2019, 9, 69–76. [Google Scholar] [CrossRef]
  9. Pachauri, R.K.; Allen, M.R.; Barros, V.R.; Broome, J.; Cramer, W.; Christ, R.; Church, J.A.; Clarke, L.; Dahe, Q.; Dasgupta, P. Technical Climate Change 2014, Synthesis Report; IPCC: Geneva, Switzerland, 2015.
  10. FAO. SAFA Guidelines; FAO: Rome, Italy, 2014; ISBN 978-92-5-108485-4. [Google Scholar]
  11. Schils, R.L.M.; Ellis, J.L.; de Klein, C.A.M.; Lesschen, J.P.; Petersen, S.O.; Sommer, S.G. Mitigation of Greenhouse Gases from Agriculture: Role of Models. Acta Agric. Scand. A Anim. Sci. 2012, 62, 212–224. [Google Scholar] [CrossRef]
  12. Leahy, S.; Clark, H.; Reisinger, A. Challenges and Prospects for Agricultural Greenhouse Gas Mitigation Pathways Consistent With the Paris Agreement. Front. Sustain. Food Syst. 2020, 4, 69. [Google Scholar] [CrossRef]
  13. Malhi, G.S.; Kaur, M.; Kaushik, P. Impact of Climate Change on Agriculture and Its Mitigation Strategies: A Review. Sustainability 2021, 13, 1318. [Google Scholar] [CrossRef]
  14. Vibart, R.; de Klein, C.; Jonker, A.; van der Weerden, T.; Bannink, A.; Bayat, A.R.; Crompton, L.; Durand, A.; Eugène, M.; Klumpp, K.; et al. Challenges and Opportunities to Capture Dietary Effects in On-Farm Greenhouse Gas Emissions Models of Ruminant Systems. Sci. Total Environ. 2021, 769, 144989. [Google Scholar] [CrossRef]
  15. Rotz, C.A. Modeling Greenhouse Gas Emissions from Dairy Farms. J. Dairy Sci. 2018, 101, 6675–6690. [Google Scholar] [CrossRef]
  16. Jantke, K.; Hartmann, M.J.; Rasche, L.; Blanz, B.; Schneider, U.A. Agricultural Greenhouse Gas Emissions: Knowledge and Positions of German Farmers. Land 2020, 9, 130. [Google Scholar] [CrossRef]
  17. Aryal, J.P.; Rahut, D.B.; Sapkota, T.B.; Khurana, R.; Khatri-Chhetri, A. Climate Change Mitigation Options among Farmers in South Asia. Environ. Dev. Sustain. 2020, 22, 3267–3289. [Google Scholar] [CrossRef]
  18. Arulnathan, V.; Heidari, M.D.; Doyon, M.; Li, E.; Pelletier, N. Farm-Level Decision Support Tools: A Review of Methodological Choices and Their Consistency with Principles of Sustainability Assessment. J. Clean. Prod. 2020, 256, 120410. [Google Scholar] [CrossRef]
  19. De Olde, E.M.; Oudshoorn, F.W.; Sørensen, C.A.G.; Bokkers, E.A.M.; De Boer, I.J.M. Assessing Sustainability at Farm-Level: Lessons Learned from a Comparison of Tools in Practice. Ecol. Indic. 2016, 66, 391–404. [Google Scholar] [CrossRef]
  20. de Olde, E.M.; Bokkers, E.A.M.; de Boer, I.J.M. The Choice of the Sustainability Assessment Tool Matters: Differences in Thematic Scope and Assessment Results. Ecol. Econ. 2017, 136, 77–85. [Google Scholar] [CrossRef]
  21. de Olde, E.M.; Oudshoorn, F.W.; Bokkers, E.A.M.; Stubsgaard, A.; Sørensen, C.A.G.; de Boer, I.J.M. Assessing the Sustainability Performance of Organic Farms in Denmark. Sustainability 2016, 8, 957. [Google Scholar] [CrossRef]
  22. Ahmed, M.; Ahmad, S.; Waldrip, H.M.; Ramin, M.; Raza, M.A. Whole Farm Modeling: A Systems Approach to Understanding and Managing Livestock for Greenhouse Gas Mitigation, Economic Viability and Environmental Quality. In Animal Manure: Production, Characteristics, Environmental Concerns, and Management; ASA: Branchburg, NJ, USA, 2020; pp. 345–371. [Google Scholar] [CrossRef]
  23. Kanter, D.R.; Musumba, M.; Wood, S.L.R.; Palm, C.; Antle, J.; Balvanera, P.; Dale, V.H.; Havlik, P.; Kline, K.L.; Scholes, R.J.; et al. Evaluating Agricultural Trade-Offs in the Age of Sustainable Developme. Agric. Syst. 2018, 163, 73–88. [Google Scholar] [CrossRef]
  24. MacPherson, J.; Paul, C.; Helming, K. Linking Ecosystem Services and the SDGs to Farm-Level Assessment Tools and Models. Sustainability 2020, 12, 6617. [Google Scholar] [CrossRef]
  25. Coteur, I.; Wustenberghs, H.; Debruyne, L.; Lauwers, L.; Marchand, F. How Do Current Sustainability Assessment Tools Support Farmers’ Strategic Decision Making? Ecol. Indic. 2020, 114, 106298. [Google Scholar] [CrossRef]
  26. Pelletier, N. Sustainability Indicators, Tools, and Reporting Systems for Agri-Food Products. In Produced for Alberta Agriculture and Forestry by Global Ecologic Environmental Consulting and Management Services; Government of Alberta: Edmonton, AB, Canada, 2015; p. 195. [Google Scholar]
  27. Huysegoms, L.; Cappuyns, V. Critical Review of Decision Support Tools for Sustainability Assessment of Site Remediation Options. J. Environ. Manag. 2017, 196, 278–296. [Google Scholar] [CrossRef]
  28. De Otálora, X.D.; Del Prado, A.; Dragoni, F.; Estellés, F.; Amon, B. Evaluating Three-Pillar Sustainability Modelling Approaches for Dairy Cattle Production Systems. Sustainability 2021, 13, 6332. [Google Scholar] [CrossRef]
  29. Keller, E.; Chin, M.; Chorkulak, V.; Clift, R.; Faber, Y.; Lee, J.; King, H.; Milà i Canals, L.; Stabile, M.; Stickler, C.; et al. Footprinting Farms: A Comparison of Three GHG Calculators. Greenh. Gas Meas. Manag. 2014, 4, 90–123. [Google Scholar] [CrossRef]
  30. Colomb, V.; Bernoux, M.; Bockel, L.; Chotte, J.-L.; Martin, S.; Martin-Phipps, C.; Mousset, J.; Tinlot, M.; Touchemoulin, O. Review of GHG Calculators in Agriculture and Forestry Sectors; FAO: Rome, Italy, 2012. [Google Scholar]
  31. Thumba, D.A.; Lazarova-Molnar, S.; Niloofar, P. Data-Driven Decision Support Tools for Reducing Ghg Emissions from Livestock Production Systems: Overview and Challenges. In Proceedings of the 2020 7th International Conference on Internet of Things: Systems, Management and Security, IOTSMS 2020, Paris, France, 14–16 December 2020; Institute of Electrical and Electronics Engineers Inc.: New York, NY, USA. [Google Scholar]
  32. Tuomisto, H.L.; de Camillis, C.; Leip, A.; Nisini, L.; Pelletier, N.; Haastrup, P. Development and Testing of a European Union-Wide Farm-Level Carbon Calculator. Integr. Environ. Assess. Manag. 2015, 11, 404–416. [Google Scholar] [CrossRef]
  33. Colomb, V.; Touchemoulin, O.; Bockel, L.; Chotte, J.L.; Martin, S.; Tinlot, M.; Bernoux, M. Selection of Appropriate Calculators for Landscape-Scale Greenhouse Gas Assessment for Agriculture and Forestry. Environ. Res. Lett. 2013, 8, 015023. [Google Scholar] [CrossRef]
  34. Macsween, K.; Feliciano, D. Comparison of Online Greenhouse Gas Accounting Tools for Agriculture Six Tools That Support the Assessment of Climate Change Mitigation in the Land Use Sector; CGIAR Research Program on Climate Change, Agriculture and Food Security: Wageningen, The Netherlands, 2018. [Google Scholar]
  35. Sykes, A.J.; Topp, C.F.E.; Wilson, R.M.; Reid, G.; Rees, R.M. A Comparison of Farm-Level Greenhouse Gas Calculators in Their Application on Beef Production Systems. J. Clean. Prod. 2017, 164, 398–409. [Google Scholar] [CrossRef]
  36. Whittaker, C.; McManus, M.C.; Smith, P. A Comparison of Carbon Accounting Tools for Arable Crops in the United Kingdom. Environ. Model. Softw. 2013, 46, 228–239. [Google Scholar] [CrossRef]
  37. Elsaid, K.; Sayed, E.T.; Abdelkareem, M.A.; Baroutaji, A.; Olabi, A.G. Environmental Impact of Desalination Processes: Mitigation and Control Strategies. Sci. Total Environ. 2020, 740, 140125. [Google Scholar] [CrossRef]
  38. Green, A.; Lewis, K.A.; Tzilivakis, J.; Warner, D.J. Agricultural Climate Change Mitigation: Carbon Calculators as a Guide for Decision Making. Int. J. Agric. Sustain. 2017, 15, 645–661. [Google Scholar] [CrossRef]
  39. Ershadi, S.Z.; Dias, G.; Heidari, M.D.; Pelletier, N. Improving Nitrogen Use Efficiency in Crop-Livestock Systems: A Review of Mitigation Technologies and Management Strategies, and Their Potential Applicability for Egg Supply Chains. J. Clean. Prod. 2020, 265, 121671. [Google Scholar] [CrossRef]
  40. Sykes, A.J.; Topp, C.F.E.; Rees, R.M. Understanding Uncertainty in the Carbon Footprint of Beef Production. J. Clean. Prod. 2019, 234, 423–435. [Google Scholar] [CrossRef]
  41. Gerber, P.J.; Hristov, A.N.; Henderson, B.; Makkar, H.; Oh, J.; Lee, C.; Meinen, R.; Montes, F.; Ott, T.; Firkins, J.; et al. Technical Options for the Mitigation of Direct Methane and Nitrous Oxide Emissions from Livestock: A Review. Animal 2013, 7 (Suppl. 2), 220–234. [Google Scholar] [CrossRef]
  42. Ouatahar, L.; Bannink, A.; Lanigan, G.; Amon, B. Modelling the Effect of Feeding Management on Greenhouse Gas and Nitrogen Emissions in Cattle Farming Systems. Sci. Total Environ. 2021, 776, 145932. [Google Scholar] [CrossRef]
  43. Kumar, R.; Karmakar, S.; Minz, A.; Singh, J.; Kumar, A.; Kumar, A. Assessment of Greenhouse Gases Emission in Maize-Wheat Cropping System Under Varied N Fertilizer Application Using Cool Farm Tool. Front. Environ. Sci. 2021, 9, 3559. [Google Scholar] [CrossRef]
  44. Hillier, J.; Walter, C.; Malin, D.; Garcia-Suarez, T.; Mila-i-Canals, L.; Smith, P. A Farm-Focused Calculator for Emissions from Crop and Livestock Production. Environ. Model. Softw. 2011, 26, 1070–1078. [Google Scholar] [CrossRef]
  45. Lata, S.; Kohli, A.; Singh, Y.K.; Shambhavi, S.; Ghosh, M.; Gupta, S.K. Estimation of Greenhouse Gas Emissions in Rice Based Cropping Systems under Fertigation Using Cool Farm Tool. J. Soil Water Conserv. 2020, 19, 26. [Google Scholar] [CrossRef]
  46. Morel, P.C.H.; Wheeler, D.M.; Barugh, I.W. Description of an Outdoor Pig Module for OVERSEER; Massey University: Palmerston North, New Zealand, 2016. [Google Scholar]
  47. Murphy, P.; Crosson, P.; O’Brien, D.; Schulte, R.P. The Carbon Navigator: A Decision Support Tool to Reduce Greenhouse Gas Emissions from Livestock Production Systems. Animal 2013, 7 (Suppl. 2), 427–436. [Google Scholar] [CrossRef] [PubMed]
  48. Christen, O.; Deumelandt, P.; Erdle, K.; Packeiser, M.; Reinicke, F.; Daniels-Spangenberg, H. Von Dlg Expert Knowledge Series; DLG Committee: Frankfurt, Germany, 2013; Volume 369. [Google Scholar]
  49. Uwizeye, A.; de Boer, I.J.M.; Opio, C.I.; Schulte, R.P.O.; Falcucci, A.; Tempio, G.; Teillard, F.; Casu, F.; Rulli, M.; Galloway, J.N.; et al. Nitrogen Emissions along Global Livestock Supply Chains. Nat. Food 2020, 1, 437–446. [Google Scholar] [CrossRef]
  50. MacLeod, M.J.; Vellinga, T.; Opio, C.; Falcucci, A.; Tempio, G.; Henderson, B.; Makkar, H.; Mottet, A.; Robinson, T.; Steinfeld, H.; et al. Invited Review: A Position on the Global Livestock Environmental Assessment Model (GLEAM). Animal 2018, 12, 383–397. [Google Scholar] [CrossRef]
  51. Vetter, S.H.; Malin, D.; Smith, P.; Hillier, J. The Potential to Reduce GHG Emissions in Egg Production Using a GHG Calculator —A Cool Farm Tool Case Study. J. Clean. Prod. 2018, 202, 1068–1076. [Google Scholar] [CrossRef]
  52. Gayatri, S.; Gasso-tortajada, V.; Vaarst, M. Assessing Sustainability of Smallholder Beef Cattle Farming in Indonesia: A Case Study Using the FAO SAFA Framework. J. Sustain. Dev. 2016, 9, 236. [Google Scholar] [CrossRef]
  53. Cammarata, M.; Timpanaro, G.; Scuderi, A. Assessing Sustainability of Organic Livestock Farming in Sicily: A Case Study Using the Fao Safa Framework. Agriculture 2021, 11, 274. [Google Scholar] [CrossRef]
  54. Pérez-Lombardini, F.; Mancera, K.F.; Suzán, G.; Campo, J.; Solorio, J.; Galindo, F. Assessing Sustainability in Cattle Silvopastoral Systems in the Mexican Tropics Using the Safa Framework. Animals 2021, 11, 109. [Google Scholar] [CrossRef] [PubMed]
  55. Pinxterhuis, J.B.; Edwards, J.P. Comparing Nitrogen Management on Dairy Farms-Canterbury Case Studies. J. N. Z. Grassl. 2018, 80, 201–206. [Google Scholar] [CrossRef]
  56. Curran, M.; Lazzarini, G.; Baumgart, L.; Gabel, V.; Blockeel, J.; Epple, R.; Stolze, M.; Schader, C. Representative Farm-Based Sustainability Assessment of the Organic Sector in Switzerland Using the SMART-Farm Tool. Front. Sustain. Food Syst. 2020, 4, 554362. [Google Scholar] [CrossRef]
  57. Berbeć, A.K.; Feledyn-Szewczyk, B.; Thalmann, C.; Wyss, R.; Grenz, J.; Kopiński, J.; Stalenga, J.; Radzikowski, P. Assessing the Sustainability Performance of Organic and Low-Input Conventional Farms from Eastern Poland with the RISE Indicator System. Sustainability 2018, 10, 1792. [Google Scholar] [CrossRef]
  58. Beauchemin, K.A.; Henry Janzen, H.; Little, S.M.; McAllister, T.A.; McGinn, S.M. Life Cycle Assessment of Greenhouse Gas Emissions from Beef Production in Western Canada: A Case Study. Agric. Syst. 2010, 103, 371–379. [Google Scholar] [CrossRef]
  59. Mc Geough, E.J.; Little, S.M.; Janzen, H.H.; McAllister, T.A.; McGinn, S.M.; Beauchemin, K.A. Life-Cycle Assessment of Greenhouse Gas Emissions from Dairy Production in Eastern Canada: A Case Study. J. Dairy Sci. 2012, 95, 5164–5175. [Google Scholar] [CrossRef] [PubMed]
  60. Kiggundu, N.; Ddungu, S.P.; Wanyama, J.; Cherotich, S.; Mpairwe, D.; Zziwa, E.; Mutebi, F.; Falcucci, A. Greenhouse Gas Emissions from Uganda’s Cattle Corridor Farming Systems. Agric. Syst. 2019, 10, 176. [Google Scholar] [CrossRef]
  61. Ran, Y.; Lannerstad, M.; Barron, J.; Fraval, S.; Paul, B.K.; Notenbaert, A.; Mugatha, S.; Herrero, M. A Review of Environmental Impact Assessment Frameworks for Livestock Production Systems; Stockholm Environment Institute: Stockholm, Sweden, 2015. [Google Scholar]
  62. Bernoux, M.; Bockel, L.; Branca, G.; Colomb, V.; Gentien; Tinlot, M. EX-Ante Carbon-Balance Tool (EX-ACT) Technical Guidelines for Version 4 for the Food and Agriculture Organization of the United Nations, FAO Resources for Policy Making the EX-Ante Carbon-Balance Tool; FAO: Rome, Italy, 2011; ISBN 9789251067819. [Google Scholar]
  63. Branca, G.; Medeiros, K. Estimating Mitigation Potential of Agricultural Projects: An Application of the EX-Ante Carbon-Balance Tool (EX-ACT) in Brazil; FAO: Rome, Italy, 2010. [Google Scholar]
  64. Breitschuh, T.; Breitschuh, G.; Eckert, H.; Gernand, U.; Geyer, M. Betriebsbewertungssystem KSNL—Anwendung und Ausgewählte Kriterien; KTBL: Darmstadt, Germany, 2019; pp. 1–15. [Google Scholar]
  65. Grenz, J.; Mainiero, R.; Schoch, M.; Sereke, F.; Stalder, S.; Thalmann, C.; Wyss, R. RISE 3.0—Manual; Bern University of Applied Sciences: Bern, Switzerland, 2018; p. 113. [Google Scholar]
  66. Grenz, J.; Thalmann, C.; Heeb, L.; Schoch, M.; Kaufmann, M.; Wyss, R. RISE 3.0—Software Manual; Bern University of Applied Sciences: Bern, Switzerland, 2016. [Google Scholar]
  67. Alexandropoulos, E.; Anestis, V.; Bartzanas, T. Farm-Scale Greenhouse Gas Emissions’ Decision Support Systems. Eng. Proc. 2021, 9, 22. [Google Scholar] [CrossRef]
  68. Hales, B.M.; Pronovost, P.J. The Checklist-a Tool for Error Management and Performance Improvement. J. Crit. Care 2006, 21, 231–235. [Google Scholar] [CrossRef]
  69. Martin, G.; Moraine, M.; Ryschawy, J.; Magne, M.A.; Asai, M.; Sarthou, J.P.; Duru, M.; Therond, O. Crop–Livestock Integration beyond the Farm Level: A Review. Agron. Sustain. Dev. 2016, 36, 53. [Google Scholar] [CrossRef]
  70. Alexandropopoulos, E.; (Agricultural University of Athens, Athens, Greece); Anestis, V.; (Agricultural University of Athens, Athens, Greece); Hutchings, N.; (Aarhus University, Aarhus, Denmark). Personal Communication, 2022.
  71. Ordinance on the Application of Fertilisers, Soil Additives, Cultivation Substrates and Plant Auxiliaries in Accordance with the Principles of Good Fertilising Practice. Federal Law Gazette, Volume 2007, Part I, No. 7, Bonn, North Rhine-Westphalia, Germany, 5 March 2007. Available online: http://www.bgbl.de/xaver/bgbl/start.xav?startbk=Bundesanzeiger_BGBl&jumpTo=bgbl107s0221.pdf (accessed on 24 August 2023).
  72. EMEP. EMEP/EEA Air Pollutant Emission Inventory Guidebook 2009; Technical Report No.6/2009; European Monitoring and Evaluation Programme: Geneva, Switzerland, 2009. [Google Scholar]
  73. Baek, C.Y.; Park, K.H.; Tahara, K.; Chun, Y.Y. Data Quality Assessment of the Uncertainty Analysis Applied to the Greenhouse Gas Emissions of a Dairy Cow System. Sustainability 2017, 9, 1676. [Google Scholar] [CrossRef]
  74. Howard, P.J.A.; Howard, D.M. Use of Organic Carbon and Loss-on-Ignition to Estimate Soil Organic Matter in Different Soil Types and Horizons. Biol. Fertil. Soils 1990, 9, 306–310. [Google Scholar] [CrossRef]
  75. FAO. GAEZ Definitions; FAO: Rome, Italy, 2012. [Google Scholar]
  76. Prendiville, R.; Pierce, K.M.; Delaby, L.; Buckley, F. Animal Performance and Production Efficiencies of Holstein-Friesian, Jersey and Jersey × Holstein-Friesian Cows throughout Lactation. Livest. Sci. 2011, 138, 25–33. [Google Scholar] [CrossRef]
  77. Castells, L.; Bach, A.; Araujo, G.; Montoro, C.; Terré, M. Effect of Different Forage Sources on Performance and Feeding Behavior of Holstein Calves. J. Dairy Sci. 2012, 95, 286–293. [Google Scholar] [CrossRef] [PubMed]
  78. Kim, C.-H.; Yoon, J.T.; Lee, J.H.; Kim1, C.K.; Chung1, Y.C.; Kim, C.-H. Effects of Milk Production, Season, Parity and Lactation Period on Variations of Milk Urea Nitrogen Concentration and Milk Components of Holstein Dairy Cows. J. Anim. Sci. 2004, 17, 479–484. [Google Scholar] [CrossRef]
  79. Rose, D.C.; Sutherland, W.J.; Parker, C.; Lobley, M.; Winter, M.; Morris, C.; Twining, S.; Ffoulkes, C.; Amano, T.; Dicks, L.V. Decision Support Tools for Agriculture: Towards Effective Design and Delivery. Agric. Syst. 2016, 149, 165–174. [Google Scholar] [CrossRef]
  80. Rose, D.C.; Morris, C.; Lobley, M.; Winter, M.; Sutherland, W.J.; Dicks, L.V. Exploring the Spatialities of Technological and User Re-Scripting: The Case of Decision Support Tools in UK Agriculture. Geoforum 2018, 89, 11–18. [Google Scholar] [CrossRef]
  81. Lundström, C.; Lindblom, J. Considering Farmers’ Situated Knowledge of Using Agricultural Decision Support Systems (AgriDSS) to Foster Farming Practices: The Case of CropSAT. Agric. Syst. 2018, 159, 9–20. [Google Scholar] [CrossRef]
  82. Meul, M.; van Middelaar, C.E.; de Boer, I.J.M.; van Passel, S.; Fremaut, D.; Haesaert, G. Potential of Life Cycle Assessment to Support Environmental Decision Making at Commercial Dairy Farms. Agric. Syst. 2014, 131, 105–115. [Google Scholar] [CrossRef]
  83. Howitt, M.; McManus, J. Stakeholder Management: An Instrument for Decision Making. Manag. Serv. 2012, 56, 29–34. [Google Scholar]
  84. Reiter, D.; Meyer, W.; Parrott, L. Stakeholder Engagement with Environmental Decision Support Systems: The Perspective of End Users. Can. Geogr. 2019, 63, 631–642. [Google Scholar] [CrossRef]
  85. Mackrell, D.; Kerr, D.; von Hellens, L. A Qualitative Case Study of the Adoption and Use of an Agricultural Decision Support System in the Australian Cotton Industry: The Socio-Technical View. Decis. Support Syst. 2009, 47, 143–153. [Google Scholar] [CrossRef]
  86. Cheung, K.L.; Evers, S.M.A.A.; Hiligsmann, M.; Vokó, Z.; Pokhrel, S.; Jones, T.; Muñoz, C.; Wolfenstetter, S.B.; Józwiak-Hagymásy, J.; de Vries, H. Understanding the Stakeholders’ Intention to Use Economic Decision-Support Tools: A Cross-Sectional Study with the Tobacco Return on Investment Tool. Health Policy 2016, 120, 46–54. [Google Scholar] [CrossRef] [PubMed]
  87. Neethirajan, S. The Role of Sensors, Big Data and Machine Learning in Modern Animal Farming. Sens. Bio-Sens. Res. 2020, 29, 100367. [Google Scholar] [CrossRef]
  88. Groher, T.; Heitkämper, K.; Umstätter, C. Digital Technology Adoption in Livestock Production with a Special Focus on Ruminant Farming. Animal 2020, 14, 2404–2413. [Google Scholar] [CrossRef]
  89. Halachmi, I.; Guarino, M.; Bewley, J.; Pastell, M. Smart Animal Agriculture: Application of Real-Time Sensors to Improve Animal Well-Being and Production. Annu. Rev. Anim. Biosci. 2019, 7, 403–425. [Google Scholar] [CrossRef] [PubMed]
  90. Ingram, J.; Gaskell, P. Reflections on Co-Constructing a Digital Adviser with Stakeholders in Agriculture and Forestry. In Proceedings of the European IFSA Symposium, Chania, Greece, 1–5 July 2018; p. 1. [Google Scholar]
  91. Rose, D.C.; Parker, C.; Fodey, J.; Park, C.; Sutherland, W.J.; Dicks, L.V. Involving Stakeholders in Agricultural Decision Support Systems: Improving User-Centred Design. Int. J. Agric. Manag. 2018, 6, 80–89. [Google Scholar]
  92. Piñeiro, V.; Arias, J.; Dürr, J.; Elverdin, P.; Ibáñez, A.M.; Kinengyere, A.; Opazo, C.M.; Owoo, N.; Page, J.R.; Prager, S.D.; et al. A Scoping Review on Incentives for Adoption of Sustainable Agricultural Practices and Their Outcomes. Nat. Sustain. 2020, 3, 809–820. [Google Scholar] [CrossRef]
  93. Kilpatrick, S. Education and Training: Impacts on Farm Management Practice. J. Agric. Educ. Ext. 2000, 7, 105–116. [Google Scholar] [CrossRef]
  94. Jithin Das, V.; Sharma, S.; Kaushik, A. Views of Irish Farmers on Smart Farming Technologies: An Observational Study. AgriEngineering 2019, 1, 164–187. [Google Scholar] [CrossRef]
  95. Zhai, Z.; Martínez, J.F.; Beltran, V.; Martínez, N.L. Decision Support Systems for Agriculture 4.0: Survey and Challenges. Comput. Electron. Agric. 2020, 170, 105256. [Google Scholar] [CrossRef]
  96. Lovarelli, D.; Bacenetti, J.; Guarino, M. A Review on Dairy Cattle Farming: Is Precision Livestock Farming the Compromise for an Environmental, Economic and Social Sustainable Production? J. Clean. Prod. 2020, 262, 121409. [Google Scholar] [CrossRef]
  97. Rotz, C.A.; Asem-Hiablie, S.; Place, S.; Thoma, G. Environmental Footprints of Beef Cattle Production in the United States. Agric. Syst. 2019, 169, 1–13. [Google Scholar] [CrossRef]
  98. Pardo, G.; del Prado, A.; Fernández-Álvarez, J.; Yáñez-Ruiz, D.R.; Belanche, A. Influence of Precision Livestock Farming on the Environmental Performance of Intensive Dairy Goat Farms. J. Clean. Prod. 2022, 351, 131518. [Google Scholar] [CrossRef]
  99. Sala, S.; Cerutti, A.K.; Pant, R. Development of a Weighting Approach for the Environmental Footprint; Publications Office of the European Union: Luxembourg, 2018. [CrossRef]
  100. Crenna, E.; Secchi, M.; Benini, L.; Sala, S. Global Environmental Impacts: Data Sources and Methodological Choices for Calculating Normalization Factors for LCA. Int. J. Life Cycle Assess. 2019, 24, 1851–1877. [Google Scholar] [CrossRef]
  101. Vandyck, T.; Keramidas, K.; Tchung-Ming, S.; Weitzel, M.; Van Dingenen, R. Quantifying Air Quality Co-Benefits of Climate Policy across Sectors and Regions. Clim. Chang. 2020, 163, 1501–1517. [Google Scholar] [CrossRef]
  102. Bachmann, T.M. Considering Environmental Costs of Greenhouse Gas Emissions for Setting a CO2 Tax: A Review. Sci. Total Environ. 2020, 720, 137524. [Google Scholar] [CrossRef]
  103. Cool Farm Alliance Cool Farm Tool. Available online: https://coolfarmtool.org/ (accessed on 10 July 2023).
  104. Cool Farm Alliance Cool Farm Guidance. Available online: https://coolfarm.org/resources/ (accessed on 10 July 2023).
  105. Aarhus University FarmAC. Available online: https://www.farmac.dk/ (accessed on 10 July 2023).
  106. Aarhus University FarmAC. Guidance. Available online: https://web04.agro.au.dk/projectnet/farmac/Pages/FarmAC%20users%20guide%20v3.htm (accessed on 10 July 2023).
  107. Overseer Limited Overseer. Available online: https://www.overseer.org.nz/ (accessed on 10 July 2023).
  108. Overseer Limited Overseer Support and Training. Available online: https://www.overseer.org.nz/support-and-training (accessed on 10 July 2023).
  109. Bord Bia BORD BIA. Available online: https://qas.bordbia.ie/Login.aspx?ReturnUrl=%2F (accessed on 10 July 2023).
  110. Τeagasc; Bord Bia. The Carbon Navigator Dairy. 2019. Available online: https://www.teagasc.ie/publications/2019/the-dairy-carbon-navigator.php (accessed on 10 July 2023).
  111. Buckley, C.; Donnellan, T.; Dillon, E.; Hanrahan, K.; Moran, B.; Ryan, M.; Curley, A.; Deane, L.; Delaney, L.; Harnett, P.; et al. Teagasc National Farm Survey 2017 Sustainability Report; Athenry, Co.: Galway, Ireland, 2019; ISBN 978-1-84170-650-4. [Google Scholar]
  112. Teagasc The Carbon Navigator Beef. Available online: https://www.teagasc.ie/publications/2019/the-beef-carbon-navigator.php (accessed on 10 July 2023).
  113. Effenberger, M.; Gödeke, K.; Grebe, S.; Haenel, H.-D.; Hansen, A.; Häußermann, U.; Kätsch, S.; Lasar, A.; Nyfeler-Brunner, A.; Osterburg, B.; et al. Berechnungsstandard Für Einzelbetriebliche Klimabilanzen (BEK) in Der Landwir; KTBL: Darmstadt, Germany, 2016. [Google Scholar]
  114. KTBL AG BEK (2016): Berechnungsstandard Für Einzelbetriebliche Klimabilanzen (BEK) in Der Landwirtschaft. Berechnungsparameter Für Einzelbetriebliche Klimabilanzen. Darmstadt, Kuratorium Für Technik Und Bauwesen in Der Landwirtschaft (KTBL). Available online: https://www.ktbl.de/themen/bek (accessed on 10 July 2023).
  115. FAO. SAFA. Available online: http://www.fao.org/nr/sustainability/sustainability-assessments-safa/safa-tool/en/ (accessed on 10 July 2023).
  116. FAO. Food and Agricultural Organization of United Nations: Sustainability Pathways; FAO: Rome, Italy, 2016; Volume 45. [Google Scholar]
  117. DLG e.V. DLG. Available online: https://www.dlg-nachhaltigkeit.info/de/ (accessed on 10 July 2023).
  118. Goverment of Canada HOLOS. Available online: https://agriculture.canada.ca/en/agricultural-production/holos-software-program (accessed on 10 July 2023).
  119. FAO EX-ACT. Available online: https://www.fao.org/in-action/epic/ex-act-tool/suite-of-tools/ex-act/en/ (accessed on 10 July 2023).
  120. Grewer, U.; Bockel, L.; Schiettecatte, L.-S.; Bernoux, M. Ex-Ante Carbon-Balance Tool (EX-ACT); FAO: Rome, Italy, 2017. [Google Scholar]
  121. FAO. GLEAM 2, 2016. Global Livestock Environmental Assessment Model; FAO: Rome, Italy, 2018. [Google Scholar]
Figure 1. Classification of the DS tools based on the sustainability indicators assessed (blue: yes; yellow: no).
Sustainability 15 13041 g001
Figure 2. Category of soil-related inputs (blue: yes; yellow: no. (Regarding the SAFA DS tool, these inputs are not required in the user interface but they are necessary in the scoring procedure).
Sustainability 15 13041 g002
Figure 3. Category of crop-related inputs (blue: yes; yellow: no). (Regarding the SAFA DS tool, these inputs are not required in the user interface but they are necessary in the scoring procedure).
Sustainability 15 13041 g003
Figure 4. Climate-related inputs of the DS tools evaluated (blue: yes; yellow: no). (Regarding the SAFA DS tool, these inputs are not required in the user interface but they are necessary in the scoring procedure).
Sustainability 15 13041 g004
Figure 5. Livestock-related inputs in the DS tools evaluated (blue: yes; yellow: no). (Regarding the SAFA DS tool, these inputs are not required in the user interface but they are necessary in the scoring procedure).
Sustainability 15 13041 g005
Figure 6. Outputs in the DS tools evaluated (blue: yes; yellow: no). EICIs refer to all the environmental impact categories, except climate change, as this is reported as total GHG emissions (in CO2 eq).
Sustainability 15 13041 g006
Table 1. Degree of accessibility of the DS tools evaluated.
DS ToolAvailabilityRegistration Required
Cool Farm Tool v2.0Freeware; online *Yes
FarmAC v1.8Open-source code; onlineYes; registration to be approved by developers
Overseer v5.4License purchase required for full use (with Beta mode); OnlineYes
Carbon Navigator—Dairy/BeefFreeware—developer’s permission login; onlineYes; registration to be approved by developers
KSNL-Kriteriensystem Nachhaltige LandwirtschaftLicense purchase required; onlineYes; registration to be approved by developers
SAFA v2.2.41Free; for downloadingYes
RISE v3.0-Response-Inducing Sustainability EvaluationLicense purchase required; for downloading or online useYes; registration to be approved by developers
BEK v1.0-Berechnungsstandard für einzelbetriebliche Klimabilanzen in der LandwirtschaftFreeware; for downloading or online useNo
DLG-Nachhaltigkeitsstandard (based on REPRO)License purchase required (without beta mode); not onlineYes; registration to be approved by developers
HOLOS v4.0Freeware; for downloadingNo
EX-ACT v9.0Freeware; for downloadingNo
GLEAM v2.0 (GLEAM-I)Freeware; onlineNo
* Previous MS Excel version available for download.
Table 2. User-friendliness of the DS tools evaluated.
DS ToolSub-Criteria
Level of ExpertiseDegree of SimplicityPresentation of ResultsAvailable Results for Downloading or SavingData-Entry Error ManagementDesign of User Interface
Cool Farm Tool v2.0InexperiencedSimpleAggregated; graphicalYes (saved on webpage)EasySmaller weaknesses
FarmAC v1.8ExpertComplexAggregatedYes (MS Excel, XML, HTML)DifficultLarger weaknesses
Overseer v5.4InexperiencedSimpleAggregated; graphicalYes (MS Excel)EasySmaller weaknesses
Carbon Navigator—Dairy/BeefInexperiencedSimpleAggregated; graphicalYes (MS Excel)EasySmaller weaknesses
KSNL—Kriteriensystem Nachhaltige LandwirtschaftExperiencedSemi-simpleAggregated; graphical; scoresYes (PDF, MS Excel)EasySmaller weaknesses
SAFA v2.2.41InexperiencedSimpleAggregated; scores; graphicalYes (XML, HTML)EasySmaller weaknesses
RISE v3.0—Response-Inducing Sustainability EvaluationExperiencedSimpleAggregated; scores; graphicalYes (MS Word)EasySmaller weaknesses
BEK v1.0—Berechnungsstandard für einzelbetriebliche Klimabilanzen in der LandwirtschaftExperiencedSimpleAggregated (carbon footprint); tabularYes (MS Excel)EasySmaller weaknesses
DLG-Nachhaltigkeitsstandard (based on REPRO)ExperiencedSimpleAggregated; graphicalYes (XML, TXT, CSV, GML)EasySmaller weaknesses
HOLOS v4.0ExperiencedSimpleAggregated; graphicalYes (MS Excel)EasySmaller weaknesses
EX-ACT v9.0ExperiencedSimpleAggregated; graphicalYes (MS Excel)EasySmaller weaknesses
GLEAM v2.0 (GLEAM-I)ExperiencedSimpleAggregated; graphicalYes (MS Excel)EasySmaller weaknesses
Table 3. Stakeholders criterion for the DS tools evaluated.
DS ToolSub-Criteria
Agriculture Sub-Sector RepresentedTarget GroupStakeholders’ Involvement
Cool Farm Tool v2.0Livestock: Dairy cattle, pigs, beef cattle, sheep, goats, camels, horses, rabbits, chickens, turkeys, buffalo, ducks; Crops: Arable, rice, potatoesAgri-food sector; researchers, farmers, consultantsTested by stakeholders; semi-involved
FarmAC v1.8Livestock: Pig, cattle; Crops: ArableResearchers, university students, higher-level education usersThe tool developers also use the tool for their research needs; not involved
Overseer v5.4Livestock: Dairy, sheep, beef, deer, goats, outdoor pigs; Crops: Grains, vegetables, seeds; Trees: Kiwifruit, apples, grapes, avocados, peachesAgri-food sector, researchers, farmers, consultants, clientsNot involved
Carbon Navigator—Dairy/BeefDairy cattleConsultants, recorders, researchers, clientsMany stakeholders have linked their systems with the Carbon Navigator including, but not limited to, the Irish Cattle Breeding Federation, Bord Bia, the DAFM, and milk and meat processors
KSNL—Kriteriensystem Nachhaltige LandwirtschaftCrop and livestock productionFarm consultantsNot involved
SAFA v2.2.41Crop and livestock productionResearchers, farmers, consultantsNE *
RISE v3.0—Response-Inducing Sustainability EvaluationCrop and livestock productionClients, especially farm managers, consultantsNE *
BEK v1.0—Berechnungsstandard für einzelbetriebliche Klimabilanzen in der LandwirtschaftCrop and livestock productionNot public; suitable for farm consultantsNot involved
DLG-Nachhaltigkeitsstandard (based on REPRO)Crop and livestock productionClients (farmers, farmer advisors, agricultural value chain, public)NE *
HOLOS v4.0Livestock: Beef cattle, dairy cattle, swine, sheep, poultry, other animals; Crops: Annual, perennials, fallow areas, grasslands, tree plantingResearchers, farmers, consultantsInvolved
EX-ACT v9.0Livestock: Dairy cattle, pigs, beef cattle, sheep, goats, camels, horses, poultry, buffalo, other livestock; Crops: Arable, rice, potatoes, soybeans, beans, pulsesResearchers, farmers, consultantsNot involved
GLEAM v2.0 (GLEAM-I)Livestock: Dairy cattle, pigs, beef cattle, sheep, goats, buffalo, poultryAnyone familiar with the agri-food sector, researchers, farmers, consultantsNot involved
* NE: Not evaluated.
Table 4. Methodology of sustainability for the DS tools evaluated.
DS ToolSub-Criteria
Level of Sustainability AssessmentTypes of Gas Emissions (Farm Level)GHG Emissions’ Estimation MethodologyNH3 Emissions’ Estimation MethodologyDecision Support Approach
Cool Farm Tool v2.0Pillars: Multi-pillar (economic, environmental); Indicators: Multi-indicatorN2O, CH4, CO2, CO2 eqIPCC 2006NoScenario analysis, contribution analysis, progress monitoring, action plans, knowledge transfer, comparative assessment
FarmAC v1.8Pillars: Single-pillar (environmental); Indicators: Multi-indicatorNH3 and N2O, CH4, CO2, CO2 eqIPCC 2006IPCC 2006 and EMEP [70]Scenario analysis, knowledge transfer, contribution analysis, progress monitoring
Overseer v5.4Pillars: Multi-pillar (economic, environmental);
Indicators: Multi-indicator
N2O, CH4, CO2, CO2 eqOverseer and IPCC 2006NoScenario analysis, contribution analysis, progress monitoring, action plans, knowledge transfer, comparative assessment
Carbon Navigator—Dairy/BeefPillars: Multi-pillar (environmental, economic); Indicators: Multi-indicatorN2O, CH4, CO2, CO2 eqIPCC 2006NoProgress monitoring, comparative assessment, scenario analysis, knowledge transfer
KSNL—Kriteriensystem Nachhaltige LandwirtschaftPillars: Multi-pillar (environmental, economic, social); Indicators: Multi-indicatorNH3 and N2O, CH4, CO2, CO2 eqKSNL, IPCC 2006,
and environmental sustainability impact
German fertilizer ordinance (2007) [71]Contribution analysis, scenario analysis, progress monitoring, comparative assessment, action plans, knowledge transfer
SAFA v2.2.41Pillars: Multi-pillar (environmental, economic, governance, social); Indicators: Multi-indicatorNo output providedFAO Guidance (SAFA guidance),
only environmental sustainability impact
NoContribution analysis, progress monitoring, comparative assessment, action plans, knowledge transfer
RISE v3.0—Response-Inducing Sustainability EvaluationPillars: Multi-pillar (environmental, economic, social); Indicators: Multi-indicatorNH3 risk, N2O, CH4, CO2, CO2 eqRISE, IPCC 2006,
and environmental sustainability impact
RISE for the ammonia riskContribution analysis, progress monitoring, comparative assessment, action plans, knowledge transfer
BEKv1.0—Berechnungsstandard für einzelbetriebliche Klimabilanzen in der LandwirtschaftPillars: Single-pillar (environmental); Indicators: GHG and NH3 emissionsNH3 and N2O, CH4, CO2, CO2 eqBEK and IPCC 2006EMEP (2009) [72]Contribution analysis, scenario analysis, knowledge transfer
DLG-Nachhaltigkeitsstandard (based on REPRO)Pillars: Multi-pillar (environmental, economic, social); Indicators: Multi-indicatorN2O, CH4, CO2, CO2 eqREPRO
model, N2O
based on IPCC
1996
NoContribution analysis, progress monitoring, comparative assessment, action plans, knowledge transfer
HOLOS v4.0Pillars: Multi-pillar (environmental, economic); Indicators: Multi-indicatorNH3 and N2O, CH4, CO2, CO2eqIPCC 2006HOLOS 4 and IPCC 2006Scenario analysis, contribution analysis, progress monitoring, knowledge transfer, comparative assessment
EX-ACT v9.0Pillars: Single-pillar (environmental); Indicators: Multi-indicatorN2O, CH4, CO2, CO2 eqIPCC 2006, 2019 refinement of the IPCC 2006NoScenario analysis, contribution analysis, progress monitoring, comparative assessment, knowledge transfer
GLEAM v2.0 (GLEAM-I)Pillars: Single-pillar (environmental); Indicators: GHG emissionsN2O, CH4, CO2, CO2 eqIPCC 2006NoScenario analysis, contribution analysis, progress monitoring, comparative assessment, knowledge transfer
Table 5. Modeling aspects for the DS tools evaluated.
DS ToolSub-Criteria
SoftwareType of ModelingModeling Method Transparency
Cool Farm Tool v2.0Online: User interface based on Excel sheets.Quantitative approachSemi-transparent
FarmAC v1.8Online: Internet browser (C, HTML).Quantitative approachTransparent
Overseer v5.4OnlineQuantitative approachTransparent
Carbon Navigator—Dairy/BeefOnlineQuantitative approachSemi-transparent
KSNL—Kriteriensystem Nachhaltige LandwirtschaftOnlineSemi-quantitative approachSemi-transparent
SAFA v2.2.41Offline: Downloading from website (HTML, JavaScript, CSS).Semi-quantitative approachTransparent
RISE v3.0—Response-Inducing Sustainability EvaluationOnline: Only Internet Explorer; Offline: Downloading from website (HTML).Semi-quantitative approachSemi-transparent
BEK v1.0—Berechnungsstandard für einzelbetriebliche Klimabilanzen in der LandwirtschaftOffline, Excel toolQuantitative approachTransparent
DLG-Nachhaltigkeitsstandard (based on REPRO)Offline toolSemi-quantitative approachTransparent
HOLOS v4.0Offline: Downloading from website. Provides synchronization with databases.Quantitative approachTransparent
EX-ACT v9.0Offline: Based on Excel sheets.Quantitative approachTransparent
GLEAM v2.0 (GLEAM-I)OnlineQuantitative approachTransparent
Disclaimer/Publisher’s Note: The statements, opinions and data contained in all publications are solely those of the individual author(s) and contributor(s) and not of MDPI and/or the editor(s). MDPI and/or the editor(s) disclaim responsibility for any injury to people or property resulting from any ideas, methods, instructions or products referred to in the content.

