Article

Fertilizers Containing Balanced Proportions of NH4+-N and NO3-N Enhance Maize (Zea mays L.) Yield Due to Improved Nitrogen Recovery Efficiency

1
Soil and Water Testing Laboratory, Pakarab Fertilizer Khanewal Road, Multan 59060, Pakistan
2
Department of Soil Science, Faculty of Agricultural Sciences & Technology, Bahauddin Zakariya University, Multan 60800, Pakistan
3
Soil and Water Testing Laboratory, Pakpattan Road, Sahiwal 57001, Pakistan
4
Department of Botany and Microbiology, College of Science, King Saud University, Riyadh 11451, Saudi Arabia
5
Technical Services, Fatima Fertilizer Company, Pvt. Ltd., Lahore 54810, Pakistan
6
Institute of Soil & Environmental Sciences, PMAS-Arid Agriculture University, Rawalpindi 46300, Pakistan
7
Department of Soil, Water and Climate, College of Food, Agricultural and Natural Resource Sciences, Saint Paul, MN 55108, USA
*
Author to whom correspondence should be addressed.
Sustainability 2023, 15(16), 12547; https://doi.org/10.3390/su151612547
Submission received: 22 June 2023 / Revised: 8 August 2023 / Accepted: 9 August 2023 / Published: 18 August 2023

Abstract

:
The current study aimed to improve the nitrogen recovery efficiency (NRE) of maize under the application of balanced proportions of ammoniacal-nitrogen (NH4+-N) and nitrate-nitrogen (NO3-N) (1:1), as well as to determine economic impacts of such fertilizers on maize productivity. A 3-year field study was carried out in Sahiwal, Punjab, Pakistan during the 2018–2020 growing seasons with autumn maize. In parallel, multi-location field experiments were conducted at farmer’s fields in Sahiwal during the same growing seasons with autumn maize. The trials compared the effects of different fertilizers like urea, calcium ammonium nitrate (CAN), Sarsabz nitrophos (NP), nitrphos plus (NP Plus), and di-ammonium phosphate (DAP) on maize growth and yield, as well their economic efficiency. The results revealed that the application of Sarsabz NP and CAN increased the maize grain yield by 30%, 13%, 15%, 19%, 15%, and 9% as compared to the control, NP + urea, NP Plus + CAN, NP Plus + urea, DAP + urea, and DAP + CAN, respectively. In addition, the combined application of NP and CAN increased the total N and NO3-N concentrations, whereas it decreased the NH4+-N concentrations in the soils. By contrast, NP + CAN increased the NH4+-N concentrations in maize leaves as compared to NO3-N concentrations. Overall, the NRE of maize plants and the net return were higher under combined application of NP and CAN. In conclusion, CAN fertilizer increased the soil NO3-N concentrations, which thus assimilated in the plants as NH4+ and improved the NRE of maize. Improved NRE thus enhanced maize yield and resulted in the maximum net return as compared to all other fertilizer combinations.

Graphical Abstract

1. Introduction

Nitrogen (N) availability is a key factor that controls crop productivity throughout the world. In general, the soil surface layer (0–15 cm depth) contains 0.1–0.6% N [1] and plants mainly use inorganic forms of N like NH4+, NO3, and nitrite (NO2). In irrigated and aerated soils, NO3 is the dominant form of N, whereas NH4+ can be dominant in acidic and/or anaerobic soils [2]. NO2 concentrations in soils are typically lower than NH4+ concentrations; however, this is dependent on the balance of nitrification and de-nitrification [3]. Recent pieces of evidence suggest that plants also absorb the organic form of N from its sources—urea, amino acids, and peptides [4,5]—but organic N supplies are not comparable with inorganic N supplies, because NH4+-N and NO3-N are often found in high amounts in soils than all the other forms [2]. Because of its diverse effects in plant nutrition and physiology, NO3-N is regarded as a significant N source for all plants [6,7].
It is well known that N uptake by the plants is influenced by the presence of the N-form in the soil solution [8]. However, the soil reaction controls the nitrification and/or denitrification of N in soils [9,10]. Simek et al. [11] observed that the nitrification process accelerated when soil pH increased and vice versa. In Pakistan, soils are alkaline in nature (pH > 8.0) and contain low amounts of N. In this scenario, farmers are using nitrogenous fertilizers in the form of urea to meet the crop requirements [12]. In these soils, N losses from the urea are prevalent in the form of NH3 volatilization [1] and/or NH4+ fixation as it has a higher potential for NH3 volatilization with a lower susceptibility to NO3 leaching and de-nitrification than nitrate-based fertilizers [13,14], such as CAN. It is projected that around 3.34 million tons of urea is wasted each year owing to volatilization, leaching, and de-nitrification, resulting in a USD 40.5 billion economic loss [15].
Under such conditions, N-fertilizer containing balanced proportions of NH4+-N and NO3-N like CAN fertilizer could be used as an alternate source of fertilization. Because fertilizer CAN contains fast-acting NO3-N and slow-release NH4+-N, volatilization losses are negligible [16]. Growing evidence exists that N is mainly transported by water; hence, soil water at the root interface exports N to the aerial parts of plants [17]. This implies that fast-acting NO3-N is readily available to the plants through mass flow, whereas slow-release NH4+-N is available to the plants over time. Further, N uptake or utilization in plants is increased by 60% in the case of the ammonium nitrate (AN) source of N fertilization as compared to urea [16,18]. According to Sutton et al. [19], sub-optimal fertilizer management, including N fertilizers, may decrease nitrogen use efficiency (NUE) by 30–50%. Therefore, the right source of N fertilizer is the major management practice to improve NUE or NRE and crop production [20]. Therefore, increasing NRE is considered a major challenge in crop production.
Apart from the above, the assimilation of inorganic N greatly differs among crop species [21,22] as some plants prefer NH4+-N [23] while others prefer NO3-N [24]. Nitrate is transformed into NH3 by nitrate reductase (NR) and nitrite reductase (NiR) enzymes when it is taken up by the plants [25,26]. However, high concentrations of NH4+ in the plant tissues cause serious disorders [27,28], and reduce crop yield, especially under NH4+-N-containing inorganic N fertilization. Plants grow well when both types of inorganic N forms are supplied into the soils [29]. Plant growth and development were enhanced by the co-provision of both NH4+-N and NO3-N inorganic forms more than by NO3-N or NH4+-N alone [30].
Maize (Zea mays L.) is an essential crop around the world due to its usage as human food, animal (silage and grains), and poultry feed. Furthermore, it is a significant source of starch, dextrose, corn syrup, and corn flakes [31]. In Pakistan, it is considered one of the staple food crops after wheat and rice. Growing maize hybrids under the semiarid climates of Pakistan is advantageous over local cultivars because of their higher NRE and growers’ income [32]. However, various genotypes respond differently to different sources and levels of N. Previous studies have examined the impact of different N sources (ammonia or nitrate), rates, and times of N fertilization on maize crops [32,33,34,35]. Furthermore, there are few studies that show that slow-release nitrogen fertilizers in field trials and co-provision of NH4+-N and NO3-N in greenhouse conditions increased crop yield [20,30].
Multi-year and multi-location studies under field circumstances are required to undertake a comprehensive evaluation of the advantages of various N sources comprising a balanced amount of NH4+-N and NO3-N. We hypothesized that the N sources containing balanced proportions of both N-forms improve the NRE of the crops, thereby increasing the net return when compared with NH4+-N or NO3-N alone. The present study aimed to quantify the benefits of N sources under prevailing soil conditions of Pakistan and to determine the NRE of maize plants. Overall, the objective of the study was to evaluate the comparative effectiveness of the urea and CAN as N in terms of crop yield and growers’ income.

2. Materials and Methods

2.1. Soil Sampling and Experimentation

A 3-year field experiment with hybrid maize var. Syngenta 7720 was carried out in Sahiwal, Punjab, Pakistan (30°41′24′′ N, 73°1′48′′ E) during the maize growing season (August–November, 2018–2020). A total of 21 field blocks were prepared and each block had a length of 6.96 m and a width of 4.54 m. Before initiating fertilizer treatments, soil samples were collected from two depths—0–15 and 15–30 cm—air-dried, passed through a 2 mm sieve, and analyzed for soil physicochemical parameters (Table 1). Urea and CAN were used as the source of N, whereas di-ammonium phosphate (DAP), nitrophos (NP), and nitrophos plus (NP Plus) were applied as the P source of fertilization.
Potassium (K) was used as sulphate of potash at a rate of 37 kg K2O acre−1 in all blocks, whereas phosphorus (P) was given at a rate of 58 kg P2O5 acre−1 from its sources: NP, NP Plus, and DAP during sowing. Nitrogen was sprayed at a rate of 110 kg N acre−1 in three splits from two sources: CAN and urea. Although the composition of nutrients of the various fertilizers differed (Table S1), all fertilizers were applied at the same rate. The following seven fertilizer treatments were established: control (no N or P), NP + CAN, NP + urea, NP plus + CAN, NP Plus + urea, DAP + urea, and DAP + CAN. There were three replications for each treatment. Farmers’ fields of different locations were used for reproducibility of the yield data during the years 2017–2018 and 2020–2021.

2.2. Plant Growth Conditions and Harvesting

Plants received natural conditions with average day/night temperatures of 37/26 °C, a relative humidity of 30%, rainfall of 12 mm, and light duration of 14–15 h. A maximum rainfall of 30.08 mm was recorded in the month of September 2020. Plants were harvested upon completion of a life cycle or 100 days after sowing, and growth attributes like plant height, cob fresh and dry weights, cob length, no. of grain rows cob−1, 1000-grain weight plant−1, and total yield were monitored. Flag leaves were also collected for mineral analysis. Likewise, soil samples were also collected for post-harvest nutrient analysis.

2.3. Determination of Mineral N and Other N-Forms in Soils and Plant Tissues

Total N concentrations were enumerated using Kjeldahl distillation apparatus (S3 Behr, Düsseldorf, Germany). NH4+-N concentrations in the soils were measured according to the methods described by Yuen and Pollard [36]. Briefly, 10 g of soil was extracted with 2 M KCl in a mechanical shaker at a speed of 200 rpm for 1 h. Soil suspension was filtered and collected filtrate was thus processed for steam distillation after adding 0.5 g of MgO. A 2% solution of boric acid containing a few drops of bromocresol green and methyl red indicators was used to collect ammonia (NH3). After that, 0.01 N NaOH was titrated with the collected distillate until the pink end point. Likewise, NO3-N concentrations in the soils were assessed, and Soltanpour and Workman’s [37] techniques were used to measure them using a Spectrophotometer (UH 5300, Hitachi, Tokyo, Japan) at a wavelength of 540 nm. In a nutshell, 20 mL of AB-DTPA extraction solution was combined with 10 g of air-dry soil before being shaken at a speed of 180 rpm for 20 min and filtering through Whatman filter paper. The digestion flasks were filled with 1 mL of filtrate, 3 mL of 0.2 M CuSO4, 2 mL of 0.01 M hydrazine sulfate, and 3 mL of 1.5 M NaOH, and heated for 20 min. After cooling, 3 mL of color development reagent was applied, and NO3-N concentrations in soil samples were assessed.
Leaf samples were oven-dried at 65 °C until a constant dry weight was not achieved in order to determine total N, NH4+-N, and NO3-N in plant tissues. After that, leaf samples were ground well and utilized to determine total N, NH4+-N, and NO3-N using Kjeldahl distillation apparatus (S3 Behr, Düsseldorf, Germany) in accordance with AOAC methodologies [38] and Jackson [39] procedures. For that, a 0.1 g leaf sample was blended with 0.02 g of powdered pumice and 1.33 g of catalyst combination, and digested in 1.5 mL of H2SO4 at 200–240 °C for NH4+-N analysis. In addition, a few drops of 30% H2O2 were also mixed in order to enhance the digestion. The collected digests were thus diluted to 20 mL with distilled water and 5 mL of diluted digest was used for NH4+-N analysis. Likewise, a 0.1 g leaf material was treated with a salicylic acid–sulfuric acid mixture (1:30 g/v, 3 mL) and allowed to stand for 2 h for the determination of NO3-N. Afterward, 0.5 g of Na2S2O3.5H2O crystals, 0.02 g of powdered pumice, and 1.33 g of catalyst mixture were added and digested at 200–240 °C. A few drops of 30% H2O2 were also added in a similar way to the leaf N and NH4+-N analyses.

2.4. Determination of NRE in Maize

The NRE of maize plants was determined by computing the data of plant N and maize grain yield in an equation described by Lüder et al. [40]:
NRE (kg kg−1) = Uptake efficiency × utilization efficiency
  • where
  • Uptake efficiency = Nt/Ns;
  • Utilization efficiency = Gw/Nt;
  • Nt = Total N uptake by maize at harvesting (kg acre−1);
  • Ns = Nitrogen supply rate (kg acre−1);
  • Gw = Maize grain yield (kg acre−1).

2.5. Determination of Available Soil Phosphorus (P) and Plant Total P Concentrations

Available soil phosphorus was measured with the help of a spectrophotometer (UH 5300, Hitachi, Tokyo, Japan) at a wavelength of 882 nm using 0.5 M NaHCO3 (pH 8.5) as an extracting solution according to the published protocols of Olsen et al. [41].
Phosphorus concentrations in leaf tissues were determined spectrophotometrically (UH 5300, Hitachi, Japan) at a wavelength of 410 nm after digesting them in 5 mL of acid digestion mixture: HNO3 and HClO4 (4:1 v/v). Leaf digests were thus used for subsequent analysis using ammonium-vanadomolybdate as a color-developing reagent.

2.6. Determination of Potassium Concentrations in Soils and Leaf Tissues

Potassium concentrations in soil samples were measured using flame photometer (PFP 7, Jenway, London, UK) at a wavelength of 767 nm. For this purpose, 4 g of air-dried soil was mixed in 20 mL of 1 M ammonium acetate as an extracting solution according to the published protocols of Richards [42]. Likewise, K concentrations in acid digests (HNO3:HClO4) were determined with the help of a flame photometer at a wavelength of 767 nm.

2.7. Quantification of Net Return and Return on Investment (ROI)

Net return and ROI of maize grain yield were calculated on account of the fertilizer’s cost, whereas other expenses incurred on management practices were considered constant. The following formulae were used to calculate Net Return and ROI [43]:
N e t   R e t u r n = T o t a l   B e n i f i t s T o t a l   C o s t   o f   F e t i l i z e r s  
R O I = N e t   R e t u r n C o s t   o f   I n v e s t m e n t  

2.8. Experimental Design and Data Analysis

A randomized complete block design (RCBD) was used for the experiment. Treatment means and analysis of variance (ANOVA) were compared using Tukey’s post hoc test (p ≤ 0.05 level) of Sigma Stat (SPSS, Inc., Chicago, IL, USA). Sigma Stat (SPSS, Inc., Chicago, IL, USA) was used to perform an analysis of variance on the obtained data and compare treatment means using the Tukey’s post hoc test (p ≤ 0.05 level). To check the interdependency among the parameters, Pearson’s correlation coefficients were calculated at p ≤ 0.05, 0.01, and 0.001 levels.

3. Results

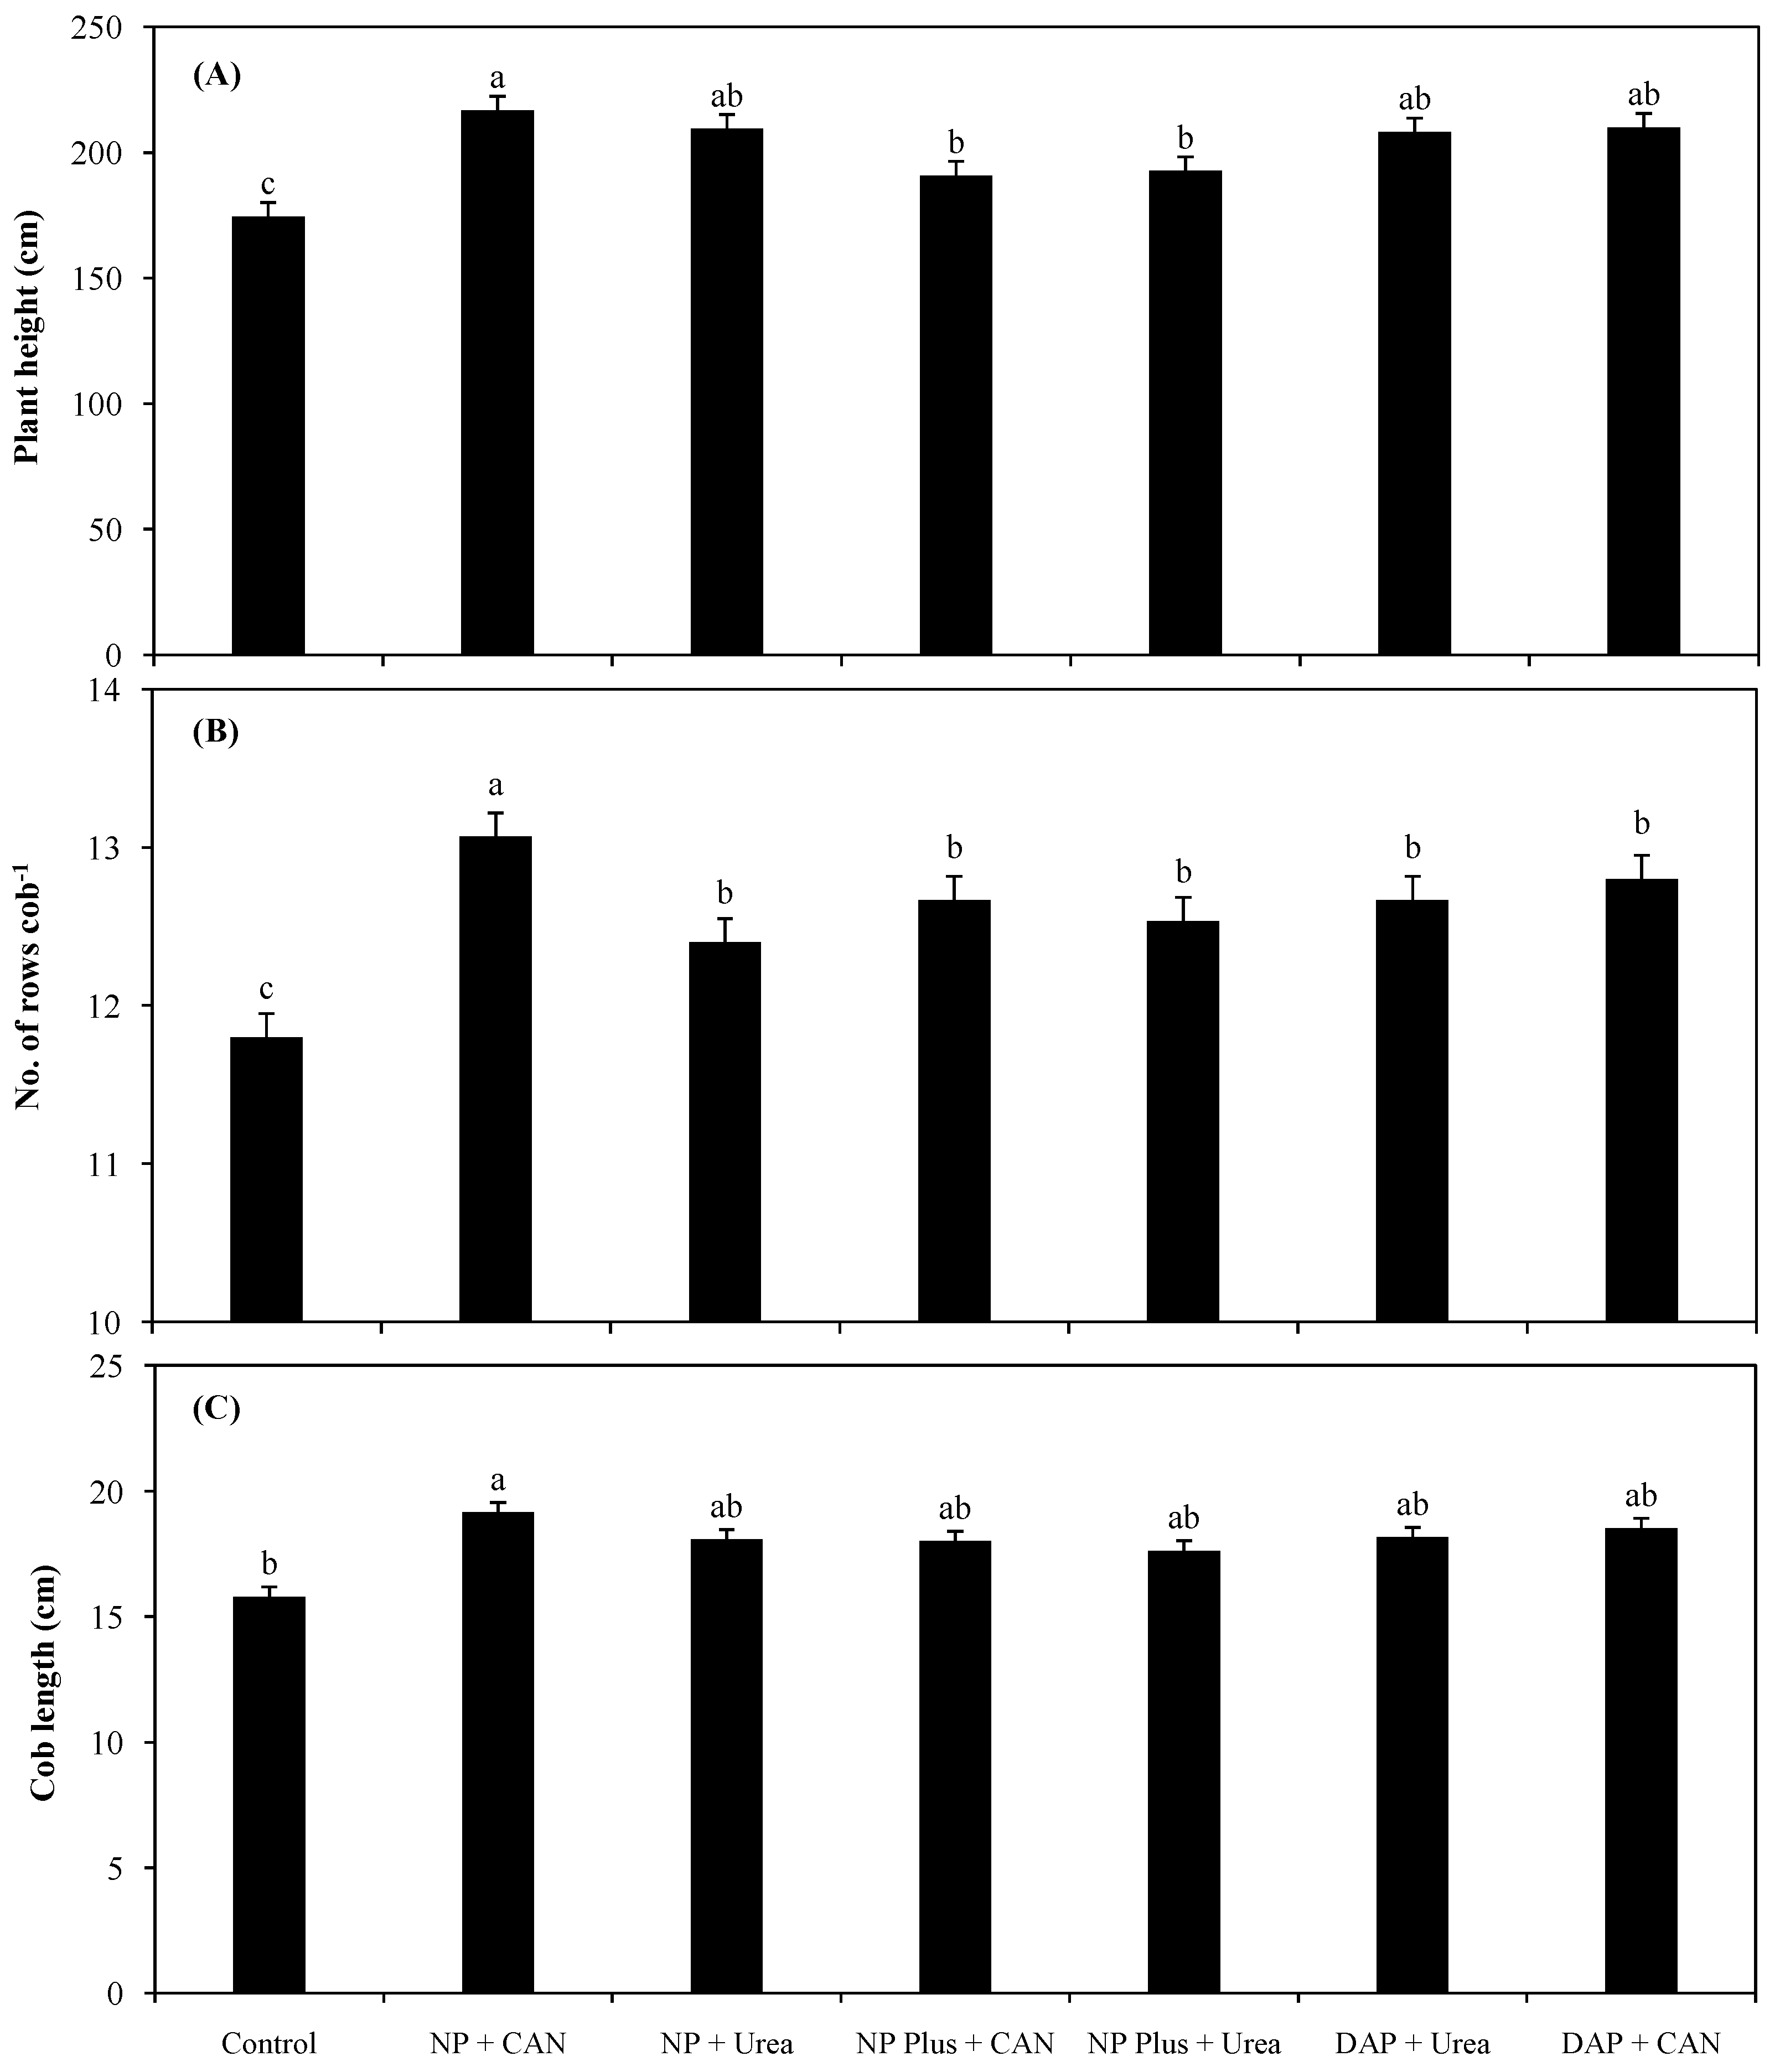
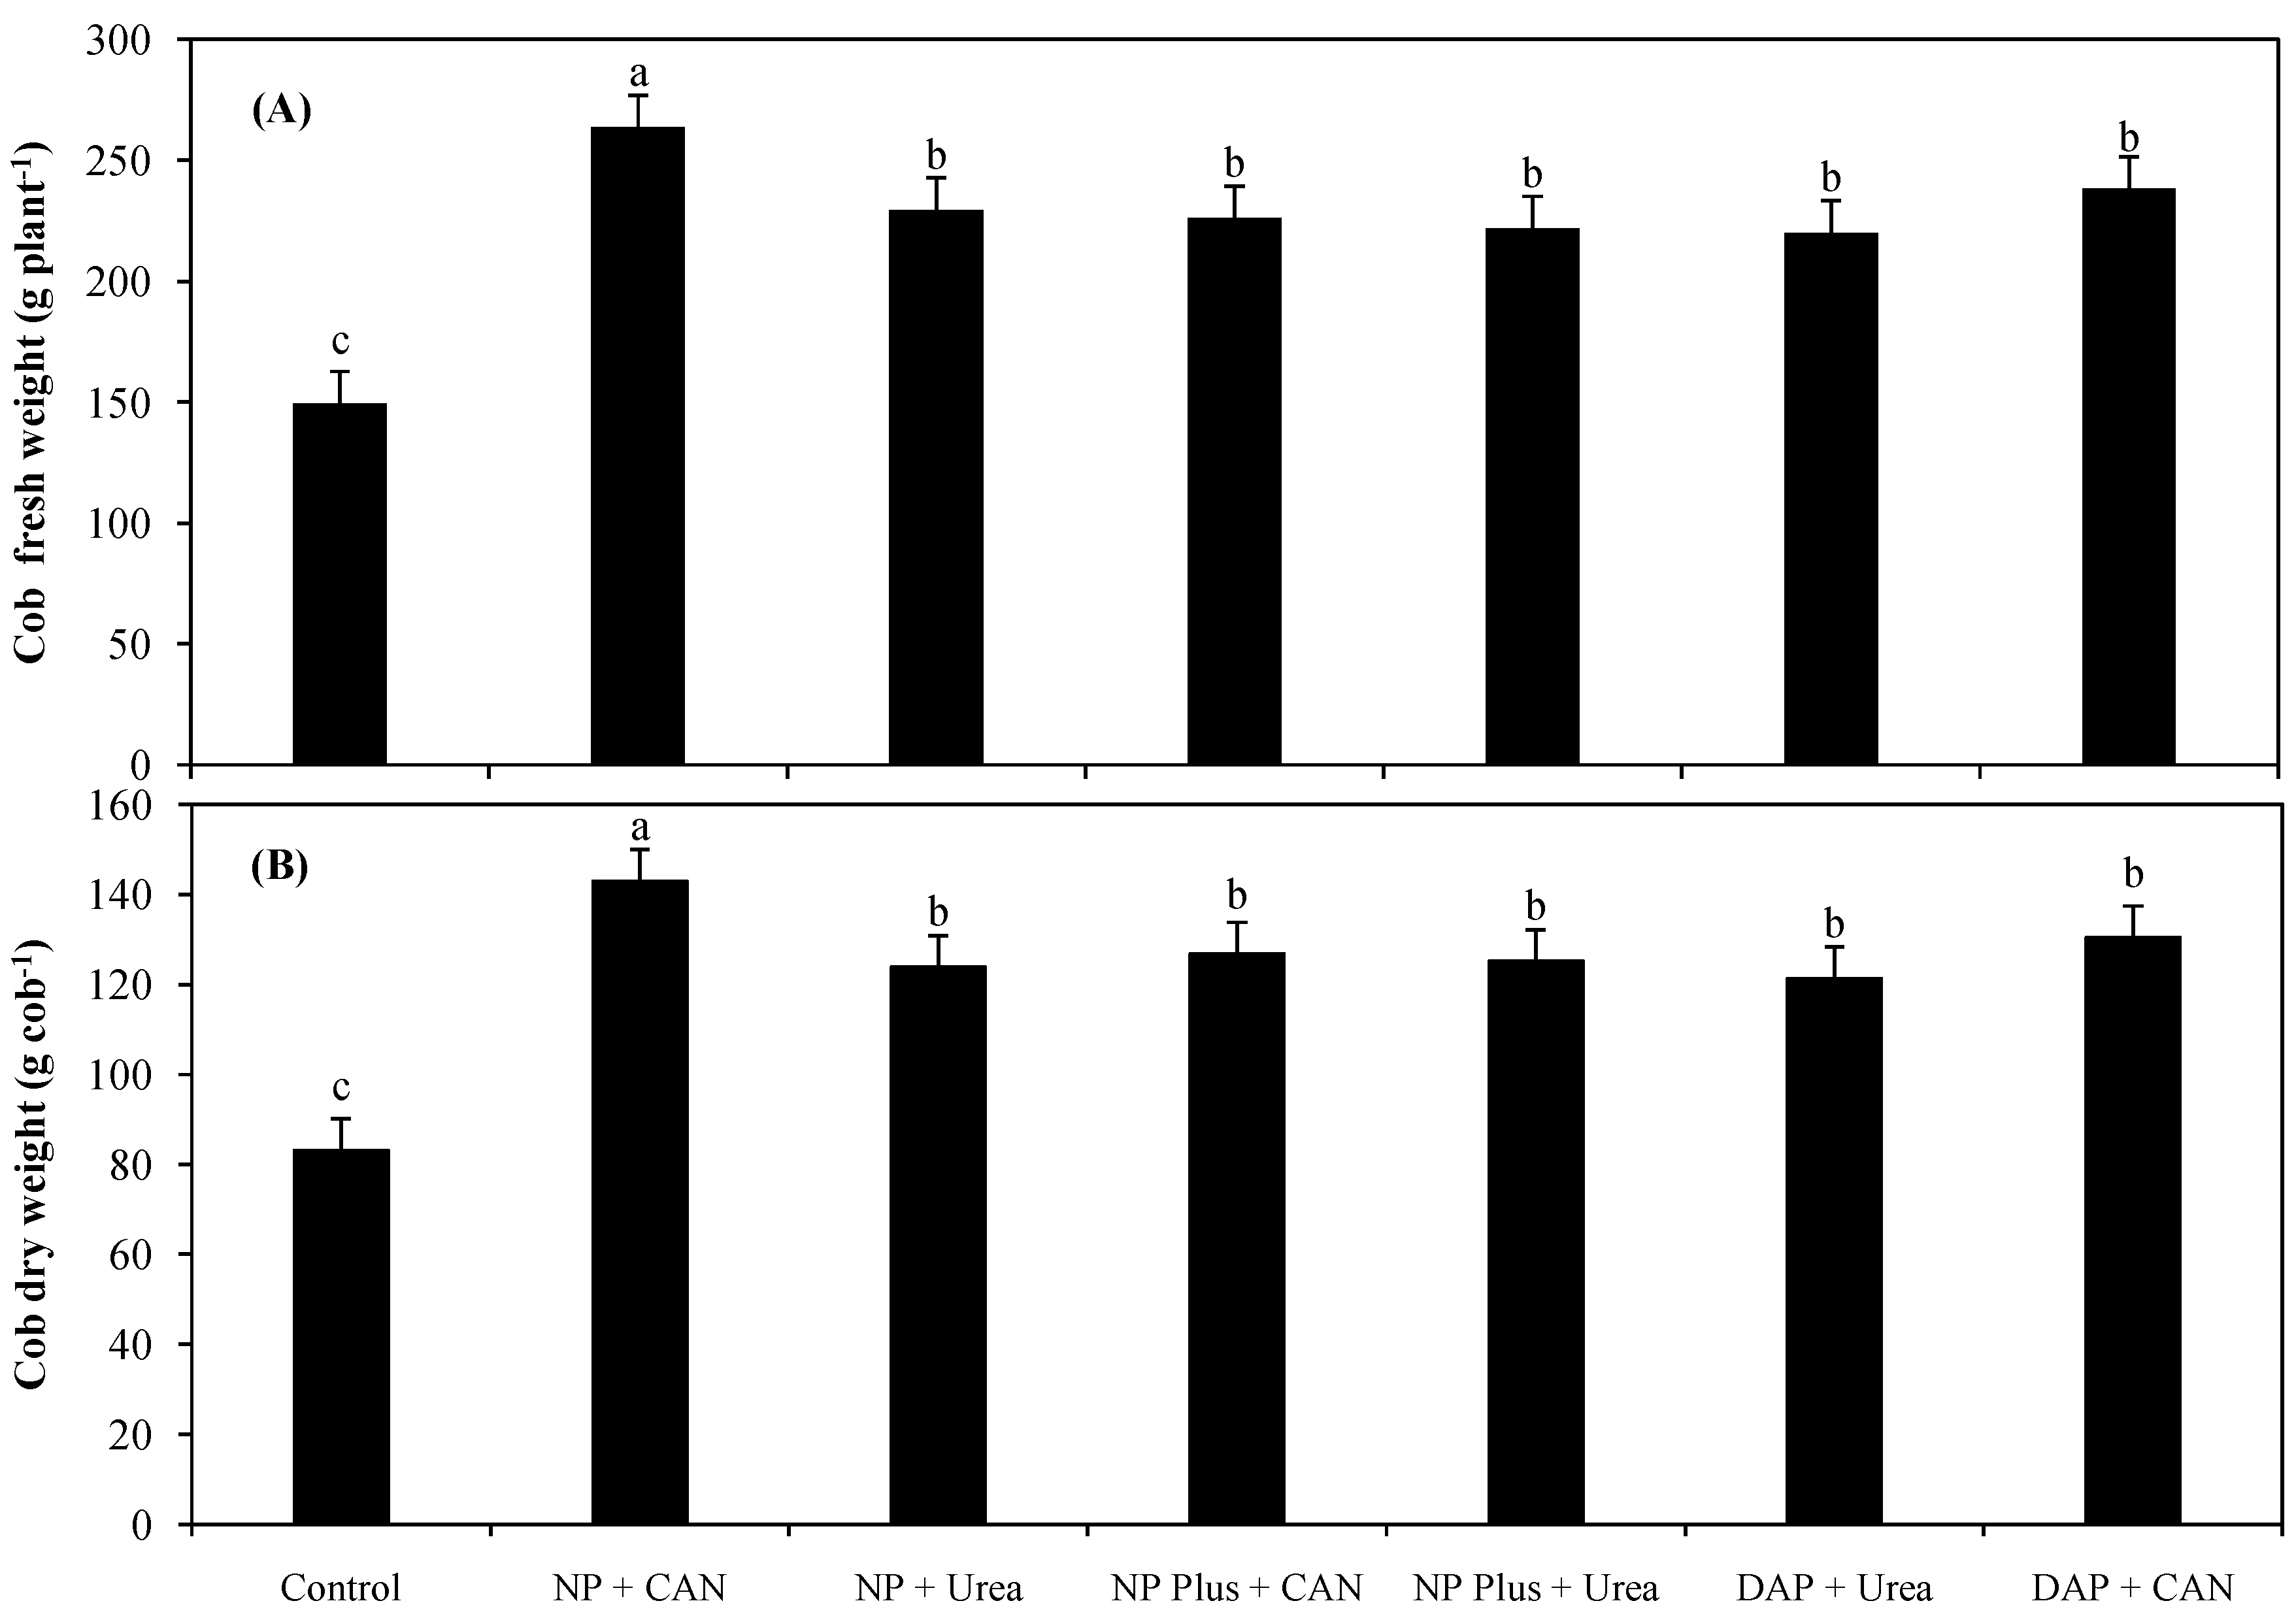
3.1. Plant Growth as Influenced by Inorganic Nitrogen Supplies

Plant growth attributes like shoot fresh and dry weights, plant height, cob fresh and dry weights, no. of grain rows cob−1, and cob length improved by all kinds of fertilizer combinations when compared with the control (Figure 1 and Figure 2). The application of NP + CAN increased the plant height by 21% as compared to the control. When comparing the various combinations of fertilizers, NP + CAN increased the plant height by 4% as compared to DAP + urea. By contrast, the combination of CAN and DAP remained insignificant for plant height when compared with the DAP + urea. Similarly, a maximum no. of grain rows cob−1 was found in NP + CAN as compared to all the other fertilizer supplies and the control. When compared with the conventional fertilizer supplies, no. of grain rows cob−1 was found significant in NP + CAN treatment. Furthermore, cob length was found significant in all the fertilizer applications when compared with the control.
Cob fresh (g plant−1) was found to be substantial in all fertilizer combinations when compared with the control. In comparison to the control, NP + urea, NP Plus + CAN, NP Plus + urea, DAP + urea, and DAP + CAN, treatments like NP + CAN increased cob fresh weight by 55%, 14%, 16%, 17%, 18%, and 10%, respectively (Figure 2A). A maximum cob dry weight (g cob−1) was observed in NP + CAN treatment, whereas all the other fertilizer combinations remained insignificant (Figure 2B). The increase in cob dry weight under NP + CAN application was comparable with conventional fertilization, i.e., DAP + urea.

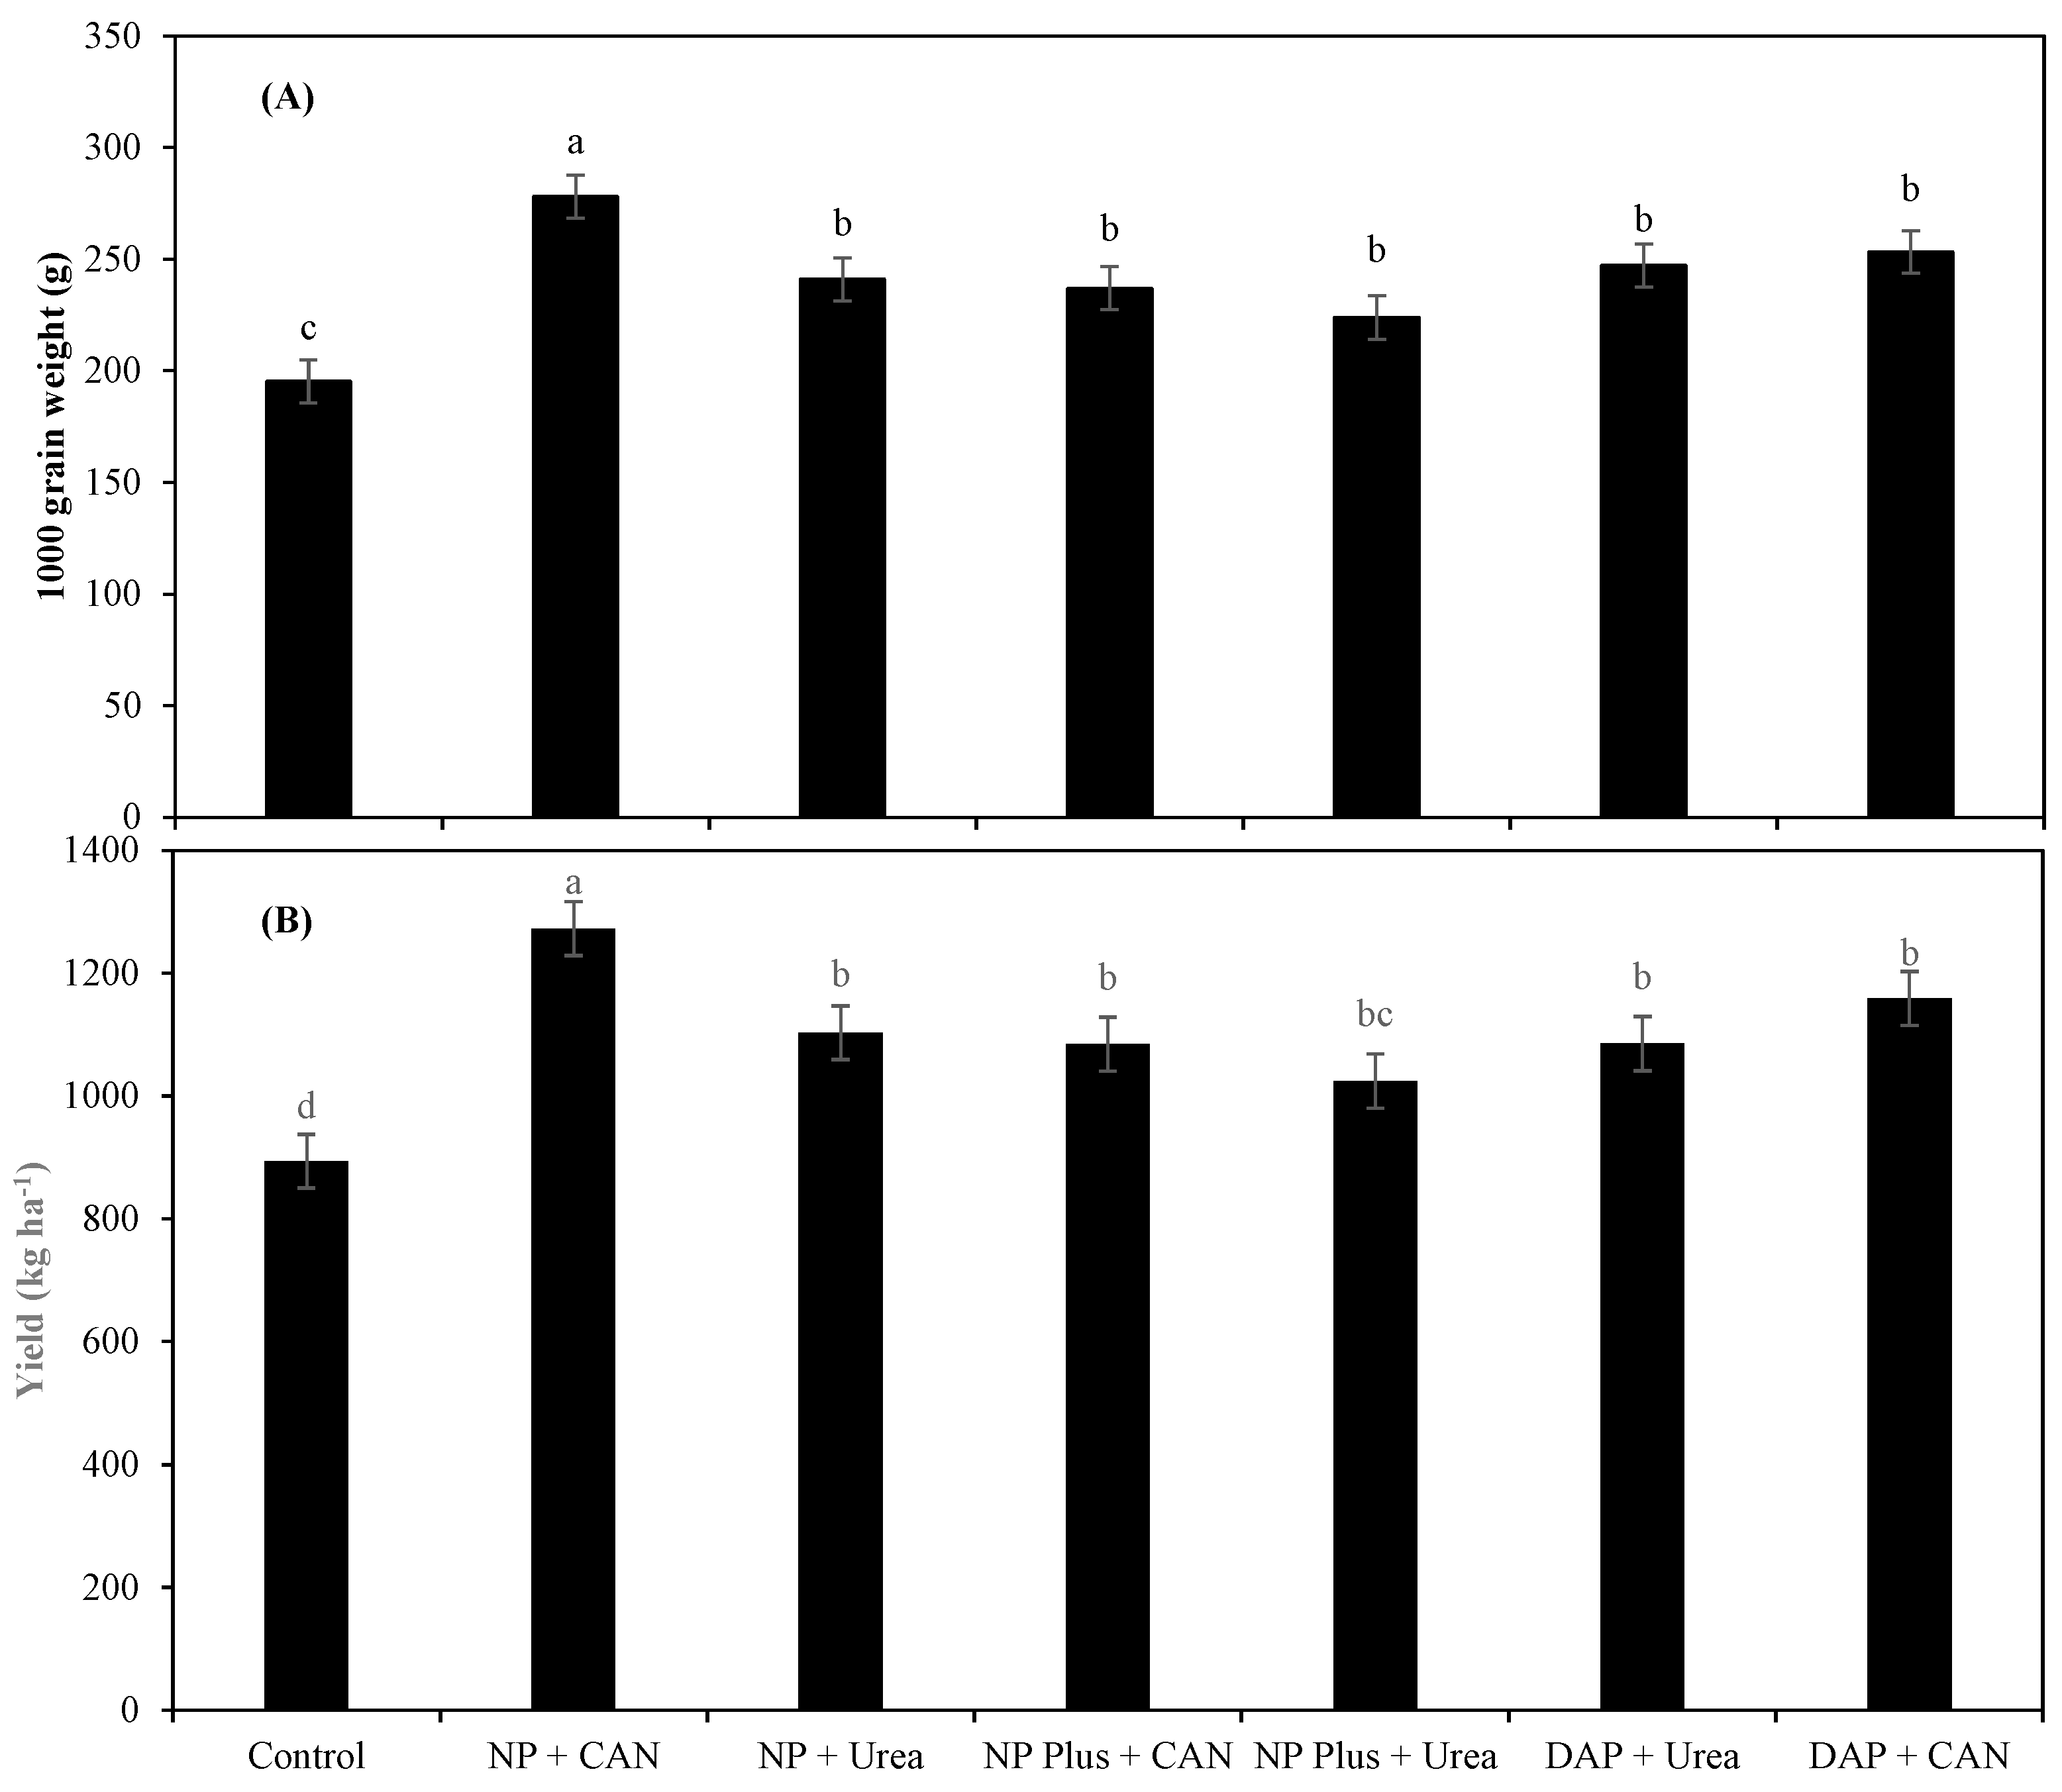
3.2. Maize Grain Yield as Influenced by Inorganic Nitrogen Supplies
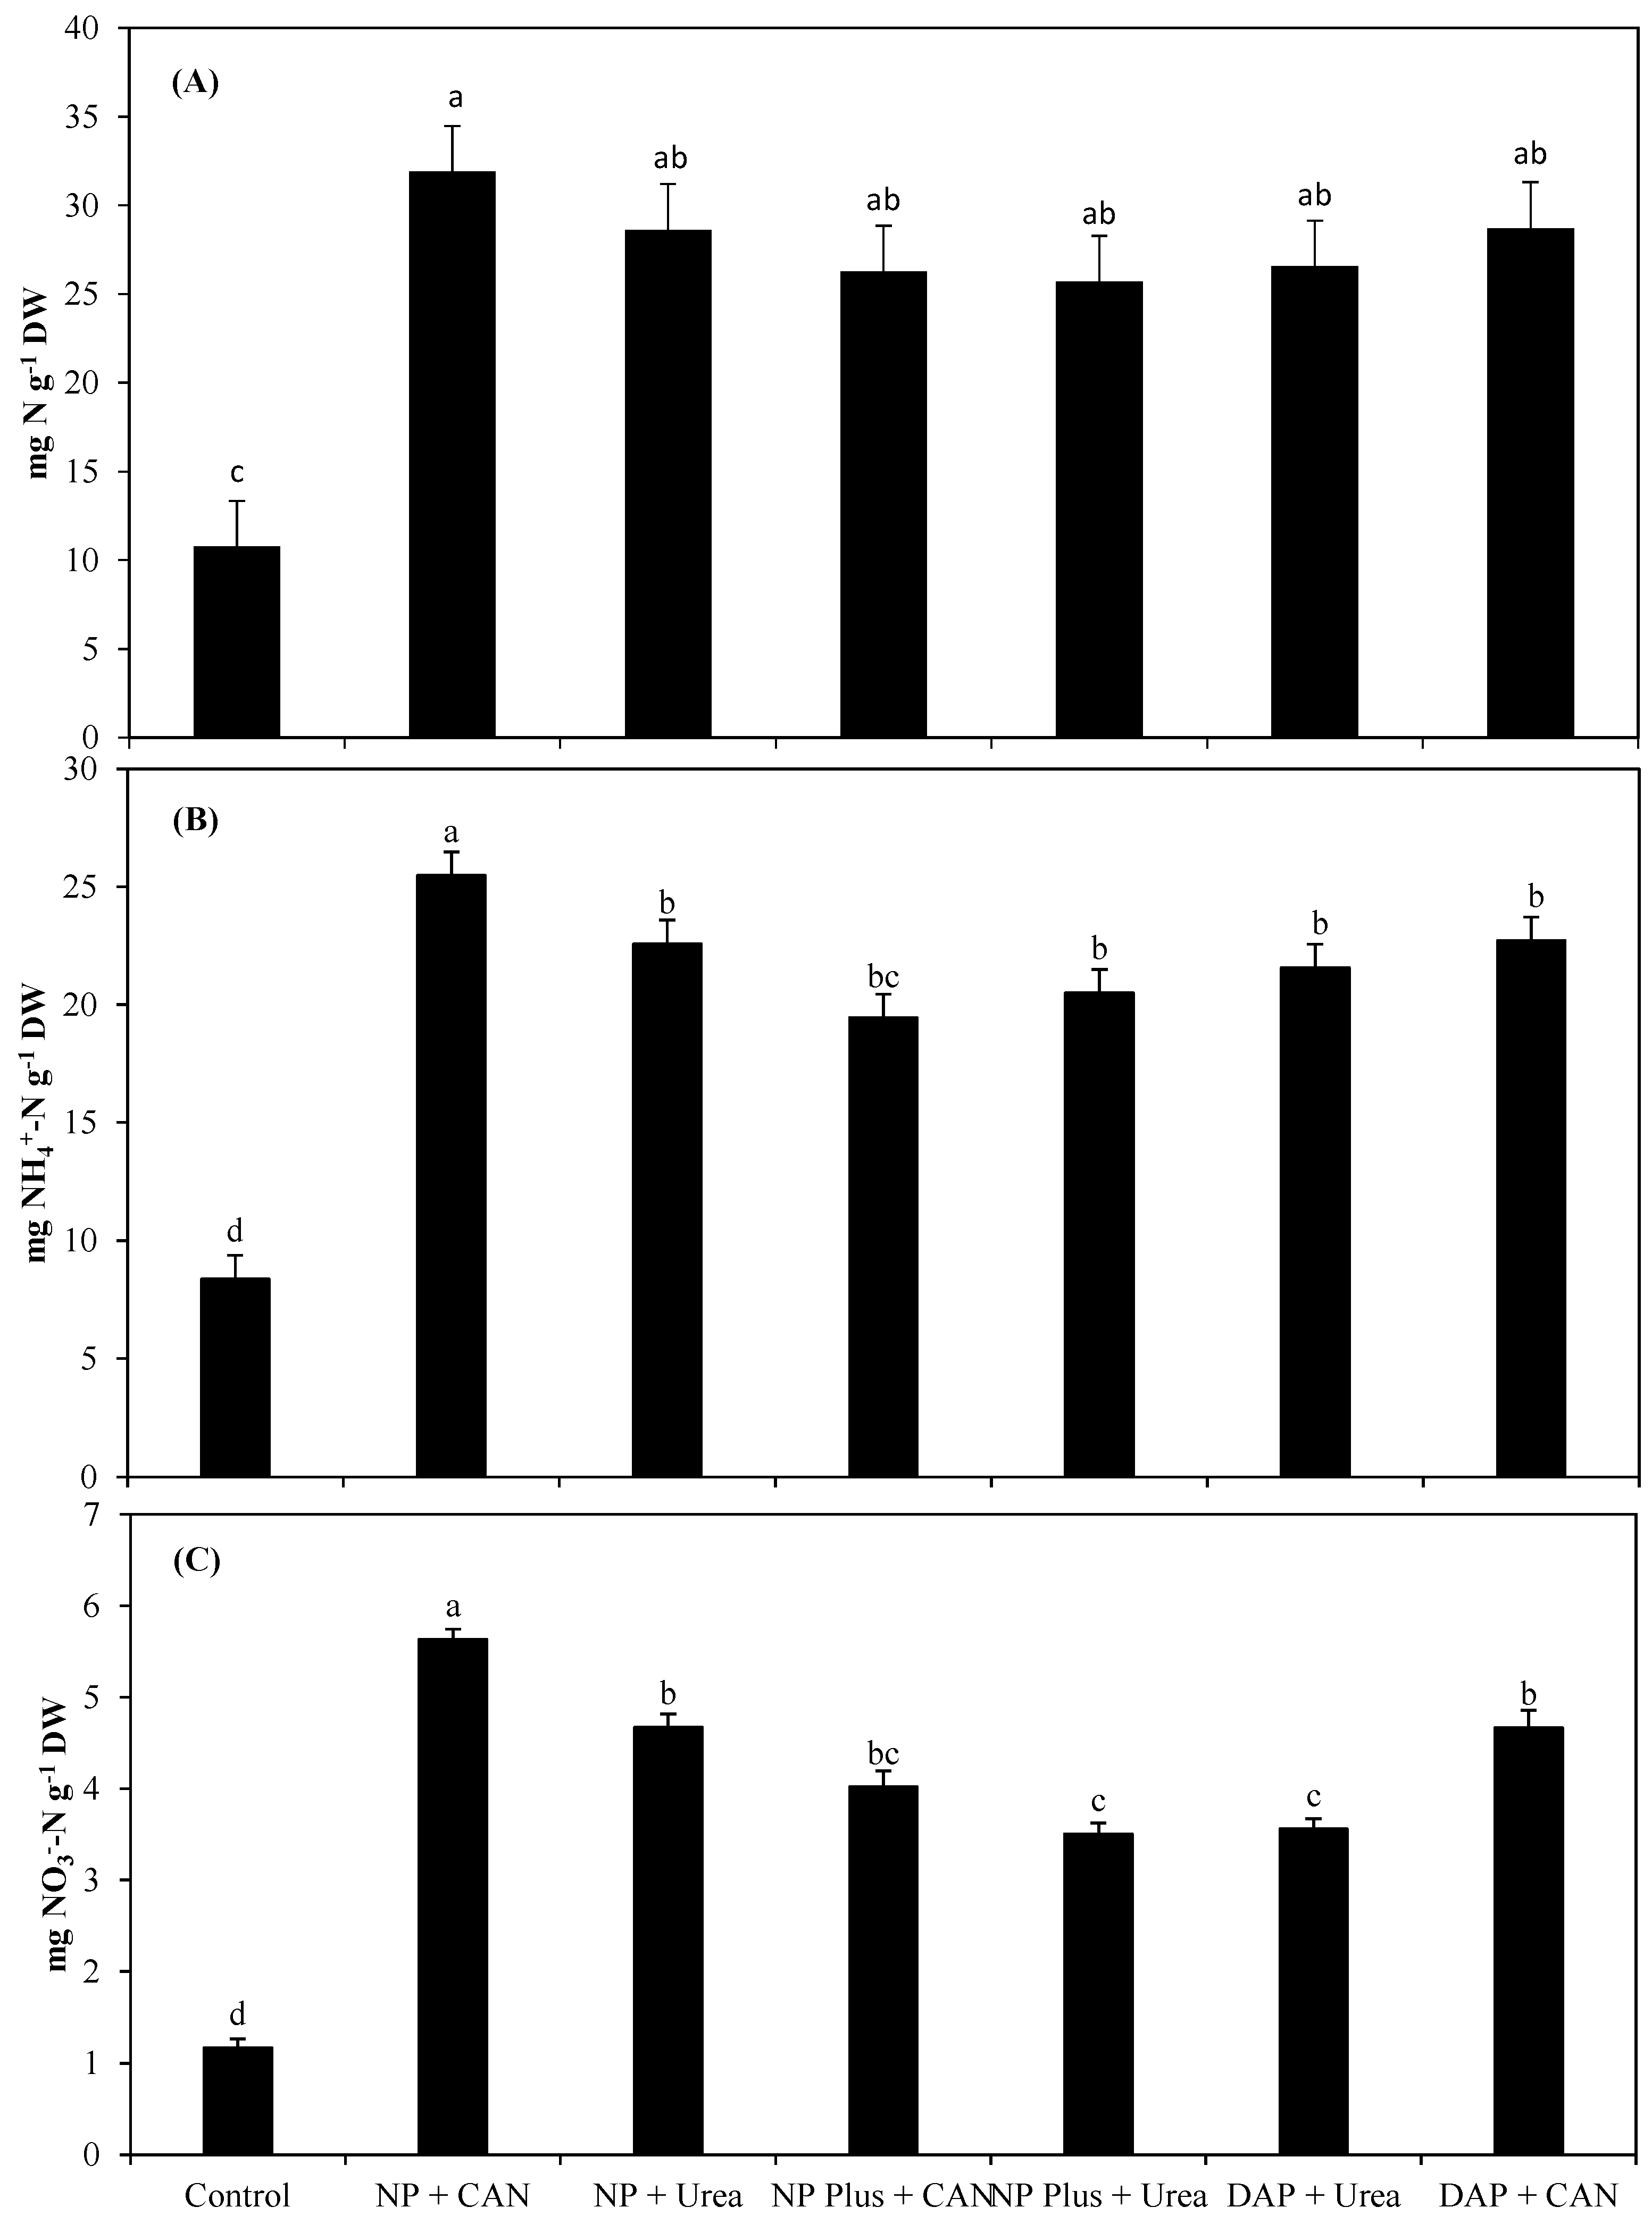
A significant (p ≤ 0.05) effect of inorganic N supplies was observed on 1000-grain weight (g) and maize grain yield (kg acre−1) when compared with the control (Figure 3A,B). Among the different fertilizer combinations, NP + CAN application resulted in a maximum grain yield. Overall, these results suggested that the application of the right sources of fertilizers, i.e., NP + CAN, improved the 1000-grain weight and maize grain yield (Figure 3).

3.3. Total N, NH4+-N, and NO3-N Concentrations (mg g−1 Dry Weight) and NRE of Maize as Influenced by Inorganic Nitrogen Supplies

Under different inorganic N sources, maize leaves’ total N, NH4+-N, and NO3-N concentrations and NRE were considerably higher than they were under the control (Figure 4A–C and Figure 5). Compared to the control, NP + urea, NP Plus + CAN, NP Plus + urea, DAP + urea, and DAP + CAN, the combined application of NP and CAN increased the leaf N by 66%, 10%, 18%, 19%, 17%, and 10%, respectively (Figure 4A). Similarly, NP and CAN supply enhanced the concentration of NH4+-N by 17% when compared with the control (Figure 4B). Furthermore, when compared with the NP Plus + CAN, NP Plus + urea, DAP + urea, and DAP + CAN, NP + CAN enhanced the NH4+-N content in maize leaves by 12%, 27%, 22%, 17%, and 11%, respectively (Figure 4A). In comparison to NP Plus + CAN, NP Plus + urea, DAP + urea, and DAP + CAN, combined application of NP and CAN raised the NO3-N concentration in maize leaves by 19%, 33%, 47%, 45%, and 19%, respectively (Figure 4C).
The NRE of maize crop was influenced by different combinations of chemical fertilizers (Figure 5). Combined use of NP and CAN improved the NRE of maize by 28%, 13%, 15%, 19%, 15%, and 9% as compared to all other treatments, respectively.

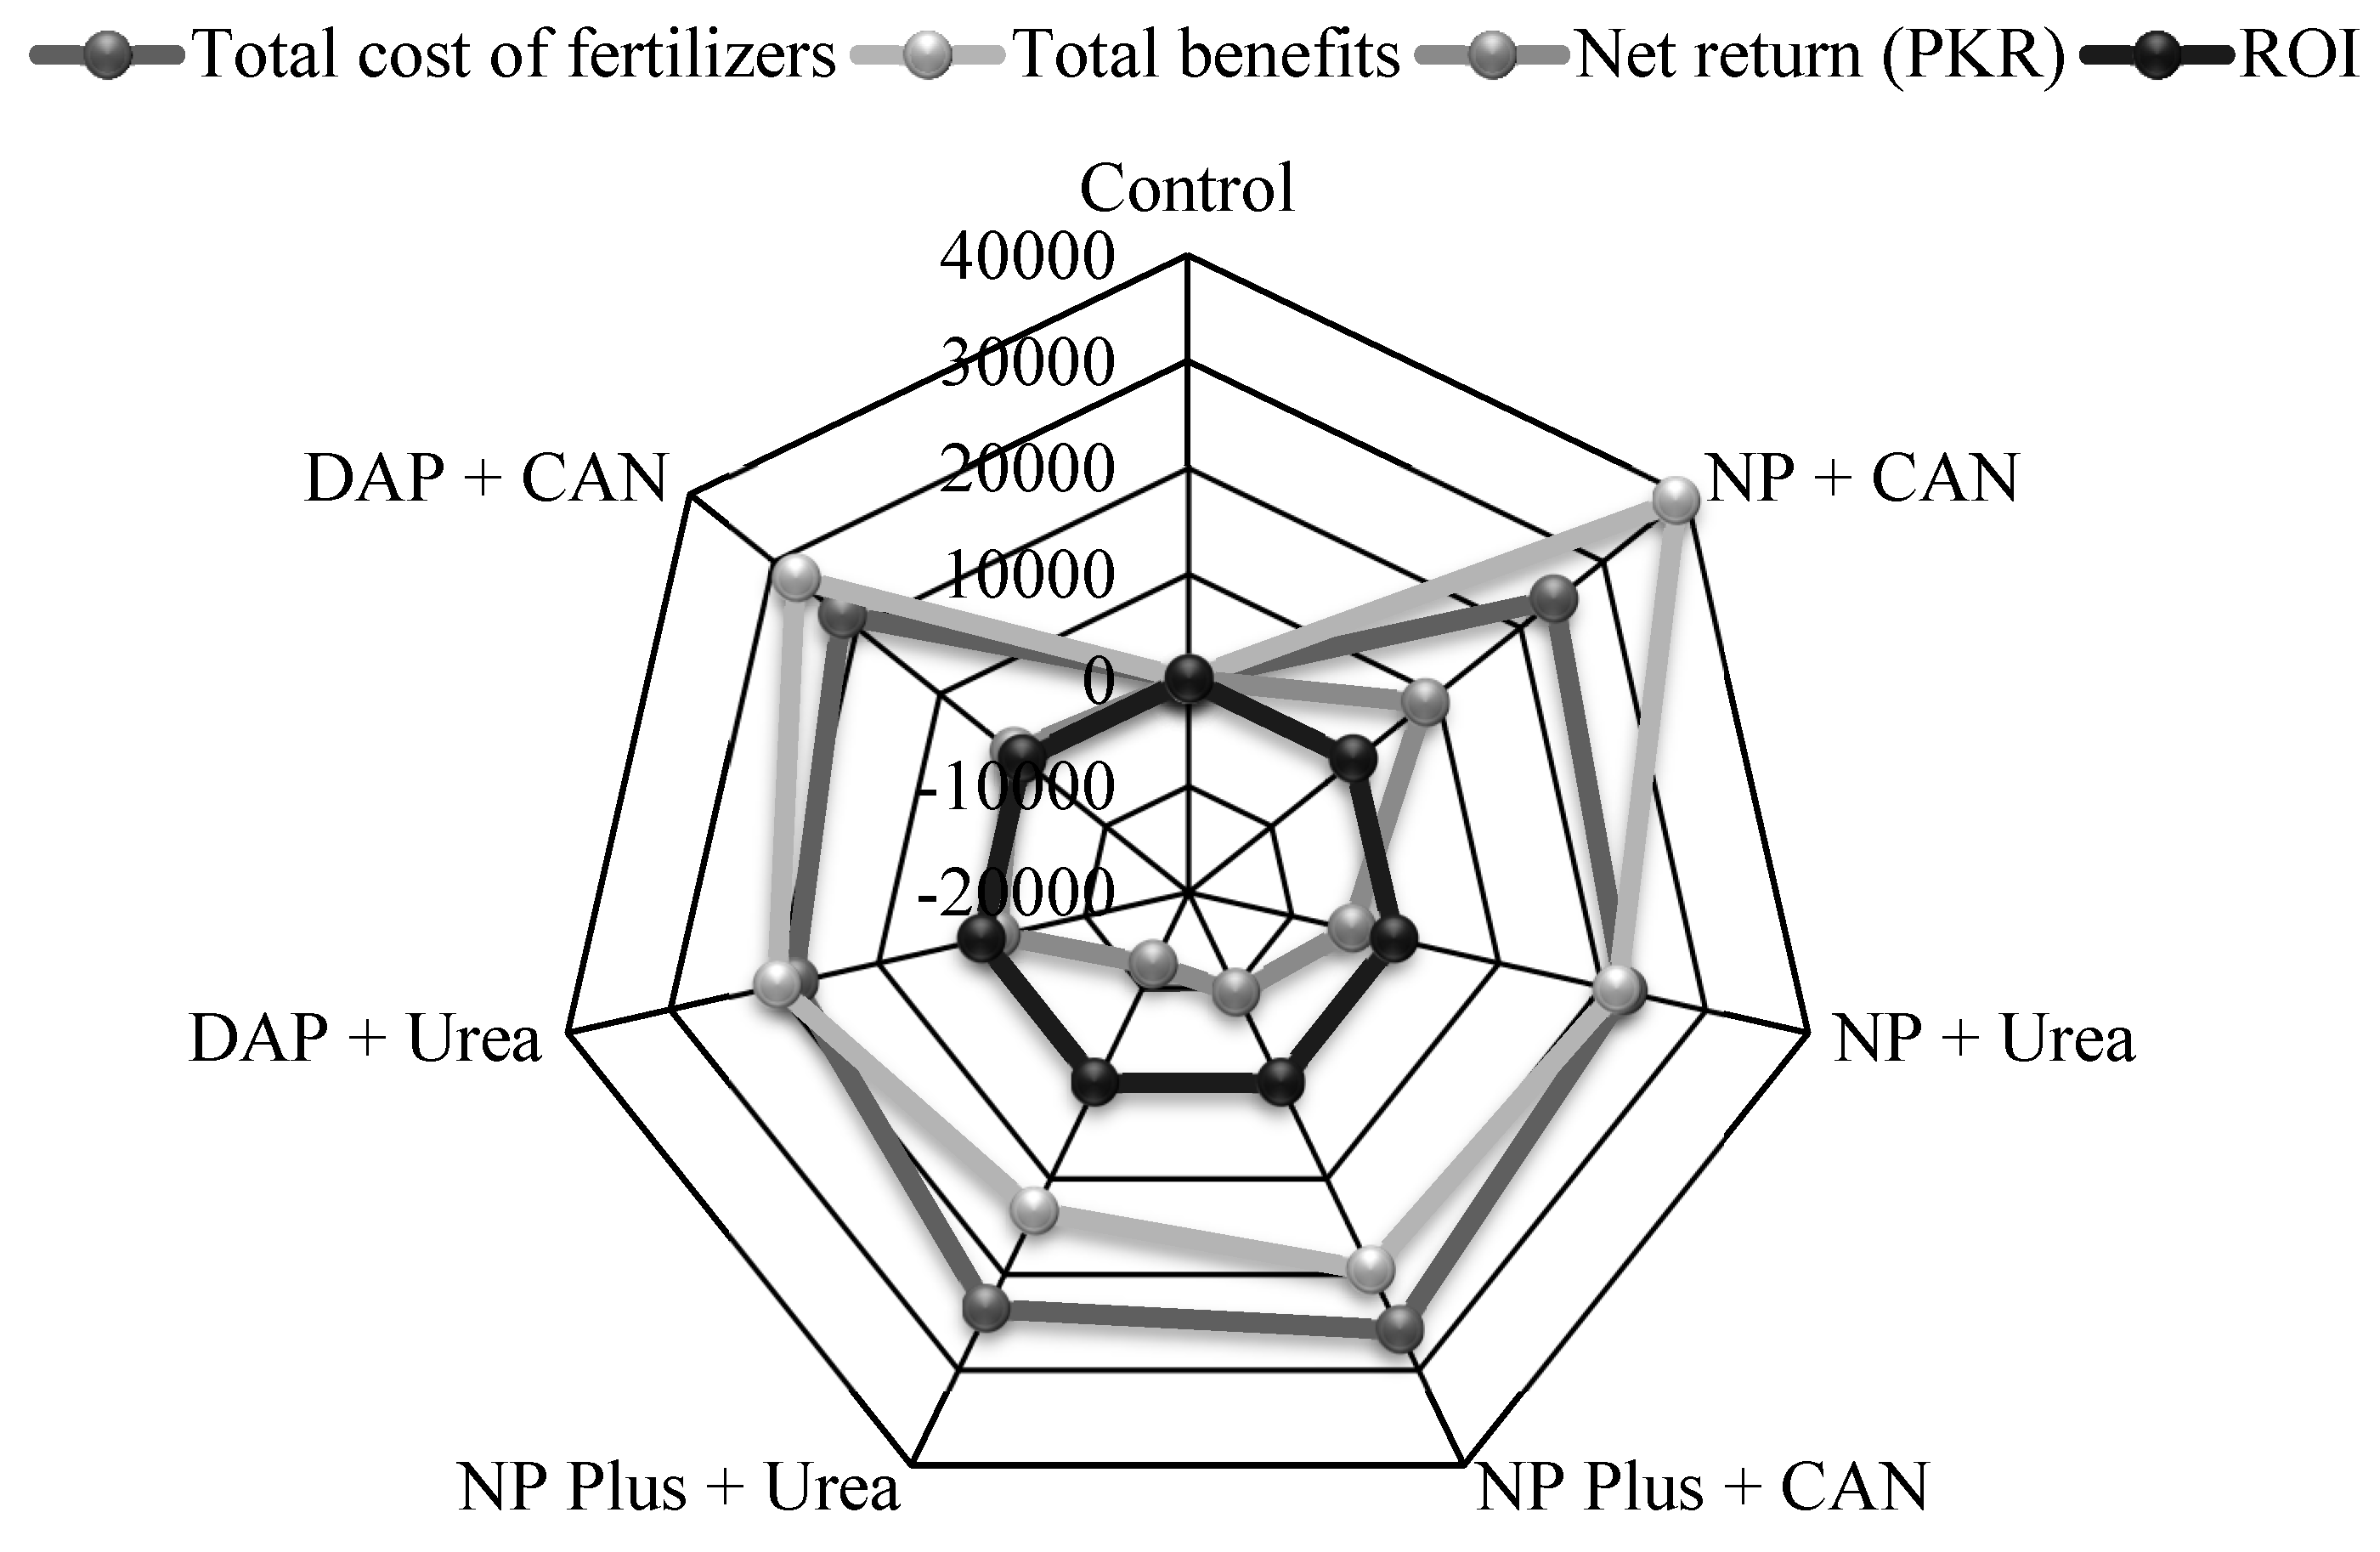
3.4. Economic Analysis of Various Inorganic Fertilizers Supplies

Economic analyses in terms of the net return and ROI of hybrid maize under the influence of inorganic nitrogen and phosphorus supplies were assessed (Figure 6). Both net return and ROI were significant under all kinds of fertilizer supplies when compared with the control. These indicators were quantified on the basis of maize grain yield and cost of fertilizers. Maximum benefits were obtained in NP + CAN treatment, which were followed by NP + urea, DAP + urea, and DAP + CAN. Interestingly, ROI remained similar in all kinds of fertilizers combinations. This indicates that the additional cost of NP + CAN resulted in higher benefits in terms of maize yield.

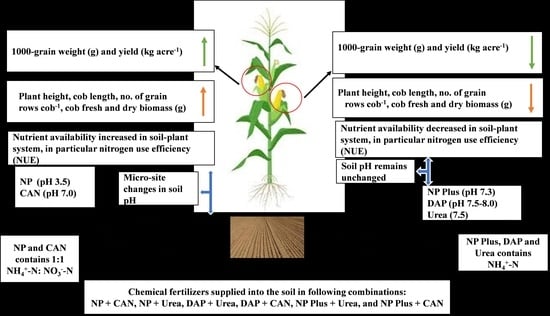
3.5. Effect of Balance Application of NH4+-N and NO3-N on Soil Physicochemical Properties and Mineral Nutrient Concentrations

In the present study, NP fertilizer (pH 3.5) and CAN (pH 7.0) contained balanced proportions of NH4+-N and NO3-N (Table S1). These balanced proportions in NP + CAN influenced the soil pH to some extent as compared to the control and all other fertilizer sources (Table 2). The change in the micro-environment of soil under the influence of NP + CAN influenced the physicochemical properties of the soil and nutrient availability, particularly mineral N and the other two inorganic N-forms. In comparison to all other fertilizer combinations, NH4+-N in the soils was much greater in the NP + CAN combination.

4. Discussion

4.1. The Improvement in Plant Growth and Grain Yield Was Attributed to Increased NH4+-N/NO3-N Uptake as Well as NRE of Maize

The aboveground biomass has a direct relationship with the availability of N [44]. The present study showed that the application of NP and CAN increased aboveground plant parts or growth attributes like plant height, cob fresh and dry weights, cob length, and no. of grain rows cob−1 as compared to the conventional source of fertilization (urea and DAP). Furthermore, both NP and CAN fertilizers contain equivalent amounts of NH4+-N and NO3-N, satiating plant needs through fast-acting NO3-N and slow-release NH4+-N (Table 2 and Table 3).
Nitrogen’s primary role is to promote vegetative development, particularly plant height. This increase in maize plant height under varied N sources was attained by the increased N uptake that contributed to the plant development and increase in shoot and internode lengths and numbers, and thereby improved the growth and maize production [45,46]. According to Gasim [47], the increases in shoot length and no. of internodes are responsible for the increase in the number of leaves, which are the direct indicators of increased plant biomass. According to Asibi et al. [48], the growth of leaves under N application increased photosynthesis and the efficiency of biological processes including water and nutrient uptake. In the current study, co-application of both N-forms, viz., NP and CAN fertilizers, increased maize grain production in addition to enhancing plant development. Numerous studies [49,50] demonstrated that the co-provision of NH4+-N and NO3-N increases plant nutrient availability that results in enhanced plant growth and development. Similar to plant growth, 1000-grain weight and maize yield were higher under CAN and NP application as compared to all the other treatments. An adequate supply of N is associated with aboveground biomass, which is a direct indicator of high maize yield [51,52]. Accordingly, the study of Eid et al. [53] reported that AN-based fertilizer improved the potato yield as compared to the urea. In the present study, CAN application improved the yield and its components (1000-grain weight) as compared to the urea and DAP or other combinations, which are correlated with high dry biomass production [32]. However, the response of yield and its components may vary under the acidic to alkaline strength of fertilizers.
Fertilizers with a pH of 3.5 and CAN of 7.0 may influence soil pH at the micro-environmental level and boost the availability of nutrients to plants. Because optimal soil pH varies from 6.5 to 7.5, the availability of N and P in Pakistani soils is an important constraint due to the high pH of the soils (8.0). Under such conditions, fertilizers having a neutral to alkaline pH may further reduce the nutrient availability to the plants after making insoluble complexes with Ca and Mg onto the soil surface [54]. Soil physicochemical research revealed that the application of CAN and NP fertilizers influenced soil pH more than other treatments, increasing nutrient availability in the soil and plant system. Furthermore, increasing nutrient availability from NP and CAN application promoted NH4+ absorption in plants and maize growth and production.

4.2. Fertilizers Containing Balanced Proportions of NH4+-N and NO3-N Increase Soil N Mobility and thus NRE of Maize

In the current investigation, soil NO3-N concentrations were greater in the NP + CAN treatment than in the NH4+-N treatment. The application of nitrate-based fertilizers, as well as the oxidation of NH4+ to NO3 under existing soil conditions, caused an increase in soil NO3-N concentration. In addition, NO3-N enters into the soil solution and becomes available to the plants after being repelled from negative sites of soil particles. It is evident from the literature that AN-based fertilizers resulted in an increase in the recovery of N to 95% as compared to the urea [55]. Further, N utilization has been reported higher in sugarcane under AN-based fertilizers (60%) as compared with the urea (45%) [18]. NH4+ is oxidized to NO3 in warm, humid environments, which lowers the pH of the soil and makes NH4+ accessible to plants [56]. In general, mass flow and diffusion are the major methods used to deliver NO3-N to the roots of plants. As a result, more NO3-N will likely need to be present in the soil solution to support plant development [57,58]. Additionally, absorbed NO3-N plays a crucial part in the process of filling grains and serves as a reservoir for N remobilization in situations of N deficit [59]. By contrast, NO3-N absorption also occurs, which activates the reduction of NO3 to NH4+ under the action of nitrate and nitrite reductase enzymes. The reduction of NO3 to NH4+ is favored in NH4+ assimilation [60]. Consequently, plant growth and development are optimal when the plant receives N in both forms (NH4+ and NO3) because of the sustaining of the constructive ionic balance inside the plant system [61,62]. Thus, fertilizers containing balanced proportions of NH4+ and NO3 in the form of CAN and NP increase the N accumulation and NRE of plants (Table 2; Figure 5).

4.3. Net Return and Socioeconomic Impact of NP and CAN Fertilization

Pakistan, being a developing country, requires assistance in addressing food security challenges. In this sense, chemical fertilizers are required for improving the country’s agricultural crop yield. Excessive use of chemical fertilizers, on the other hand, not only reduces plant growth and productivity but also degrades soil health. As a result, it is critical to reduce the usage of extra fertilizers and other energy inputs by using the following strategies: the right source, right rate, and right timing [63]. In addition, economic analysis of the inputs is required to compare the effectiveness of different fertilizers in terms of net return. In the present study, the highest net return of the maize in NP + CAN is indicative of the right sources of fertilization. Moreover, both NP and CAN application did not affect ROI, which indicates that the end user earned a profit by using Sarsabz NP and CAN than all the other fertilizer sources. It has been suggested that farmers need to apply NP and CAN fertilizers in their soils instead of conventional fertilization.
To reveal the socioeconomic impact of NP and CAN fertilization on maize crop, Government of Punjab, Pakistan arranged a maize yield competition in 2018 where the autumn maize growers of the year of 2018 won the yield competition. Application of NP and CAN resulted in the highest maize yield in comparison to DAP and urea, and even the runners-up were NP and CAN users (Table 4 and Table S2). Similarly, the technical team of the Fatima Group also conducted research trials to evaluate the effectiveness of NP and CAN on maize yield in different districts of Punjab, Pakistan and a considerable no. of framers are now using NP and CAN sources of fertilization instead of DAP and urea as the increased net return has created awareness among the people during the years of 2018–2020. These results also strengthen the idea of the right proportion of NH4+/NO3 in the form of CAN and NP fertilizer sources for increased maize yield.

5. Conclusions and Recommendations

Our findings indicate that the fertilizers containing equal amounts of NH4+-N and NO3-N (1:1) increased soil inorganic N forms, notably NO3-N, which was absorbed by the plants as NH4+-N and improved maize grain production. It has been proposed that fertilizers containing balanced amounts of NH4+-N and NO3-N (1:1) can be utilized instead of conventional fertilizer sources. The enhanced N uptake by maize further resulted in positive interactions with other nutrients like P and K. This study will provide a scientific basis to handle the high-pH soils in the future by following the 4R stewardship (right source, right rate, right time, and right place). It will also improve soil health, minimize environmental issues, and ultimately enhance yield. This study also recommends Government and other stakeholders to provide awareness on better nutrient management of agricultural crops.

Supplementary Materials

The following supporting information can be downloaded at https://www.mdpi.com/article/10.3390/su151612547/s1, Table S1: Chemical reaction and nutrient content (%) of chemical fertilizers applied into the soils; Table S2: Highest maize grain yield obtained during [1] and 2020–2021 by the use of NP and CAN fertilizers. Reference [64] is cited in Supplementary Materials file.

Author Contributions

S.M., N.K., M.J. and R.N. designed the experiment, whereas S.M., M.J. and R.N. performed the experiment. M.S. and S.M. compiled the data and carried out lab analyses. S.M., M.H.S., M.A. and M.T. made a statistical evaluation of the data and interpretation, whereas S.M., M.S. and S.H. wrote the original draft. S.M., S.J., N.K. and K.S.K. critically improved the intellectual content of the manuscript. All authors have read and agreed to the published version of the manuscript.

Funding

This research was funded by Researchers Supporting Project number (RSP2023R347), King Saud University, Riyadh, Saudi Arabia.

Institutional Review Board Statement

Not applicable.

Informed Consent Statement

Not applicable.

Data Availability Statement

The data are available with a reasonable request to the corresponding author.

Acknowledgments

The authors would like to extend their sincere appreciation to the Researchers Supporting Project number (RSP2023R347), King Saud University, Riyadh, Saudi Arabia and Technical Services Department, Marketing Division, Fatima Fertilizer Company Limited for supporting this work. The authors also pay thanks to Shahid Iqbal for his help in data collection and lab analyses.

Conflicts of Interest

There are no conflict of interest among the authors.

References

  1. Cameron, K.C.; Di, H.J.; Moir, J.L. Nitrogen losses from the soil/plant system: A review. Ann. Appl. Biol. 2013, 162, 145–173. [Google Scholar] [CrossRef]
  2. Miller, A.J.; Cramer, M.D. Root Nitrogen Acquisition and Assimilation. Plant Soil 2004, 274, 1–36. [Google Scholar] [CrossRef]
  3. Kotur, Z.; Siddiqi, Y.M.; Glass, A.D.M. Characterization of nitrite uptake in Arabidopsis thaliana: Evidence for a nitrite-specific transporter. New Phytol. 2013, 200, 201–210. [Google Scholar] [CrossRef] [PubMed]
  4. Tegeder, M.; Rentsch, D. Uptake and Partitioning of Amino Acids and Peptides. Mol. Plant 2010, 3, 997–1011. [Google Scholar] [CrossRef]
  5. Forde, B.G.; Lea, P.J. Glutamate in plants: Metabolism, regulation, and signaling. J. Exp. Bot. 2007, 58, 2339–2358. [Google Scholar] [CrossRef]
  6. Raven, J.A. Can plants rely on nitrate? Trends Plant Sci. 2003, 8, 314–315. [Google Scholar] [CrossRef]
  7. Wang, Y.-Y.; Hsu, P.-K.; Tsay, Y.-F. Uptake, allocation and signaling of nitrate. Trends Plant Sci. 2012, 17, 458–467. [Google Scholar] [CrossRef] [PubMed]
  8. Cui, J.; Yu, C.; Qiao, N.; Xu, X.; Tian, Y.; Ouyang, H. Plant preference for NH4+ versus NO3 At different growth stages in an alpine agroecosystem. Field Crops Res. 2017, 201, 192–199. [Google Scholar] [CrossRef]
  9. Neina, D. The Role of Soil pH in Plant Nutrition and Soil Remediation. Appl. Environ. Soil Sci. 2019, 2019, 5794869. [Google Scholar] [CrossRef]
  10. White, R.E. Principles and Practice of Soil Science: The Soil as a Natural Resource; Blackwell Publishing: Oxford, UK, 2006. [Google Scholar]
  11. Šimek, M.; Jíšová, L.; Hopkins, D.W. What is the so-called optimum pH for denitrification in soil? Soil Biol. Biochem. 2002, 34, 1227–1234. [Google Scholar] [CrossRef]
  12. Ali, A.; Noorka, I.R. Nitrogen and phosphorus management strategy for better growth and yield of sunflower (Helianthus annus L.). Soil Environ. 2013, 32, 44–48. [Google Scholar]
  13. Freney, J.R.; Simpson, J.R.; Denmead, O.T. Volatilization of Ammonia. In Gaseous Loss of Nitrogen from Plant-Soil Systems; Plant and Soil Science; Freney, J.R., Simpson, J.R., Eds.; Springer: Dordrecht, The Netherlands, 1983; Volume 9, pp. 1–32. [Google Scholar]
  14. Jordan, C. The effect of fertiliser type and application rate on denitrification losses from cut grassland in Northern Ireland. Fertil. Res. 1989, 19, 45–55. [Google Scholar] [CrossRef]
  15. Wasti, S.E. Economic Survey of Pakistan; Finance and Economic Affairs Division, Ministry of Finance, Govt. of Pakistan: Islamabad, Pakistan, 2013.
  16. Yara Fertilizer Handbook; Nitrate Fertilizers; Yara International ASA: Oslo, Norway, 2018; pp. 37–43.
  17. Masood, S.; Zhao, X.Q.; Shen, R.F. Bacillus pumilus promotes the growth and nitrogen uptake of tomato plants under nitrogen fertilization. Sci. Hortic. 2020, 272, 109581. [Google Scholar] [CrossRef]
  18. da Silva, N.F.; da Silva, E.C.; Muraoka, T.; Teixeira, M.B.; Soares, F.A.L.; Cunha, F.N.; Adu-Gyamfi, J.; Cavalcante, W.S.d.S. Nitrogen Utilization from Ammonium Nitrate and Urea Fertilizer by Irrigated Sugarcane in Brazilian Cerrado Oxisol. Agriculture 2020, 10, 323. [Google Scholar] [CrossRef]
  19. Sutton, M.A.; Howard, C.M.; Bleeker, A.; Datta, A. The global nutrient challenge: From science to public engagement. Environ. Dev. 2013, 6, 80–85. [Google Scholar] [CrossRef]
  20. Ghafoor, I.; Habib-Ur-Rahman, M.; Ali, M.; Afzal, M.; Ahmed, W.; Gaiser, T.; Ghaffar, A. Slow-release nitrogen fertilizers enhance growth, yield, NUE in wheat crop and reduce nitrogen losses under an arid environment. Environ. Sci. Pollut. Res. 2021, 28, 43528–43543. [Google Scholar] [CrossRef] [PubMed]
  21. Evans, R.D.; Bloom, A.J.; Sukrapanna, S.S.; Ehleringer, J.R. Nitrogen isotope composition of tomato (Lycopersicon esculentum Mill. cv. T-5) grown under ammonium or nitrate nutrition. Plant Cell Environ. 1996, 19, 1317–1323. [Google Scholar] [CrossRef]
  22. Pritchard, E.S.; Guy, R.D. Nitrogen isotope discrimination in white spruce fed with low concentrations of ammonium and nitrate. Trees 2005, 19, 89–98. [Google Scholar] [CrossRef]
  23. Britto, D.T.; Kronzucker, H.J. Ecological significance and complexity of N-source preference in plants. Ann. Bot. 2013, 112, 957–963. [Google Scholar] [CrossRef] [PubMed]
  24. Ho, C.-H.; Tsay, Y.-F. Nitrate, ammonium, and potassium sensing and signaling. Curr. Opin. Plant Biol. 2010, 13, 604–610. [Google Scholar] [CrossRef]
  25. Williams, K.; Percival, F.; Merino, J.; Mooney, H.A. Estimation of Tissue Construction Cost from Heat of Combustion and Organic Nitrogen Content. Plant Cell Environ. 1987, 10, 725–734. [Google Scholar] [CrossRef]
  26. Hachiya, T.; Sakakibara, H. Interactions between nitrate and ammonium in their uptake, allocation, assimilation, and signaling in plants. J. Exp. Bot. 2017, 68, 2501–2512. [Google Scholar] [CrossRef]
  27. Domínguez-Valdivia, M.D.; Aparicio-Tejo, P.M.; Lamsfus, C.; Cruz, C.; Martins-Loução, M.A.; Moran, J.F. Nitrogen nutrition and antioxidant metabolism in ammonium-tolerant and -sensitive plants. Physiol. Plant. 2008, 132, 359–369. [Google Scholar] [CrossRef] [PubMed]
  28. Szczerba, M.W.; Britto, D.T.; Balkos, K.D.; Kronzucker, H.J. Alleviation of rapid, futile ammonium cycling at the plasma membrane by potassium reveals K+-sensitive and -insensitive components of NH4+ transport. J. Exp. Bot. 2008, 59, 303–313. [Google Scholar] [CrossRef]
  29. Errebhi, M.; Wilcox, G.E. Plant species response to ammonium-nitrate concentration ratios. J. Plant Nutr. 1990, 13, 1017–1029. [Google Scholar] [CrossRef]
  30. Poothong, S.; Reed, B.M. Optimizing shoot culture media for Rubus germplasm: The effects of NH4+, NO3, and total nitrogen. Vitr. Cell. Dev. Biol. Plant 2016, 52, 265–275. [Google Scholar] [CrossRef]
  31. Gul, H.; Rahman, S.; Shahzad, A.; Gul, S.; Qian, M.; Xiao, Q.; Liu, Z. Maize (Zea mays L.) Productivity in Response to Nitrogen Management in Pakistan. Am. J. Plant Sci. 2021, 12, 1173–1179. [Google Scholar] [CrossRef]
  32. Amanullah; Iqbal, A.; Ali, A.; Fahad, S.; Parmar, B. Nitrogen Source and Rate Management Improve Maize Productivity of Smallholders under Semiarid Climates. Front. Plant Sci. 2016, 7, 1773. [Google Scholar] [CrossRef]
  33. Blandino, M.; Battisti, M.; Vanara, F.; Reyneri, A. The synergistic effect of nitrogen and phosphorus starter fertilization sub-surface banded at sowing on the early vigor, grain yield and quality of maize. Eur. J. Agron. 2022, 137, 126509. [Google Scholar] [CrossRef]
  34. Davies, B.; Coulter, J.A.; Pagliari, P.H. Timing and rate of nitrogen fertilization influence maize yield and nitrogen use efficiency. PLoS ONE 2020, 15, e0233674. [Google Scholar] [CrossRef]
  35. Gheith, E.M.S.; El-Badry, O.Z.; Lamlom, S.F.; Ali, H.M.; Siddiqui, M.H.; Ghareeb, R.Y.; El-Sheikh, M.H.; Jebril, J.; Abdelsalam, N.R.; Kandil, E.E. Maize (Zea mays L.) Productivity and Nitrogen Use Efficiency in Response to Nitrogen Application Levels and Time. Front. Plant Sci. 2022, 13, 941343. [Google Scholar] [CrossRef] [PubMed]
  36. Yuen, S.H.; Pollard, A.G. Determination of nitrogen in soil and plant materials: Use of boric acid in the micro-kjeldahl method. J. Sci. Food Agric. 1953, 4, 490–496. [Google Scholar] [CrossRef]
  37. Soltanpour, P.; Workman, S. Modification of the NH4 HCO3-DTPA soil test to omit carbon black. Commun. Soil Sci. Plant Anal. 1979, 10, 1411–1420. [Google Scholar] [CrossRef]
  38. AOAC. Official Methods of Analysis 21st Edition. 2019; Association of Official Analytical Chemists, AOAC Inc.: Arlington, VA, USA, 1995; p. 12. [Google Scholar]
  39. Jackson, M.L. Soil Chemical Analysis; Prentice-Hall Inc.: Englewood Cliffs, NJ, USA, 1958; p. 498. [Google Scholar]
  40. Lüder, R.-M.H.; Qin, R.; Richner, W.; Stamp, P.; Streit, B.; Herrera, J.M.; Noulas, C. Small-Scale Variation in Nitrogen Use Efficiency Parameters in Winter Wheat as Affected by N Fertilization and Tillage Intensity. Sustainability 2020, 12, 3621. [Google Scholar] [CrossRef]
  41. Olsen, S.R.; Cole, C.V.; Watanabe, F.S.; Dean, L.A. Estimation of Available Phosphorus in Soils by Extraction with Sodium Bicarbonate; Circular of US Department of Agriculture: Washington, DC, USA, 1954.
  42. Richards, L.A. Diagnosis and Improvement of Saline and Alkali Soils; USDA Agric. Handbook 60; US Government Printing Office: Washington, DC, USA, 1954.
  43. Mohammed, Y.A.; Gesch, R.W.; Johnson, J.M.F.; Wagner, S.W. Agronomic and Economic Evaluations of N Fertilization in Maize under Recent Market Dynamics. Nitrogen 2022, 3, 514–527. [Google Scholar] [CrossRef]
  44. Peng, Y.; Niu, J.; Peng, Z.; Zhang, F.; Li, C. Shoot growth potential drives N uptake in maize plants and correlates with root growth in the soil. Field Crops Res. 2010, 115, 85–93. [Google Scholar] [CrossRef]
  45. Amin, M.E.-M.H. Effect of different nitrogen sources on growth, yield and quality of fodder maize (Zea mays L.). J. Saudi Soc. Agric. Sci. 2011, 10, 17–23. [Google Scholar] [CrossRef]
  46. Leila, H.; Soleymani, A. Effect of different amounts of nitrogen fertilizer on grain yield of forage corn cultivars in Isfahan. Int. J. Adv. Biol. Biomed. Res. 2014, 2, 608–614. [Google Scholar]
  47. Gasim, S.H. Effect of nitrogen, phosphorus and seed rate on growth, yield and quality of forage maize (Zea mays L.). Master’s Thesis, Faculty of Agriculture, University of Khartoum, Khartoum, Sudan, 2001. [Google Scholar]
  48. Asibi, A.E.; Chai, Q.; Coulter, J.A. Mechanisms of Nitrogen Use in Maize. Agronomy 2019, 9, 775. [Google Scholar] [CrossRef]
  49. Zhu, C.Q.; Zhang, J.H.; Zhu, L.F.; Abliz, B.; Zhong, C.; Bai, Z.G.; Hu, W.J.; Sajid, H.; James, A.B.; Cao, X.C.; et al. NH 4 + facilitates iron reutilization in the cell walls of rice (Oryza sativa) roots under iron-deficiency conditions. Environ. Exp. Bot. 2018, 151, 21–31. [Google Scholar] [CrossRef]
  50. Zhu, C.Q.; Zhu, X.F.; Hu, A.Y.; Wang, C.; Wang, B.; Dong, X.Y.; Shen, R.F. Differential effects of nitrogen forms on cell wall phosphorus remobilization in rice (Oryza sativa) are mediated by nitric oxide, pectin content and the expression of the phosphate transporter OsPT2. Plant Physiol. 2016, 171, 1407–1417. [Google Scholar] [CrossRef]
  51. Ciampitti, I.A.; Vyn, T.J. A comprehensive study of plant density consequences on nitrogen uptake dynamics of maize plants from vegetative to reproductive stages. Field Crops Res. 2011, 121, 2–18. [Google Scholar] [CrossRef]
  52. Ciampitti, I.A.; Vyn, T.J. Physiological perspectives of changes over time in maize yield dependency on nitrogen uptake and associated nitrogen efficiencies: A review. Field Crops Res. 2012, 133, 48–67. [Google Scholar] [CrossRef]
  53. Eid, M.A.M.; Abdel-Salam, A.A.; Salem, H.M.; Mahrous, S.E.; Seleiman, M.F.; Alsadon, A.A.; Solieman, T.H.I.; Ibrahim, A.A. Interaction Effects of Nitrogen Source and Irrigation Regime on Tuber Quality, Yield, and Water Use Efficiency of Solanum tuberosum L. Plants 2020, 9, 110. [Google Scholar] [CrossRef]
  54. Jensen, T.L. Soil pH and the Availability of Plant Nutrients. IPNI: International Plant Nutrition Institute. No. 2. 2010. Available online: www.ipni.net/pnt (accessed on 21 June 2023).
  55. Watson, C.J. The comparative effects of ammonium nitrate, urea or a combined ammonium nitrate/urea granular fertilizer on the efficiency of nitrogen recovery by perennial ryegrass. Fertil. Res. 1987, 11, 69–78. [Google Scholar] [CrossRef]
  56. Trenkel, M.E. Slow and Controlled-Release and Stabilized Fertilizers: An Option for Enhancing Nutrient Use Efficiency in Agriculture; International Fertilizer Association: Paris, France, 2010; Available online: www.fertilizer.org (accessed on 21 June 2023).
  57. Naku, M.; Kambizi, L.; Matimati, I. Functional roles of ammonium (NH4+) and nitrate (NO3) in regulation of day- and night-time transpiration in Phaseolus vulgaris. Funct. Plant Biol. 2019, 46, 806. [Google Scholar] [CrossRef] [PubMed]
  58. Plett, D.C.; Ranathunge, K.; Melino, V.J.; Kuya, N.; Uga, Y.; Kronzucker, H.J. The intersection of nitrogen nutrition and water use in plants: New paths toward improved crop productivity. J. Exp. Bot. 2020, 71, 4452–4468. [Google Scholar] [CrossRef] [PubMed]
  59. Kaur, A.; Bedi, S. Nitrogen use Efficiency and Source-sink Relations in Maize. J. Plant Sci. Res. 2012, 28, 219–228. [Google Scholar]
  60. Kelly, J.T.; Bacon, R.K.; Wells, B.R. Genetic variability in nitrogen utilization at four growth stages in soft red winter wheat. J. Plant Nutr. 1995, 18, 969–982. [Google Scholar] [CrossRef]
  61. Richardson, A.E.; Barea, J.-M.; McNeill, A.M.; Prigent-Combaret, C. Acquisition of phosphorus and nitrogen in the rhizosphere and plant growth promotion by microorganisms. Plant Soil 2009, 321, 305–339. [Google Scholar] [CrossRef]
  62. Robinson, N.; Brackin, R.; Vinall, K.; Soper, F.; Holst, J.; Gamage, H.; Paungfoo-Lonhienne, C.; Rennenberg, H.; Lakshmanan, P.; Schmidt, S. Nitrate Paradigm Does Not Hold Up for Sugarcane. PLoS ONE 2011, 6, e19045. [Google Scholar] [CrossRef] [PubMed]
  63. Maqsood, M.A.; Awan, U.K.; Aziz, T.; Arshad, H.; Ashraf, N.; Ali, M. Nitrogen Management in Calcareous Soils: Problems and Solutions. Pak. J. Agric. Sci. 2016, 53, 79–95. [Google Scholar] [CrossRef]
  64. Maize Yield Competition; Government of the Punjab Commissioner’s Office Sahiwal: Punjab, Pakistan, 2018.
Figure 1. Plant growth attributes like plant height (A), no. of rows cob−1 (B), and cob length (C) as influenced by N sources. All values are average of three years of experimental data ± S.E. of three replicates, whereas lower-case letters indicate significance among the treatments at p ≤ 0.05 level.
Sustainability 15 12547 g001
Figure 2. Cob fresh weigh (A) and cob dry weight (B) as influenced by N sources. All values are average of three years of experimental data ± S.E of three replicates, whereas lower-case letters indicate significance among the treatments at p ≤ 0.05 level.
Sustainability 15 12547 g002
Figure 3. The 1000-grain weight (A) and maize grain yield (B) as influenced by N sources. All values are average of three years of experimental data ± S.E of three replicates, whereas lower-case letters indicate significance among the treatments at p ≤ 0.05 level.
Sustainability 15 12547 g003
Figure 4. Total N (A), NH4+-N (B), and NO3-N (C) concentrations (mg g−1 dry weight) in maize leaves as influenced by N sources. All values are average of three years of experimental data ± S.E of three replicates, whereas lower-case letters indicate significance among the treatments at p ≤ 0.05 level.
Sustainability 15 12547 g004
Figure 5. NRE (kg kg−1 dry weight) of maize as influenced by N sources. All values are average of three years of experimental data ± S.E of three replicates, whereas lower-case letters indicate significance among the treatments at p ≤ 0.05 level.
Sustainability 15 12547 g005
Figure 6. Quantitative analysis of different N sources with respect to additional cost of fertilizers, total benefits, net return, and ROI. All values are means of three replicates, whereas cost of fertilizer like SOP was subtracted from each treatment. Subsequently, net return of each treatment was calculated after obtaining the difference in control treatment.
Sustainability 15 12547 g006
Table 1. Pre-soil analysis of samples collected from two different depths before sowing maize. All values are means ± S.E. of three replicates.
Depth (cm)Soil TexturepHEC
(mS cm−1)
meqNa 100 g−1 Dry Soilmeq Ca + Mg100 g−1 Dry SoilSARSOM
(%)
Total Soil N (mg kg−1 Dry Soil)mg NH4+ -N kg−1 Dry Soilmg NO3-N kg−1 Dry SoilAvailable P (mg kg−1 Dry Soil)Extracatable K (mg kg−1 Dry Soil)
0–15Loam8.18 ± 0.110.44 ± 0.039.19 ± 0.22344 ± 11.210.77 ± 0.030.75 ± 0.03573 ± 23.3695 ± 4.17197 ± 8.815.53 ± 0.16107 ± 4.80
15–30Loam8.44 ± 0.030.47 ± 0.0311.13 ± 0.36356 ± 12.340.83 ± 0.040.53 ± 0.03491 ± 21.7778 ± 3.56230 ± 10.635.15 ± 0.12100 ± 4.03
Table 2. Physicochemical properties of soils and mineral nutrient concentrations as influenced by N sources (post-harvest soil analysis). All values are average of three years of experimental data ± S.E of three replicates, whereas lower-case letters indicate significance among the treatments at p ≤ 0.05 level. ns: not significant.
TreatmentspHEC (dSm−1)Sodium Adsorption RatioSOM (%)Total Soil N (mg kg−1 Dry Soil)mg NH4+-N kg−1 Dry Soilmg NO3-N kg−1 Dry SoilAvailable P (mg kg−1 Dry Soil)Extractable K (mg kg−1 Dry Soil
Control8.38 ± 0.11 ns0.42 ± 0.06 ab0.6 ± 0.02 ns0.57 ± 0.05 b410.91 ± 17.22 c150.93 ± 7.08 d354.18 ± 10.29 d4.19 ± 0.18 b88.54 ± 3.29 ab
NP + CAN8.27 ± 0.10 ns0.51 ± 0.09 a0.7 ± 0.03 ns0.82 ± 0.05 a505.33 ± 18.17 a240.93 ± 6.50 a513.72 ± 14.78 a13.07 ± 0.28 a99.38 ± 5.03 a
NP + Urea8.26 ± 0.08 ns0.46 ± 0.07 a0.7 ± 0.08 ns0.87 ± 0.06 a420.76 ± 14.48 c206.77 ± 7.36 b471.04 ± 11.85 ab10.38 ± 0.37 b100.92 ± 4.85 a
NP plus + CAN8.28 ± 0.03 ns0.40 ± 0.02 ab0.7 ± 0.01 ns0.65 ± 0.05 b393.02 ± 12.76 cd176.19 ± 5.02 c430.12 ± 16.03 c10.50 ± 0.43 b102.47 ± 4.88 a
NP plus + Urea8.23 ± 0.10 ns0.50 ± 0.09 a0.7 ± 0.01 ns0.81 ± 0.03 a407.77 ± 14.17 c183.56 ± 4.98 c450.35 ± 17.11 bc11.43 ± 0.42 ab100.92 ± 3.31 a
DAP + Urea8.30 ± 0.06 ns0.55 ± 0.02 a0.6 ± 0.01 ns0.82 ± 0.07 a416.80 ± 7.37 c190.45 ± 4.38 c452.23 ± 14.36 bc10.38 ± 0.14 b94.73 ± 3.80 ab
DAP + CAN8.26 ± 0.06 ns0.40 ± 0.04 ab0.6 ± 0.01 ns0.80 ± 0.07 a446.39 ± 14.69 b209.54 ± 6.56 b477.79 ± 13.19 ab11.37 ± 0.54 ab90.09 ± 2.29 ab
Table 3. Pearson’s correlation coefficients for interpretation of maize grain yield under the influence of fertilization. All the bold values represent significance among the attributes at p ≤ 0.01 (**) and 0.05 (*) levels, respectively. ns: not significant.
Plant HeightCob LengthNo. of Rows Cob-1Cob FWCob DW1000-Grain wt.Grain YieldLeaf KLeaf PTotal Leaf NLeaf NH4NLeaf NO3NNUESoil pHSoil ECSARSOMSoil PSoil KTotal Soil NSoil NO3NSoil NH4N
Plant height1***********************nsnsns**nsns******
Cob length0.6831ns********************nsnsns*nsns******
No. of rows Cob−10.5140.471********************nsnsnsnsnsnsns****
Cob FW0.7450.8460.6381*******************nsns**ns******
Cob DW0.6750.8520.6160.9011****************nsnsns*nsns******
1000-grain wt.0.760.8730.610.8280.8181**************nsnsns*nsns******
Grain yield0.8650.7540.8060.9110.8780.8431************nsnsns*nsns******
Leaf K0.6340.7320.5630.7980.8370.6760.7041***********nsns**nsns*****
Leaf P0.7510.7860.6370.8810.9010.8650.8340.8781********nsnsns**nsns******
Total leaf N0.6970.8050.6050.9060.9280.8630.7720.9050.9781*******nsns****ns******
Leaf NH4N0.7540.8030.60.8930.920.8370.8180.9270.9750.9971*****nsns**nsns******
Leaf NO3N0.7980.7620.590.8980.90.8480.7960.7620.9260.9510.9221***nsns**nsns******
NUE0.7540.8260.5990.8660.8520.9920.8910.6680.8610.8630.8410.8951nsnsnsns**ns******
Soil pH−0.423−0.287−0.483−0.524−0.39−0.369−0.41−0.466−0.423−0.46−0.455−0.447−0.421nsnsnsnsnsnsnsns
Soil EC0.1670.1360.2040.1850.1520.1940.2030.220.2290.2290.2410.1680.141−0.171nsnsnsnsnsnsns
SAR0.0650.2120.0590.1880.2590.050.0440.2810.2090.2260.2420.1490.0660.0980.0681nsns**nsnsns
SOM0.8020.4910.4170.5380.4730.4620.5230.6010.5630.6020.6040.5590.415−0.460.3370.241nsns****
Soil P0.0890.3940.2010.4540.3330.310.3310.1510.2490.8470.2640.3210.7110.0050.3490.210.1381ns****
Soil K0.0450.0850.3580.2290.2920.0860.0920.2850.270.2820.2910.2290.133−0.160.2670.610.0930.1401nsnsns
Total soil N0.6970.7180.3630.750.6960.8210.8680.5050.6770.6970.6760.7360.821−0.250.2930.120.510.7340.0331****
Soil NO3N0.7110.7640.6070.8510.8570.8490.7980.7630.8830.8960.890.8650.857−0.280.3310.210.5180.5220.1830.8131**
Soil NH4N0.7750.7270.640.820.7650.8760.8070.6290.8350.8320.8060.8810.901−0.40.340.080.5730.4560.2580.8390.8651
Table 4. Approved data by Punjab Agriculture Department, Government of Punjab, Pakistan where combined application of NP and CAN resulted in highest yield in comparison to conventional fertilizers sources. Different farmers at different locations of Sahiwal Division also won maize yield competition by Government of Punjab, Pakistan.
Sr. #FarmerAddress with GPS CoordinatesCropYield
(kg Acre−1)
Reference
1Faisal Ali34/12 L Chichawatni Sahiwal, Punjab
30°28′48″ N, 72°43′11.9994″ E
Autumn Maize3840Maize Yield Competition [64],
Government of Punjab, Pakistan
2Ashfaq Ahmed JoyiaMouzaJoyia Tehsil Okara, Punjab
31°0′36″ N, 73°30′0″ E
Autumn Maize3680-
3Malik Ali GoharChak# 96/D Tehsil Pakpattan, Sahiwal, Punjab 30°28′11.9994″ N, 73°10′12″ EAutumn Maize3280-
4Ghulam MujtabaChak# 50/SP Pakpattan, Arifwala, Sahiwal, Punjab
30°25′47.9994″ N, 73°10′12″ E
Autumn Maize3280-
5Muhammad Sharif33/12 L Chichawatni Sahiwal, Punjab
30°27′36″ N, 72°42′35.9994″ E
Autumn Maize3160-
6Abid RasheedChak# 4/AL RenalaKhurd, Okara, Punjab
30°56′24″ N, 73°42′0″ E
Autumn Maize3280-
7Masood SaeedChak# 56/5-L Tehsil Sahiwal, Punjab
30°42′36″ N, 73°15′36″ E
Autumn Maize3160-
8Muhamamd ArshadTehsil Sahiwal, Punjab
30°38′24″ N, 73°8′24″ E
Autumn Maize3160-
9Nawab KhanChak# 3/EB Jiwan Shan Pakpattan, Punjab
30°18′35.9994″ N, 73°12′0″ E
Autumn Maize3240-
10Muhammad AsifBalaraLakhoKa Tehsil Arifwala, Punjab
30°17′23.9994″ N, 73°4′11.9994″ E
Autumn Maize3200-
Source: Maize Yield Competition [64], Government of Punjab, Commissioner’s Office, Sahiwal, Punjab, Pakistan.
Disclaimer/Publisher’s Note: The statements, opinions and data contained in all publications are solely those of the individual author(s) and contributor(s) and not of MDPI and/or the editor(s). MDPI and/or the editor(s) disclaim responsibility for any injury to people or property resulting from any ideas, methods, instructions or products referred to in the content.

