Article

A Dispatching Method for Large-Scale Interruptible Load and Electric Vehicle Clusters to Alleviate Overload of Interface Power Flow

1
State Grid Sichuan Electric Power Company, Chengdu 610041, China
2
Tsinghua Sichuan Energy Internet Research Institute, Chengdu 610213, China
*
Author to whom correspondence should be addressed.
Sustainability 2023, 15(16), 12452; https://doi.org/10.3390/su151612452
Submission received: 3 July 2023 / Revised: 3 August 2023 / Accepted: 15 August 2023 / Published: 16 August 2023
(This article belongs to the Collection Power System and Sustainability)

Abstract

:
The study of dispatching methods for large-scale interruptible loads and electric vehicle clusters is of great significance as an optional method to alleviate the problem of overload in interface power flow. In this paper, the distribution model and transfer capacity of large-scale interruptible load and electric vehicle in two dimensions of time and space were firstly introduced. Then, a large-scale interruptible load and electric vehicle dispatching model considering transmission interface power flow balance was established. Finally, a case study was carried out with the city power grid as the research object. Studies show that by dispatching large-scale interruptible load and electric vehicle, the overload rate of interface power flow can be reduced by 12–17%, while the proportion of clean energy generation increased by 4.19%. Large-scale interruptible load and electric vehicles are quite different in terms of the role they play in grid regulation. The regulation cost of electric vehicles is higher than that of large-scale interruptible load, but it also has the advantages of promoting the consumption of clean energy and improving the overall operating economy. Which type of resource should be given priority is based on the actual state of the grid. In addition, the cost of electricity has a significant impact on the load response behavior of electric vehicles. It should be determined according to various factors, such as interface power flow control requirements, regulation costs, and power grid operation costs.

1. Introduction

A transmission section is a collection of transmission lines connecting two regional power grids. Due to the imbalanced distribution of energy resources and power demand, most regional transmission sections in China have large-scale power exchange and experience imbalanced power flow distribution. In the event of a transmission line fault in a particular section, the majority of power will be redirected to other lines within the same section, leading to an overload on the remaining lines and ultimately resulting in a cascading failure. In recent years, there have been many blackouts due to section overload [1,2]. Against the background of a high penetration of renewable energy and power electronic devices in modern power systems, optimizing interface power flow, achieving balance, and enhancing disaster resistance ability have become urgent issues.
Currently, the research on transmission interface power flow equalization control mainly involves several aspects: key section identification [3], section limit capacity calculation [4], and unified power flow control [5,6].
Demand response programs are widely applied in electric power systems nowadays [7,8,9,10,11,12,13,14,15], with new mathematical methods including deep learning being applied in this research filed. These demand response methods are also applied for power system resilience enhancement [16,17]. In recent years, with the development of power grid regulation technology and increasing new flexible loads such as electric vehicle (EV) loads and interruptible loads, some studies have utilized this type of load as a valuable resource in the ancillary services for electric power systems [18].
The research on scheduling for EVs primarily involves optimizing the orderly charging strategy for EVs, as well as exploring the ability of EVs to provide frequency and voltage support services or participate in demand response programs.
A demand response program for EVs is proposed in [19] to provide support for a grid-connected microgrid, which can help the microgrid reduce dependency on the power system. An integrated demand response program is proposed in [20] for a community integrated energy system with an EV charging station to promote a balance between energy supply and demand while maintaining a user comprehensive satisfaction within an acceptable range. EVs play an important role in the coordination of a flexible demand response and uncertain renewable energy. In order to protect building energy systems against natural disasters, EVs in the charging station are organized to help the building recover from power outages [21].
In order to address the frequency support issue in microgrids, a control strategy for cooperative frequency support between energy storage and EVs is proposed based on predictive EV capacity [22]. Considering the cost of battery degradation and aiming for minimal frequency adjustment expenses, the study coordinated EV output to ensure safe and economical operation of the power system [23]. A power change mode optimization method was proposed for taxis, which involves the use of a swapping station to support voltage in the power grid [24]. A distributed voltage control strategy was proposed for both balanced and unbalanced distribution networks, which functions by harnessing the reactive power capabilities of large-scale decentralized EV chargers [25]. Aiming at the demand of active power and reactive power in frequency and voltage stability control, the effect of simultaneously supporting the voltage and frequency of the grid is achieved by coordinating the charging and discharging active power of EVs and the reactive power of charging inverters [18,26].
The involvement of interruptible loads in power grid load dispatching is facilitated through contractual agreements. Researchers have carried out relevant studies on interruptible load scheduling. In one study, an automatic demand response framework based on deep reinforcement learning was developed to provide technical support for the real-time implementation of demand response [27]. Another study examined the pricing of subsidies for users with interruptible loads, enhanced user engagement in demand response, mitigated peak system load and operating costs, and resolved the trade-off between minimum daily load reduction and user interruption time [28]. Previous research also shows the method of household interruptible load participating in demand response [29].
In reality, flexible demand resources like interruptible load and EVs that participate in grid scheduling to achieve power balance, frequency, and voltage support require appropriate pricing strategies to incentivize participation. The existing relevant studies primarily aim at a reduction in electricity costs for consumers, generation of supplementary benefits, and enhancement of grid voltage and frequency quality, but there is a paucity of research on the dispatching of demand-side resources and resolution of power grid transmission interface power flow congestion. This is known as an interruptible load, and EVs, as flexible resources, have not played their due role in interface power flow overload.
In light of this, the present study comprehensively examines two types of demand-side response resources, namely large-scale interruptible loads and EV clusters, and presents conducts research on transmission sectional power flow equalization.
Firstly, the research presents the spatial and temporal distribution model of demand response resources including an EV cluster and large-scale interruptible load that participate in interface power flow optimization, respectively. Secondly, a flexible optimization model of interface power flow is established with the aim of limiting power flow within safety limits at minimal adjustment costs while considering demand-side resources. Finally, the optimization simulation is conducted on the urban power grid as the research subject, analyzing and comparing response behaviors of large-scale interruptible loads and EV clusters in various scenarios. The results provide guidance and suggestions for engineering applications. Additionally, the impact of various electricity pricing policies on the response behavior of EV clusters is examined, and a fundamental approach for determining electricity pricing is proposed.
The main contributions of this article include (1) establishing a large-scale interruptible load and EV cluster model for interface power flow optimization, enabling demand-side resources to be included in power grid scheduling and fully considering the interests of users in the model, and thus ensuring the feasibility of demand-side resources responding to power grid regulation; (2) analyzing and comparing the ways in which large-scale interruptible loads and EVs participate in grid dispatch, and providing selected suggestions for different engineering scenarios; (3) analyzing the impact of spatiotemporal electricity prices on the response of EVs to grid dispatch, and providing suggestions for pricing principles.

2. Spatial and Temporal Distribution Model of Demand Response Resources

2.1. EV Charging and Discharging Load Spatial and Temporal Distribution Model

As a high-quality demand response resource, EV charging and discharging demand exhibits certain probability distribution features in both the time and space dimensions. On the basis of not affecting the travel of EV owners, the charging and discharging needs of EVs are scheduled to recombine in time and space through an incentive mechanism to achieve regional load redistribution in the power system, which alleviates the transmission section congestion problem. The spatial and temporal distribution transfer models of EV charging and discharging demand are highly correlated with the travel time of the vehicle owner, travel location, and individual travel distance. The following modeling is performed in two dimensions, time and space, respectively.

2.1.1. EV Load Temporal Distribution Model

According to the U.S. Department of Transportation’s statistics on car trips across the United States, the daily mileage of home EVs follows a log-normal distribution of [30]:
f ( D ) = 1 2 π σ d D exp [ ( ln D μ d ) 2 2 σ d 2 ]
Among them, σ d = 0.87 , and μ d = 3.31 .
Off-grid time follows a normal distribution:
f ( T l e v ) = { 1 2 π σ l exp [ ( T l e v μ l ) 2 2 σ l 2 ] 0 < T lev μ l + 12 1 2 π σ l exp [ ( T lev 24 μ l ) 2 2 σ l 2 ] μ l + 12 < T lev 24
Among them, σ d = 3.24 , μ d = 8.92 .
According to the relationship between the probability distribution of the daily driving range of an EV and the state of charge (SOC) of the battery of the EV, the probability density distribution function of the SOC of the EV is further obtained as:
f ( E ) = 1 2 π ( 1 E ) σ d exp { [ ln ( 1 E ) + ln D μ d ] 2 2 σ d 2 }
where E is the SOC of the EV.
In turn, the charging power distribution of EVs in a day can be obtained as:
P ( t , N , D ) = E 0 1 N f ( E ) p ( t ) d E
where N is the number of EVs, E0 is the lower limit of the V2G power of EVs, and p(t) is the charging and discharging power of a single EV.

2.1.2. EV Load Spatial Distribution Transfer Model

As a load that depends on the spatial motion of the EV, the EV load has specific distribution characteristics in space in addition to those in time. A probabilistic model of EV charging locations is constructed by analyzing EV travel behavior. First, the origin–destination (OD) matrix of EV trips is established using the origin–destination analysis method [31]:
A = [ a 11 a 12 a 1 n a 21 a 22 a 2 n a n 1 a n 2 a n n ]
In the origin–destination matrix A, the element a represents the number of EV trips from node i to node j. The probability of an EV traveling from node i to node j can be expressed as the ratio of a to the sum of EVs traveling from node i to all other nodes, and thus the EV travel probability matrix can be constructed as follows:
P i j = a i j j = 1 n a i j , ( 1 i , j n )
The distribution of the number of EVs at each node can be obtained based on the probability of traveling:
N i = N i 0 ( 1 j i p i j ) + j i N j 0 p j i
Further the spatial charging demand distribution at a certain moment can be obtained as:
P i = P ( N i , D )

2.2. Interruptible Load Temporal Distribution Model

Interruptible loads are those that can be interrupted during use without affecting customers, including filtration, drying, and transmission types of loads in industrial production and heating and cooling types of loads in household loads. This type of load is generally dispatched for demand response by pre-contracting with the power supply operator to determine the inconceivable time of the non-interruptible load, the value of the interruptible load, the compensation method and compensation cost, and other relevant metrics.
Assuming that the total number of interruptible loads participating in demand response in a region is n int and the power of each load is p int , i ( t ) , then the demand response load that can be provided by interruptible loads in the region at time t is:
P int = i = 1 n int p int , i ( t )

3. Scaled Demand Resource Scheduling Model for Interface Power Flow Optimization

3.1. Objective Function

Demand resource scheduling considering cross-sectional power flow optimization should ensure that the cross-sectional power flow is limited to the safety limit with minimum regulation cost to enhance the safety and economy of power grid operation.
The objective function of the model is set as the sum of the total regulation cost for large-scale interruptible load and EV clusters, the lowest generation cost of all power sources, and the penalty cost of cross-sectional power flow overload.
min F = F c + F g + β ( K sec 1 )
where F c is the total regulation cost, F g is the total generation cost, K sec is the cross-sectional power flow overload multiplier, and β is the cross-sectional power flow overload penalty factor.
F c consists of two components, EV cluster regulation and the dispatching cost and interruptible load regulation cost:
F c = C EV + C irl
where C E V is the EV cluster regulation cost and C irl is the large-scale interruptible load regulation cost.
(1)
EV cluster regulation cost.
C EV = C 0 C p + C g
where C 0 is the charging tariff of the EV cluster under the conventional charging mode; C p and C g is the charging tariff and discharging tariff of the EV cluster after optimal scheduling, respectively.
(2)
Large-scale interruptible load regulation cost.
After the large-scale interruptible load is cut in response to the grid dispatching, the compensation cost paid by the grid to the customer is the regulation cost. According to the current model, there are two main ways to calculate this cost according to the amount of electricity cut and the number of cuts. Considering these two methods, the cost of large-scale interruptible load regulation is calculated in the following formula [30,31]:
C irl = i = 1 N irl ( C irl , i Δ T t = 1 n t P irl , i , t + C 0 , irl , i t = 1 n t B irl , i , t )
where P irl , i , t is the active load reduction value of the ith interruptible load user in time period t, C irl , i and C 0 , irl , i are the unit power compensation cost and single response compensation cost of the ith user, respectively, N irl is the number of users, Δ T is the length of a dispatch cycle, and nt is the number of dispatch periods.
(3)
Total cost of power generation.
The generation cost is mainly considered for thermal power, which includes fuel, pollutant gas emissions, carbon emission costs, etc., and is generally considered to be a quadratic function of power output [32], which is calculated in the following equation:
F g = Δ T t = 1 n t i = 1 N ( A i , 2 P i , t 2 + A i , 1 P i , t + A i , 0 )
where P i , t is the output of the ith unit in time period t, N is the number of power units, and A i , 2 , A i , 1 , and A i , 0 are the cost coefficients of the respective units.

3.2. Constraint Conditions

The constraint conditions of this model consist of three parts: large-scale interruptible load constraints, EV cluster constraints, and grid operation and safety constraints.

3.2.1. The Constraint for Interruptible Load Reduction

Taking into account user satisfaction and practical feasibility, the large-scale interruptible load model aimed at flexible optimization of sectional power flow incorporates the following constraints [33,34]:
  • Load reduction upper and lower limits constraints.
P irl , i , t _ S irl , i , t P irl , i , t P irl , i , t ¯ S irl , i , t
In the formula, P irl , i , t ¯ and P irl , i , t _ are the upper and lower limits of load reduction, respectively, and S irl , i , t is a binary variable representing the reduction state.
2.
Maximum reduction in time constraints.
t = 1 n t S irl , i , t S irl , i , max
In the formula, S irl , i , max represents the maximum number of load reduction intervals agreed upon by the users within a scheduling plan.
3.
The constraints for the maximum number of load reduction occurrences.
t = 1 n t B irl , i , t B irl , i , max
In the expression, B irl , i , t is the binary variable representing the load reduction period, with 1 indicating the start of such a period; B irl , i , max denotes the maximum number of cuts agreed upon by users within a scheduling plan.
4.
Minimum cut time and cut interval constraints.
{ B irl , i , t + E irl , i , t 1 B irl , i , t + E irl , i , t + 1 1 B irl , i , t + E irl , i , t + 2 1 B irl , i , t + E irl , i , t + T sus , i 1
{ E irl , i , t + B irl , i , t + 1 1 E irl , i , t + B irl , i , t + 2 1 E irl , i , t + B irl , i , t + T int , i + 1 1
In the expression: E irl , i , t is a binary variable that represents the end of the load reduction period, and the value 1 indicates that load reduction is stopped from this period; T sus , i is the minimum duration of a single load reduction period agreed by the user, and T int , i is the minimum interval between two load reduction periods agreed by the user. This constraint is set to avoid frequent load reduction instructions and improve user satisfaction.

3.2.2. Spatial-Temporal Transfer of EV Cluster Charging Load

Currently, EVs in China generally adopt a constant power charging mode, where the energy conversion efficiency remains relatively stable throughout the entire charging process [35,36]. Additionally, due to the complex and variable urban road conditions, the time and energy consumption required for a single EV to travel between two points exhibit significant randomness. However, when considering a large number of Evs forming a cluster from a statistical perspective, the expected values tend to be more stable [37]. Therefore, this model assumes that the time and energy required for the transfer of EV clusters between different aggregation points remain unchanged.
Based on the above considerations, the EV cluster model, which considers sectional power flow optimization, includes the following constraints [18,19,20,25,26]:
  • EV power change constraints.
E ( i , t ) = E ( i , t 1 ) + η p P p ( i , t ) Δ T P g ( i , t ) Δ T η g
In the equation, E ( i , t ) is the battery power of the ith EV cluster at the end of the t period.
2.
Upper and lower limits of charge and discharge power constraints.
0 P p ( i , t ) P ( i , t ) P p , max ( i )
0 P g ( i , t ) G ( i , t ) P g , max ( i )
where P p , max ( i ) and P g , max ( i ) represent the maximum charging power and discharging power of the ith EV cluster, respectively, and P ( i , t ) and G ( i , t ) represent the binary variables that characterize whether the cluster is charging or discharging during the t period.
3.
Charge and discharge status constraints.
{ P ( i , t ) + G ( i , t ) 1 P ( i , t + 1 ) + G ( i , t ) 1 P ( i , t + 2 ) + G ( i , t ) 1 P ( i , t 1 ) + G ( i , t ) 1 P ( i , t 2 ) + G ( i , t ) 1
This constraint limits the charging and discharging of EVs, which are not to be carried out at the same time, and at least two intervals are needed to extend the battery life.
4.
The constraints for the upper and lower limits of a battery’s state of charge.
E min ( i ) E ( i , t ) E max ( i )
In the expression, E max ( i ) and E min ( i ) represent the upper and lower limits of the battery’s state of charge for the ith EV cluster, respectively.
5.
The constraints for the grid connection and disconnection of the EV cluster.
E ( i , t in ( i ) ) = E in ( i )
E ( i , t out ( i ) ) = E out ( i )
P ( i , t ) = G ( i , t ) = 0   t t in ( i ) t > t out ( i )
In the equation, t in ( i ) and t out ( i ) represent the grid connection time and the agreed disconnection time for the ith EV cluster, respectively. E in ( i ) and E out ( i ) denote the battery’s state of charge at the time of grid connection and the agreed state of charge at the time of disconnection, respectively.
6.
The spatial distribution of charging stations constraints.
When an EV transfers from aggregator k to aggregator m to charge, the following constraint conditions are satisfied [25]:
t in ( i ) = t in ( i ) + t road ( k , m )
E in ( i ) = E in ( i ) ω ( i ) t road ( k , m )
In the equation, t in ( i ) and E in ( i ) represent the grid connection time and the energy consumption upon grid connection, respectively, for the ith EV cluster, without considering spatial transfers.
7.
The constraints for the temporal transfer of EV charging load.
C p ( t 1 ) E + C rest + C exp C p ( t 0 ) E
C p η p η g C g
In the equation, C p ( t 0 ) and C p ( t 1 ) represent the charging prices for the corresponding time intervals before and after the load transfer of EVs. E represents the planned charging amount for EVs. C p and C g represent the charging and discharging prices for EVs. η p and η g represent the charging and discharging efficiencies.
8.
The constraints for the spatial transfer of EV charging load.
C c C d + C rest + C exp C c 0
C p ( A ) E + C rest + C exp C p ( B ) E
C rest = C p ( A ) ω t road + φ t road
C c 0 and C c represent the charging costs for EV users before and after spatial-temporal transfers; C d represents the electricity fee income obtained by the user through V2G participation, while C rest represents the additional costs associated with spatial-temporal transfers, including extra time spent, energy consumption, and battery life degradation. C exp represents the user’s psychological expected profit; C p ( A ) and C p ( B ) represent the charging prices at nodes A and B, respectively. t road denotes the time required for spatial transfer. ω represents the energy consumption coefficient, which refers to the energy consumption per unit time during travel. φ represents the time cost coefficient, which corresponds to the cost per unit time of travel.
9.
The constraints for the upper and lower limits of charging and discharging power for aggregators [20].
{ i Ω j [ P p ( i , t ) P g ( i , t ) ] P p , union , max ( j , t ) i Ω j [ P p ( i , t ) P g ( i , t ) ] P g , union , max ( j , t )
In the equation, Ω j represents the collection of all EV clusters for charging and discharging at aggregator j. P p , union , max ( j , t ) and P g , union , max ( j , t ) denote the maximum charging and discharging power that aggregator j can exchange with the grid during time interval t.
10.
The constraints for EV user response willingness.
To safeguard the interests of EV users and ensure the willingness of the EV cluster to respond to grid optimization dispatch, this model incorporates constraint conditions to ensure that the total charging cost for the EV cluster after responding to grid dispatch is not higher than that of conventional charging methods.
C c ( i ) + φ ( i ) t road ( k , m ) C 0 ( i )
C c ( i ) = t = 1 n t [ C p ( i , t ) P p ( i , t ) C g ( i , t ) P g ( i , t ) ]
In the expression, C c ( i ) represents the net charging cost paid by the ith EV cluster, C 0 ( i ) represents the electricity cost under conventional charging methods, and C p ( i , t ) and C g ( i , t ) represent the charging and discharging prices, respectively, of the ith EV cluster during time interval t.

3.2.3. Power Grid Operation and Security Constraints

The operation and safety of the power grid are subject to various constraints [26], including power supply and demand balance (Formula (38)), network power flow (Formula (39)), the maximum and minimum output of the power generation unit (Formula (40)), the thermal power generating unit climbing constraint (Formula (41)), the hydropower storage capacity and generator unit output constraint (Formulas (42) and (43)), and the system rotation reserve constraint (Formulas (44) and (45)):
i = 1 N P source ( i , t ) = P load ( t )
| P l , km ( t ) | K sec P l , km ¯
P source ( i ) _ P source ( i , t ) P source ( i ) ¯
| P th ( i , t ) P th ( i , t 1 ) | r ( i ) Δ T
V ( i , t ) V ( i , t 1 ) = Δ T [ Q in ( i , t ) Q out ( i , t ) ]
P h ( i , t ) = η ρ g H [ Q out ( i , t ) Q waste ( i , t ) ]
i = 1 N s u ( i , t ) P load ( t ) × L + %
i = 1 N s d ( i , t ) P load ( t ) × L %
In the formulas above, P source ( i , t ) represents the output of unit i during the period t, and P load ( t ) denotes the total network load for that corresponding period (including the charging loads of EVs and reduced interruptible loads); P l , km ( t ) signifies the power flow through the line or interface km during period t, while P l , km ¯ indicates the upper limit of transmission power for that particular line (or interface); P source ( i ) ¯ and P source ( i ) _ represent the upper and lower limits of unit is output, respectively. P th ( i , t ) denotes the thermal power output of unit i during period t, while r ( i ) represents its ramp rate. V ( i , t ) stands for the water storage capacity of reservoir i at the end of period t, with Q in ( i , t ) and Q out ( i , t ) representing the average inflow and outflow rates over that same time frame. The output of hydropower unit i during period t is denoted by P h ( i , t ) , where η represents the power generation efficiency of the unit, ρ denotes water density, g stands for acceleration due to gravity, H signifies average head height, and Q waste ( i , t ) indicates the water discarded during this time frame. L + % and L % are the positive and negative rotation reserve capacity coefficients, respectively, for the system while s u ( i , t ) and s d ( i , t ) represent the positive and negative rotation reserve capacities that unit i can provide during period t.

3.3. Solution Method

The large-scale demand resource scheduling model for interface power flow optimization established in this article is a DC power flow model, which does not consider system reactive power and transmission line losses, nor does it consider the randomness of the load. Therefore, the calculation results have a certain deviation from the actual situation [7]. However, considering that this model is used for day-ahead optimization scheduling, the accuracy of the calculation results can meet the requirements.
Through the above simplification, this model uses mixed integer linear programming (MILP), which can be solved by using the interior point method and branch-and-bound method for overall optimization [38]. Compared to step-by-step optimization in different periods, the overall optimization method proposed in this paper makes it easier to find the global optimal solution [38].

4. Case Study and Analysis

4.1. Introduction to the Case

In this paper, the 220 kV power grid of a provincial capital city in China is selected as the research subject for an illustrative analysis. The key parameters of the power grid are as follows: its maximum load capacity is 18,943 MW and it experiences a daily peak–valley difference of 10,342 MW. Additionally, the total installed thermal power capacity amounts to 2050 MW, while that of hydropower stands at 3830 MW. The external receiving channels have a capacity of 14,100 MW, with the majority comprise clean energy sources such as hydropower, wind, and solar power. In contrast, the receiving channels that are primarily dominated by thermal power only have a capacity of 1800 MW.
There are approximately 460,000 EVs in the region, of which 58,000 are currently included in the pool of schedulable control resources. These resources are divided into 38 clusters and have a combined daily charging capacity of around 2200 MWh. To facilitate the temporal and spatial allocation of EV charging load, a three-tiered pricing scheme has been implemented for peak, flat, and off-peak hours alongside a two-tiered pricing system for heavy and non-heavy nodes. The peak discharge rate is set at 1.4 times the charging rate, as illustrated in Table 1. Time segments are categorized as peak, valley, or flat based on whether the forecasted load exceeds 80% of the maximum daily load, falls below 55%, or falls between these two thresholds. The classification of heavy and non-heavy nodes is determined by whether a node’s maximum load exceeds 85% of its capacity.
A network of 16 robust load nodes is equipped with large-scale and interruptible resources capable of reducing the total load by up to 870 MW.

4.2. Case Results

The results of the above case are shown in Table 2. To evaluate the model and algorithm presented in this article, a mature power flow calculation solver, MATPOWER [39], (DC-optimized power flow algorithm) developed by Carnell University was used for step-by-step calculations, and the results were used for comparison.
It can be seen that compared with the MATPOWER solver, the calculation time of the model algorithm in this article is nearly twice as long; however, due to the fact that the model in this article is based on the overall optimization of the entire time period before the considered day, compared to the multi-time period step-by-step optimization algorithm, it can obtain the global optimal solution, so the calculation results are significantly better than the former.

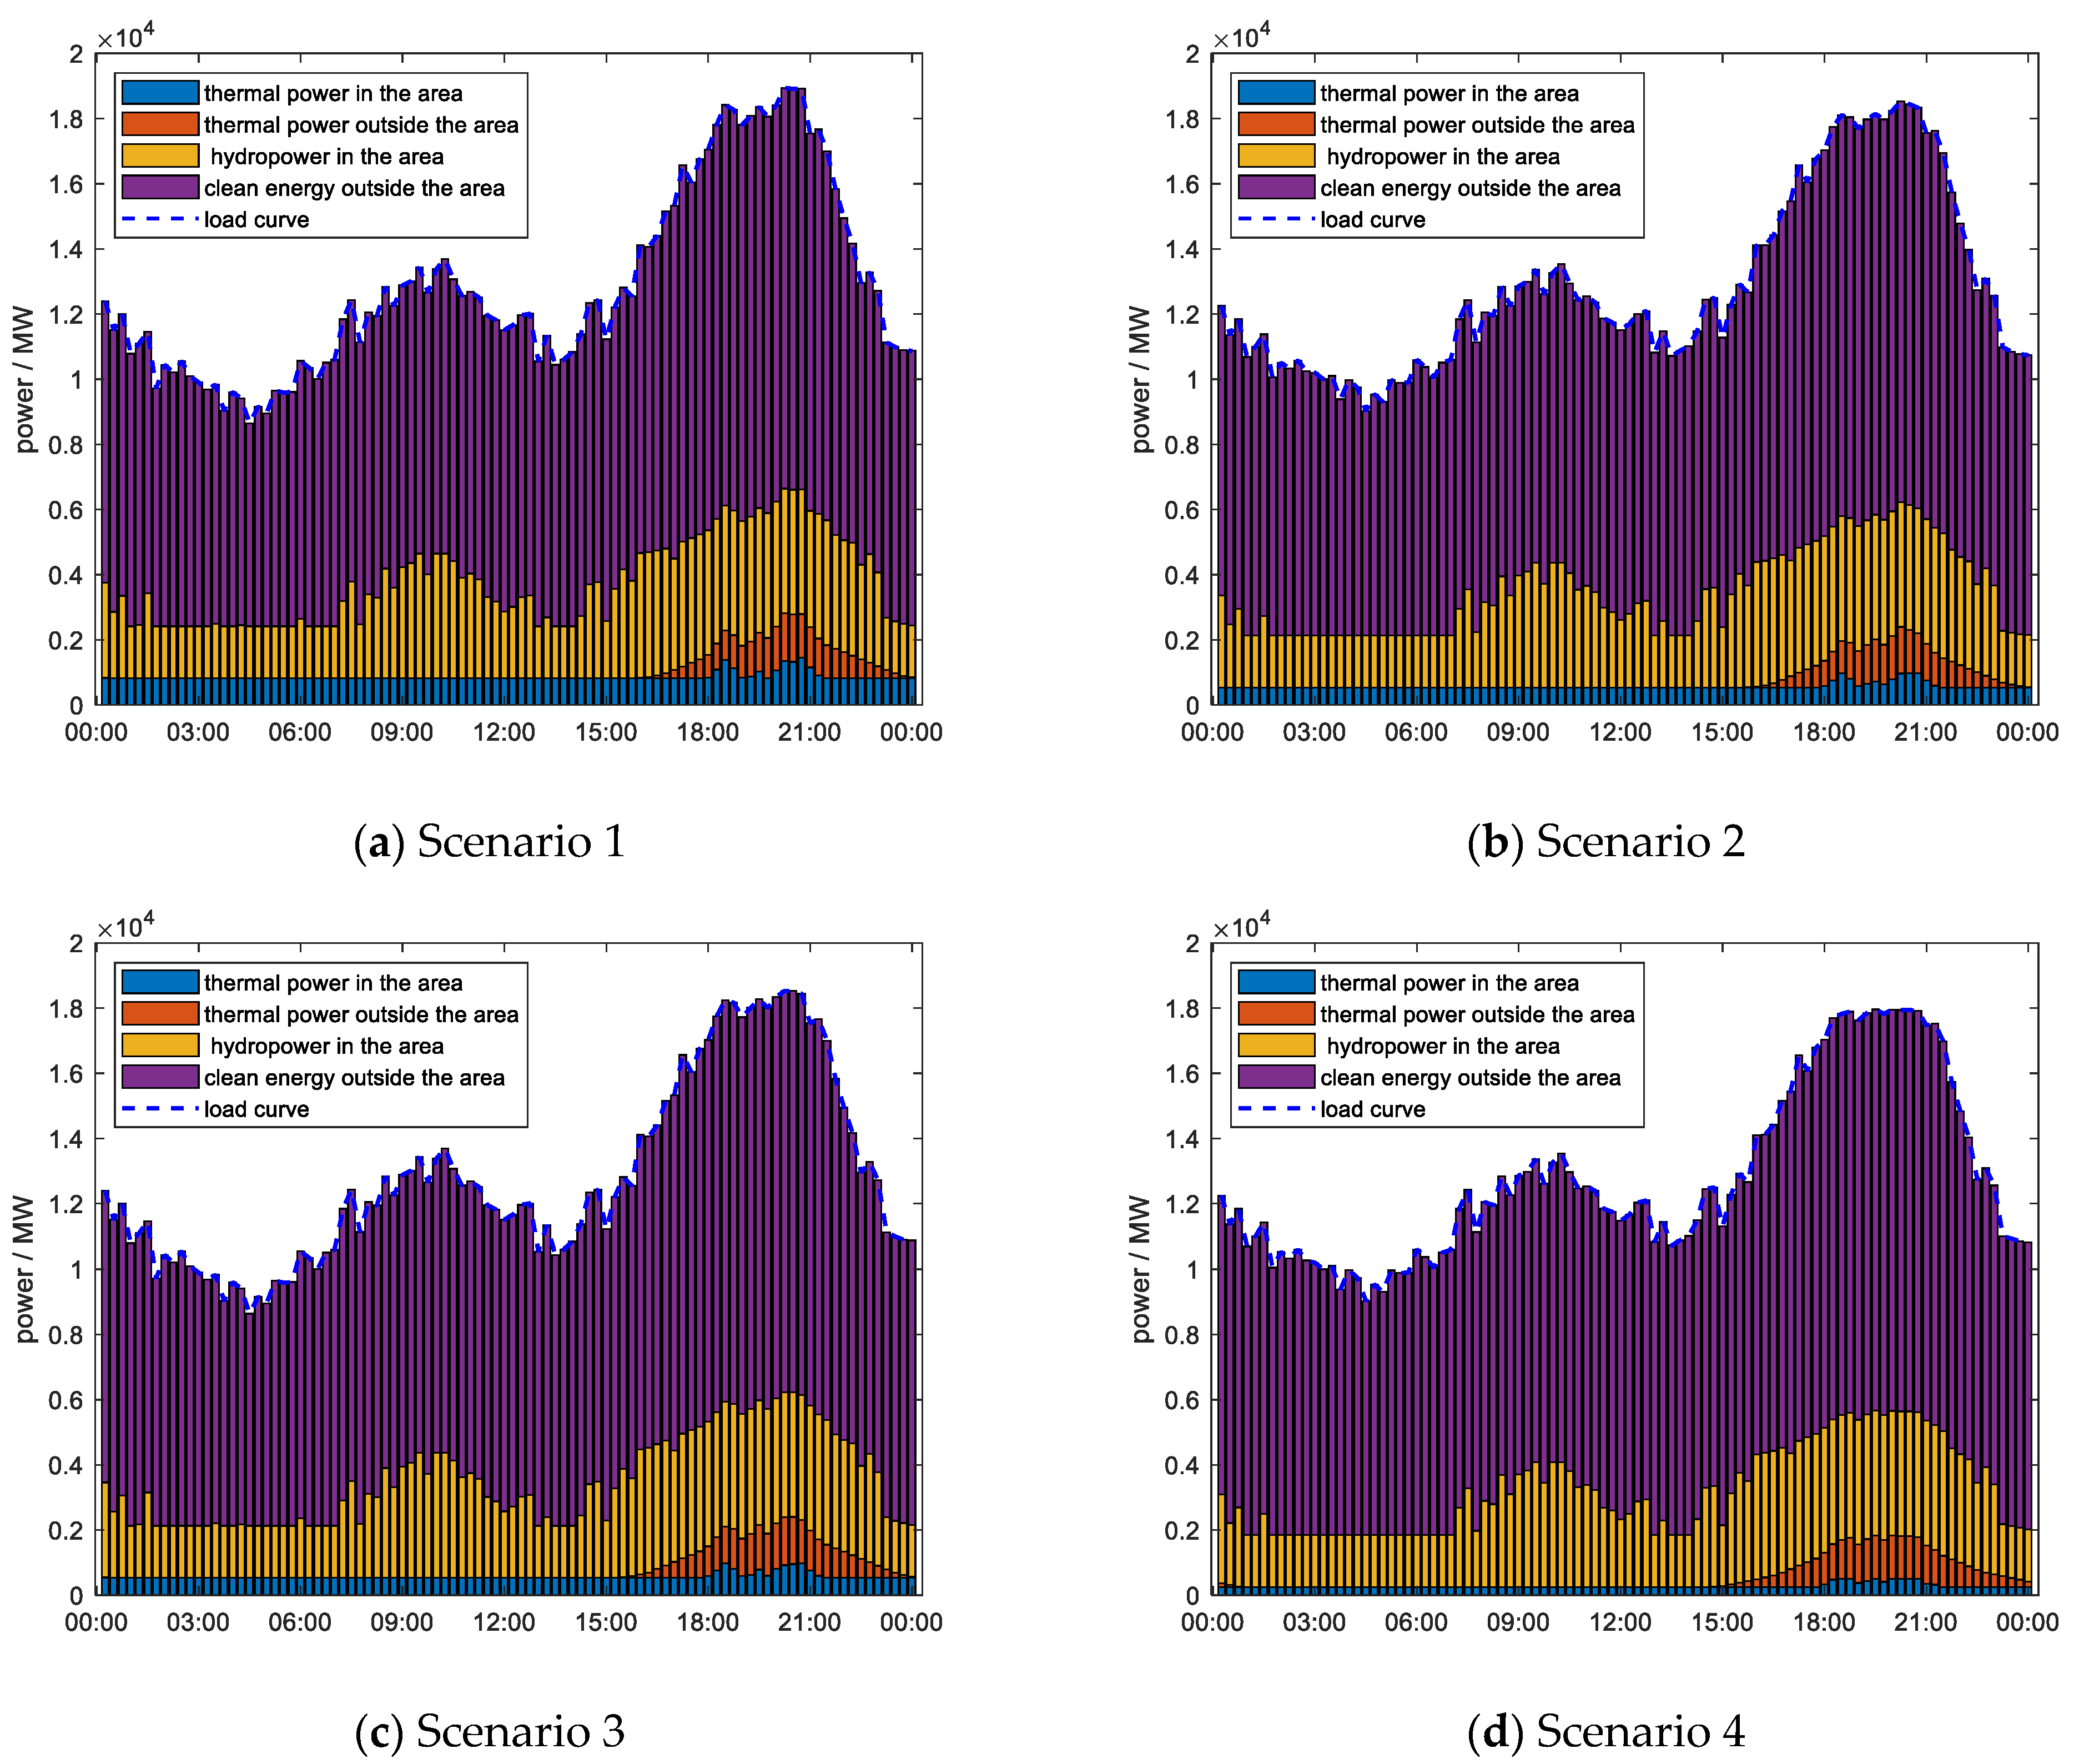
4.3. Analysis of Calculation Results in Different Scenarios

To investigate the regulatory impact of large-scale interruptible load and EV scheduling on sectional power flow, four distinct scenarios have been established:
  • Scenario 1: no demand response resources;
  • Scenario 2: only EV load is participating in dispatching;
  • Scenario 3: only interruptible load is participating in dispatching;
  • Scenario 4: both EV and interruptible loads are participating.
The optimization outcomes under the above four various scenarios are presented in Figure 1.
While no demand response resources on the load side participate, dispatching can result in a maximum overload rate of power flow reaching 17.5% in the transmission section. The participation of large-scale EVs and interruptible loads in grid response can significantly alleviate section transmission overload (with overload rates being reduced to 3.7% and 5%, respectively), while their joint action can effectively limit interface power flow to within safe limits. Figure 2 illustrates the typical power flow curves of heavy and overloaded sections in various scenarios. From the load curves of each section, it is evident that large-scale interruptible load and EVs can mitigate the power flow burden of heavy and overloaded sections by means of peak shaving during peak time as well as valley filling during load valley time in the temporal dimension. Additionally, the charge and discharge load transfer of EVs in the spatial dimension also yields significant effects.
Figure 3 illustrates the output characteristics of various power supply types under different scenarios, where grid response is influenced by large-scale EV loads and interruptible loads, leading to a reduction in thermal power generation and an increase in clean energy utilization. The aggregate power generation of thermal power units decreased by 48.8%, while the proportion of clean energy supply increased by 4.19 percentage points. This can be attributed to two primary factors: firstly, a reduction in the number of thermal power units utilized for peak load balancing through peak shaving and valley filling (where the number of large thermal power units was reduced from 7 to 5); secondly, an enhancement in the ability to receive clean energy from external regions via alleviating power flow congestion of transmission interface (the power supply of clean energy outside the area increased from 217,300 MWh to 229,751 MWh).
The charging profile of the EV cluster is depicted in Figure 4 for both conventional charging scenarios (based on scenarios 1 and 3) and an electricity price incentive scenario (based on scenario 4). Under the conventional charging mode, the EV cluster experiences relatively concentrated charging times, resulting in several peaks of charging load that coincide with peak periods of overall energy demand. By incentivizing electricity pricing to encourage off-peak charging and reverse discharge during peak periods, this approach effectively regulates power grid load fluctuations and alleviates overload in peak time. The results show that during the maximum load period of the power grid, the charging power of EVs decreased from 185.9 MW to 0, and 363.1 MW is discharged into the grid, equivalent to a peak shaving of 549 MW. The cumulative charging energy during peak hours (16:30–21:45) decreased from 616.1 MWh to 275.1 MWh, and 449.3 MWh was discharged into the grid through V2G.
In scenario 4, Figure 5 illustrates the spatial transfer of EV load. The majority of charging power from cluster 1, cluster 2, and cluster 3 located at nodes with heavy loads (45, 43, and 48) was redirected to node 61, which has non-heavy loads. This effectively mitigated the interface power flow congestion that was previously concentrated on nodes 45, 43, and 48.
The response of large-scale interruptible load is depicted in Figure 6, where a reduction in load of up to 480 MW during peak hours effectively mitigated the issue of overload in power flow within transmission sections. The cumulative power reduction achieved in scenario 3 and scenario 4 amounted to 497.4 MWh and 638.2 MWh, respectively. It is evident that the EV clusters’ collaborative participation in grid response (Scenario 4) resulted in a greater cumulative power reduction, and the reduction in power consumption of interruptible loads was greater, indicating that the collaboration between these two types of demand response resources can yield a more effective outcome for optimizing the transmission interface power flow.
In addition, it can be observed that the adjustment cost of EV load is higher than that of large-scale interruptible load when the optimization effect of sectional power flow is similar when comparing the calculation results between scenario 2 and scenario 3. The section overload coefficient of scenario 2 was reduced by 0.013 compared to that in scenario 3, albeit at the cost of a 58.8% increase in adjustment expenses. The two primary reasons for this result are as follows. Firstly, the load regulation mode of EVs is based on electricity price incentives, which lack accurate scheduling control and result in low utilization efficiency of response resources. Additionally, due to the limited efficiency of charging and discharging in EVs, additional electricity will be consumed in V2G mode. Furthermore, EVs require extra time and energy for spatial transfer, which is included in the adjustment cost after conversion. As a result, the adjustment cost of EVs is higher than that of interruptible loads.
However, due to the temporal and spatial transferability of EV charging loads, they are distributed across time and space without reducing the overall load. As a result, they do not impact the network’s total electricity consumption but instead serve to smooth out peak demand periods and fill in valleys, thereby promoting clean energy usage and improving grid operational efficiency. Scenario 2 exhibited a rise of 629 MWh and 1477 MWh in total electricity consumption and clean energy power generation, respectively, when compared to scenario 3. Additionally, the power generation from thermal power units decreased by 848 MWh, while the proportion of clean energy supply increased by 0.29 percentage points.
Therefore, in periods of overall power generation abundance but local blockages or tight supply, priority should be given to the spatial-temporal transfer of EV load for adjustment. In times of insufficient overall power generation, interruptible load reduction takes precedence.

4.4. Analysis of the Influence of Electricity Prices on EV Response

Electricity pricing plays a crucial role in guiding the spatiotemporal distribution of EVs. Unlike the command mode, which can interrupt power consumption, the response of an EV cluster to electricity price incentives is more complex. In order to enhance the regulatory function of the EV cluster, this paper employs distinct electricity prices for optimization calculation and examines the factors that impact electricity prices based on scenario 2.

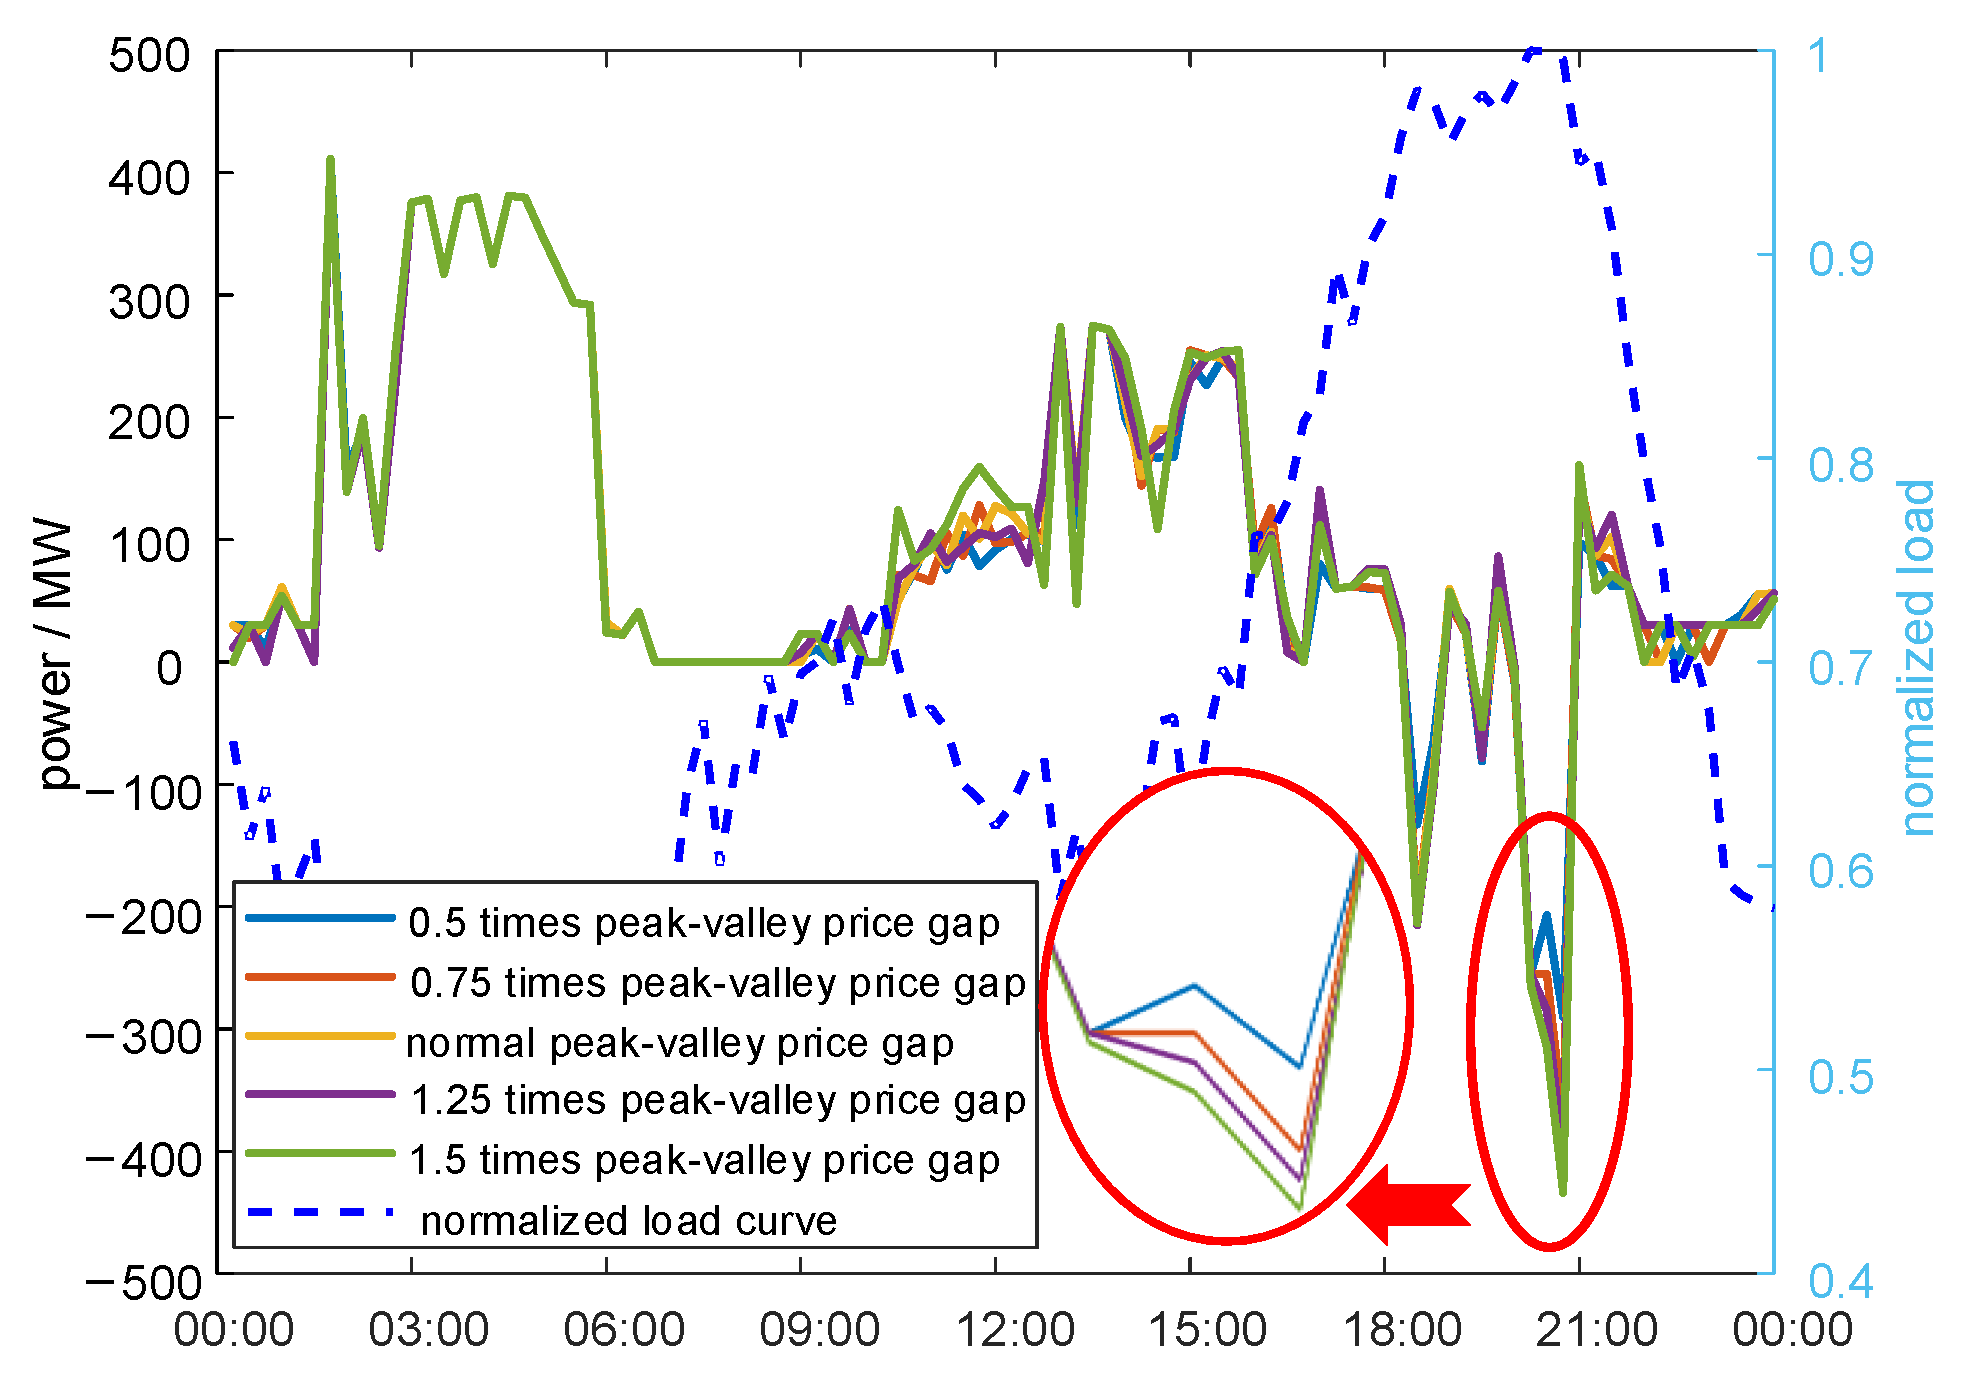
4.4.1. The Effect of Pricing at the Time of Sale

Based on the electricity prices presented in Table 1, we maintained the standard electricity rate while adjusting the peak-to-valley differential to 0.5×, 0.75×, 1×, 1.25×, and 1.5× the values given in Table 1; additionally, we set the peak discharge electricity price at a rate 1.4 times that of charging electricity prices. The optimization calculation results for each scenario are displayed in Table 3.
The difference in peak–valley electricity prices has minimal impact on the section overload coefficient. This is because, at 0.5 times the difference in peak–valley electricity prices, the EV loads affecting key interface power flow have already been adjusted, and increasing the price difference will not further optimize interface power flow. With the increase in the price differential between peak and off-peak electricity, both the maximum power output of vehicle-to-grid (V2G) systems and cumulative V2G electricity generation also increase. This is due to variations in EV cluster parameters, as well as larger disparities between peak/off-peak and charge/discharge electricity prices, resulting in a greater number of EV clusters that meet the time transfer conditions. Increased participation of EVs in grid response can effectively promote the consumption of clean energy and reduce reliance on thermal power generation. However, this also results in a proportional increase in adjustment costs. Considering the proportion of clean energy power supply presented in Table 3, it is reasonable to establish the peak–valley electricity price differential for this scenario as being between 0.75 and 1 times that of the electricity price indicated in Table 1.
The power curve for charging and discharging EVs is depicted in Figure 7, where positive values indicate charging power and negative values represent discharging power. It can be observed that the general trend of the charge–discharge power curve for EVs remains consistent; however, V2G power increases during certain periods with an increase in the peak–valley electricity price differential.

4.4.2. The Effect of Regional Electricity Prices

On the basis of the electricity prices shown in Table 1, the other electricity prices are kept constant, the peak power prices of non-heavy-duty nodes are adjusted to vary between 0.6 and 0.96 CNY/kWh, and the power prices of heavy-duty nodes vary between 0.36 and 0 CNY/kWh accordingly. Furthermore, the discharge price while maintaining the peak is 1.4 times the charging price, and the results of optimization in each case are shown in Table 4.
The spatial migration of EV clusters in each scenario is illustrated in Figure 8 (with the same transfer direction as depicted in Figure 5).
With the rise in peak electricity prices for non-heavy nodes and the decline in regional electricity price differentials, there was a significant reduction in both spatial transfer charging power and EV cluster charging volume, while section overload coefficients increased markedly. The reason for this lies in the varying parameters of EV clusters. The spatial transfer of EVs involves time and economic costs. Only when the regional electricity price difference is large enough and the electricity cost saved by charging at non-heavy-duty nodes is greater than the transfer cost (i.e., meeting the conditions of Formulas (32)–(34)) can the EV undergo spatial transfer. However, different EVs have different parameters, such as time cost coefficient, electricity consumption coefficient, and planned charging capacity. The smaller the regional electricity price difference, the fewer EV clusters that can meet the conditions of Formulas (32)–(34), and the more reduced their ability to alleviate interface flow congestion. In this scenario, if the peak electricity price of non-heavy nodes exceeds 0.78 CNY/kWh, indicating a regional electricity price difference of less than 0.18 CNY/kWh, EV clusters cannot be spatially transferred; the threshold condition for spatial transfer of most EV clusters is a spatial electricity price difference of 0.18 CNY/kWh.
On the other hand, if only the time-of-use electricity price characteristics of non-heavy-duty nodes are considered, the increase in the peak price of non-heavy-duty nodes also increases the peak–valley price difference of the node, which can better motivate EV clusters of the node to transfer during different times and participate in the V2G process, promoting clean energy consumption and improving the economic efficiency of the power grid. These two factors restrict each other. Therefore, the final optimization calculation results are as follows: with the increase in the peak price of non-heavy-duty nodes, the total generation cost of electricity by source, clean energy generation, and other economic indicators gradually become better first, and then worse, and there is an optimal electricity price, which is about 0.78 CNY/kWh in this scenario.
At the same time, the optimal electricity price determined through economic indicators may not necessarily be the optimal electricity price to alleviate interface power flow. Therefore, it is necessary to consider the interface overload coefficient in each scenario and comprehensively determine a compromise for the electricity price.

5. Conclusions

To tackle the issue of power flow overload in power grid sections, this paper proposes a load time–space transfer strategy for EV clusters and advocates their utilization as an effective measure to mitigate both overall load and peak loads. The issue of interface power flow overload is effectively mitigated, and the impact of time-based electricity pricing and spatial zonal electricity pricing on EV load response is examined. The following conclusions are drawn:
(1)
Based on the model and case this paper established, by dispatching large-scale interruptible load and EVs, the overload rate of interface power flow could be reduced by 12–17%, while the proportion of clean energy generation increased by 4.19%, promoting the consumption of clean energy.
(2)
In the case of similar overload coefficients of interface power flow, the regulation cost of EV clusters is 58% higher than that of large-scale interruptible loads, but it can play an additional role in promoting the consumption of clean energy and improving the overall operating economy of the power grid, thus emphasizing the need for prioritizing demand response resources based on actual power grid operations. The EV cluster should be given priority for adjustment in case of a local power flow blockage or tight power supply, while reducing interruptible load should be prioritized during overall insufficient power generation.
(3)
The response behavior of EV clusters can be significantly influenced by variations in time-of-use and regional electricity prices, and thus affects the degree of interface power flow overload and operation economy of the power grid: the larger the difference in peak–valley electricity prices, the greater the difference in peak hour electricity prices between heavy-duty nodes and non-heavy-duty nodes, and the more significant the effect of optimizing power grid operation. However, at the same time, the cost of regulation also increases. It is necessary to comprehensively consider various factors, such as interface power flow control demand, regulation cost, and power grid operation cost, to determine a compromise for the electricity price. Based on the analysis presented in this paper, more effective determination of time-of-use and zonal electricity prices can be achieved.

Author Contributions

Methodology, X.Y. and X.W.; Software, X.Y., G.L., T.Z. and Y.W.; Validation, G.L., T.Z., L.Z. and Y.W.; Formal analysis, L.Z.; Investigation, H.Z.; Data curation, H.Z. All authors have read and agreed to the published version of the manuscript.

Funding

This research was funded by Science and Technology Plan of Sichuan Province, China, grant number 2023YFSY0032, and the State Grid Science and Technology Project, grant number 521999220002.

Institutional Review Board Statement

Not applicable.

Informed Consent Statement

Not applicable.

Data Availability Statement

Data sharing not applicable, Data sharing is not applicable to this article.

Conflicts of Interest

The authors declare no conflict of interest.

References

  1. Li, X.; Qi, Z. Impact of cascading failure based on line vulnerability index on power grids. Energy Syst. 2022, 13, 893–918. [Google Scholar] [CrossRef]
  2. Zhang, D.; Wang, B.; Guo, H.; Chu, Z.; Yang, H.; Ma, Y. A method of identifying a transmission section based on topology aggregation and the transmission limit of the section. Power Syst. Prot. Control 2022, 50, 33–42. [Google Scholar]
  3. Mokred, S.; Wang, Y.; Chen, T. Modern voltage stability index for prediction of voltage collapse and estimation of maximum load-ability for weak buses and critical lines identification. Int. J. Electr. Power Energy Syst. 2023, 145, 108596. [Google Scholar] [CrossRef]
  4. Wang, Z.; Zhou, Y.; Guo, Q.; Sun, H. The Total Transfer Capability Assessment of Transmission Interfaces Combining Causal Inference and Multi-task Learning. IEEE Trans. Power Syst. 2023, 1–13, early access. [Google Scholar] [CrossRef]
  5. Naderi, E.; Mirzaei, L.; Pourakbari-Kasmaei, M.; Cerna, F.V.; Lehtonen, M. Optimization of active power dispatch considering unified power flow controller: Application of evolutionary algorithms in a fuzzy framework. Evol. Intell. 2023. ahead of print. [Google Scholar] [CrossRef]
  6. Abdelrahman, M.A.; Wang, S.; Ming, W.; Wu, J.; Jenkins, N. Transformer-less unified power flow controller in medium voltage distribution networks. IET Gener. Transm. Distrib. 2023, 17, 1243–1255. [Google Scholar] [CrossRef]
  7. Tostado-Véliz, M.; Jordehi, A.R.; Icaza, D.; Mansouri, S.A.; Jurado, F. Optimal participation of prosumers in energy communities through a novel stochastic-robust day-ahead scheduling model. Int. J. Electr. Power Energy Syst. 2023, 147, 108854. [Google Scholar] [CrossRef]
  8. Mansouri, S.; Ahmarinejad, A.; Sheidaei, F.; Javadi, M.; Jordehi, A.R.; Nezhad, A.E.; Catalão, J. A multi-stage joint planning and operation model for energy hubs considering integrated demand response programs. Int. J. Electr. Power Energy Syst. 2022, 140, 108103. [Google Scholar] [CrossRef]
  9. Tostado-Véliz, M.; Mansouri, S.A.; Rezaee-Jordehi, A.; Icaza-Alvarez, D.; Jurado, F. Information Gap Decision Theory-based day-ahead scheduling of energy communities with collective hydrogen chain. Int. J. Hydrog. Energy 2023, 48, 7154–7169. [Google Scholar] [CrossRef]
  10. Jordehi, A.R.; Tabar, V.S.; Mansouri, S.; Sheidaei, F.; Ahmarinejad, A.; Pirouzi, S. Two-stage stochastic programming for scheduling microgrids with high wind penetration including fast demand response providers and fast-start generators. Sustain. Energy Grids Netw. 2022, 31, 100694. [Google Scholar] [CrossRef]
  11. Mansouri, S.A.; Nematbakhsh, E.; Ahmarinejad, A.; Jordehi, A.R.; Javadi, M.S.; Matin, S.A.A. A Multi-objective dynamic framework for design of energy hub by considering energy storage system, power-to-gas technology and integrated demand response program. J. Energy Storage 2022, 50, 104206. [Google Scholar] [CrossRef]
  12. Tostado-Véliz, M.; Jordehi, A.R.; Mansouri, S.A.; Jurado, F. Day-ahead scheduling of 100% isolated communities under uncertainties through a novel stochastic-robust model. Appl. Energy 2022, 328, 120257. [Google Scholar] [CrossRef]
  13. Mansouri, S.A.; Jordehi, A.R.; Marzband, M.; Tostado-Véliz, M.; Jurado, F.; Aguado, J.A. An IoT-enabled hierarchical decentralized framework for multi-energy microgrids market management in the presence of smart prosumers using a deep learning-based forecaster. Appl. Energy 2023, 333, 120560. [Google Scholar] [CrossRef]
  14. Tostado-Véliz, M.; Jordehi, A.R.; Mansouri, S.A.; Jurado, F. A two-stage IGDT-stochastic model for optimal scheduling of energy communities with intelligent parking lots. Energy 2023, 263, 126018. [Google Scholar] [CrossRef]
  15. Mansouri, S.A.; Nematbakhsh, E.; Jordehi, A.R.; Tostado-Véliz, M.; Jurado, F.; Leonowicz, Z. A risk-based bi-level bidding system to manage day-ahead electricity market and scheduling of interconnected microgrids in the presence of smart homes. In Proceedings of the 2022 IEEE International Conference on Environment and Electrical Engineering and 2022 IEEE Industrial and Commercial Power Systems Europe (EEEIC/I&CPS Europe), Prague, Czech Republic, 28 June–1 July 2022; IEEE: New York, NY, USA, 2022; pp. 1–6. [Google Scholar]
  16. Mansouri, S.A.; Nematbakhsh, E.; Javadi, M.S.; Jordehi, A.R.; Shafie-khah, M.; Catalão, J.P.S. Resilience enhancement via automatic switching considering direct load control program and energy storage systems. In Proceedings of the 2021 IEEE International Conference on Environment and Electrical Engineering and 2021 IEEE Industrial and Commercial Power Systems Europe (EEEIC/I&CPS Europe), Bari, Italy, 7–10 September 2021; IEEE: New York, NY, USA, 2021; pp. 1–6. [Google Scholar]
  17. Mansouri, S.A.; Nematbakhsh, E.; Ahmarinejad, A.; Jordehi, A.R.; Javadi, M.S.; Marzband, M. A hierarchical scheduling framework for resilience enhancement of decentralized renewable-based microgrids considering proactive actions and mobile units. Renew. Sustain. Energy Rev. 2022, 168, 112854. [Google Scholar] [CrossRef]
  18. Wang, X.; He, Z.Y.; Yang, J.W. Unified strategy for electric vehicles participate in voltage and frequency regulation with active power in city grid. IET Gener. Transm. Distrib. 2019, 13, 3281–3291. [Google Scholar] [CrossRef]
  19. Harsh, P.; Das, D. Optimal coordination strategy of demand response and electric vehicle aggregators for the energy management of reconfigured grid-connected microgrid. Renew. Sustain. Energy Rev. 2022, 160, 112251. [Google Scholar] [CrossRef]
  20. Li, Y.; Han, M.; Yang, Z.; Li, G. Coordinating Flexible Demand Response and Renewable Uncertainties for Scheduling of Community Integrated Energy Systems with an Electric Vehicle Charging Station: A Bi-level Approach. IEEE Trans. Sustain. Energy 2021, 12, 2321–2331. [Google Scholar] [CrossRef]
  21. Tian, M.W.; Talebizadehsardari, P. Energy cost and efficiency analysis of building resilience against power outage by shared parking station for electric vehicles and demand response program. Energy 2021, 215, 119058. [Google Scholar] [CrossRef]
  22. Yang, Q.; Li, J.; Yang, R.; Zhu, J.; Wang, X.; He, H. New hybrid scheme with local battery energy storages and electric vehicles for the power frequency service. Etransportation 2022, 11, 100151. [Google Scholar] [CrossRef]
  23. Iqbal, S.; Habib, S.; Khan, N.H.; Ali, M.; Aurangzeb, M.; Ahmed, E.M. Electric Vehicles Aggregation for Frequency Control of Microgrid under Various Operation Conditions Using an Optimal Coordinated Strategy. Sustainability 2022, 14, 3108. [Google Scholar] [CrossRef]
  24. Ma, K.; Hu, X.; Yue, Z.; Wang, Y.; Yang, J.; Zhao, H.; Liu, Z. Voltage Regulation with Electric Taxi Based on Dynamic Game Strategy. IEEE Trans. Veh. Technol. 2022, 71, 2413–2426. [Google Scholar] [CrossRef]
  25. Hu, J.; Ye, C.; Ding, Y.; Tang, J.; Liu, S. A Distributed MPC to Exploit Reactive Power V2G for Real-Time Voltage Regulation in Distribution Networks. IEEE Trans. Smart Grid 2021, 13, 576–588. [Google Scholar] [CrossRef]
  26. Shukla, H.; Raju, M. Combined frequency and voltage regulation in multi-area system using an equilibrium optimiser based non-integer controller with penetration of electric vehicles. Int. J. Ambient. Energy 2023, 44, 1522–1548. [Google Scholar] [CrossRef]
  27. Wang, B.; Li, Y.; Ming, W.; Wang, S. Deep Reinforcement Learning Method for Demand Response Management of Interruptible Load. IEEE Trans. Smart Grid 2020, 11, 3146–3155. [Google Scholar] [CrossRef]
  28. Wang, J.; Zhang, F.; Liu, H.; Ding, J.; Gao, C. Interruptible load scheduling model based on an improved chicken swarm optimization algorithm. CSEE J. Power Energy Syst. 2020, 7, 232–240. [Google Scholar]
  29. Albogamy, F.R.; Khan, S.A.; Hafeez, G.; Murawwat, S.; Khan, S.; Haider, S.I.; Basit, A.; Thoben, K.-D. Real-Time Energy Management and Load Scheduling with Renewable Energy Integration in Smart Grid. Sustainability 2022, 14, 1792. [Google Scholar] [CrossRef]
  30. Gong, H.; Ionel, D.M. Optimization of aggregated EV power in residential communities with smart homes. In Proceedings of the 2020 IEEE Transportation Electrification Conference & Expo (ITEC), Chicago, IL, USA, 23–26 June 2020; IEEE: New York, NY, USA, 2020; pp. 779–782. [Google Scholar]
  31. Xiao, S.; Lei, X.; Huang, T.; Wang, X. Coordinated planning of fast charging station and distribution network based on an improved flow capture location model. CSEE J. Power Energy Syst. 2022, 9, 1505–1516. [Google Scholar]
  32. Zhang, X.; He, S.; Wang, Z.; Zhang, H.; Zhang, Y. Behavior strategy of coal-fired units under different new energy penetration rate. Electr. Power Constr. 2022, 43, 9–17. [Google Scholar]
  33. Zhu, L.; Ji, X.; Tang, L.; Yang, Q.; Niu, P. Robust optimal scheduling with interruptible load based on N-x uncertainty set. Autom. Electr. Power Syst. 2020, 44, 34–42. [Google Scholar]
  34. Zhang, M.; Miao, Y.; Chang, B.; Huang, Z.; Shi, Y. Interruptible load shedding scheme considering load frequency characteristics. Electr. Power Eng. Technol. 2018, 37, 155–160. [Google Scholar]
  35. Loganathan, M.K.; Tan, C.M.; Sultana, S.; Hsieh, I.-Y.L.; Kumaraswamidhas, L.A.; Rai, R.N. Parametric performance analysis of battery operated electric vehicle. In Proceedings of the 2021 International Conference on Sustainable Energy and Future Electric Transportation (SEFET), Hyderabad, India, 21–23 January 2021; pp. 1–6. [Google Scholar]
  36. Loganathan, M.K.; Anandarajah, G.; Tan, C.M.; Msagati TA, M.; Das, B.; Hazarika, M. Review and selection of recycling technology for lithium-ion batteries made for EV application—A life cycle perspective. IOP Conf. Ser. Earth Environ. Sci. 2021, 1100, 012011. [Google Scholar] [CrossRef]
  37. Shao, C.; Li, X.; Qian, T.; Wang, X.; Wang, X. Simulation of EV fast charging load based on traffic Equilibrium. Proc. CSEE 2021, 41, 1368–1376, 1543. [Google Scholar]
  38. Qi, N.; Cheng, L.; Tian, L.; Guo, J.; Huang, R.; Wang, C. Review and prospect of distribution network planning research considering access of flexible load. Autom. Electr. Power Syst. 2020, 44, 193–207. [Google Scholar]
  39. Kaushik, P.; Niranjan, K. Application of MATPOWER for the analysis of congestion in power system network and determination of generator sensitivity factor. Int. J. Appl. Eng. Res. 2017, 12, 969–975. [Google Scholar]
Figure 1. Optimization results in different scenarios.
Sustainability 15 12452 g001
Figure 2. Power flow of heavy and overload sections in different scenarios.
Sustainability 15 12452 g002aSustainability 15 12452 g002b
Figure 3. Output of different power sources in different scenarios.
Sustainability 15 12452 g003
Figure 4. EV cluster charging power curve before and after price incentive.
Sustainability 15 12452 g004
Figure 5. Space transfer of EV clusters.
Sustainability 15 12452 g005
Figure 6. Large-scale interruptible load response situation.
Sustainability 15 12452 g006
Figure 7. EV cluster charging and discharging power curve for different time-of-use prices.
Sustainability 15 12452 g007
Figure 8. Space transfer situation of EV clusters for different region-of-use prices.
Sustainability 15 12452 g008
Table 1. Temporal and spatial distribution of electricity price.
CNY/kWh
Node TypesPeak PriceFlat PriceOff-Peak PriceDischarge Price
Overloaded nodes0.960.60.241.344
Non-overloaded nodes0.60.50.20.86
Table 2. Comparison of optimization results between this method and existing method.
Main Indicators of Calculation ResultsMATPOWERThis MethodComparison
Calculation time/s189.35334.14144.79
Total adjustment cost/CNY 10,000 179.21123.84−55.37
EV adjustment cost/CNY 10,000 101.4473.61−27.83
Interruptible load adjustment cost/CNY 10,000 77.7650.23−27.53
Total generation cost/CNY 10,000 37443635−109
Total electricity consumption/MWh307,483307,245−238
Clean energy generation/MWh293,649293,71263
Proportion of clean energy supply/%95.595.600.1
Thermal power generation/MWh13,83413,533−301
Table 3. Optimization results for different time-of-use prices.
Iterm NameElectricity Price Coefficient and Corresponding Optimization Results
Peak-to-valley price difference multiplier0.50.7511.251.5
Coefficient of section overload1.0371.0371.0371.0371.037
Cost of adjustment/CNY 10,000 33.6150.1266.5682.0199.16
Overall cost of electricity generation/CNY 10,000 37933790378937893801
Total electricity consumption/MWh307,806307,829307,834307,835307,839
Clean energy production/MWh287,883288,339288,450288,471287,432
Improved ratio of clean energy supply/%93.5393.6793.7093.7193.37
Thermal power generation output/MWh19,92319,49019,38319,36420,406
Maximum power output for vehicle-to-grid (V2G) system/MWh290.0373.9403.9403.9433.9
Cumulative V2G electricity consumption/MWh277.8326.0344.5344.3364.1
Table 4. Optimization results in different region-of-use prices.
Iterm NameRegion 1Region 2Region 3Region 4Region 5
Peak power prices for non-heavy-duty nodes/CNY/kWh0.60.690.780.870.96
Regional price difference/CNY/kWh0.360.270.180.090.00
Coefficient of section overload1.0371.0371.0391.0741.074
Adjustment cost/CNY 10,000 66.5670.2275.3276.8979.91
Total generation cost/CNY 10,000 37893789374637873855
Overall power usage/MWh307,834307,840307,875307,850307,844
Clean energy generation/MWh288,450288,496289,036288,681284,850
The proportion of clean energy supply/%93.7093.7293.8893.7792.53
Thermal power units’ electricity generation capacity/MWh19,38319,34518,83819,16922,995
Maximum spatial transfer charging power/MW48.5837.5034.330.000.00
Cumulative space transfer charge/MWh44.0334.9430.520.000.00
Disclaimer/Publisher’s Note: The statements, opinions and data contained in all publications are solely those of the individual author(s) and contributor(s) and not of MDPI and/or the editor(s). MDPI and/or the editor(s) disclaim responsibility for any injury to people or property resulting from any ideas, methods, instructions or products referred to in the content.

