Article

The Role of Green Supply Chain Management Practices on Environmental Performance of Firms: An Exploratory Survey in Brazil

by
Adriano Alves Teixeira
1,2,*,
Tiago E. C. Moraes
1,
Talita Borges Teixeira
1,
Rosane A. G. Battistelle
1,
Elton Gean Araújo
3 and
Quintino Augusto Có de Seabra
1
1
Department of Production Engineering, School of Engineering of Bauru, São Paulo State University (UNESP), Bauru 17033-360, Sao Paulo, Brazil
2
Department of Administration, Business School, Campus II, Federal University of Mato Grosso do Sul (UFMS), Três Lagoas 79613-000, Mato Grosso do Sul, Brazil
3
Department of Administration, Federal University of Mato Grosso do Sul (UFMS), Paranaíba 79500-000, Mato Grosso do Sul, Brazil
*
Author to whom correspondence should be addressed.
Sustainability 2023, 15(15), 11843; https://doi.org/10.3390/su151511843
Submission received: 24 May 2023 / Revised: 22 July 2023 / Accepted: 24 July 2023 / Published: 1 August 2023

Abstract

:
Our work is one of the rare studies that sought to verify the relationship between green supply chain management practices and environmental performance in companies in an emerging Latin American market. We surveyed in the specialized literature on environmental management and green supply chain management (GSCM) for practices were most cited and can influence this relationship. From this review, an e-survey was constructed and answered by 79 environmental or supply chain/logistics managers from the surveyed sample. The results indicate that there is a positive and significant relationship between the adoption of green supply chain management practices and the environmental performance of the companies. We found that GSCM practices: environmental management with total quality (GSCM4), cooperation with suppliers to achieve environmental management objectives (GSCM7), and cross-functional cooperation for environmental improvements (GSCM3), in this order. These are the main GSCM practices that influence the environmental performance in the surveyed companies. Thus, our study adds relevant information to the specialized literature and for the decision-making of managers, professionals, and government working in this area of study.

1. Introduction

The growing environmental awareness poses ever greater challenges to organizations pushing for a balance between economic, environmental, and social performance to achieve sustainable development [1,2]. Governments, communities, and companies consider the degradation of the environment one of the most critical concerns of the contemporary world [3]. The climate crisis has become so severe that its global awareness has become a major incentive for companies to embark on a new carbon-neutral trajectory, forcing them to rethink their supply chain management and environmental performance [4].
In this context and considering that manufacturing industries contribute significantly to this serious global challenge [5], achieving quality economic growth while protecting the environment has become essential [6]; thus, the debate on environmental impacts and the role of organizations, governments, and consumers has grown broadly, provoking more and more the deepening of the discussion [4,7,8,9]. Among the various themes that emerged during these debates, the topic of “greening” of production chains [10], called green supply chain management (GSCM), deserves to be highlighted.
The GSCM considers the environmental influence of business activities in processes that start with the acquisition of raw materials and go to finished products within an organization [11]. Thus, managers of organizations should seek measures to improve their performance, considering green dimensions of the supply chain [12]. Several studies have shown that GSCM is a relevant topic and plays an important role in organizations [13,14]. For example, Appiah et al. [15] found that GSCM practices significantly and positively influenced the environmental performance of 245 companies in Ghana. Ma et al. [16], in a survey of 468 managers of pesticide companies in Pakistan, found a strong, positive, and statistically significant relationship between GSCM practices, institutional pressures, environmental performance, and financial performance highlighting the influence of GSCM practices on environmental performance. Tariq et al. [17] concluded in their research of 220 managers of Pakistani companies that GSCM influences environmental, economic, and operational performance. Kholaif, Xiao, and Hamdy [18] in a study of 517 managers of SMEs, found a positive link between GSCM and the company’s sustainable environmental performance.
Thus, GSCM emerges as a philosophy of organizational practices essential for institutions seeking to become environmentally sustainable and have a competitive advantage [12,19,20], and even though it is a relevant and current issue, the adoption of GSCM practices occurs differently in each country, and it is necessary for the organization to understand the scope in which it is inserted and implement different efforts [21,22]. Thus, even with the advances in research, there is a gap in the subject in emerging markets [15,16,23], being even more eminent in the Latin American scenario [24].
Given this panorama, and that there are few studies available from the Scopus and Web of Science databases involving the reality of Brazilian organizations and that Brazil is among the ten most important world economies and represents approximately 30% of GDP in Latin America [25,26], more research is needed to analyse GSCM practices in this context [23]. Thus, this work has as main objective to identify empirically if there is a positive relationship between GSCM practices and environmental performance (EP) in Brazilian organizations.
Therefore, our problem question is: Are GSCM practices influencing the environmental performance of companies located in Brazil? It is also expected that some variables may exert some kind of influence on the proposed relationship, for example, the size of the company [27,28], the company having ISO certifications [29,30], and the time of foundation of the company [31].
To achieve our research objective and answer this problem question, this work is structured as follows: in addition to this section, Section 2 is the theoretical framework, development of the hypothesis, and control variables, Section 3 materials and methods, Section 4 data analysis and results interpretation, Section 5 discussions and conclusions, and Section 6 implications and future research.

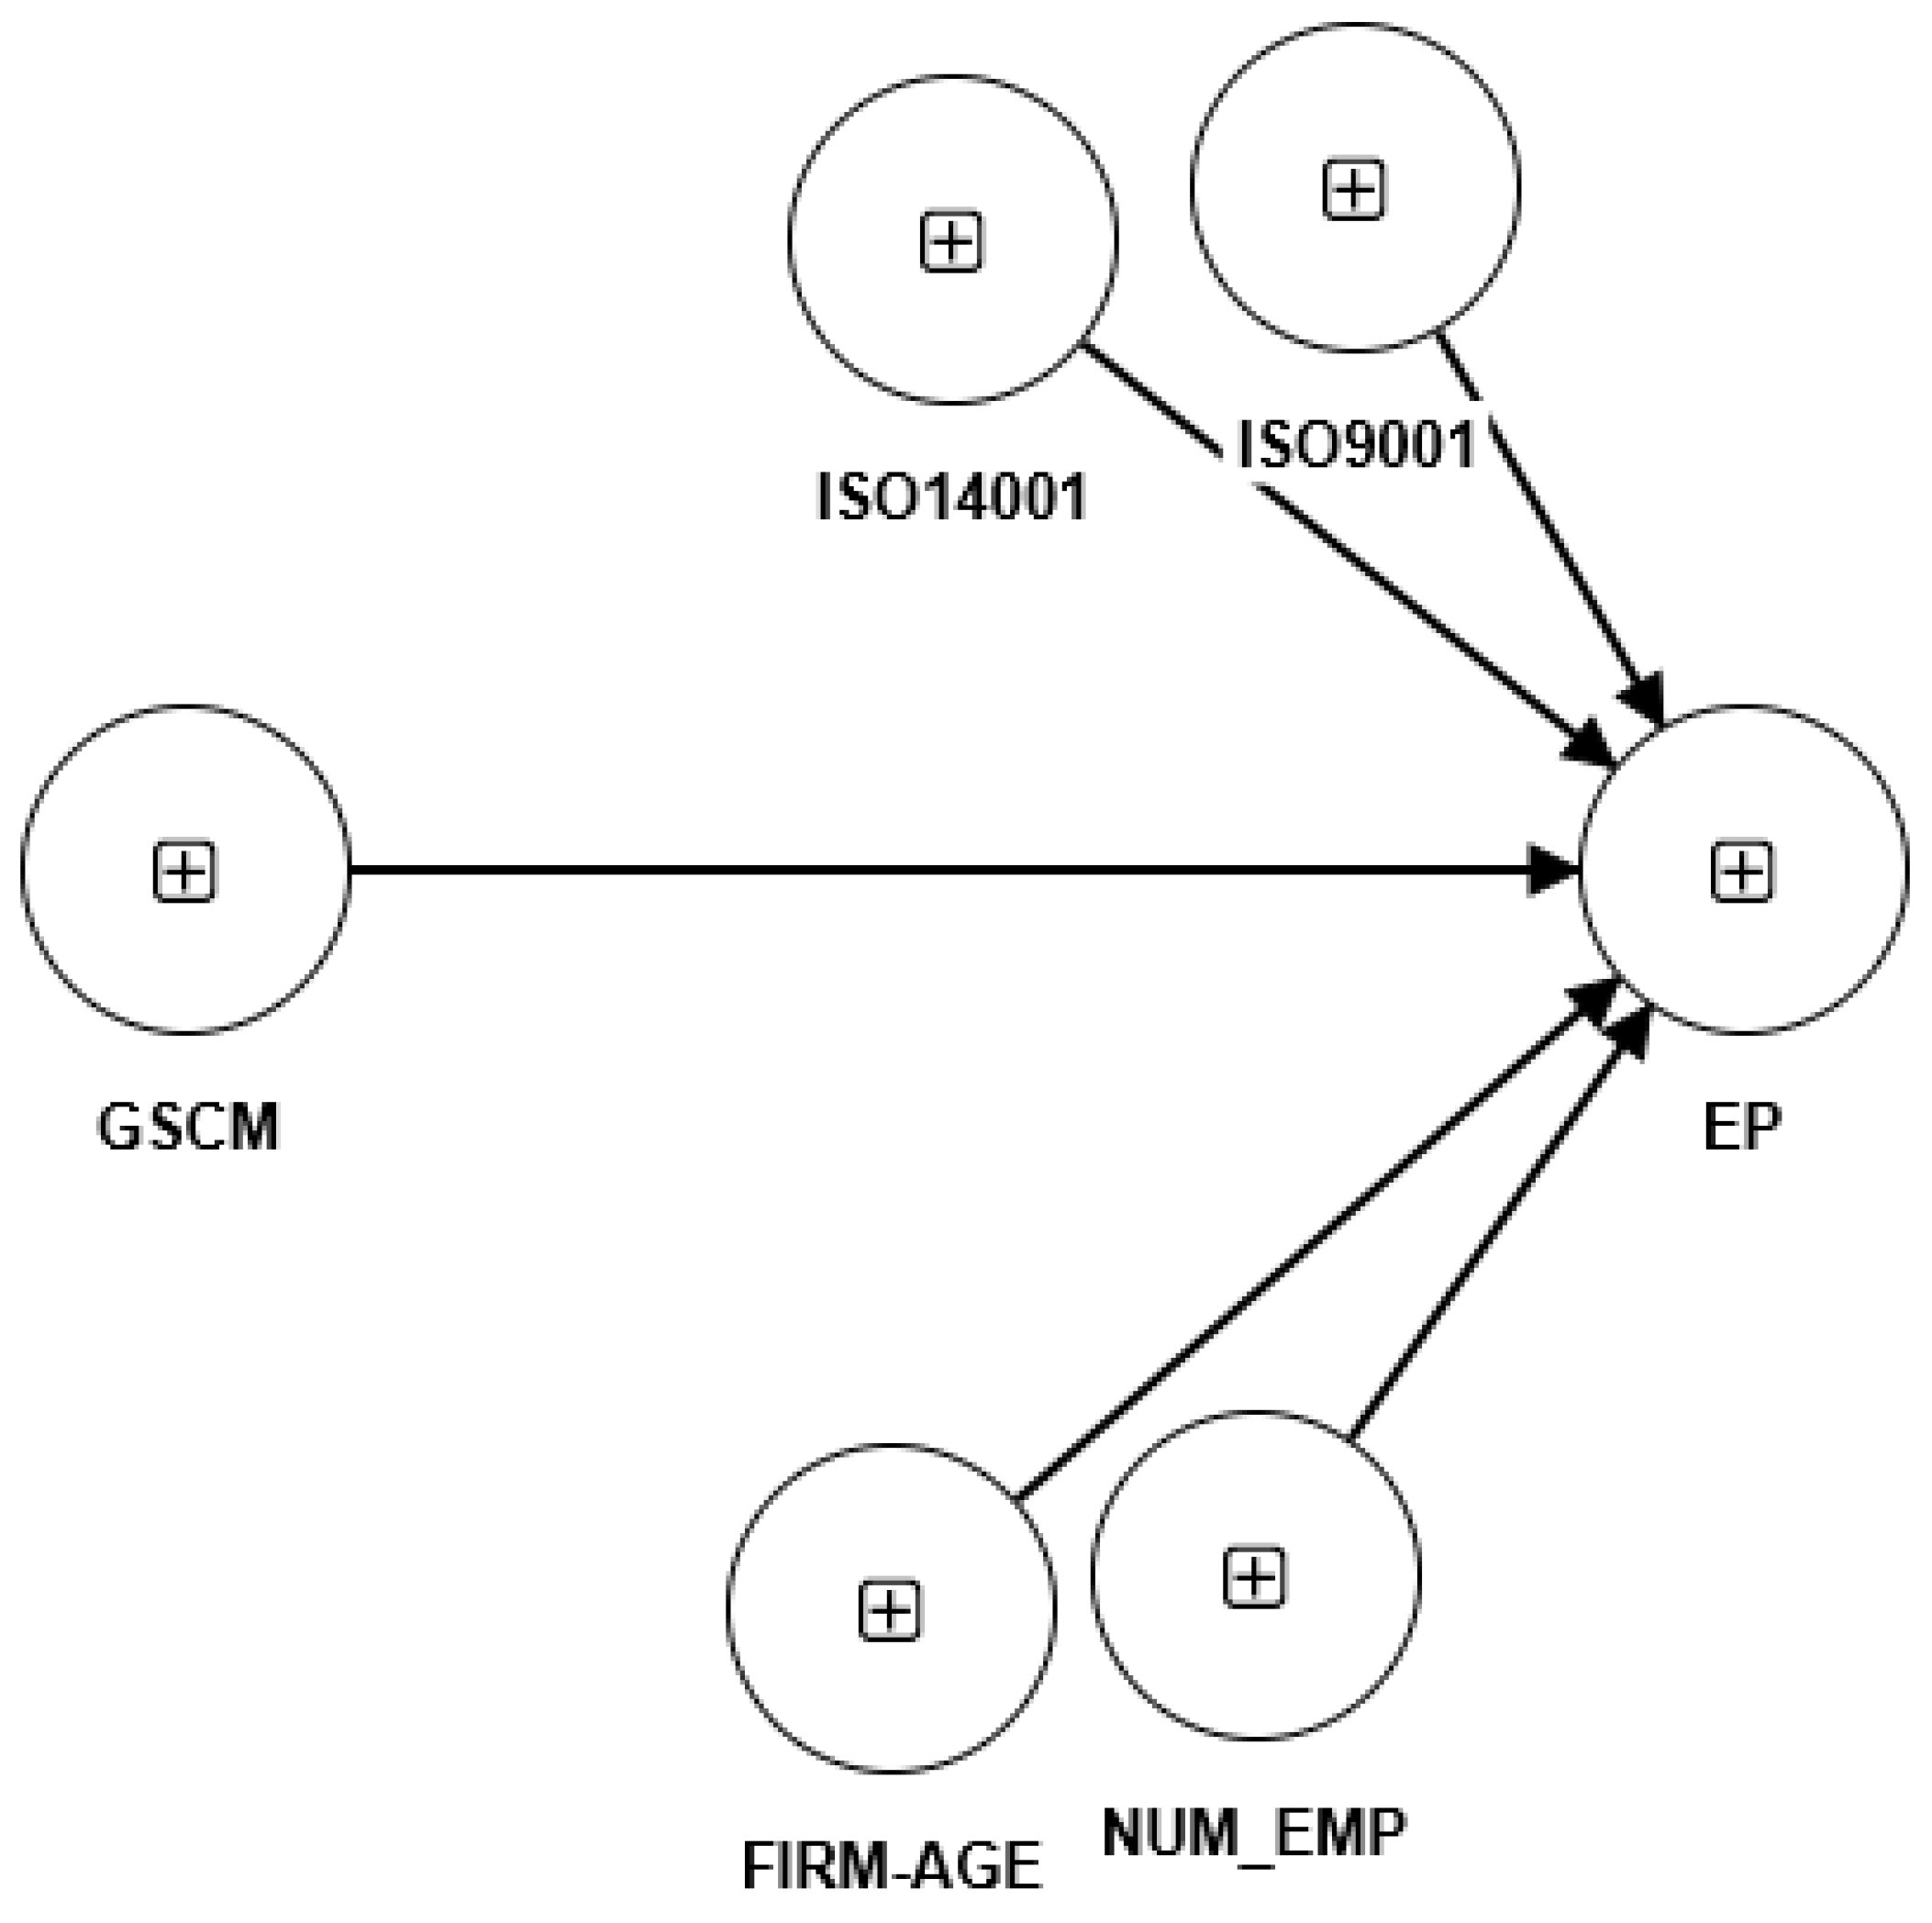
2. Theoretical Frameworks, Development of the Hypothesis, and Control Variables

2.1. Green Supply Chain Management

Organizations are increasingly aware of the environmental impact of their activities, making topics such as green supply chain management stand out as a viable option to reduce the environmental impact of operations, improve their operational performance [32], reduce waste, improve the quality of life of products, and conserve natural resources in order to offer better service to customers [6]. In this sense, GSCM becomes a powerful approach for companies to differentiate their business from the competitors [12].
GSCM is considered a combination of green purchasing, green manufacturing, materials management, green distribution, and reverse logistics [6]; therefore, it consists of applying environmental concerns in the practices of managing a common supply chain [11,32] and is considered an indispensable approach for organizations that aim to become environmentally sustainable [2], increasing their reputation in the market [12]. Dzikriansyah et al. [9] investigated the role of GSCM practices in the environmental performance of 89 small- and medium-sized enterprises in Indonesia. The results indicate that GSCM practices improved the environmental performance of the companies. Fu et al. [33] tested a theoretical model involving the relationship between GSCM, corporate environmental performance, and the mediating role of the market environment, regional culture, and type of industry. The results showed that the GSCM had a positive impact on the environmental performance of the companies studied. Vanalle et al. [32] analyzed the pressures, practices, and performance of GSCM observed in suppliers of an automotive supply chain in Brazil. The research concluded that the economic and environmental performance of the supply chain studied is undoubtedly linked to the adoption of GSCM practices.
Yildiz Çankaya and Sezen [34] contributed to the theme by delving into the impact of eight dimensions of GSCM (green purchasing, green manufacturing, green distribution, green packaging, green marketing, environmental education, internal environmental management, and investment recovery) on economic, environmental, and social performance. The result shows that all dimensions of the GSCM are related to at least one of the performance dimensions, evidencing the importance of the theme in improving environmental performance.
Shaikh, Shahbaz, and Odhano [35] carried out studies with the objective of investigating the impact of GSCM on the environment and operational performance. The work shows that organizations that apply GSCM improve their environmental performance and that the adoption of ecological practices increases customer satisfaction and attraction.
Bag et al. [36] investigated GSCM under the moderating effects of product complexity and purchasing structure. As a result, they found that GSCM positively influences environmental, social, and financial performance aspects.
Amjad et al. [10] investigated in their study the dimensions of GSCM in the environmental, social, and economic performance of 190 respondents from manufacturing companies located in Pakistan. The results demonstrate that all dimensions of GSCM positively affect environmental, social, and economic performance.
Lopes et al. [37], through an exploratory, descriptive, analytical, and quantitative survey, based on 77 questionnaires answered by organizations in the Brazilian automotive sector, identified that GSCM practices influence the success rate of environmental performance of organizations. The authors also argued that the partnership with suppliers was the variable that most affected environmental performance.
Among the most referenced works on GSCM practices is the work of Zhu, Sarkis, and Lai [38] who classify GSCM practices into two types: internal, internal environmental management, eco-design, and investment recovery; and external, green purchasing and cooperation with customers. Thus, for this work we adopted as variables of the GSCM construct the practices proposed by these authors that are presented in Table 1.

2.2. Environmental Performance

In recent decades, issues such as air pollution [40], climate change [41], and the increase in solid waste generation [42], have been aggravated due to population growth and urbanization [43]. Thus, the issues associated with sustainability have increased considerably, receiving greater attention from academics, professionals in the field, and governments [44,45,46].
Allied to these challenges and considering that organizations are considered the “reproductive vectors” of these challenges [47] and the need to acquire a new environmental posture due to the pressure of stakeholders, for example, the awareness of the population [4,48] and also the discovery that adherence to environmental issues can bring benefits related to competitive advantage [19,20,40], organizations are increasingly engaging in environmental management practices.
Pane Haden, Oyler, and Humphreys [49] considers environmental management (GA) a process of innovation, adoption, and development of environmental strategies in order to acquire competitive advantage, make the company sustainable, reduce waste generation, and promote social responsibility. Montabon, Sroufe, and Narasimhan [50] consider environmental management as “the techniques, policies and procedures that companies use specifically to monitor and control the impact of their operations on the natural environment.”
Thus, environmental management arises to join efforts to minimize negative environmental impacts caused by organizations, which can lead to superior environmental performance [51]. It is understood, therefore, that environmental performance is a consequence of environmental management and can be understood as the demonstration of the level of environmental commitment that companies adopt through environmental management measures and attitudes [52], and that the adoption of an environmental management system can help companies improve their environmental performance [53]. In other words, environmental performance can be considered the ability of an organization to reduce emissions, waste, and consumption of hazardous and toxic materials and the frequency of environmental accidents [9,54], reduce operating costs, improve resource utilization, and gain access to more market opportunities [40].
Environmental performance has been the focus of several academic studies under different strands and perspectives, for example, Cho, Cho, and Lee [55] addressed how managerial characteristics can impact the company’s environmental performance (EP). Bakhsh Magsi et al. [43] analyzed how organizational culture influences environmental performance. Ramanathan [56] argued in his study that good environmental performance generates competitive advantage and positively impacts the financial performance of the organization. Hartmann and Vachon [57] proposed a positive relationship between environmental management and environmental performance. Russo, Pogutz, and Misani [28] found in their study that companies with a strong environmental performance benefit from cost reduction and therefore improve their financial performance and increase the company’s market value in the short (and medium and long term). Benkraiem et al. [58] found that better environmental performance and more green innovation positively affect the financial performance of companies.
It is perceived that analyzing the environmental performance of organizations and what contributes to their improvement is of vital importance for environmental sustainability. In this sense, aiming to identify in the literature what characterizes a good environmental performance, this work sheds light on the literature and identifies the variables that were most used to measure environmental performance in organizations. Briefly, we present in Table 2 the main variables identified in the literature review and adopted in this work.

2.3. Theory, Hypothesis, and Control Variables of the Research

For the construction of our research hypothesis, we based it on the literature review carried out and on the Theory of Ecological Modernization. We understand that the lens of TEM can contribute to improving sustainable development and support advanced environmental management practices through industrial innovations based on the most efficient use of resources and advanced GSCM practices. In addition, TEM has been used in the construction and development of conceptual and analytical models and in the analysis of empirical data for the advancement of GSCM research and to enhance the development of the circular economy [74]. For example, Huang et al. [75] conducted a survey of 300 Taiwanese electrical and electronics companies, seeking to integrate GSCM, sustainable supply chain management (SSCM), sustainable green supply chain management (SGSCM), and ecological modernization (EM) theory. The results demonstrate that awareness and pressure to engage in MS significantly affected the SGSCM and that the SGSCM significantly influenced sustainability performance.
Thus, taking into account that the specialized literature (see Section 2.1 and Section 2.2) supports that GSCM practices can influence the environmental performance of organizations, we seek evidence in an emerging market, where little research has been conducted and it is important for sustainable development to know how organizations in these countries are achieving their economic goals [76], and whether GSCM practices are influencing the environmental performance of companies located in Brazil. Therefore, our research hypothesis is that:
H1: 
GSCM practices positively influence the environmental performance of organizations located in Brazil.
In addition, we hope to point out the most relevant GSCM practices that influence EP and identify whether the size of the company [27,28,77], the company having ISO certifications [29,30], and the time of foundation of the company [31] can influence this relationship. The control variables in Figure 1 demonstrate our framework.

3. Materials and Methods

This research had as a main objective to identify, empirically, if there is a positive relationship between green supply chain management (GSCM) practices and environmental performance (EP) in Brazilian organizations. Therefore, the conceptual model framework (Figure 1) was proposed, opting for an exploratory and quantitative research approach.

3.1. Research Method

For this research, we adopted the survey research method that consists of a survey of data with people in organizations where the phenomenon that one wishes to study has been occurring. The survey method has been gaining more and more importance at the international level [78] and is adequate for the objectives of our research.

3.2. Data Collection Instrument

For the construction of the data collection instrument of this research, we relied on the literature review and were inspired by studies that discussed/validated its variables (see Section 2); in addition, the questionnaire applied followed the steps proposed by Synodinos [78] and had four distinct and complementary parts: (a) invitation with the description of the research, its objectives, guarantee of anonymity and importance of the company’s participation; (b) industrial sector of the company, number of employees of the unit, time of existence of the company and if it had a management system certified in ISO 14001 [39] and ISO 9001 [79] (with answers like: yes or no—control variables); (c) and eighteen assertions that portrayed the GSCM (Table 1) construct and (d) twelve assertions with items related to EP (Table 2). The assertions of GSCM and EP were presented on a five-point Likert scale to measure the degree of agreement or disagreement of people regarding the statements [80], respectively, we had for GSCM “1 not implemented”, “2 starting to implement”, “3 partially implemented”, “4 considerably implemented”, and “5 completely implemented” and for EP “1 to strongly disagree”, “2 disagree”, “3 neither agree nor disagree”, “4 agree”, and “5 strongly agree”.
Finally, the questionnaire was sent for content validation to five researchers in the area and some correct answers were provided. Then, a pre-test was performed interactively with five companies from the study group’s database (they did not participate in the final sample), providing a continuous improvement of the questionnaire [78].

3.3. Sample Composition and Respondents

Our sample is random and included companies located in Brazil from various segments, with and without ISO 14001 and ISO 9001 certification, of different sizes and years of existence, because as already discussed in the conceptual foundation, such variables can interfere in the results of the research. Thus, we used to compose the universe of companies that participated in the sample, a particular database of one of the authors of this article from previous research.
As we sought information from a specific group of professionals, the survey questionnaire was sent to environmental or supply chain/logistics managers of 963 companies.

3.4. Data Collection

We sent the survey questionnaire during the months of November 2019 to March 2020, and the email was sent twice a month (excluding the companies/managers who had already responded). To ensure a higher response rate, we made phone calls and in total received 79 fully answered questionnaires (8.2% return). Before finishing the field research, we verified the adequacy of the sample through the software G*Power 3.1 [81] following the recommendations of Cohen [82] and Hair et al. [80] which proved to be adequate. Moreover, according to simulated studies by Henseler et al. [83], the method of estimating the parameters via partial least squares, which is the case of this study, can be used to estimate complex models or when the number of observations is less than the number of variables (manifest or latent) or the number of parameters of the model; therefore, this method can be applied in many cases of small samples when the other methods fail. For Willaby et al. [84], the partial least squares method can achieve a desirable level of statistical power with much less data compared with estimation methods that assume distributive assumptions.

3.5. Data Analysis

Data were analyzed using structural equation modeling, a second-generation multivariate statistical approach that allows the analysis of more complex conceptual models; and this type of modeling as an alternative to traditional methods is justified by providing the researcher with the ability to accommodate multiple interrelated dependency relationships in a single model [85,86].
The model of structural equations is a generalized modeling technique, whose objective was to test and validate the theoretical model, which defines causal and hypothetical relationships between the questions studied. Such relationships were measured by the parameters of the model that represent the size of the effect of the independent attributes on the dependent attributes [87].
To estimate the parameters of the structural equation model, the partial least squares method (PLS-SEM) was used, in which the explained variance of the constructs is maximized by estimating relationships of partial models in an interactive sequence of ordinary least squares [88]. According to Ravand and Baghaei [89], this estimation method is advantageous in cases where data are not normally distributed and have small sample sizes.
Raikov and Marcoulides [90]; Marôco [87]; Kline [91] and Rodrigues, Alves, and Silva [92] defined the structural equations model as two sub models; a measurement sub model, often used to examine patterns of interrelationships between various constructs, in which each construct included in the model is usually measured by a set of observed indicators (Questions); a structural regression model, similar to confirmatory factor analysis models, except that they also postulate particular relationships between the constructs (regressions), rather than considering them merely interconnected.
Because it is a reflective measurement model (the questions are caused by the respective construct), internal consistency and validity were evaluated [93] from the following specific measures (see Table 1): composite/rho_A reliability (to assess internal consistency), convergent validity, and discriminant validity (to calculate model validity) [94]. To calculate the convergent validity, the individual reliability indicator and the extracted mean variance were used (AVE). Furthermore, the criteria for Fornell–Larcker criterion of correlation rates heterotrait–monotrait ratio (HTMT) and cross-loads was used to evaluate the discriminant validity [93].
Subsequently, the measures of quality of fit of the structural regression model were evaluated as follows: evaluation of Pearson’s determination coefficients (R2), adjusted R2, effect size (f2), predictive validity (Q2), and variation inflation factor (VIF).
Finally, the bootstrapping technique was used to evaluate the significance (p-value) of the external loads (measurement models), as well as the parameters of the structural regression model. For this purpose, 5000 subsamples were used and a significance level of 5% was represented by the bootstrapping confidence intervals, as well as by the student’s t-test and the p-value. The confidence intervals of the external loads or structural model parameters can be used in a similar way to the t-statistic and the intervals excluding zero are statistically significant; a benefit of the confidence intervals is that the dichotomous approach of the significance test is avoided and the authors can consider other methods to identify practically significant indicator loads when using confidence intervals [95,96]. All these calculations and their coefficients are presented in the next section. The computational tasks were performed using SmartPLS 4.0 software.

4. Data Analysis and Results Interpretations

Before the data collected are analyzed, we tested non-response bias and common method bias that have become standard metrics in reporting the results of the partial least squares (PLS) analysis [97]. We examined non-response bias to ensure that our sample has the same characteristics with those who did not take part in the survey by comparing the respondents who responded early with the late respondents after cut-off date. Our results did not find any significant differences between early and late responders. In addition, our results indicate the response rate similar across subgroups and we found missing values as missing completely at random (MCAR) support the t-test result before, which means, our data are free of non-response bias.
We also assessed the common method bias to avoid measurement errors due to correlations of items that measure constructs in the same way using the average Full Collineariy VIF [98]. Our analysis results obtained AFVIF < 3.3, which means the common method bias cannot interfere with our results.
Finally, before starting to present the results related to the adopted framework, we performed some initial analyses to demonstrate the profile of the responding companies. Table 3 presents the main characteristics of these companies, such as: number of employees, time since foundation, if the company has ISO 14001 and ISO 9001 certifications (it is worth mentioning that the number of companies can be greater than the number of respondents (79) because the same company can have more than one certification), and the sector in which it operates. In addition, we found that the most representative sectors in our research were the services sector (health, education, finance, road administration, logistic services, and passenger transport) metallurgy (manufacturer of parts, components, and equipment in general) and auto parts with 25.32% of the companies, 20.25% and 18.99% of the companies, respectively, being the most representative sectors in our research corresponding to a total of 64.56% of the sample.
In the sequence, Table 4 presents the measures of convergent validity and composite reliability of the measurement model. As already mentioned, the adjusted measurement model was defined as reflective, that is the GSCM and EP constructs being the cause of the observed questions.
Reliability Composite Values/rho_A above 0.70 are considered satisfactory [85]. In addition, the external loads must be at least 0.60 (so the variables were removed from the model GSCM 9, GSCM 14, GSCM 16, GSCM 17 e GSCM 18 and EP8, EP9 e EP10), the values of AVE must be greater than or equal to 0.50, indicating that, on average, the construct explains at least half of the variation in its indicators [74]. From the results (Table 4 and Figure 2), it can be seen that the constructs GSCM and EP have convergent validity and adequate composite reliability in relation to the measurement model.
Also in the measurement model, the discriminant validity was verified. The criterion of Fornell–Larcker compares the square root of the CVA values with the correlations of the latent variables. Specifically, the square root of the CVA of each construct must be greater than the highest correlation with any other construct (values on the main diagonal must be greater than the values outside the main diagonal, see Table 5). The logic of this method is based on the idea that a construct is more aligned with its associated indicators than with any other construction [93]. The results (Table 5) show that the model has discriminant validity within the parameters suggested by the literature.
The criterion of heterotrait–monotrait ratio (HTMT) correlation rates was also used to evaluate the discriminant validity latent variable level (Table 6). The results showed that all pairs of dimensions were below 0.85, which meets the precepts of Hair Jr. et al. [93].
Finally, Table 7 presents the criterion of cross-loadings to evaluate the discriminant validity item level (variables). As noted, the highest factor loadings of the items (variables) are in their own latent variables.
For the structural model (structural regression), one can see the measures of quality of fit in Table 8. The values R2 e R2_Adjusted indicate how much of the variance of the constructs (endogenous variables, i.e., response variable in the structural regression model), which is explained by the structural model are within the reference values. The same is true of predictive validity (Q2 = 0.307), This means that the predictors in the model can explain the variation in the dependent variable [82,99].
The value of the effect size (f2), used to evaluate how much each construct is useful for the adjustment of the model, it was 0.669 for GSCM, considered satisfactory [93], indicating that this construct is useful for adjusting the model [99]. However, the control variables of our model: firm age, firm size, ISO 14001, and ISO 9001 presented effect size: 0.000, 0.072, 0.005, and 0.041, respectively, considered unsatisfactory [93] and indicating that these variables are not useful for adjusting the model [99].
Related to Table 8, the last column shows the inflation factor of the variance (VIF), that detects multicollinearity (when there is a strong correlation between the predictive variables; high values have a negative impact on the adjustment of the structural regression model). Ghozali and Latan [100] found that the VIF must be less than 3.3. This research showed VIF equal to 1275, which is considered adequate and without collinearity (it was decided to consider this measure in the summary of the adjustment result, although there is only one predictor).
Finally, through the bootstrapping procedure with 5000 subsamples generated, the significance of the parameter (structural coefficients) of the structural regression model was evaluated by means of the statistics of the student’s “t” hypothesis test and the value of “p”, with a significance level of 5%. It is noticed that the value found for the statistics of the student’s t-test was 8.444 (higher than the critical t, for the bilateral test, with 5% significance; 1.96) and the value “p” was 0.000 (<0.001) [93] (see Table 9 and Figure 3).
Table 10 shows the confidence intervals derived from the nonparametric bootstrap. The significance of the structural coefficients occurs when the interval does not contain zero, which corroborates the results of the previous table.
According to the view of the measures of quality of fit of the measurement model and structural regression (Table 4, Table 5, Table 6 and Table 7), and significance test of the parameter of the structural regression model (Table 8, Table 9 and Table 10), the proposed model was considered valid and accepted and it can be concluded that there is a positive and significant effect of green supply chain management practices on environmental performance.

5. Discussions and Conclusions

The main purpose of this study was determining whether the green supply chain management practices influence positively the environmental performance by Brazilian companies and identify which are the GSCM practices that most influence the environmental performance of these companies and to verify whether the control variables size and time of existence of the company and the ISO 9001, ISO 14001 certification are significant in the proposed framework.
As a result, there was a positive and significant relationship between GSCM and the environmental performance, as well it was suggested that the practices of: (a) environmental management with total quality (GSCM4); (b) cooperation with suppliers to achieve environmental management objectives (GSCM7); and (c) cross-functional cooperation for environmental improvements (GSCM3), in this order, tend to be the most important improvement to the organizations environmental performance. However, both the ISO 9001, ISO14001 certification, firm size, and time of existence of the company in our framework were not statistically significant.
Thus, the hypothesis that the adoption of GSCM practices is positively influencing the environmental performance of Brazilian companies was confirmed. These results are supported by the specialized GSCM literature that finds similar results, e.g., Vanalle et al. [32] studied 41 companies in the Brazilian automotive sector and among their results found out that GSCM practices influenced the environmental performance of these organizations. Saeed et al. [2] conducted 269 interviews with managers in the manufacturing sector in Pakistan and found out that GSCM practices have a significant influence on the environmental performance of organizations.
However, the results did not confirm (at the significance level of 5%) that the size and time of existence of the company, as well as the company having ISO 9001 and/or ISO 14,001 certification are variables that can affect the proposed model. Similar results were found, for example, in the company size in Teixeira et al. [101], the authors identified in a study with 95 companies in Brazil that the variable control company size was not significant in the relationship between green training and GSCM practices. This is a contrary result to the research by De Souza Jabbour et al. [29] for ISO 14001 certification which proved to be an important variable for the maturity of environmental management and for environmental performance in the companies studied.
Thus, it can be concluded, mainly in Brazil, that size and time of existence of the company, as well as the company having ISO 9001 and/or ISO 14001 certification are variables that need more research for a better development of this area of studies.

6. Implications and Future Research

6.1. Theoretical Implications

This research is important for the literature on GSCM and environmental management, as it helps fill an important knowledge gap about GSCM practices, and their influence on environmental performance. Studies of this nature are welcome, as there is a need to know more about GSCM in Latin/South America [102,103]. We confirm that GSCM practices significantly influence the environmental performance of companies located in Brazil, it adds more empirical evidence on the subject in the context of an emerging market that is very little studied. In addition, we present the most relevant GSCM practices to improve the environmental performance of companies.
Our results also indicate the importance of the variables ISO 14001, ISO 9001, company size, and time of existence of the company remain inconclusive regarding their impact on the environmental performance of organizations, and therefore require further research, especially in emerging markets like Brazil.

6.2. Practical Implications

Our results have important practical implications for companies and their professionals, since they allow the prioritization and investment in practices and strategies that can really allow a better environmental performance. In addition, through our literature review, we obtained a knowledge base that can be useful for consultation by supply chain and environmental managers.

6.3. Limitations and Suggestions for Future Research

This research has some limitations: (a) despite all efforts, the sample size was not as large; however, it approaches the statistical and methodological requirements and is in line with similar studies [101,104]; and (b) environmental performance may depend on other factors, not just GSCM, such as legal and regulatory requirements [105], green human resources practices [106], or lean manufacturing practices [107].
Thus, future research that explores various case studies, so that it is possible to understand much better “how” and “why” this relationship occurs would be welcome, as it can provide new insights on the subject. Further studies can also evaluate more complex models, with more variables that can influence the environmental performance or their implications for the financial and operational performance in the Brazilian organizations or emerging markets.
Finally, as we did not find any statistical significance for the control variables adopted in our model: size and time of existence of the company and for the ISO 14001, and ISO 9001 certification variables, we suggest that further research use these control variables to build a much more robust theoretical basis for the reality of those companies located in emerging markets like Brazil.

Author Contributions

Conceptualization, A.A.T., T.B.T. and T.E.C.M.; methodology, A.A.T. and E.G.A.; software, A.A.T.; validation, A.A.T. and E.G.A.; formal analysis, A.A.T., T.E.C.M., T.B.T. and R.A.G.B.; investigation, A.A.T., T.B.T., R.A.G.B., Q.A.C.d.S. and T.E.C.M.; data curation, A.A.T. and T.E.C.M.; writing—original draft preparation, A.A.T., T.E.C.M., T.B.T., R.A.G.B., E.G.A. and Q.A.C.d.S.; writing—review and editing, A.A.T., R.A.G.B., E.G.A. and T.B.T.; funding acquisition, R.A.G.B. All authors have read and agreed to the published version of the manuscript.

Funding

This research received no external funding.

Institutional Review Board Statement

Ethical review and approval were waived for this study due to REASON: it is not possible to identify the company, or the employees involved in the research.

Informed Consent Statement

Not applicable.

Data Availability Statement

Not applicable.

Acknowledgments

The authors thank the anonymous managers who kindly responded to our inquiries.

Conflicts of Interest

The authors declare no conflict of interest.

References

  1. Al-Sheyadi, A.; Muyldermans, L.; Kauppi, K. The complementarity of green supply chain management practices and the impact on environmental performance. J. Environ. Manag. 2019, 242, 186–198. [Google Scholar] [CrossRef] [PubMed]
  2. Saeed, A.; Rasheed, F.; Waseem, M.; Tabash, M.I. Green human resource management and environmental performance: The role of green supply chain management practices. Benchmarking Int. J. 2021, 29, 2881–2899. [Google Scholar] [CrossRef]
  3. Sundram, V.P.K.; Bahrin, A.S.; Othman, A.A.; Munir, Z.A. Green supply chain management practices in Malaysia manufacturing industry. Int. J. Supply Chain. Manag. 2017, 6, 89–95. [Google Scholar]
  4. Khan, N.U.; Anwar, M.; Li, S.; Khattak, M.S. Intellectual capital, financial resources, and green supply chain management as predictors of financial and environmental performance. Environ. Sci. Pollut. Res. 2021, 28, 19755–19767. [Google Scholar] [CrossRef] [PubMed]
  5. Khan, S.A.R.; Yu, Z.; Sharif, A.; Golpîra, H. Determinants of economic growth and environmental sustainability in South Asian Association for Regional Cooperation: Evidence from panel ARDL. Environ. Sci. Pollut. Res. 2020, 27, 45675–45687. [Google Scholar] [CrossRef]
  6. Dong, Z.; Tan, Y.; Wang, L.; Zheng, J.; Hu, S. Green supply chain management and clean technology innovation: An empirical analysis of multinational enterprises in China. J. Clean. Prod. 2021, 310, 127377. [Google Scholar] [CrossRef]
  7. Zhou, H.; Yang, Y.; Chen, Y.; Zhu, J. Data envelopment analysis application in sustainability: The origins, development, and future directions. Eur. J. Oper. Res. 2018, 264, 1–16. [Google Scholar] [CrossRef]
  8. Gelderman, C.J.; Semeijn, J.; Vluggen, R. Development of sustainability in public sector procurement. Public Money Manag. 2017, 37, 435–442. [Google Scholar] [CrossRef]
  9. Dzikriansyah, M.A.; Masudin, I.; Zulfikarijah, F.; Jihadi, M.; Jatmiko, R.D. The role of green supply chain management practices on environmental performance: A case of Indonesian small and medium enterprises. Clean. Logist. Supply Chain. 2023, 6, 100100. [Google Scholar] [CrossRef]
  10. Amjad, A.; Abbass, K.; Hussain, Y.; Khan, F.; Sadiq, S. Effects of the green supply chain management practices on firm performance and sustainable development. Environ. Sci. Pollut. Res. 2022, 29, 66622–66639. [Google Scholar] [CrossRef]
  11. Meng, Q.; Li, M.; Liu, W.; Li, Z.; Zhang, J. Pricing policies of dual-channel green supply chain: Considering government subsidies and consumers’ dual preferences. Sustain. Prod. Consum. 2021, 26, 1021–1030. [Google Scholar] [CrossRef]
  12. Azadi, E.; Moghaddas, Z.; Saen, R.F.; Mardani, A.; Azadi, M. Green supply chains and performance evaluation: A multiplier network analytics model with common set of weights. J. Clean. Prod. 2023, 411, 137377. [Google Scholar] [CrossRef]
  13. AlZgool, M.; Ahmed, U.; Shah, S.; Alkadash, T.; AlMaamary, Q. Going green during COVID-19: Examining the links between green HRM, green supply chain and firm performance in food Industry of Bahrain: The moderating role of lockdown due to COVID-19. Uncertain Supply Chain. Manag. 2021, 9, 79–88. [Google Scholar] [CrossRef]
  14. Das, G.; Li, S.; Tunio, R.A.; Jamali, R.H.; Ullah, I.; Fernando, K.W.T.M. The implementation of green supply chain management (GSCM) and environmental management system (EMS) practices and its impact on market competitiveness during COVID-19. Environ. Sci. Pollut. Res. 2023, 30, 68387–68402. [Google Scholar] [CrossRef] [PubMed]
  15. Appiah, M.K.; Odei, S.A.; Kumi-Amoah, G.; Yeboah, S.A. Modeling the impact of green supply chain practices on environmental performance: The mediating role of ecocentricity. Afr. J. Econ. Manag. Stud. 2022; ahead-of-print. [Google Scholar] [CrossRef]
  16. Ma, X.; Akhtar, R.; Akhtar, A.; Hashim, R.A.; Sibt-e-Ali, M. Mediation effect of environmental performance in the relationship between green supply chain management practices, institutional pressures, and financial performance. Front. Environ. Sci. 2022, 1196, 972555. [Google Scholar] [CrossRef]
  17. Tariq, M.I.; Abbass, K.; Chebbi, K.; Hussain, Y. Assessing the role of green supply chain management in enhancing Pakistan manufacturers’ performances. Environ. Sci. Pollut. Res. 2023, 30, 78495–78506. [Google Scholar] [CrossRef]
  18. Kholaif, M.M.N.H.K.; Xiao, M.; Hamdy, A. COVID-19’s effect on green supply chains and environmental sustainability; innovative technologies moderation. J. Clean. Prod. 2023, 406, 137083. [Google Scholar] [CrossRef]
  19. Kazancoglu, Y.; Kazancoglu, I.; Sagnak, M. A new holistic conceptual framework for green supply chain management performance assessment based on circular economy. J. Clean. Prod. 2018, 195, 1282–1299. [Google Scholar] [CrossRef]
  20. Cousins, P.D.; Lawson, B.; Petersen, K.J.; Fugate, B. Investigating green supply chain management practices and performance: The moderating roles of supply chain ecocentricity and traceability. Int. J. Oper. Prod. Manag. 2019, 39, 767–786. [Google Scholar] [CrossRef]
  21. Bonera, M.; Corvi, E.; Codini, A.P.; Ma, R. Does nationality matter in eco-behaviour? Sustainability 2017, 9, 1694. [Google Scholar] [CrossRef] [Green Version]
  22. Lavuri, R.; Akram, U.; Akram, Z. Exploring the sustainable consumption behavior in emerging countries: The role of pro-environmental self-identity, attitude, and environmental protection emotion. Bus. Strategy Environ. 2023; early view. [Google Scholar] [CrossRef]
  23. Rahman, H.U.; Zahid, M.; Al-Faryan, M.A.S. ESG and firm performance: The rarely explored moderation of sustainability strategy and top management commitment. J. Clean. Prod. 2023, 404, 136859. [Google Scholar] [CrossRef]
  24. Bendul, J.C.; Rosca, E.; Pivovarova, D. Sustainable supply chain models for base of the pyramid. J. Clean. Prod. 2017, 162, S107–S120. [Google Scholar] [CrossRef]
  25. Jabbour, C.J.C.; Jabbour, A.B.L.D.S. Latin America: Research opportunities on management for sustainable development. Lat. Am. J. Manag. Sustain. Dev. 2014, 1, 1–6. [Google Scholar] [CrossRef]
  26. Pohlmann, C.R.; Scavarda, A.J.; Alves, M.B.; Korzenowski, A.L. The role of the focal company in sustainable development goals: A Brazilian food poultry supply chain case study. J. Clean. Prod. 2020, 245, 118798. [Google Scholar] [CrossRef]
  27. Murillo-Luna, J.L.; Garcés-Ayerbe, C.; Rivera-Torres, P. Barriers to the adoption of proactive environmental strategies. J. Clean. Prod. 2011, 19, 1417–1425. [Google Scholar] [CrossRef]
  28. Russo, A.; Pogutz, S.; Misani, N. Paving the road toward eco-effectiveness: Exploring the link between greenhouse gas emissions and firm performance. Bus. Strategy Environ. 2021, 30, 3065–3078. [Google Scholar] [CrossRef]
  29. de Sousa Jabbour, A.B.L.; Jabbour, C.J.C.; Latan, H.; Teixeira, A.A.; de Oliveira, J.H.C. Quality management, environmental management maturity, green supply chain practices and green performance of Brazilian companies with ISO 14001 certification: Direct and indirect effects. Transp. Res. Part E Logist. Transp. Rev. 2014, 67, 39–51. [Google Scholar] [CrossRef]
  30. González-Benito, J.; Lannelongue, G.; Queiruga, D. Stakeholders and environmental management systems: A synergistic influence on environmental imbalance. J. Clean. Prod. 2011, 19, 1622–1630. [Google Scholar] [CrossRef]
  31. Sørensen, J.B.; Stuart, T.E. Aging, obsolescence, and organizational innovation. Adm. Sci. Q. 2000, 45, 81–112. [Google Scholar] [CrossRef] [Green Version]
  32. Vanalle, R.M.; Ganga, G.M.D.; Godinho Filho, M.; Lucato, W.C. Green supply chain management: An investigation of pressures, practices, and performance within the Brazilian automotive supply chain. J. Clean. Prod. 2017, 151, 250–259. [Google Scholar] [CrossRef]
  33. Fu, L.; Yang, D.; Liu, S.; Mei, Q. The impact of green supply chain management on enterprise environmental performance: A meta-analysis. Chin. Manag. Stud. 2023, 17, 274–289. [Google Scholar] [CrossRef]
  34. Yildiz Çankaya, S.; Sezen, B. Effects of green supply chain management practices on sustainability performance. J. Manuf. Technol. Manag. 2019, 30, 98–121. [Google Scholar] [CrossRef]
  35. Shaikh, F.A.; Shahbaz, M.S.; Odhano, N. A short review on green supply chain management practices. Eng. Technol. Appl. Sci. Res. 2020, 10, 5367–5370. [Google Scholar] [CrossRef]
  36. Bag, S.; Gupta, S.; Kumar, S.; Sivarajah, U. Role of technological dimensions of green supply chain management practices on firm performance. J. Enterp. Inf. Manag. 2021, 34, 1–27. [Google Scholar] [CrossRef]
  37. Lopes, L.J.; Sacomano Neto, M.; Silva, E.M.D.; Lopes, F.C.D.C. Influência das Práticas do Green Supply Chain Management no Desempenho Ambiental das Empresas do Setor Automotivo Brasileiro; XXXVII Encontro da Associação Nacional de Pós-Graduação e Pesquisa em Administração: Rio de Janeiro, Brazil, 2013. [Google Scholar]
  38. Zhu, Q.; Sarkis, J.; Lai, K.H. Confirmation of a measurement model for green supply chain management practices implementation. Int. J. Prod. Econ. 2008, 111, 261–273. [Google Scholar] [CrossRef]
  39. ISO 14001; Criteria for Environmental Management System. The International Organization for Standardization: London, UK, 2015.
  40. Jin, X.; Wu, W.; Lei, X. Can digital investment improve corporate environmental performance?––Empirical evidence from China. J. Clean. Prod. 2023, 414, 137669. [Google Scholar] [CrossRef]
  41. Amirteimoori, A.; Allahviranloo, T.; Zadmirzaei, M.; Hasanzadeh, F. On the environmental performance analysis: A combined fuzzy data envelopment analysis and artificial intelligence algorithms. Expert Syst. Appl. 2023, 224, 119953. [Google Scholar] [CrossRef]
  42. Dung, M.D.; Mankilik, M.; Ozoji, B.E. Assessment of College Students’ Knowledge and Attitudes Towards Solid Waste Management in North Central Zone of Nigeria. Sci. Educ. Int. 2017, 28, 141–146. [Google Scholar] [CrossRef]
  43. Bakhsh Magsi, H.; Ong, T.S.; Ho, J.A.; Sheikh Hassan, A.F. Organizational culture and environmental performance. Sustainability 2018, 10, 2690. [Google Scholar] [CrossRef] [Green Version]
  44. Ansari, Z.N.; Kant, R. A state-of-art literature review reflecting 15 years of focus on sustainable supply chain management. J. Clean. Prod. 2017, 142, 2524–2543. [Google Scholar] [CrossRef]
  45. Dubey, R.; Gunasekaran, A.; Papadopoulos, T. Green supply chain management: Theoretical framework and further research directions. Benchmarking Int. J. 2017, 24, 184–218. [Google Scholar] [CrossRef]
  46. Hafezalkotob, A. Competition, cooperation, and coopetition of green supply chains under regulations on energy saving levels. Transp. Res. Part E Logist. Transp. Rev. 2017, 97, 228–250. [Google Scholar] [CrossRef]
  47. Jabbour, A.B.L.; Jabbour, C.J. Are supplier selection criteria going green? Case studies of companies in Brazil. Ind. Manag. Data Syst. 2009, 109, 477–495. [Google Scholar] [CrossRef]
  48. Wood, D.J.; Mitchell, R.K.; Agle, B.R.; Bryan, L.M. Stakeholder identification and salience after 20 years: Progress, problems, and prospects. Bus. Soc. 2021, 60, 196–245. [Google Scholar] [CrossRef]
  49. Pane Haden, S.S.; Oyler, J.D.; Humphreys, J.H. Historical, practical, and theoretical perspectives on green management: An exploratory analysis. Manag. Decis. 2009, 47, 1041–1055. [Google Scholar] [CrossRef]
  50. Montabon, F.; Sroufe, R.; Narasimhan, R. An examination of corporate reporting, environmental management practices and firm performance. J. Oper. Manag. 2007, 25, 998–1014. [Google Scholar] [CrossRef]
  51. Klassen, R.D.; McLaughlin, C.P. The impact of environmental management on firm performance. Manag. Sci. 1996, 42, 1199–1214. [Google Scholar] [CrossRef]
  52. Paillé, P.; Chen, Y.; Boiral, O.; Jin, J. The impact of human resource management on environmental performance: An employee-level study. J. Bus. Ethics 2014, 121, 451–466. [Google Scholar] [CrossRef]
  53. Boiral, O.; Guillaumie, L.; Heras-Saizarbitoria, I.; Tayo Tene, C.V. Adoption and outcomes of ISO 14001: A systematic review. Int. J. Manag. Rev. 2018, 20, 411–432. [Google Scholar] [CrossRef]
  54. Esfahbodi, A.; Zhang, Y.; Watson, G. Sustainable supply chain management in emerging economies: Trade-offs between environmental and cost performance. Int. J. Prod. Econ. 2016, 181, 350–366. [Google Scholar] [CrossRef] [Green Version]
  55. Cho, C.K.; Cho, T.S.; Lee, J. Managerial attributes, consumer proximity, and corporate environmental performance. Corp. Soc. Responsib. Environ. Manag. 2019, 26, 159–169. [Google Scholar] [CrossRef] [Green Version]
  56. Ramanathan, R. Understanding complexity: The curvilinear relationship between environmental performance and firm performance. J. Bus. Ethics 2018, 149, 383–393. [Google Scholar] [CrossRef] [Green Version]
  57. Hartmann, J.; Vachon, S. Linking environmental management to environmental performance: The interactive role of industry context. Bus. Strategy Environ. 2018, 27, 359–374. [Google Scholar] [CrossRef]
  58. Benkraiem, R.; Dubocage, E.; Lelong, Y.; Shuwaikh, F. The effects of environmental performance and green innovation on corporate venture capital. Ecol. Econ. 2023, 210, 107860. [Google Scholar] [CrossRef]
  59. Yadav, P.L.; Han, S.H.; Rho, J.J. Impact of environmental performance on firm value for sustainable investment: Evidence from large US firms. Bus. Strategy Environ. 2016, 25, 402–420. [Google Scholar] [CrossRef]
  60. Abdul Aziz, N.A.; Ong, T.S.; Foong, S.Y.; Senik, R.; Attan, H. Green initiatives adoption and environmental performance of public listed companies in Malaysia. Sustainability 2018, 10, 2003. [Google Scholar] [CrossRef] [Green Version]
  61. González-Blanco, J.; Coca-Pérez, J.L.; Guisado-González, M. The contribution of technological and non-technological innovation to environmental performance. An analysis with a complementary approach. Sustainability 2018, 10, 4014. [Google Scholar] [CrossRef] [Green Version]
  62. Chiou, T.Y.; Chan, H.K.; Lettice, F.; Chung, S.H. The influence of greening the suppliers and green innovation on environmental performance and competitive advantage in Taiwan. Transp. Res. Part E Logist. Transp. Rev. 2011, 47, 822–836. [Google Scholar] [CrossRef]
  63. Manrique, S.; Martí-Ballester, C.P. Analyzing the effect of corporate environmental performance on corporate financial performance in developed and developing countries. Sustainability 2017, 9, 1957. [Google Scholar] [CrossRef] [Green Version]
  64. Tan, L.P. Implementing ISO 14001: Is it beneficial for firms in newly industrialized Malaysia? J. Clean. Prod. 2005, 13, 397–404. [Google Scholar] [CrossRef]
  65. Machado Junior, C.; Mazzali, L.; Souza, M.T.S.D.; Furlaneto, C.J.; Prearo, L.C. A gestão dos recursos naturais nas organizações certificadas pela norma NBR ISO 14001. Production 2013, 23, 41–51. [Google Scholar] [CrossRef] [Green Version]
  66. González-Benito, J.; González-Benito, Ó. A review of determinant factors of environmental proactivity. Bus. Strategy Environ. 2006, 15, 87–102. [Google Scholar] [CrossRef]
  67. González, P.; Sarkis, J.; Adenso-Díaz, B. Environmental management system certification and its influence on corporate practices: Evidence from the automotive industry. Int. J. Oper. Prod. Manag. 2008, 28, 1021–1041. [Google Scholar] [CrossRef]
  68. Dawkins, C.; Fraas, J.W. Coming clean: The impact of environmental performance and visibility on corporate climate change disclosure. J. Bus. Ethics 2011, 100, 303–322. [Google Scholar] [CrossRef]
  69. Tung, A.; Baird, K.; Schoch, H. The effectiveness of using environmental performance measures. Australas. J. Environ. Manag. 2018, 25, 459–474. [Google Scholar] [CrossRef]
  70. Bach, V.; Minkov, N.; Finkbeiner, M. Assessing the ability of the Cradle to Cradle Certified™ Products Program to reliably determine the environmental performance of products. Sustainability 2018, 10, 1562. [Google Scholar] [CrossRef] [Green Version]
  71. Claver, E.; Lopez, M.D.; Molina, J.F.; Tari, J.J. Environmental management and firm performance: A case study. J. Environ. Manag. 2007, 84, 606–619. [Google Scholar] [CrossRef] [PubMed]
  72. Urban, B.; Govender, D.P. Empirical evidence on environmental management practices. Eng. Econ. 2012, 23, 209–215. [Google Scholar] [CrossRef] [Green Version]
  73. Comoglio, C.; Botta, S. The use of indicators and the role of environmental management systems for environmental performances improvement: A survey on ISO 14001 certified companies in the automotive sector. J. Clean. Prod. 2012, 20, 92–102. [Google Scholar] [CrossRef]
  74. Sehnem, S.; Lopes de Sousa Jabbour, A.B.; Conceição, D.A.D.; Weber, D.; Julkovski, D.J. The role of ecological modernization principles in advancing circular economy practices: Lessons from the brewery sector. Benchmarking Int. J. 2021, 28, 2786–2807. [Google Scholar] [CrossRef]
  75. Huang, Y.C.; Huang, C.H. Examining the antecedents and consequences of sustainable green supply chain management from the perspective of ecological modernization: Evidence from Taiwan’s high-tech sector. J. Environ. Plan. Manag. 2022, 65, 1579–1610. [Google Scholar] [CrossRef]
  76. Gunasekaran, A.; Jabbour, C.J.C.; Jabbour, A.B.L.D.S. Managing organizations for sustainable development in emerging countries: An introduction. Int. J. Sustain. Dev. World Ecol. 2014, 21, 195–197. [Google Scholar] [CrossRef]
  77. Surroca, J.; Tribó, J.A.; Waddock, S. Corporate responsibility and financial performance: The role of intangible resources. Strateg. Manag. J. 2010, 31, 463–490. [Google Scholar] [CrossRef]
  78. Synodinos, N.E. The “art” of questionnaire construction: Some important considerations for manufacturing studies. Integr. Manuf. Syst. 2003, 14, 221–237. [Google Scholar] [CrossRef]
  79. ISO 9001; Criteria for a Quality Management System. The International Organization for Standardization: London, UK, 2015.
  80. Hair, J.; Babin, B.; Money, A.; Samouel, P. Fundamentos de Métodos de Pesquisa em Administração; Bookman, C., Ed.; Bookman: Porto Alegre, RS, Brazil, 2005. [Google Scholar]
  81. Faul, F.; Erdfelder, E.; Lang, A.G.; Buchner, A. G* Power 3: A flexible statistical power analysis program for the social, behavioral, and biomedical sciences. Behav. Res. Methods 2007, 39, 175–191. [Google Scholar] [CrossRef] [PubMed]
  82. Cohen, J. Statistical Power Analysis for the Behavioral Sciences; Academic Press: Cambridge, MA, USA, 2013. [Google Scholar]
  83. Henseler, J.; Dijkstra, T.K.; Sarstedt, M.; Ringle, C.M.; Diamantopoulos, A.; Straub, D.W.; Ketchen, D.J., Jr.; Joseph, F.; Hair, G.; Hult, T.M.; et al. Common beliefs and reality about PLS: Comments on Rönkkö and Evermann (2013). Organ. Res. Methods 2014, 17, 182–209. [Google Scholar] [CrossRef] [Green Version]
  84. Willaby, H.W.; Costa, D.S.; Burns, B.D.; MacCann, C.; Roberts, R.D. Testing complex models with small sample sizes: A historical overview and empirical demonstration of what partial least squares (PLS) can offer differential psychology. Personal. Individ. Differ. 2015, 84, 73–78. [Google Scholar] [CrossRef]
  85. Hair, J.F.; Black, W.C.; Babin, B.J.; Anderson, R.E.; Tatham, R.L. Análise Multivariada de Dado; Bookman: Porto Alegre, RS, Brazil, 2009. [Google Scholar]
  86. Hair, J.F.; Ringle, C.M.; Sarstedt, M. PLS-SEM: Indeed, a silver bullet. J. Mark. Theory Pract. 2011, 19, 139–152. [Google Scholar] [CrossRef]
  87. Marôco, J. Análise de Equações Estruturais: Fundamentos Teóricos, Software & Aplicações; ReportNumber, Lda.: Pêro Pinheiro, Portugal, 2014. [Google Scholar]
  88. Monecke, A.; Leisch, F. semPLS: Structural Equation Modeling Using Partial Least Squares. J. Stat. Softw. 2012, 48, 1–32. [Google Scholar] [CrossRef] [Green Version]
  89. Ravand, H.; Baghaei, P. Partial least squares structural equation modeling with R. Pract. Assess. Res. Eval. 2016, 21, 11. [Google Scholar] [CrossRef]
  90. Raykov, T.; Marcoulides, G.A. A First Course in Structural Equation Modeling; Routledge: London, UK, 2012. [Google Scholar]
  91. Kline, R.B. Principles and Practice of Structural Equation Modeling; Guilford Publications: New York, NY, USA, 2023. [Google Scholar]
  92. Rodrigues, H.S.; Alves, W.; Silva, Â. The impact of lean and green practices on logistics performance: A structural equation modelling. Production 2020, 30. [Google Scholar] [CrossRef] [Green Version]
  93. Hair, J.F., Jr.; Hult, G.T.M.; Ringle, C.M.; Sarstedt, M. A Primer on Partial Least Squares Structural Equation Modeling (PLS-SEM); Sage Publications: Los Angeles, CA, USA, 2021. [Google Scholar]
  94. Anekawati, A.; Otok, B.W. Structural equation modelling with three schemes estimation of score factors on partial least square (Case study: The quality of education level SMA/MA in Sumenep Regency). J. Phys. Conf. Ser. 2017, 855, 012006. [Google Scholar] [CrossRef]
  95. Cohen, J. A Power Primer. Phychological Bull. 1992, 112, 155–159. [Google Scholar] [CrossRef] [PubMed]
  96. Hair, J.F., Jr.; Howard, M.C.; Nitzl, C. Assessing measurement model quality in PLS-SEM using confirmatory composite analysis. J. Bus. Res. 2020, 109, 101–110. [Google Scholar] [CrossRef]
  97. Benitez, J.; Henseler, J.; Castillo, A.; Schuberth, F. How to perform and report an impactful analysis using partial least squares: Guidelines for confirmatory and explanatory IS research. Inf. Manag. 2020, 57, 103168. [Google Scholar] [CrossRef]
  98. Kock, N. Common method bias: A full collinearity assessment method for PLS-SEM. In Partial Least Squares Path Modeling: Basic Concepts, Methodological Issues and Applications; Springer: Cham, Switerland, 2017; pp. 245–257. [Google Scholar] [CrossRef]
  99. Ringle, C.M.; Da Silva, D.; de Souza Bido, D. Modelagem de equações estruturais com utilização do SmartPLS. REMark-Rev. Bras. Mark. 2014, 13, 56–73. [Google Scholar] [CrossRef]
  100. Ghozali, I.; Latan, H. Partial Least Squares Konsep, Teknik dan Aplikasi Menggunakan Program Smartpls 3.0 Untuk Penelitian Empiris; Badan Penerbit UNDIP: Semarang, Indonesia, 2015. [Google Scholar]
  101. Teixeira, A.A.; Jabbour, C.J.C.; de Sousa Jabbour, A.B.L.; Latan, H.; De Oliveira, J.H.C. Green training and green supply chain management: Evidence from Brazilian firms. J. Clean. Prod. 2016, 116, 170–176. [Google Scholar] [CrossRef]
  102. Teixeira, A.A.; Moraes, T.E.D.C.; Stefanelli, N.O.; de Oliveira, J.H.C.; Teixeira, T.B.; de Souza Freitas, W.R. Green supply chain management in Latin America: Systematic literature review and future directions. Environ. Qual. Manag. 2020, 30, 47–73. [Google Scholar] [CrossRef]
  103. Fahimnia, B.; Sarkis, J.; Davarzani, H. Green supply chain management: A review and bibliometric analysis. Int. J. Prod. Econ. 2015, 162, 101–114. [Google Scholar] [CrossRef]
  104. Jabbour, C.J.C.; de Sousa Jabbour, A.B.L.; Govindan, K.; Teixeira, A.A.; de Souza Freitas, W.R. Environmental management and operational performance in automotive companies in Brazil: The role of human resource management and lean manufacturing. J. Clean. Prod. 2013, 47, 129–140. [Google Scholar] [CrossRef]
  105. Zhu, Q.; Sarkis, J. An inter-sectoral comparison of green supply chain management in China: Drivers and practices. J. Clean. Prod. 2006, 14, 472–486. [Google Scholar] [CrossRef]
  106. Aftab, J.; Abid, N.; Cucari, N.; Savastano, M. Green human resource management and environmental performance: The role of green innovation and environmental strategy in a developing country. Bus. Strategy Environ. 2022, 32, 1782–1798. [Google Scholar] [CrossRef]
  107. Habidin, N.F.; Hibadullah, S.N.; Mohd Fuzi, N.; Salleh, M.I.; Md Latip, N.A. Lean manufacturing practices, ISO 14001, and environmental performance in Malaysian automotive suppliers. Int. J. Manag. Sci. Eng. Manag. 2018, 13, 45–53. [Google Scholar] [CrossRef]
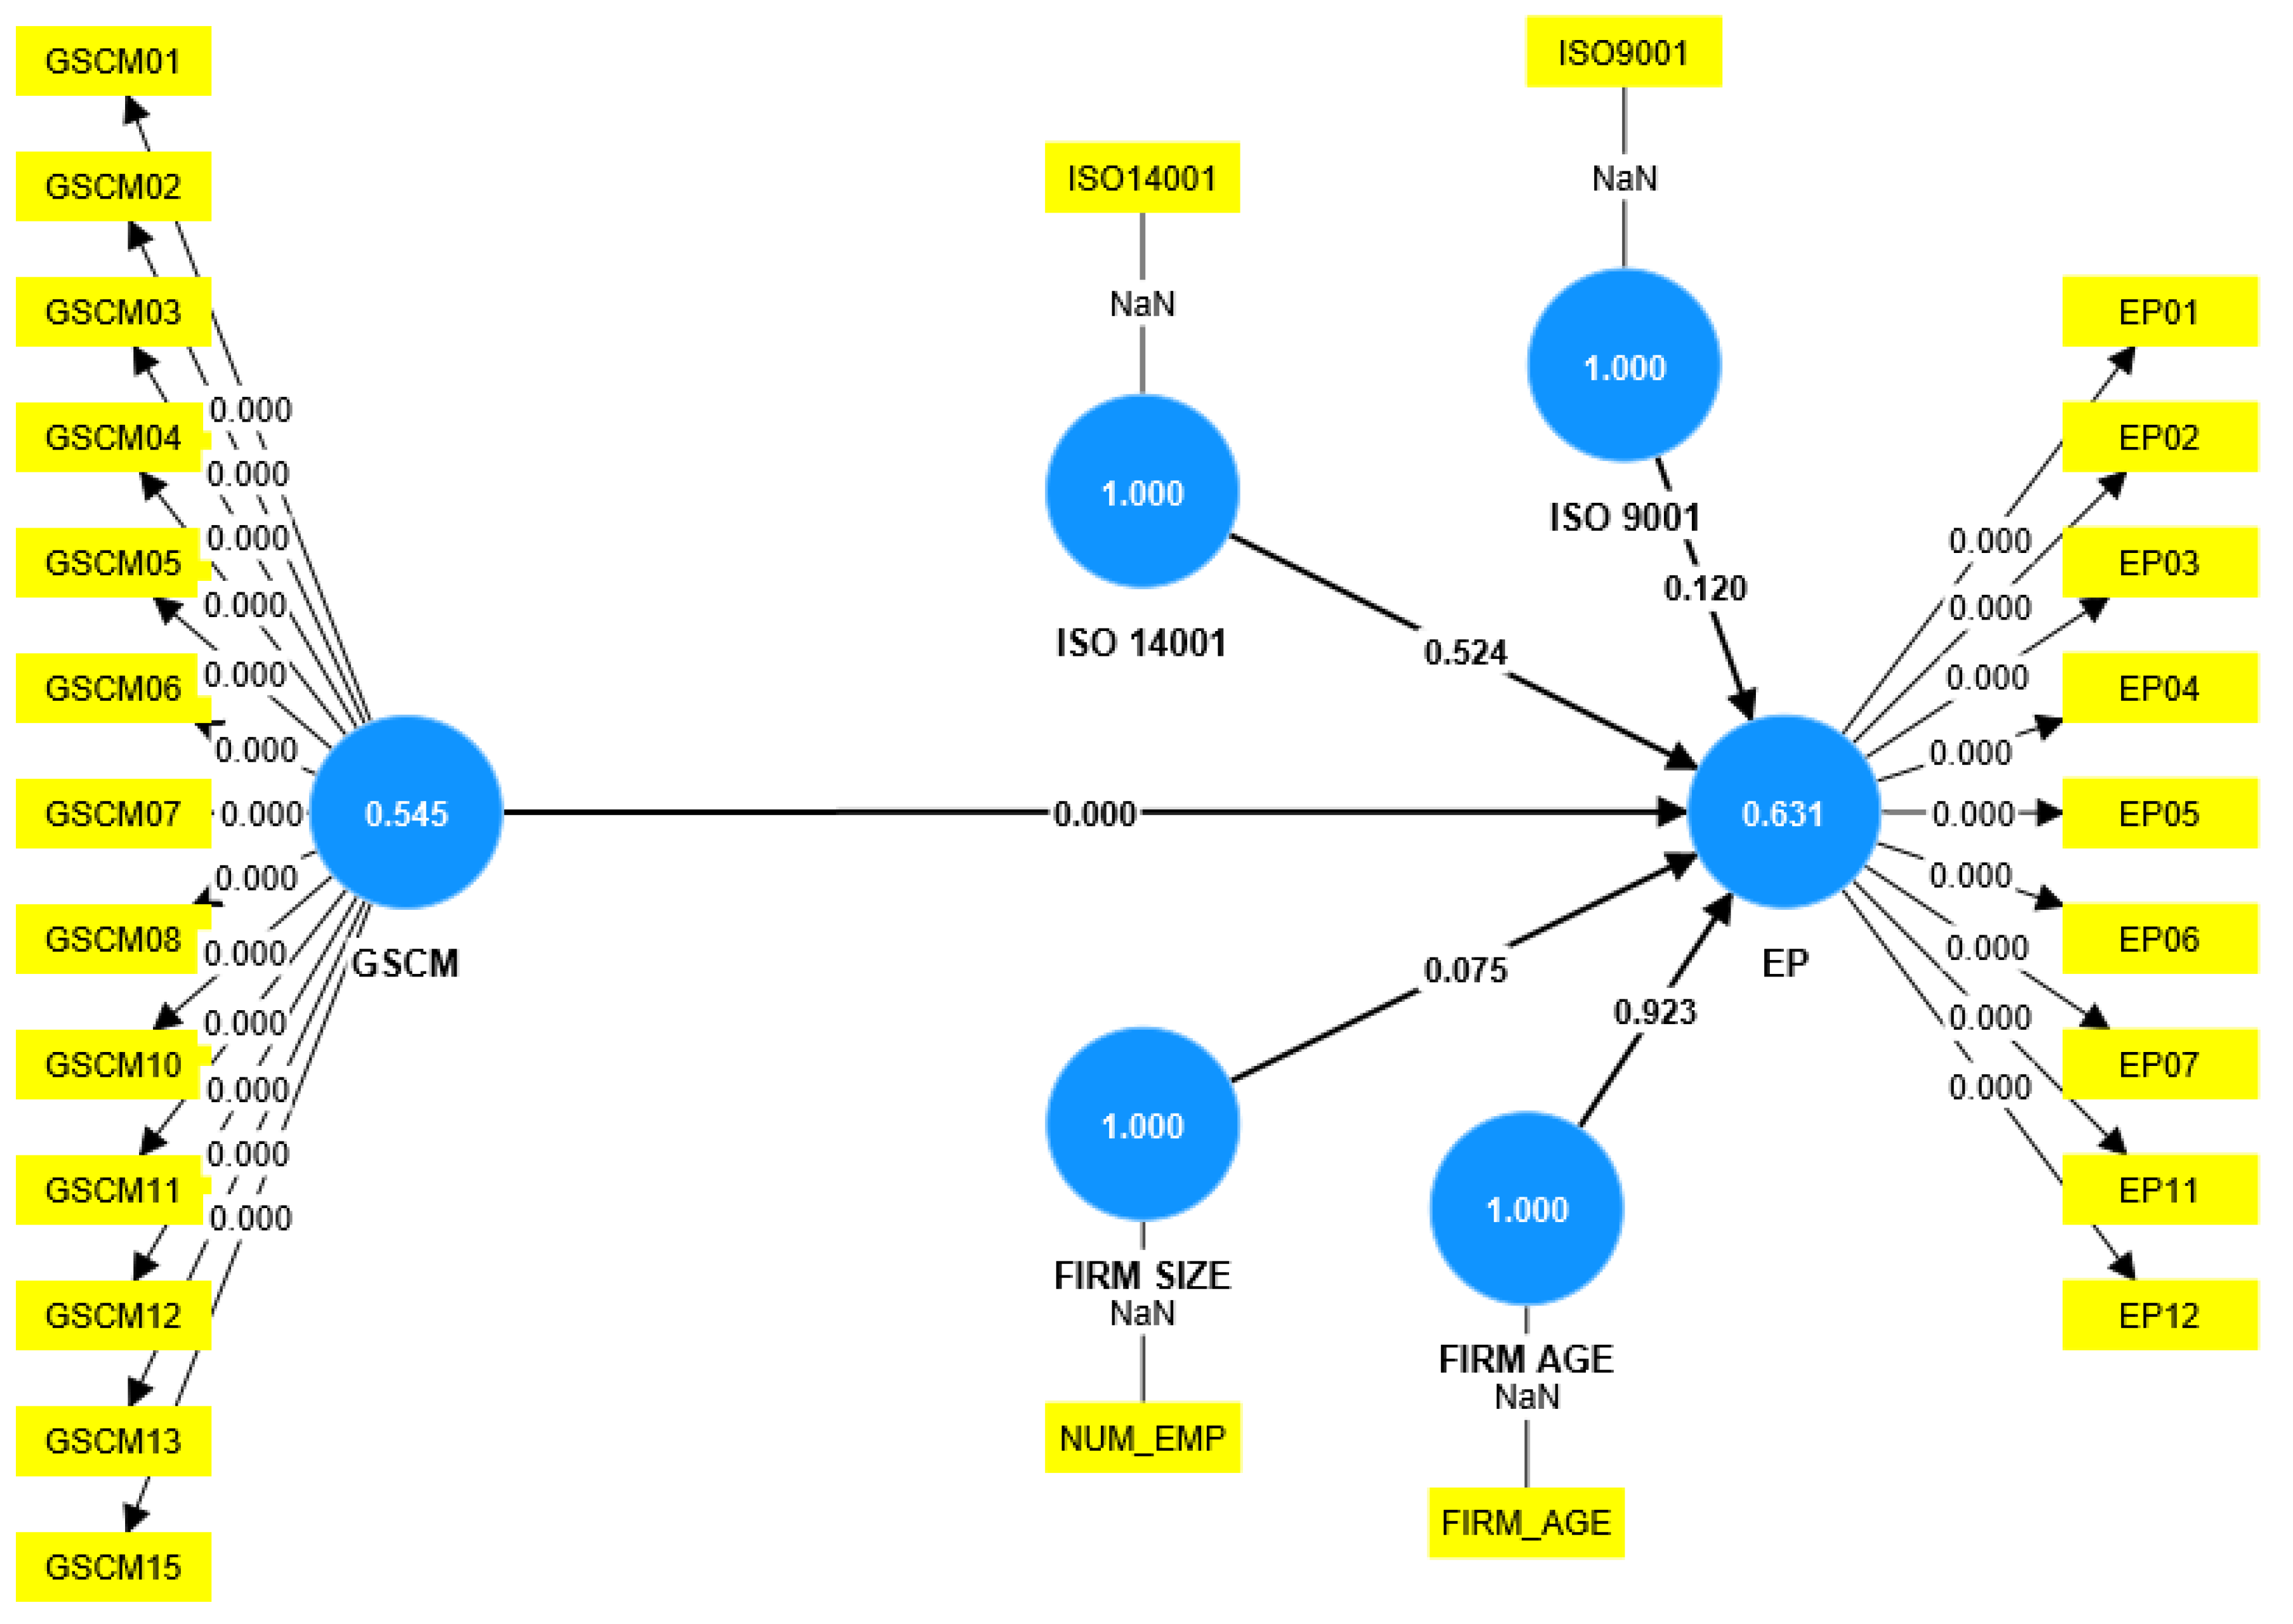
Figure 1. Research conceptual model.
Sustainability 15 11843 g001
Figure 2. Measurement model. Source: automatically generated in SMART PLS 4.0.
Sustainability 15 11843 g002
Figure 3. Measurement model. Source: automatically generated in SMART PLS 4.0.
Sustainability 15 11843 g003
Table 1. GSCM variables research.
Practice GroupsVariablesAcronym
Internal environmental management
(Internal practice)
Senior management’s commitment to GSCMGSCM1
Support offered by Middle management to GSCMGSCM2
Cross-functional cooperation for environmental improvementsGSCM3
Environmental management with total qualityGSCM4
Programas de conformidade e auditoria ambientalGSCM5
Green purchase
(External practice)
Selection of certified suppliers ISO 14001 [39]GSCM6
Cooperação com fornecedores para atingir objetivos de gestão ambientalGSCM7
Delivery to suppliers of environmental guidelines for each product to be purchasedGSCM8
Assessment of the environmental management of second-tier suppliers (suppliers of your suppliers)GSCM9
Conducting environmental audits within the supplier companiesGSCM10
Cooperation with customers
(External practice)
Cooperation with customers for cleaner productionGSCM11
Cooperation with the customer for the development of an environmentally friendly packagingGSCM12
Eco-design
(Internal practice)
Design of products to reduce the use of materials and energyGSCM13
Design of products for reduction, reuse, recycling or recovery of materials and componentsGSCM14
Product design to prevent or reduce the use of dangerous and toxic productsGSCM15
Return on investment.
(Internal Practice)
Sale of excess materials/inventoryGSCM16
Sale of scrap and used materialsGSCM17
Sale of equipmentGSCM18
Source: Adapted from [38] p. 271.
Table 2. Main variables environnemental performance.
VariablesAuthorsAcronym
We reduce the consumption of natural resources in production operations[59,60,61,62,63,64,65]EP1
We reduce the consumption of raw materials in production operations.[59,60,61,62,63,64,65,66,67]EP2
We reduce energy consumption in production operations[59,60,61,62,63,64,65,68]EP3
We reduce the Generation of atmospheric emissions[61,62,64,68,69,70,71]EP4
We reduce the generation and/or emission of effluents and waste[65]EP5
We reduce the frequency of environmental accidents[65]EP6
We reduce the consumption of oxide/hazardous/harmful materials[64,65]EP7
We carry out an inventory of gas emissions[66]EP8
We recycle solid waste[59,60,62,63,68,70,71,72,73]EP9
We reduce the amount of solid waste[59,62,63,69,71,72,73]EP10
Improved the company’s environmental reputation with stakeholders[60,61,62,63,65,66,67,68]EP11
Improved the company’s compliance with environmental legislation[65,66,67]EP12
Source: Elaborated by the authors.
Table 3. Profile of the respondent companies.
VariablesItemsQuantityPercentage
ISO 14001 4658.23
ISO 9001 6481.01
Number of employees0–1945.06
Firm age20–991620.25
100–4993443.04
≥5002531.65
0–522.53
6–1033.80
11–1556.33
16–20810.13
21–2578.86
>255468.35
SectorConstruction45.06
Information Technology33.80
Metallurgical1620.25
Electrical and Electronics45.06
Retail Trade22.53
Chemical Industry67.59
Auto Parts Industry1518.99
Automotive Industry22.53
Services2025.32
Vegetable Oil11.27
Food Industry22.53
Agriculture and Livestock11.27
Paper and Cellulose11.27
Textile11.27
Sugar and Alcohol11.27
Table 4. Measures of convergent validity and reliability of the model.
VariablesItemsExternal LoadsAVErho_Crho_A
GSCMGSCM10.7580.5450.9390.931
GSCM20.789
GSCM30.810
GSCM40.846
GSCM50.777
GSCM60.719
GSCM70.841
GSCM80.680
GSCM100.643
GSCM110.758
GSCM120.605
GSCM130.635
GSCM150.683
EPEP10.8260.6310.9390.933
EP20.779
EP30.746
EP40.860
EP50.817
EP60.821
EP70.758
EP110.824
EP120.705
Source: Automatically generated in SMART PLS 4.0. Note: factor weighting scheme; max iteration 300; stop criterion 107.
Table 5. Result of discriminant validity and with the criterion Fornell–Larcker.
VariablesEPGSCM
EP0.794-
GSCM0.6920.738
Source: Data generated automatically in Smart PLS 4.0. Note: Bold to highlight the highest factor loadings on their own latent variables.
Table 6. Result of discriminant validity and with the criterion of correlation rates heterotrait–monotrait ratio (HTMT).
V.LEPFIRM AGEFIRM SIZEGSCMISO 14001
FIRM AGE0.155
FIRM SIZE0.3500.224
GSCM0.7210.1190.228
ISO 140010.3900.0960.2700.469
ISO 90010.1130.0100.0450.1610.344
Source: Data automatically generated in Smart PLS 4.0.
Table 7. Discriminant validity factor loadings (cross-loadings).
ItemsEPFIRM AGEFIRM SIZEGSCMISO 14001ISO 9001
EP010.826−0.0550.2220.467−0.2660.093
EP020.779−0.1220.1850.435−0.1810.036
EP030.746−0.0450.2670.443−0.2990.184
EP040.8600.1220.2770.606−0.348−0.011
EP050.8170.2070.2070.522−0.306−0.054
EP060.8210.1010.2090.642−0.460−0.198
EP070.7580.0840.1570.602−0.220−0.028
EP110.8240.1480.4720.580−0.3180.162
EP120.7050.1800.4130.567−0.280−0.009
FIRM_AGE0.0991.0000.2240.084−0.0960.010
NUM_EMP0.3480.2241.0000.218−0.270−0.045
GSCM010.5490.0650.1010.758−0.274−0.009
GSCM020.5480.1220.1320.789−0.306−0.055
GSCM030.6060.0340.0300.810−0.321−0.042
GSCM040.493−0.0430.1040.846−0.503−0.209
GSCM050.4880.0130.3200.777−0.550−0.230
GSCM060.3930.1590.1900.719−0.371−0.172
GSCM070.5640.0440.1550.841−0.404−0.072
GSCM080.5240.0670.2620.680−0.424−0.116
GSCM100.5000.1590.2610.643−0.364−0.176
GSCM110.395−0.0540.1570.758−0.222−0.185
GSCM120.3270.1580.0610.605−0.183−0.068
GSCM130.542−0.0310.0650.635−0.182−0.040
GSCM150.5450.1420.2640.683−0.215−0.113
ISO14001−0.382−0.096−0.270−0.4531.0000.344
ISO90010.0230.010−0.045−0.1490.3441.000
Source: Data automatically generated in Smart PLS 4.0. Note: Bold to highlight the highest factor loadings on your own latent variables.
Table 8. Results of the structural model (bootstrapping).
VariablesR2R2
Adjusted
Effect Size (f2)Q2 Predictive
Validity
VIF
EP0.5360.509-0.307-
GSCM--0.669-1.275
FIRM AGE--0.000-1.056
FIRM SIZE--0.072-1.142
ISO 14001--0.005-1.458
ISO 9001--0.041-1.139
Source: Data generated automatically in SMART PLS 3.0. Note: bootstrapping -> sign changes = individual changes; subsample = 5000; confidence interval method = bias-corrected and accelerated method.
Table 9. Result of the hypothesis test for the relationship between the variables (sig. 5%).
VariablesOriginal SampleSample
Mean
STDEVt Statisticsp-ValueDecision
GSCM → DA0.6260.6420.0748.4440Accepted
FIRM SIZE → EP−0.008−0.0030.0780.1050.923Rejected
FIRM AGE → EP0.1930.1850.1111.7440.075Rejected
ISO 14001 → EP−0.101−0.0840.1020.9890.524Rejected
ISO 9001 → EP0.4060.3790.2411.6880.12Rejected
Source: data generated automatically in Smart PLS 4.0.
Table 10. Confidence interval of structural coefficients for 5000 subsamples for the structural model.
RegressionsOriginal Sample (O)Sample Mean (M)2.5%97.5%
FIRM AGE → EP−0.008−0.003−0.1560.156
FIRM SIZE → EP0.1930.185−0.0400.386
GSCM → EP0.6260.6420.4910.780
ISO 14001 → EP−0.101−0.084−0.2620.131
ISO 9001 → EP0.4060.379−0.1070.820
Source: data automatically generated in Smart PLS 4.0.
Disclaimer/Publisher’s Note: The statements, opinions and data contained in all publications are solely those of the individual author(s) and contributor(s) and not of MDPI and/or the editor(s). MDPI and/or the editor(s) disclaim responsibility for any injury to people or property resulting from any ideas, methods, instructions or products referred to in the content.

