
Mapping Ecotourism Potential in Bangladesh: The Integration of an Analytical Hierarchy Algorithm and Geospatial Data
 , , and
Abstract
:1. Introduction
- Act as a guiding tool for local policymakers and planners in identifying, planning, conserving, and developing potential ecotourism sites;
- Indicate suitable locations for tourists who are willing to make a nature-based trip.
2. Materials and Methods
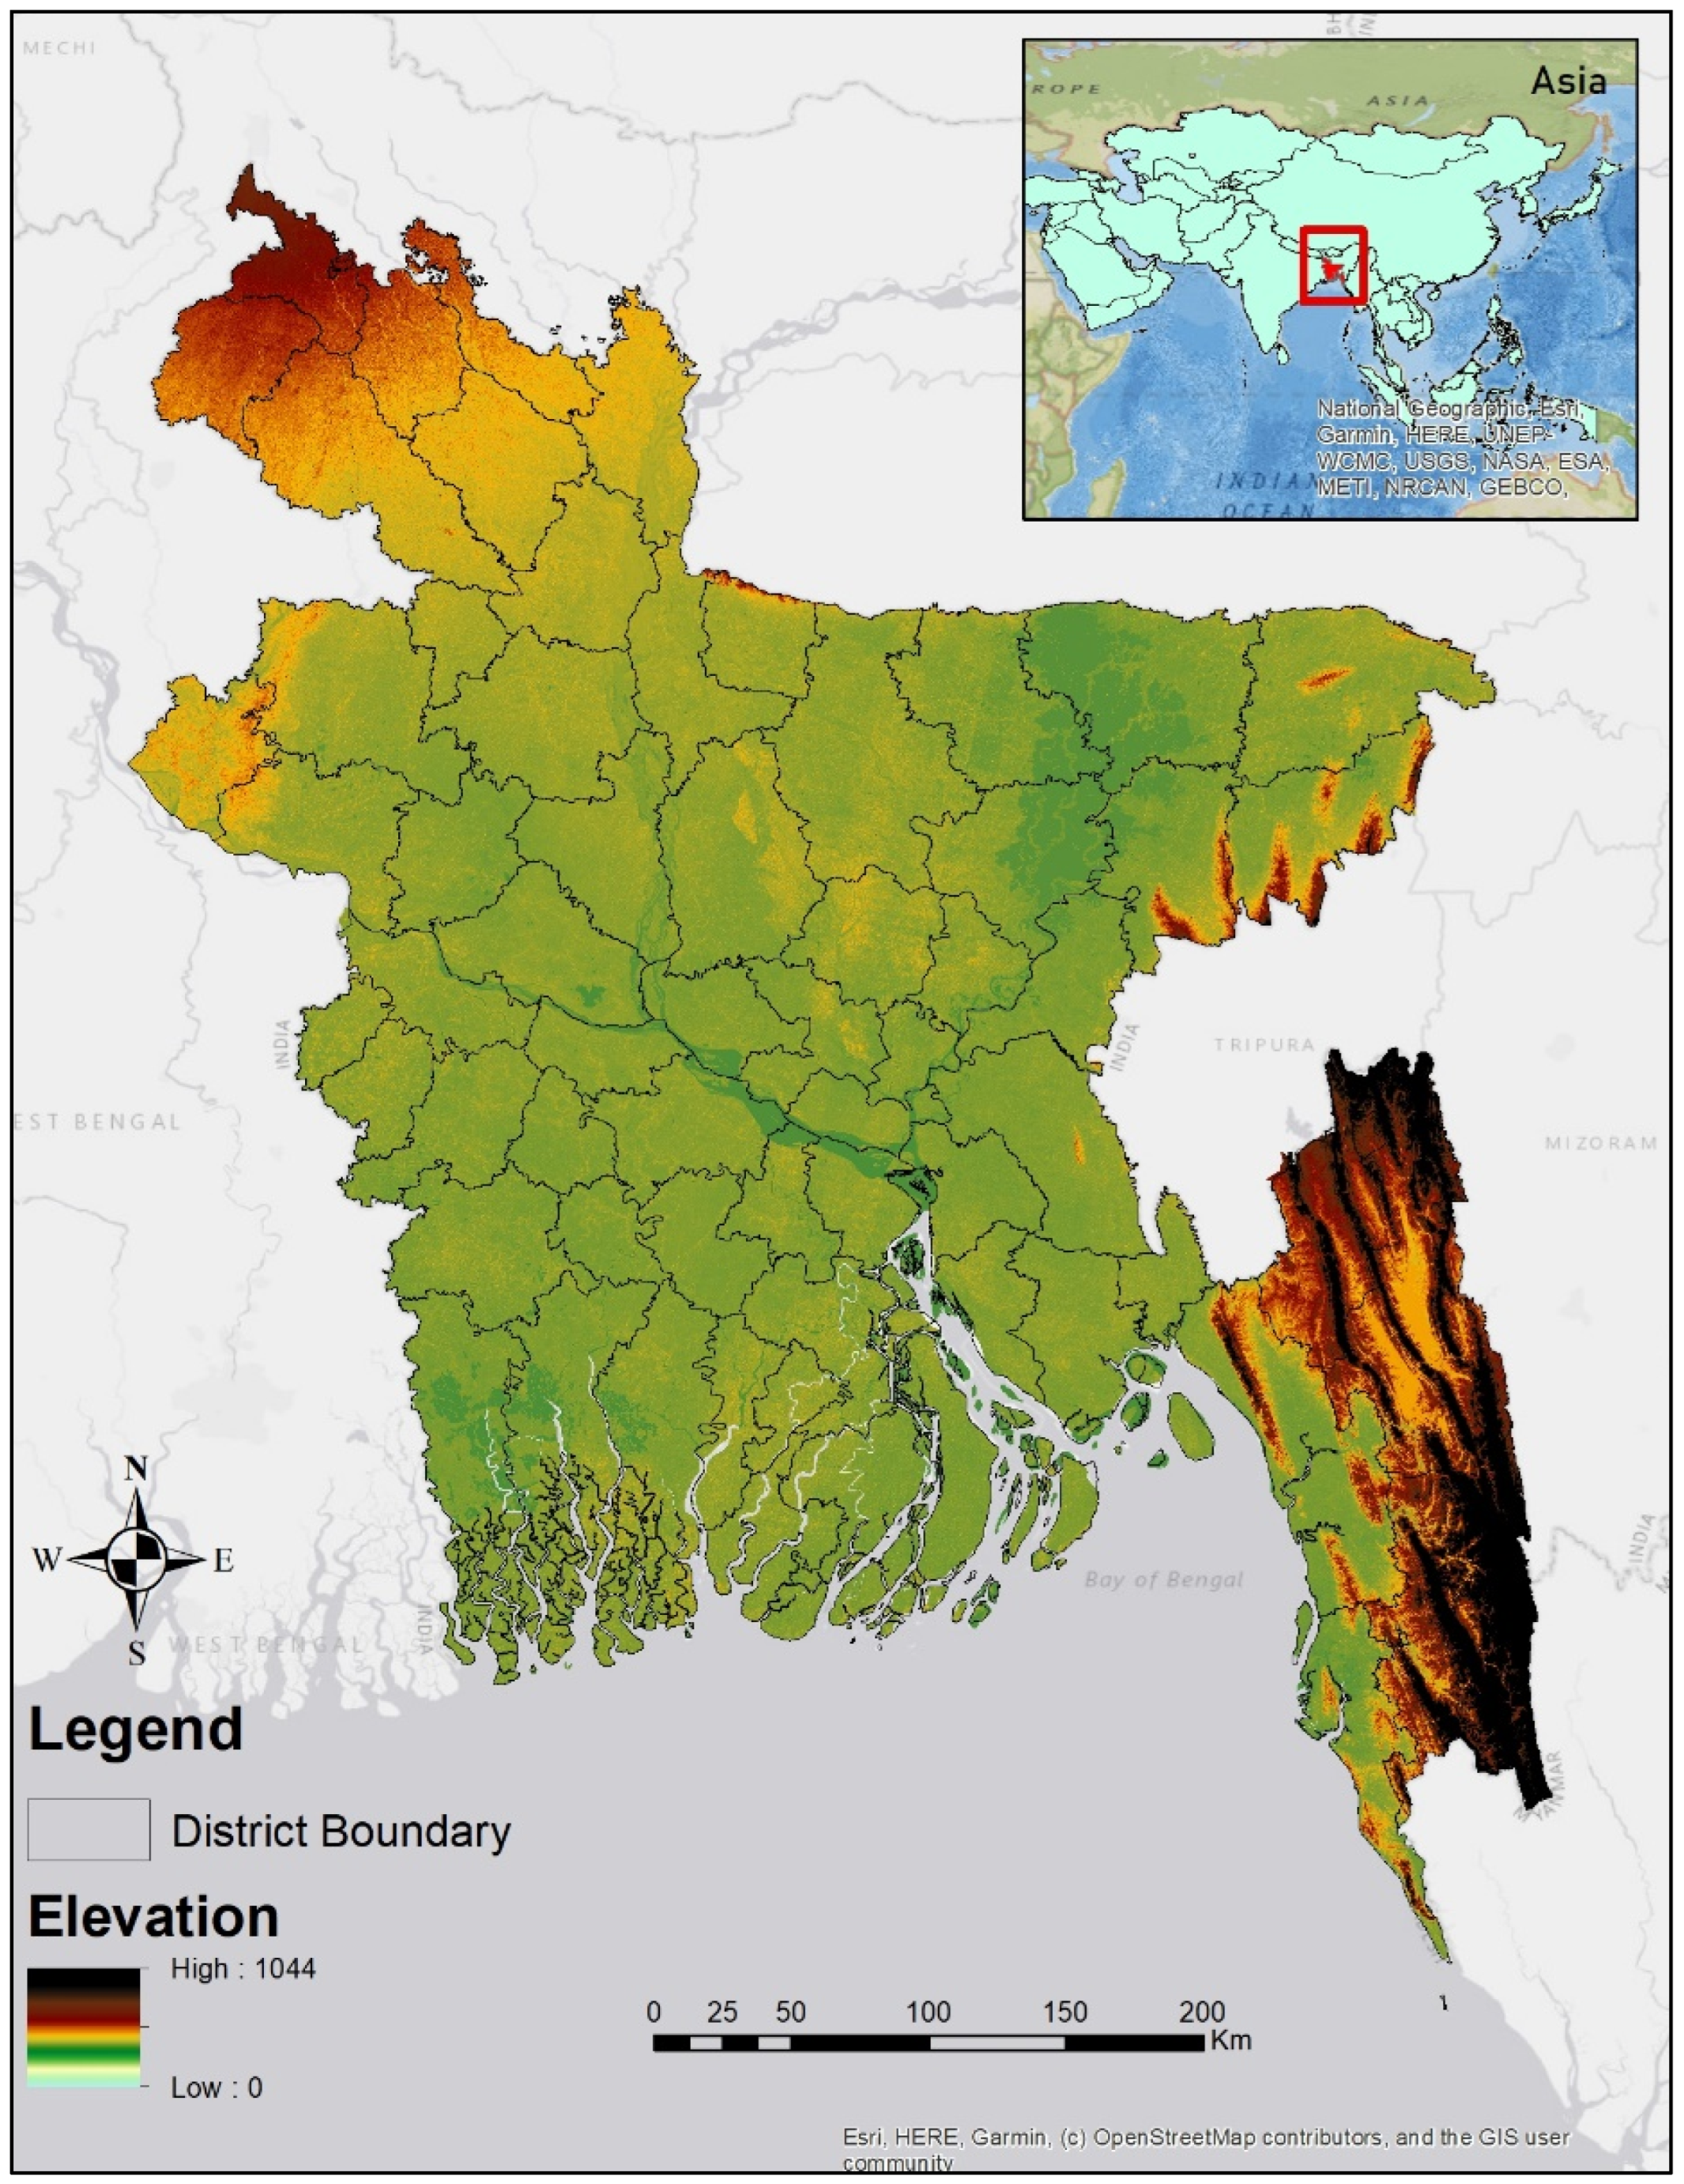
2.1. Study Area
2.2. Data Collection
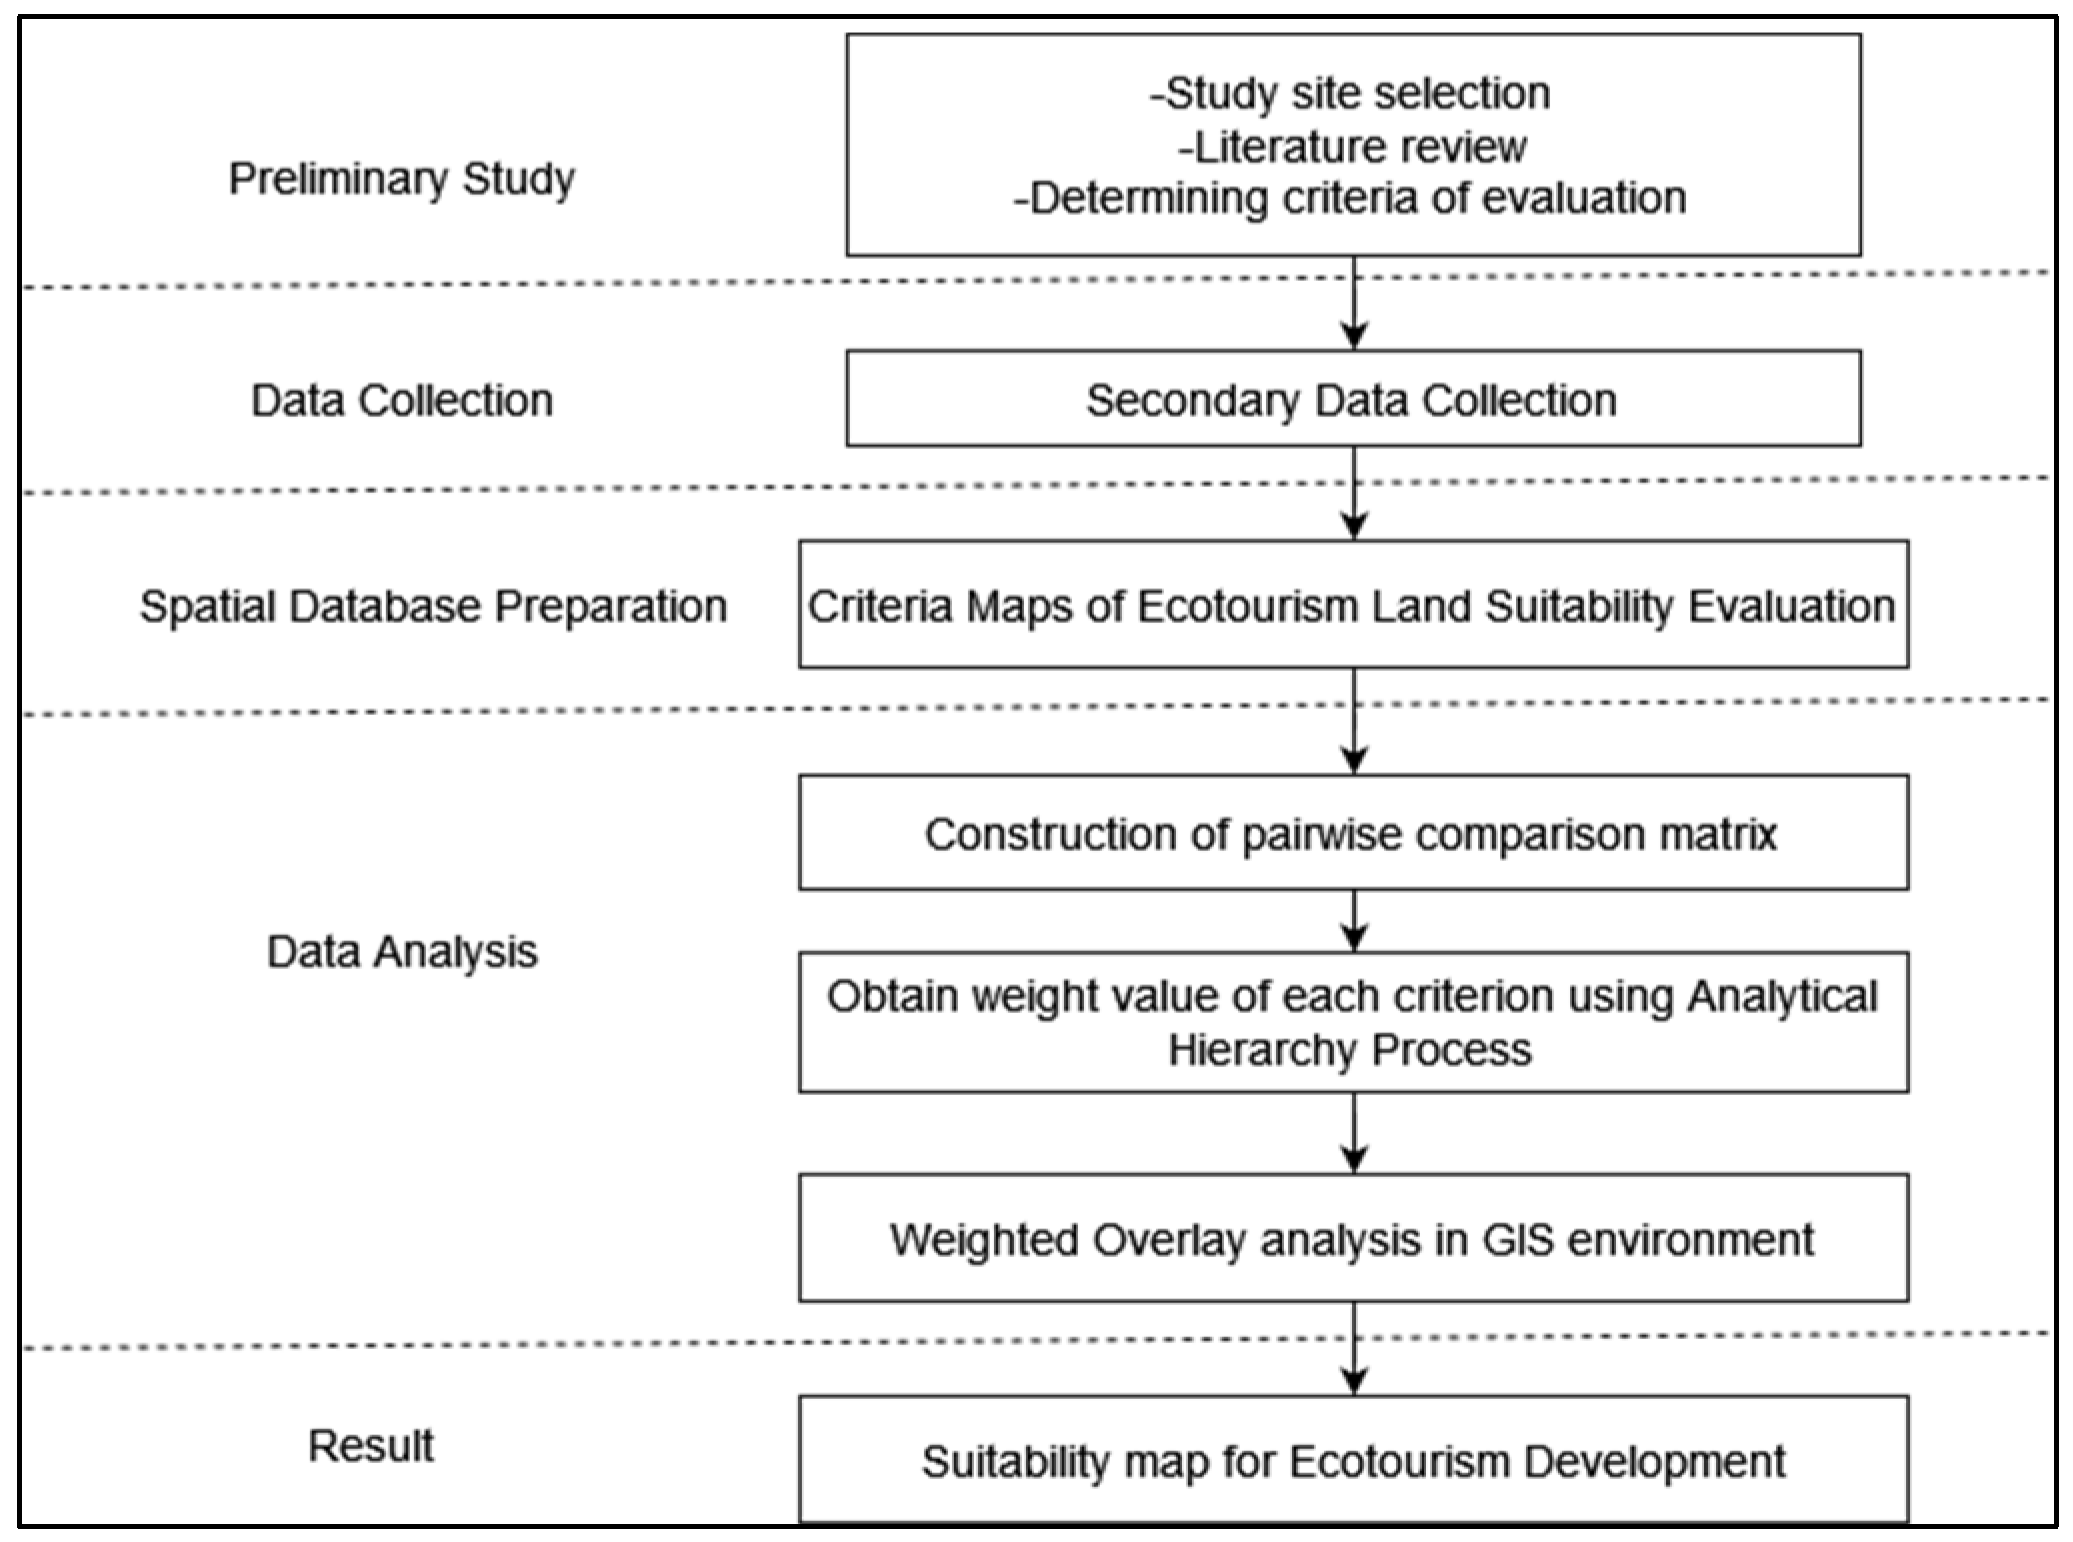
2.3. Methodology
2.4. Variable Descriptions
2.4.1. Natural Attractiveness
- (a)
- Proximity to Forests: As forests, natural assets, and protected areas preserve and showcase the beauty of nature, they are fundamental for fostering ecotourism [10]. The map of proximity to forests was created using the Euclidean Distance geoprocessing tool. According to the analysis, the map was divided into five distinct groups based on the distance from the forest region. The groups and their corresponding distances are as follows: very high (less than 5 km), high (5 to 10 km), moderate (10 to 15 km), low (15 to 20 km), and very low (more than 20 km).
- (b)
- Vegetation Distribution: The NDVI was used to classify the vegetation coverage of the study area. Ecotourism and vegetation density have a beneficial association [7,10]. Vegetation and plant diversity increases diversity in wildlife and natural resources, attracting tourists and giving large scope for the development of ecotourism [7]. Fourteen sets of satellite images were downloaded from Landsat 8–9 OLI/TIRS. The following equation was used to determine the NDVI of the study area in ArcMap 10.7.
- (c)
- Waterbody Distribution: As water availability boosts the variety of species and natural resources, which helps to attract tourists, an open body of water can be made to “stand out” against the ground and vegetation by using the Normalized Difference Water Index (NDWI) to emphasize it in a satellite picture that was chosen. The following equation was used to determine the NDWI of the study area using ArcMap10.7.
- (d)
- Wetland Proximity: Wetlands are important for ecotourism as they have natural attractions for tourists [12]. Based on distance from wetlands, the area was divided into 5 suitability zones: very high (less than 500 m), high (500–2000 m), moderate (2000–4000 m), low (4000–6000), and very low (more than 6000 m).
2.4.2. Topographic Characteristics
- (a)
- Elevation: The height of a location above or below Mean Sea Level(MSL) and the various reliefs in a region are both described by elevation [7]. Elevation is essential for establishing an ecotourism location [8]. To assess elevation in the study region, the DEM created five elevation groups: less than 0 m, 0–25 m, 25–50 m, 50–100 m, and beyond 100 m from the mean sea level. Based on these elevation groups, the study area was classified into five suitability zones: very high, high, moderate, low, and very low, respectively.
- (b)
- Slope: The flatness and steepness of a region is determined by the slope estimation provided by the DEM. This criterion component in the feasibility study for ecotourism is crucial due to the site’s complexity in terms of slope and distribution [10]. Due to their accessibility, lower slopes are more suitable for the expansion of ecotourism [39].
- (c)
- Aspect: Aspect influences the amount of sunshine received and the formation of microclimates. North-facing slopes are typically steeper, have inferior flora, are more prone to erosion, and are unsuitable for long-term tourist activities due to lower temperatures. South-facing areas have bigger surface areas, descent slopes, ideal microclimates, and more diverse flora and fauna compared with north-oriented areas [59,60].
- (d)
- Surface Water Accessibility: One of the most essential components in establishing an ecotourism site is surface water accessibility. When choosing an ecotourism destination, more importance is given to the area that is closer to the drainage system [7].
2.4.3. Accessibility
- (a)
- Distance from Roads: Generally, tourists choose to travel to places that are accessible and have good transportation systems [7]. Five buffer zones were created from the current road network, each measuring less than 10 km, 10 to 20 km, 20 to 30 km, 30 to 40 km, and more than 40 km; extremely high, high, moderate, low, and extremely low suitability zones were used to identify these areas.
- (b)
- Distance from Railway: The propensity to travel by rail is influenced by the level and quality of accessibility. As tourists are attracted to good transportation systems, rail transport is also very important [61]. The study utilized buffer distances of 10 km, 10–20 km, 20–30 km, 30–40 km, and over 40 km to establish five suitability zones for buffer areas around railway stations: very high, high, moderate, low, and very low.
- (c)
- Distance from Airport: Air transport and airport accessibility have a significant impact on a country’s tourism [62]. As tourists are drawn to a variety of transit options, air transportation is also quite vital [61]. In this study, airport accessibility zones were defined as very high, high, moderate, low, and very low using buffer zones of 25, 25, 50, 75, 100, and greater than 100 km.
2.4.4. Proximity to Facilities
- (a)
- Proximity to Hotels: The availability of hotels is a prominent factor in embryonic ecotourism [8]. Areas that are nearer to hotels are more suitable for ecotourism. The study conducted a proximity analysis using GIS and divided the area into five suitability zones based on distance from hotels: very high (less than 5 km), high (5–10 km), moderate (10–15 km), low (15–20 km), and very low (greater than 20 km).
- (b)
- Proximity to Health Centers: Distance from the nearest health facility is also important for ecotourism [11]. The less the distance from health facilities, the more the area is suitable for ecotourism. Based on distance from medical facilities, the area was categorized into five suitability zones: very high (less than 5 km), high (5–10 km), moderate (10–15 km), low (15–20 km), and very low (more than 20 km).
- (c)
- Proximity to Growth Centers: Physical and cultural aspects could be included in geo-ecotourism zoning as well, as the anticipated expansion of growth centers for tourism is high [11]. The study area was categorized into five suitability zones based on their proximity to the growth center: very high (less than 5 km), high (5–10 km), moderate (10–15 km), low (15–20 km), and very low (greater than 20 km).
2.4.5. Community Characteristics
- (a)
- Proximity to Settlements: Highly populated locations were chosen for the construction of buffer zones based on their accessibility to nearby places because of the impact that developed populations have on natural surroundings [10]. The entire region was divided into five groups based on distance from settlements: less than 1000 m was considered very highly suitable, 1000–2000 m was considered highly suitable, 2000–3000 m was considered moderately suitable, 3000–4000 m was considered less suitable, and beyond 4000 m was considered unsuitable in this regard.
- (b)
- Settlement Size: Settlement size is one of the essential factors when developing a site for ecotourism [27]. The area was divided into four zones based on population density. Areas with fewer than 500 people were considered highly suitable, those with 500–1000 people moderately suitable, those with 5000–10,000 people less suitable, and those with more than 10,000 people unsuitable for ecotourism.
2.5. Ecotourism Suitability Mapping Using the AHP
Steps for Calculation Using the AHP Method
2.6. Weighted Overlay Analysis
2.7. Validation
3. Analysis and Results
3.1. Natural Attractiveness
- (a)
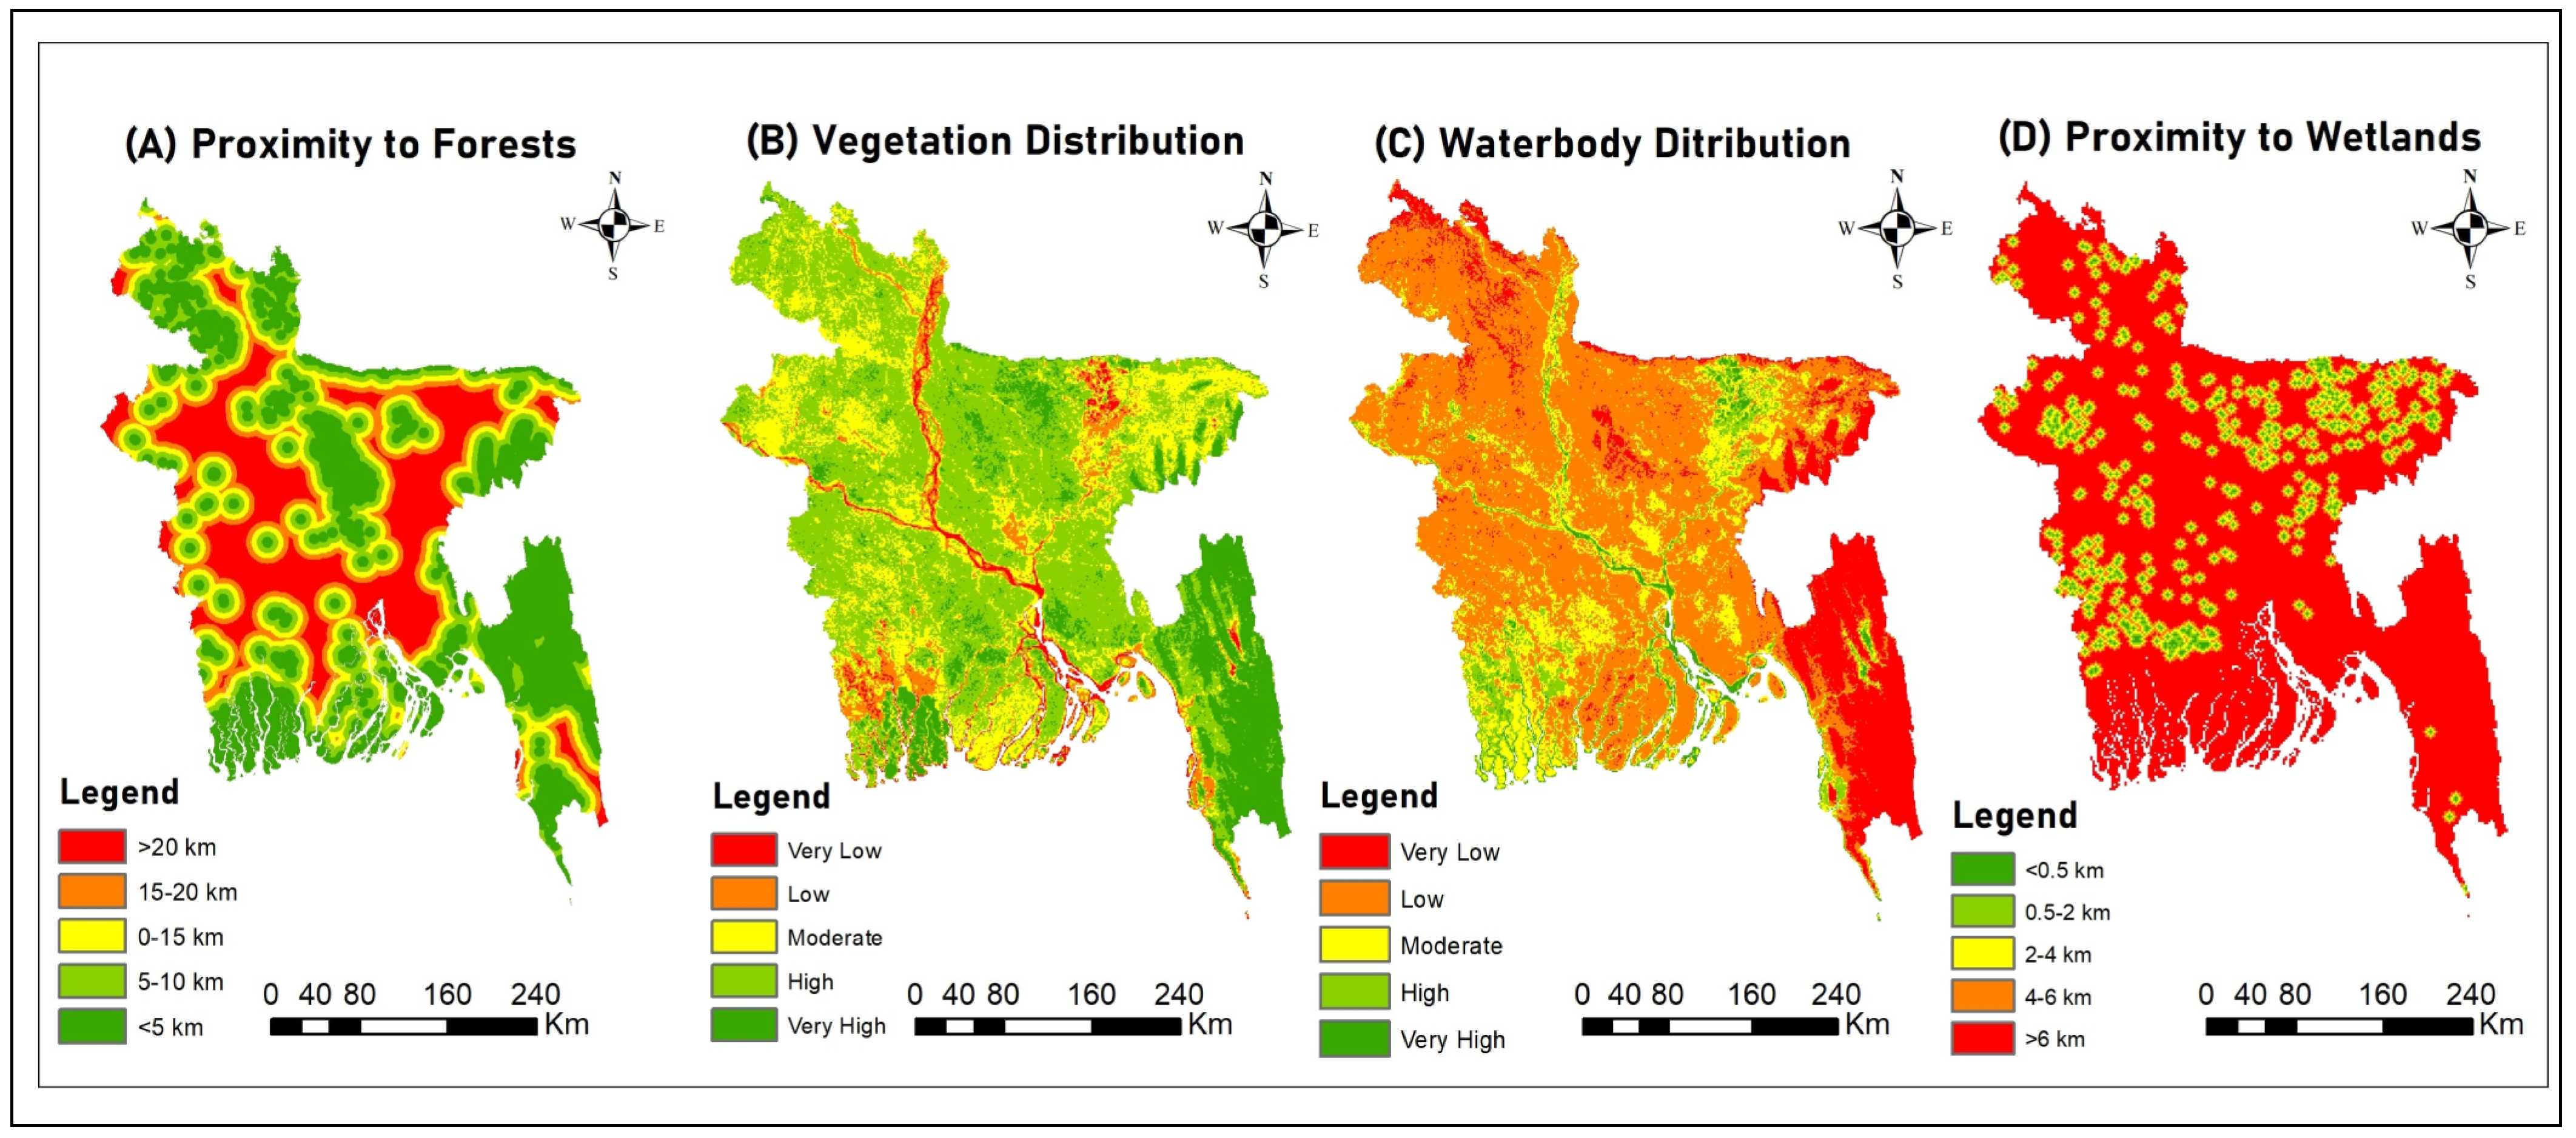
- Proximity to Forests: The analysis identified five distinct ecotourism suitability zones in Bangladesh based on their proximity to forested areas, as shown in Table 5 and Figure 3A. The results show that 33% of the country’s territory, covering an area of 48,698 km2, is categorized as very highly suitable for ecotourism, while 19% of the territory (28,038 km2) is classified as highly suitable. Moreover, 16% of the territory (23,611 km2) falls under the moderately suitable zone, and approximately 13% of the territory (19,184 km2) is classified as having low suitability for ecotourism. Finally, 19% of the territory, covering an area of 28,038 km2, is designated as a very low suitability zone. Furthermore, the southeastern region of Bangladesh, specifically the Chittagong Hill Tracts, is home to a significant expanse of forest cover, making it a prime destination for ecotourism. The central region boasts dense SAL forests, while the southwestern region is known for its thriving mangrove forests. The forested areas in Bangladesh are distributed in a cluster pattern, featuring diverse forest types, which enhances the potential for ecotourism.
- (b)
- Vegetation Distribution: The research identified five unique vegetation distribution groups: very high, high, moderate, low, and very low suitability zones, and they covered 16%, 50%, 24%, 7%, and 3% of the land, respectively. Specifically, the very high suitability zone covered 23,611 km2, the high suitability zone covered 73,785 km2, the moderate suitability zone covered 35,417 km2, the low suitability zone covered 10,330 km2, and the very low zone covered about 4427 km2 of land, as shown in Table 5 and Figure 3B. Notably, the vegetation distribution map highlights the unique environmental conditions present in Bangladesh, with a significant amount of vegetation concentrated in the southeastern region, including the Chittagong Hill Tracts, and the thriving mangrove forest in the southwestern region.
- (c)
- Waterbody Distribution: Five categories—very high, high, moderate, low, and very low—were used to categorize the distribution of waterbodies. These groups cover 2%, 6%, 16%, 59%, and 17% of the total land area, respectively. The very high category covered 2951 km2 of land, the high category covered 8854 km2, the moderate type covered 23,611 km2, the low category covered 87,066 km2, and the very low category covered 25,087 km2 of land, as shown in Table 5 and Figure 3C. The northeastern region, including Sylhet and Sunamganj, and the Mangrove Forest, are characterized by the presence of waterbodies. The presence of water in these regions offers a unique opportunity for ecotourism activities, such as birdwatching, boating, fishing, and enjoying the natural beauty. Additionally, Bangladesh is home to a network of rivers that flow throughout the country.
- (d)
- Wetland Proximity: The area was divided into five suitability zones according to its proximity to wetlands—very high (1%), high (5%), moderate (7%), low (10%), and deficient (77%)—that cover, respectively, 1476 km2, 7379 km2, 10,330 km2, 14,757 km2, and 113,629 km2 of the land in Bangladesh, as shown in Table 5 and Figure 3D. The northeastern region has the highest number of wetlands. These wetlands are crucial habitats for a wide range of flora and fauna and provide vital ecosystem services, such as flood control, water purification, and carbon storage. As such, the northeastern region offers a unique opportunity for ecotourism activities centered around wetland conservation and appreciation, including birdwatching, nature walks, and educational tours focused on wetland ecology.
3.2. Topographic Characteristics
- (a)
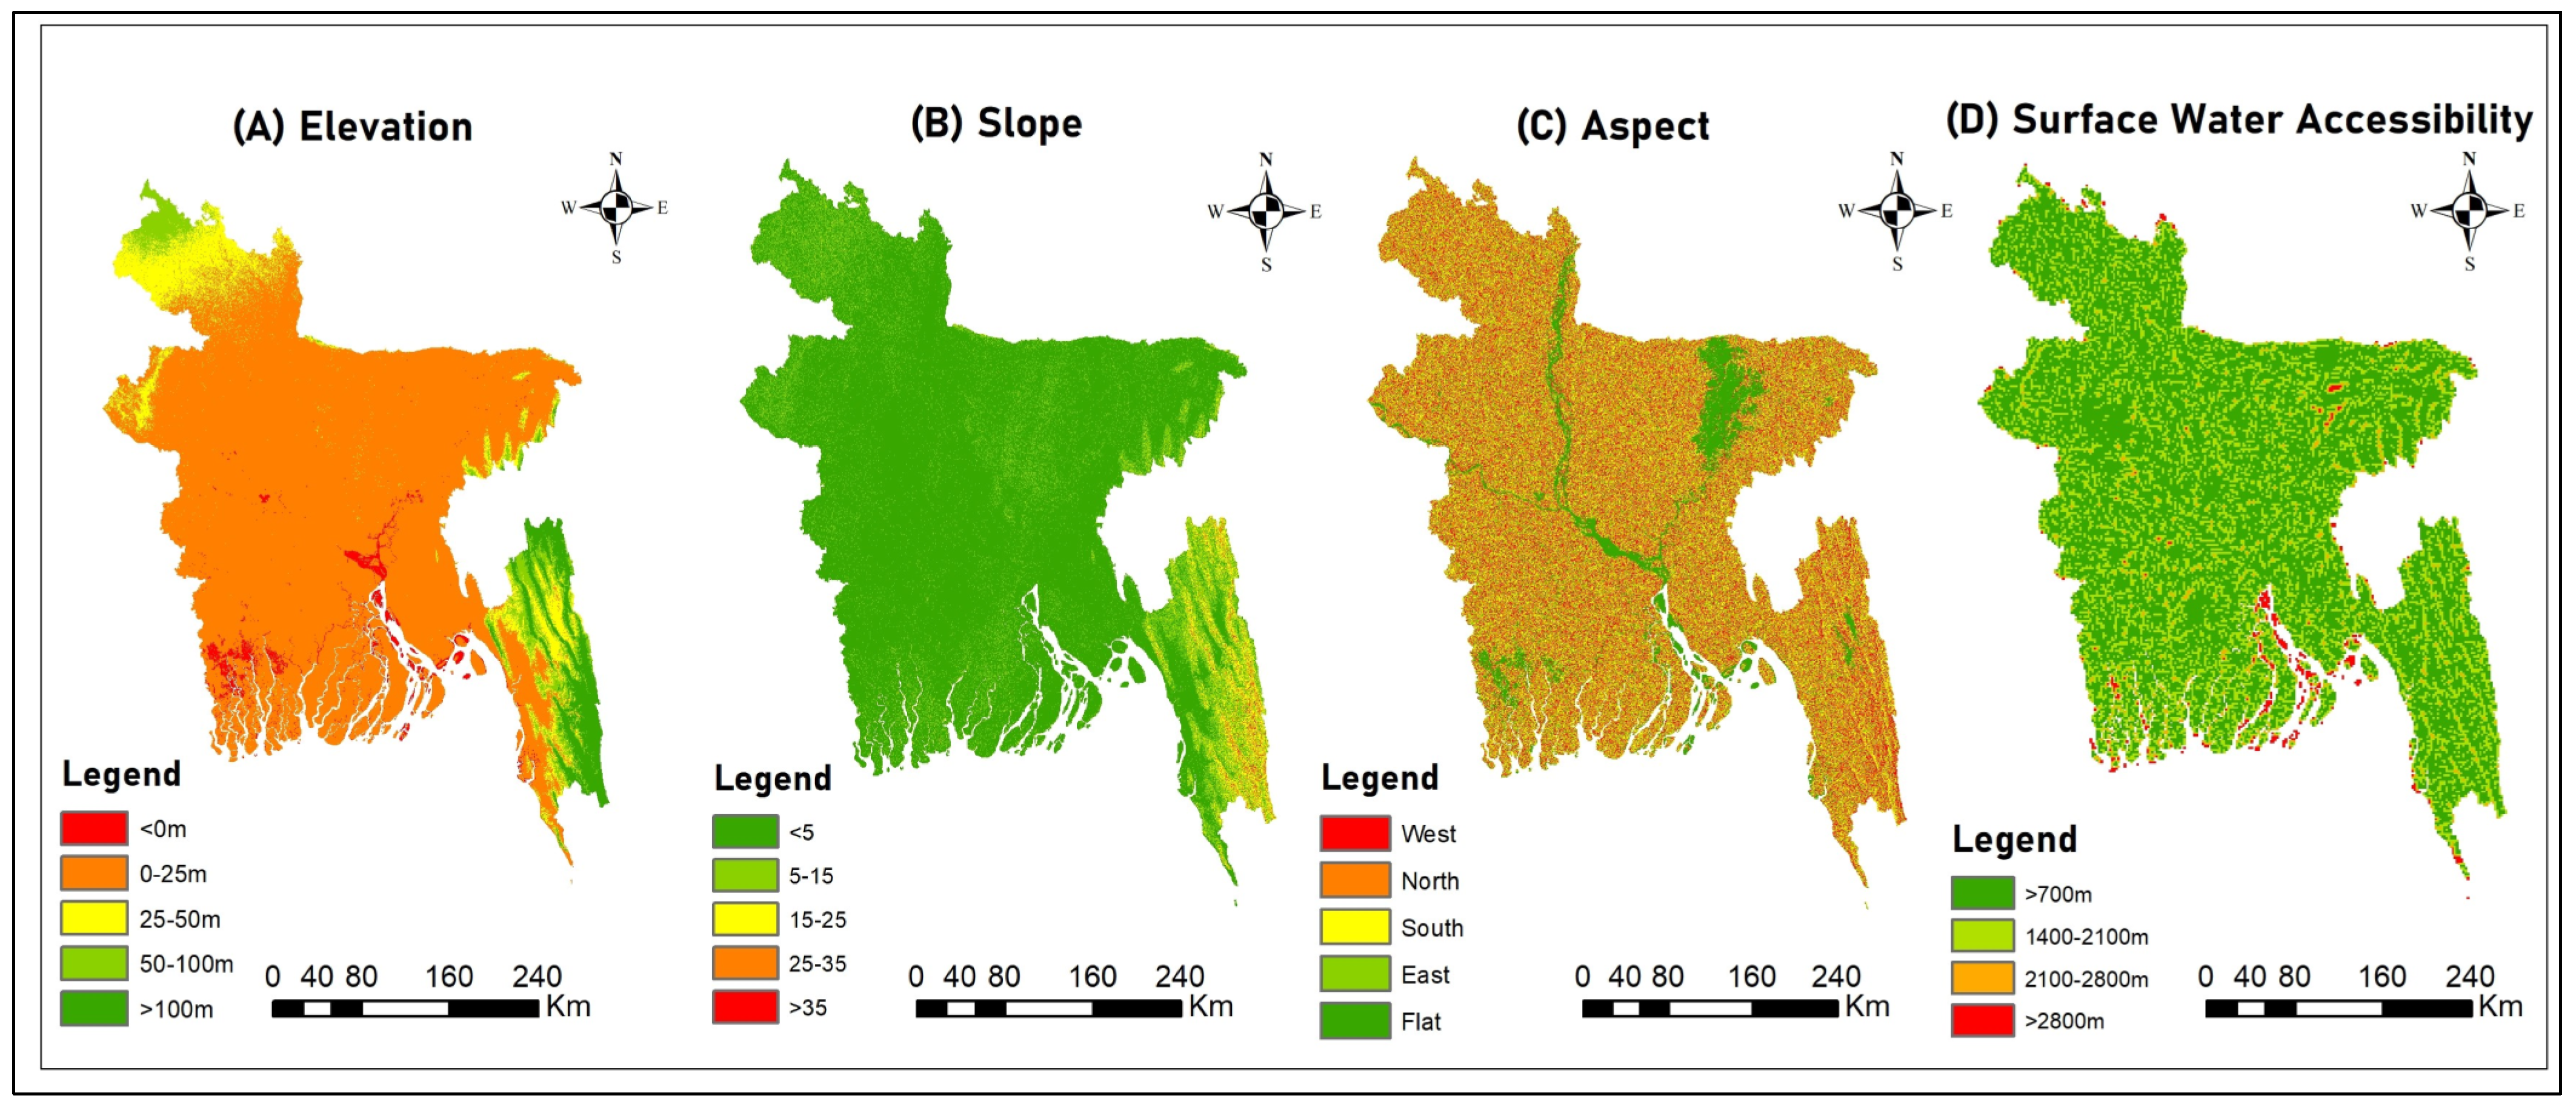
- Elevation: Five suitability zones spanning 5%, 5%, 9%, 79%, and 2% of the total land area were identified for the area based on elevation: very high, high, moderate, low, and very low. Specifically, the very high zone covered 7379 km2 of land, the high zone covered 7379 km2, the moderate zone covered 13,281 km2, the low zone covered 116,580 km2, and the very low zone covered 2951 km2, as shown in Table 5 and Figure 4A. The regions with the most significant elevations can be found in the northwestern and southeastern parts of Bangladesh. Among these areas, the districts of Panchagarh, Bandarban, Rangamati, and Khagracchari boast the highest elevations, making them particularly well-suited for ecotourism activities. These regions offer a unique landscape for tourists to explore, with breathtaking views and the opportunity to experience the traditional lifestyles and cultures of the indigenous people.
- (b)
- Slope: Based on the slope classes, the area was divided into five suitability zones: very high, high, moderate, low and very low, covering 83%, 13%, 3%, 0.7%, and 0.3% of the land, respectively. Specifically, the very high suitability zone covered 122,483 km2, the high zone covered 19,184 km2, the moderate zone covered 4427 km2, the low zone covered 1033 km2, and the very low zone covered 443 km2, as shown in Table 5 and Figure 4B. Certain areas within the southeastern regions are less suitable for ecotourism activities in Bangladesh, specifically parts of Rangamati, Khagracchari, and Bandarban, exhibiting steep slopes that may pose a challenge for ecotourism activities.
- (c)
- Aspect: According to aspect, the area has been divided into five suitability zones: very high (9%), high (24%), moderate (23%), low (21%), and very low (23%), covering 13,281 km2, 35,417 km2, 33,941 km2, 30,990 km2, and 33,941 km2, respectively, as shown in Table 5 and Figure 4C. Notably, suitable zones with flat and east-facing aspects can be found in various regions of Bangladesh, providing opportunities for ecotourism activities across the country.
- (d)
- Surface Water Accessibility: The area was divided into five suitability zones based on the accessibility of surface water: very high, high, moderate, low, and very low. These suitability zones span 97,396 (66%) km2, 45,747 km2 (31%), 2951 km2 (2%), and 1476 km2 (1%), respectively, as shown in Table 5 and Figure 4D. Bangladesh is blessed with abundant surface water resources which cover a significant portion of its land area. The widespread accessibility of surface water not only makes it ideal for various economic activities but also renders it a suitable destination for ecotourism, with opportunities for its development scattered across the country.
3.3. Accessibility
- (a)
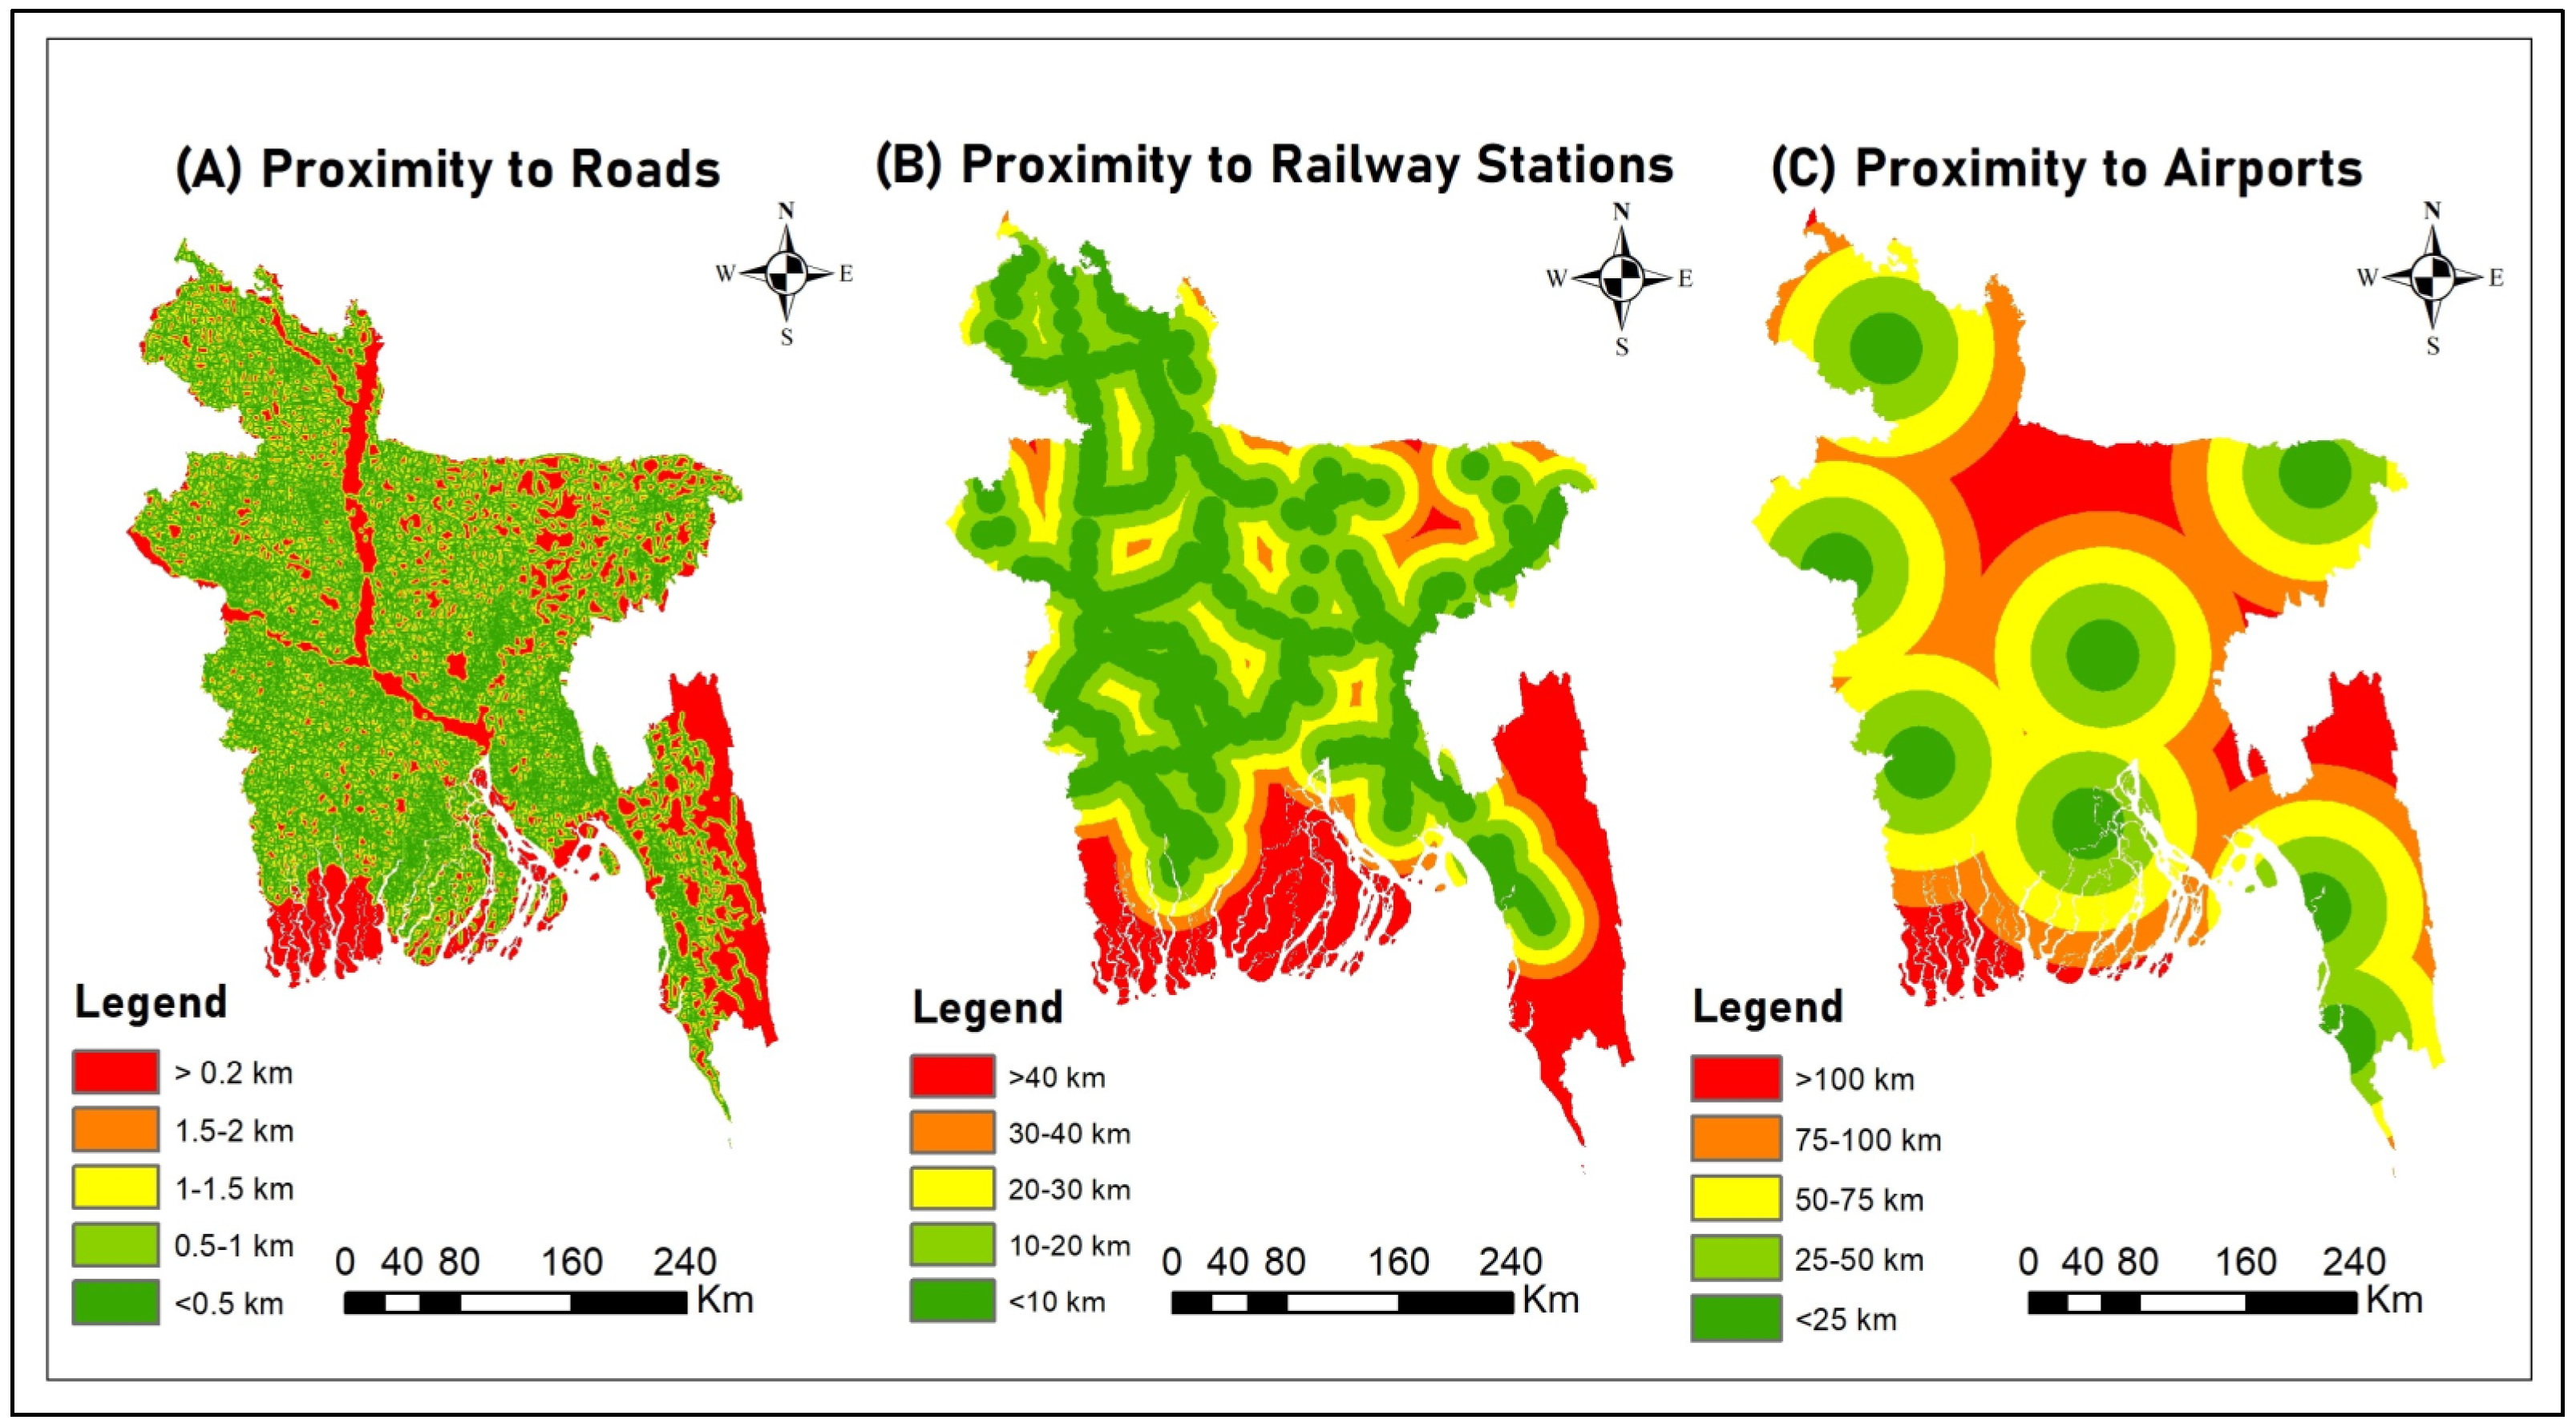
- Distance from Roads: For closeness to roadways, there are five separate appropriateness zones: very high, high, moderate, low, and very low. The very high suitability zone covered 60,504 km2 (41%), the high suitability zone covered 33,941 km2 (23%), the moderate suitability zone covered 17,708 km2 (12%), and the low and very low suitability zones covered 8854 km2 (6%) and 26,563 km2 (18%), respectively, as shown in Table 5 and Figure 5A. Our analysis reveals that the southeastern part of the country, specifically the Rangamati and Bandarban areas, and the southwestern part, specifically the Sundarbans, are characterized by lower levels of road accessibility compared to other regions. While this may pose logistical challenges for tourism activities in these areas, it also offers a unique opportunity for ecotourism experiences focused on wilderness exploration and adventure. Promoting ecotourism activities, such as trekking, camping, and wildlife safaris, that are compatible with the natural environment can develop these regions into unique and sought-after ecotourism destinations.
- (b)
- Distance from Railways: Our analysis based on proximity to railway stations revealed that 35% of the total land area falls within the very high suitability zone, followed by 27% in the high suitability zone, 14% in the moderate suitability zone, 7% in the low suitability zone, and 17% in the very low suitability zone. These zones, respectively, cover 51,650 km2, 39,844 km2, 20,660 km2, 10,333 km2, and 25,087 km2 of the territory, as shown in Table 5 and Figure 5B. Our analysis also revealed that the Sundarbans, Bandarban, Rangamati, and Barisal regions have relatively lower levels of proximity to railway stations, which may pose challenges for tourism development in these areas. Thus, it is essential to consider alternative modes of transportation and infrastructure development that can enable access to these regions while minimizing negative impacts on the environment.
- (c)
- Distance from Airports: The results indicate that 9% of the total land area falls under the very high category, 25% under the high category, 32% under the moderate category, 22% under the low category, and 12% under the very low category for proximity to airports. These zones cover 13,281 km2, 36,893 km2, 47,222 km2, 32,465 km2, and 17,708 km2 of the territory (see Table 5 and Figure 5C for details). Most of the airports are located in the central and southern regions of the country. Areas in the Mymensingh division, parts of the Rangamati and Khagrachhari districts, and the Sundarbans have a lower level of proximity to airports, indicating lower suitability for ecotourism activities.
3.4. Proximity to Facilities
- (a)
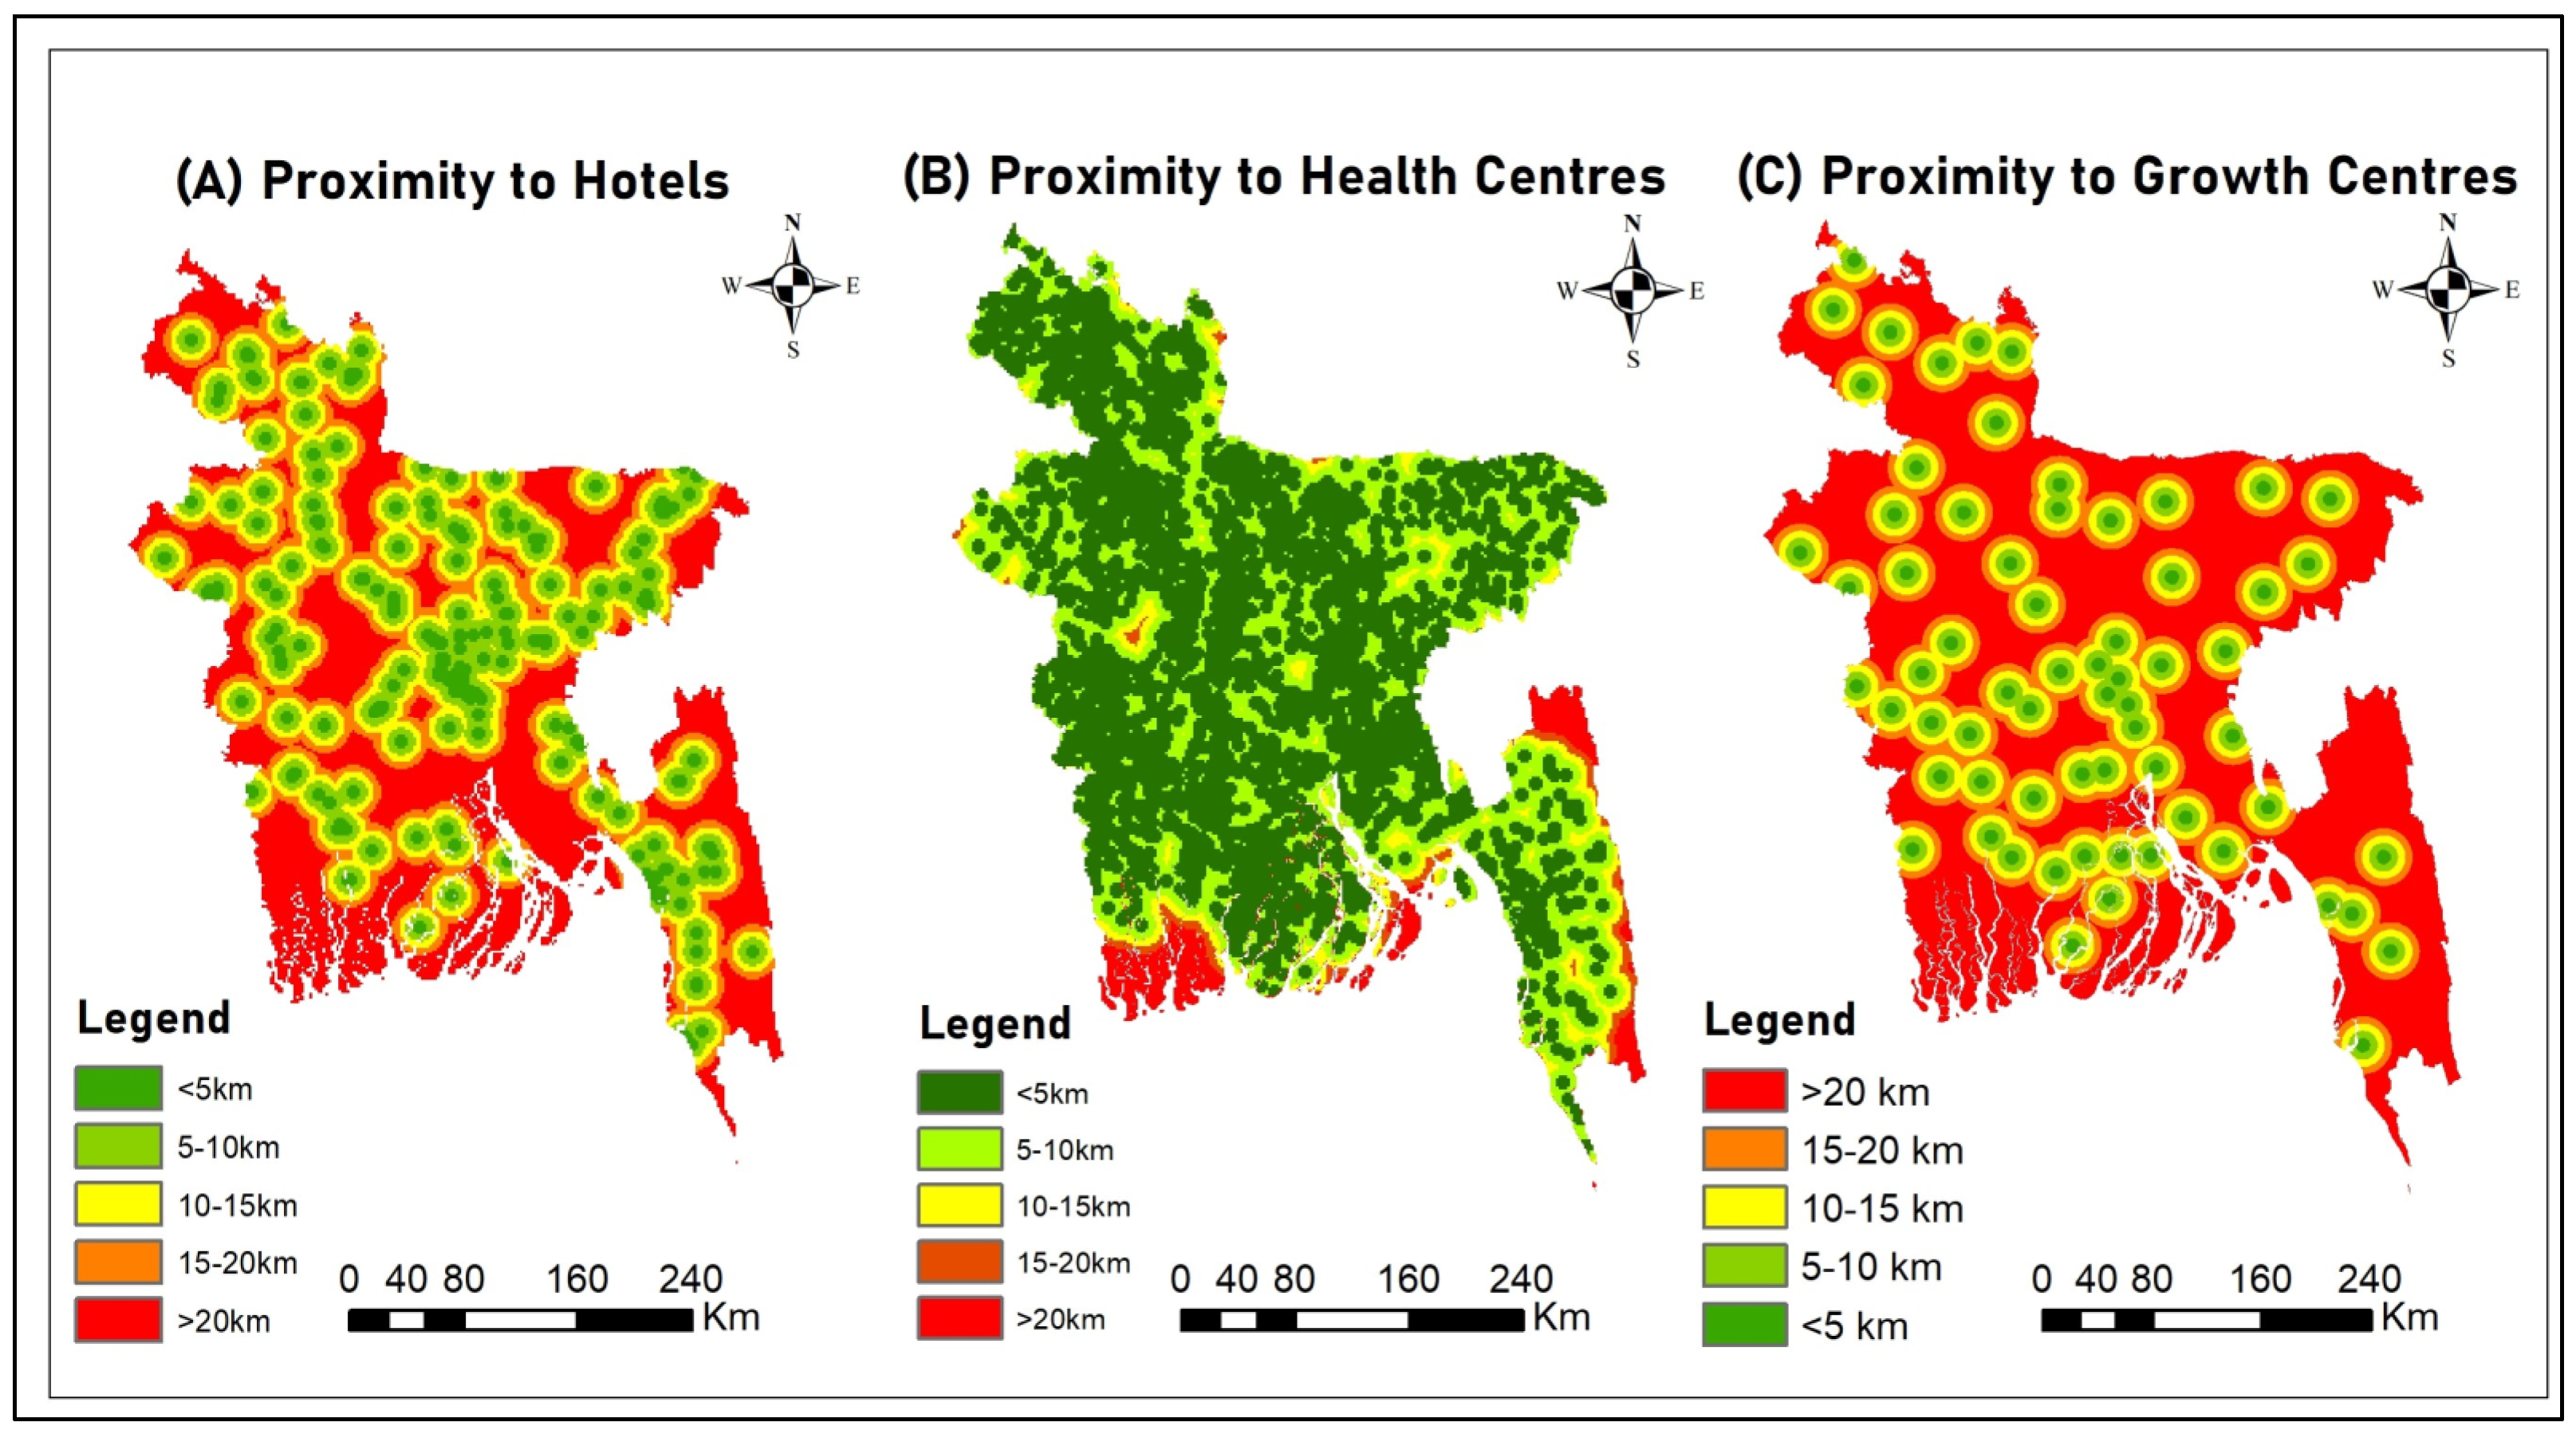
- Proximity to Hotels: Based on hotel accessibility, Bangladesh can be divided into five appropriateness categories: very high, high, moderate, low, and very low, which cover 13,281 km2 (9%), 29,514 km2 (20%), 28,038 km2 (19%), 26,563 km2 (18%), and 50,174 km2 (34%) of the total land area, respectively, as shown in Table 5 and Figure 6A. Several regions of Bangladesh, including parts of Netrakona, Sunamganj, and Kishoreganj in the Southeast, as well as sections of Panchagarh, Jamalpur, Sirajganj, and Pabna in the Southwest, and some areas in the South, such as parts of Sundarbans, Satkhira, Gopalganj, Shariatpur, Madaripur, and Bhola, have limited hotel accessibility, which could negatively impact their appeal as destinations for ecotourism.
- (b)
- Proximity to Health Centers: Five appropriateness zones were established for the area based on its closeness to health facilities: very high: 65%, high: 25%, moderate: 4%, low: 2%, and very low: 4%, which cover 95,921 km2, 36,893 km2, 5903 km2, 2951 km2, and 5903 km2, respectively, as shown in Table 5 and Figure 5B. It is noteworthy that, except for the Sundarbans and small areas in Khagrachhari and Bandarban, most of Bangladesh’s land is near health centers. However, the limited availability of healthcare resources in these regions may hurt their potential as attractive destinations for ecotourism.
- (c)
- Proximity to Growth Centers: The study revealed that the five suitability zones: very high, high, moderate, low, and very low based on proximity to growth centers cover 14.31%, 33.73%, 29.57%, 12.46%, and 9.93% of the total land area, respectively, spanning 20,660 km2, 50,174 km2, 44,271 km2, 17,708 km2, and 14,757 km2 (see Table 5 and Figure 6C for details). The regions close to growth centers are dispersed throughout Bangladesh, offering multiple opportunities for ecotourism activities. These areas provide easy access to urban amenities and economic activities, making them attractive destinations for ecotourists.
3.5. Community Characteristics
- (a)
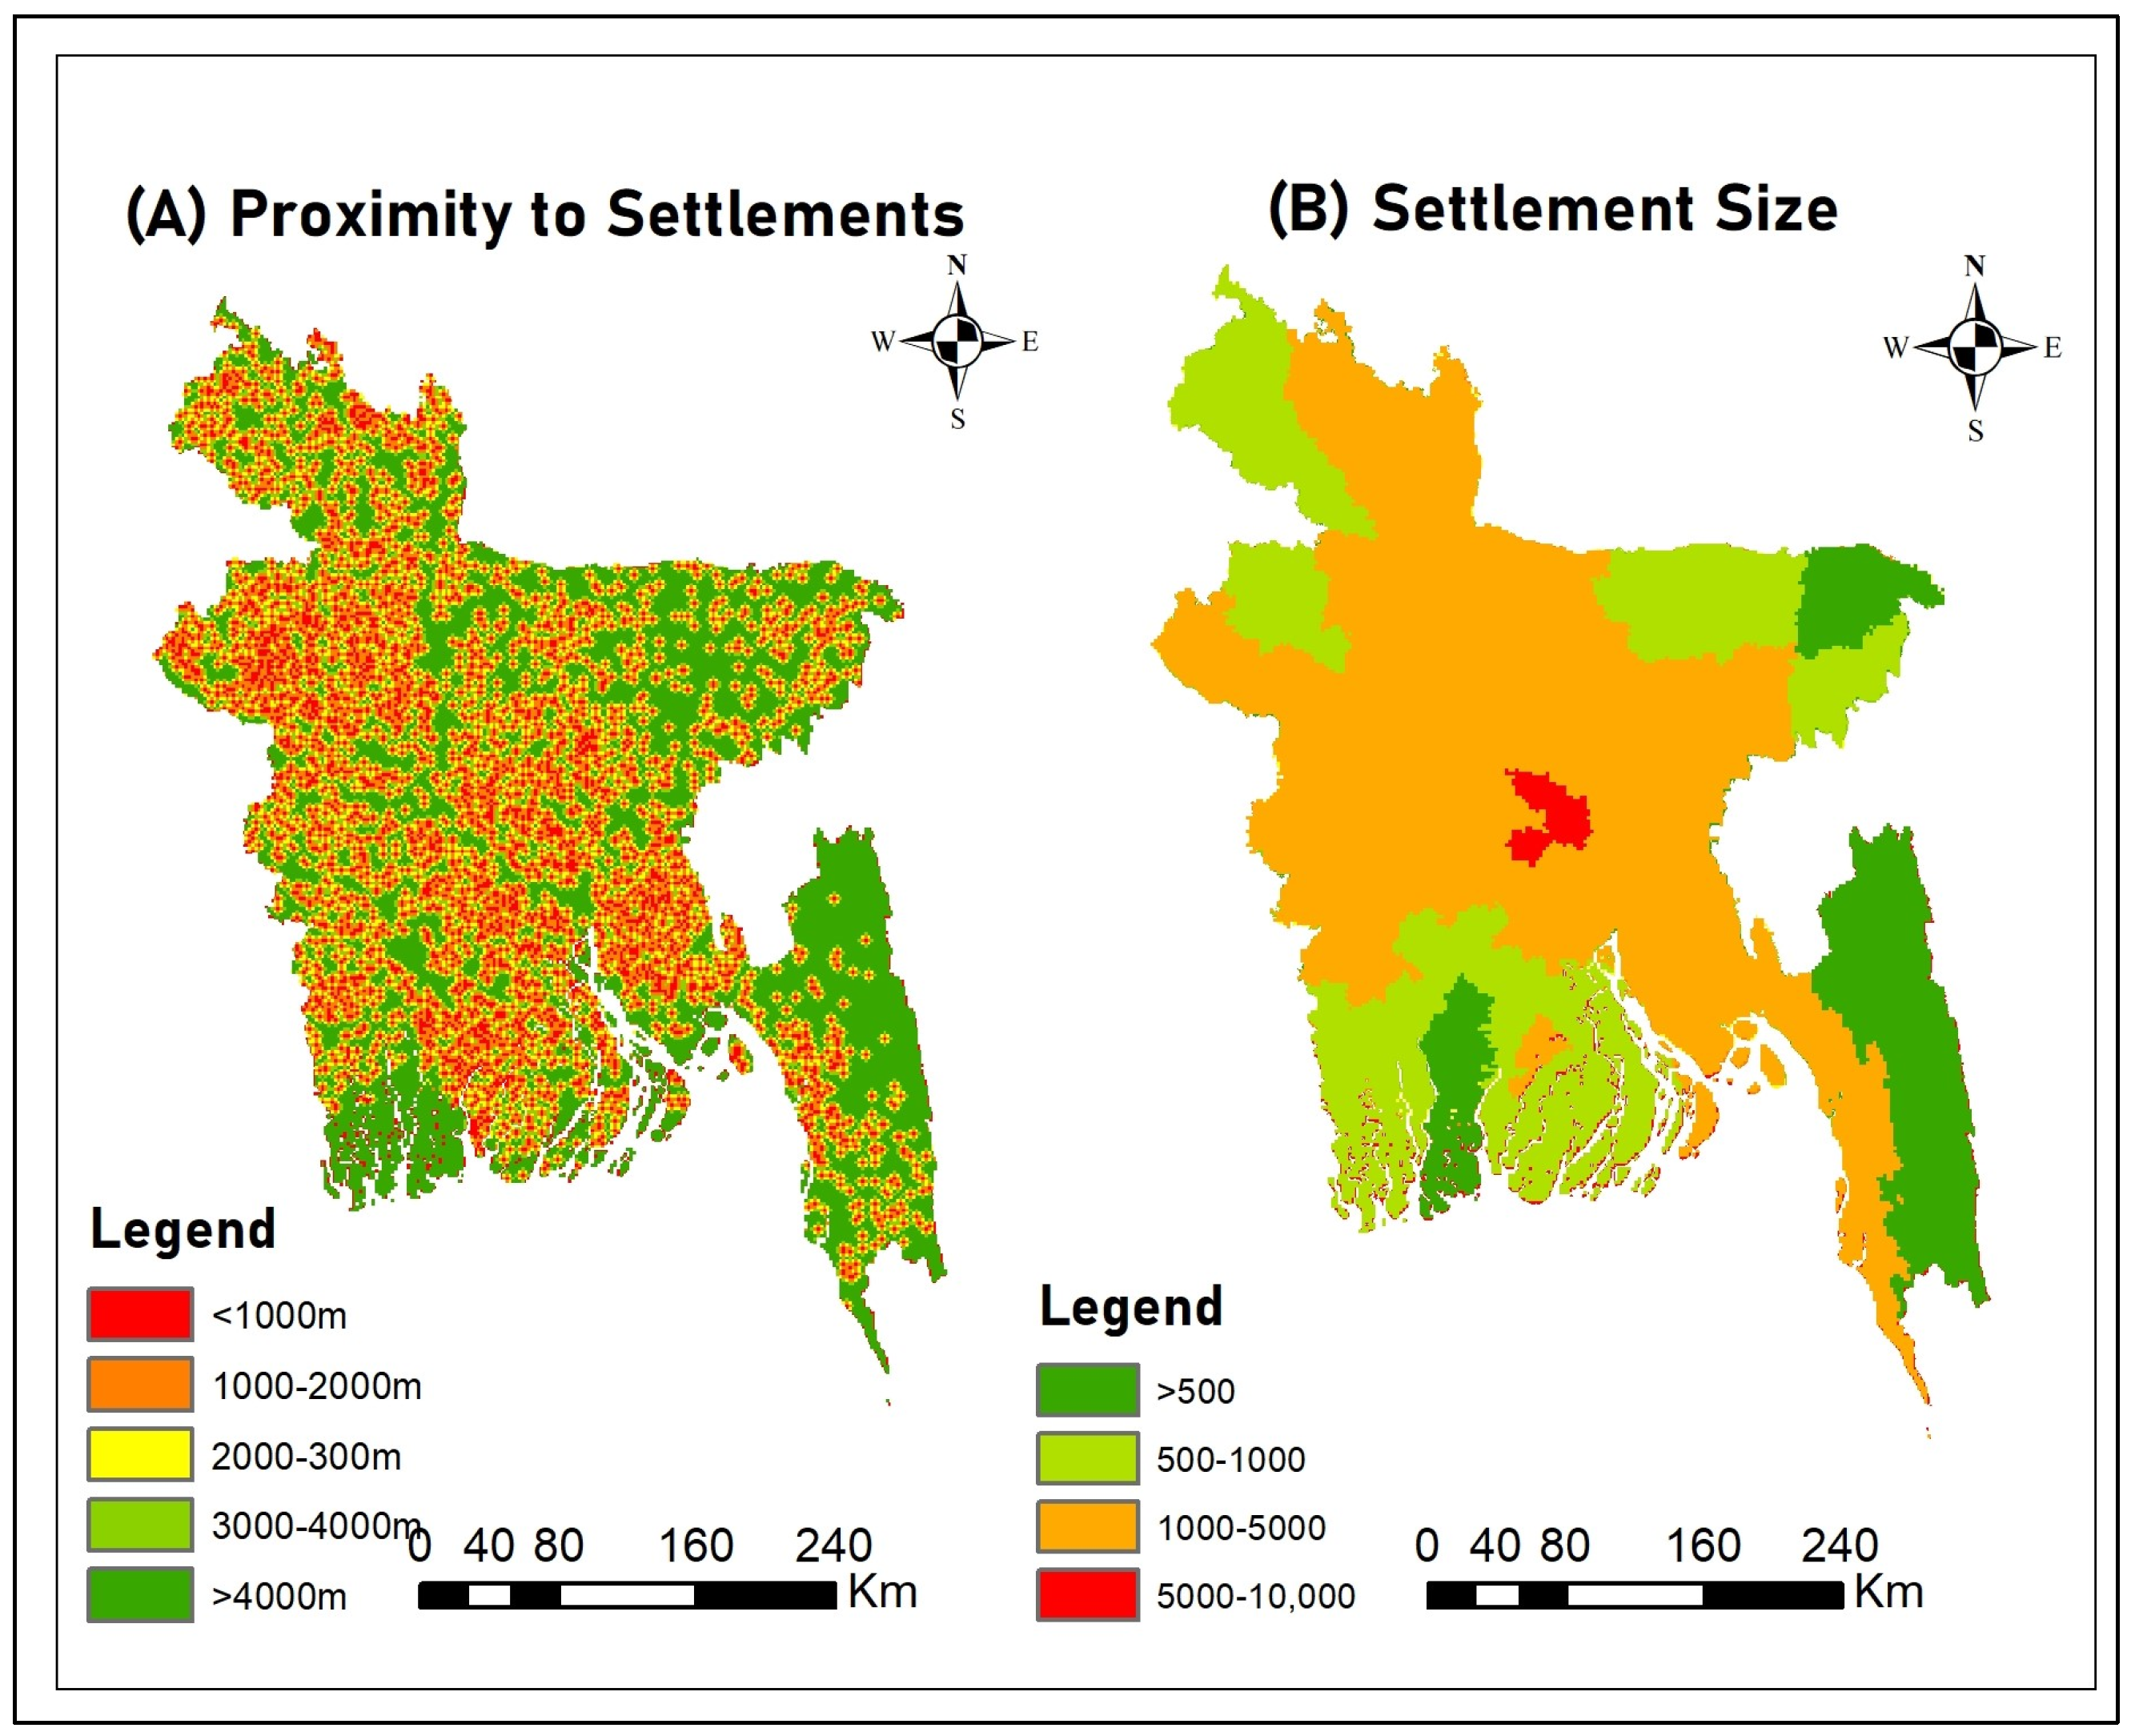
- Proximity to Settlements: The study classified Bangladesh into five suitability zones based on proximity to settlements: very high, high, moderate, low, and very low, covering 12%, 29%, 15%, 10%, and 34% of the region, respectively, which amounts to 17,708 km2, 42,795 km2, 22,136 km2, 14,757 km2, and 50,174 km2 (see Table 5 and Figure 7A for details). We found that the Sundarbans, along with Bandarban, Khagrachhari, Rangamati, Sunamganj, and various other regions scattered throughout Bangladesh, are well-suited for ecotourism due to their remote locations and distance from settlements.
- (b)
- Settlement Size: The study categorized the region into five suitability zones based on settlement size: very high (15%), high (27%), moderate (57%), low (1%), and very low (12%), spanning 22,136 km2, 39,844 km2, 84,115 km2, and 1476 km2, respectively, as shown in Table 5 and Figure 7B. The study highlights that the regions with smaller settlement sizes, such as Panchagarh, Thakurgaon, Dinajpur, and Naogaon in the Northwest, Netrokona, Sunamganj, Sylhet, and Moulavibazar in the Northeast, Satkhira, Khulna, Bagerhat, Narail, Gopalganj, Pirojpur, Jhalokati, Barisal, Bhola, Patuakhali, and Barguna in the Southwest, as well as Rangamati, Khagrachhari, and Bandarban in the Southeast, are particularly well-suited as ecotourism destinations.
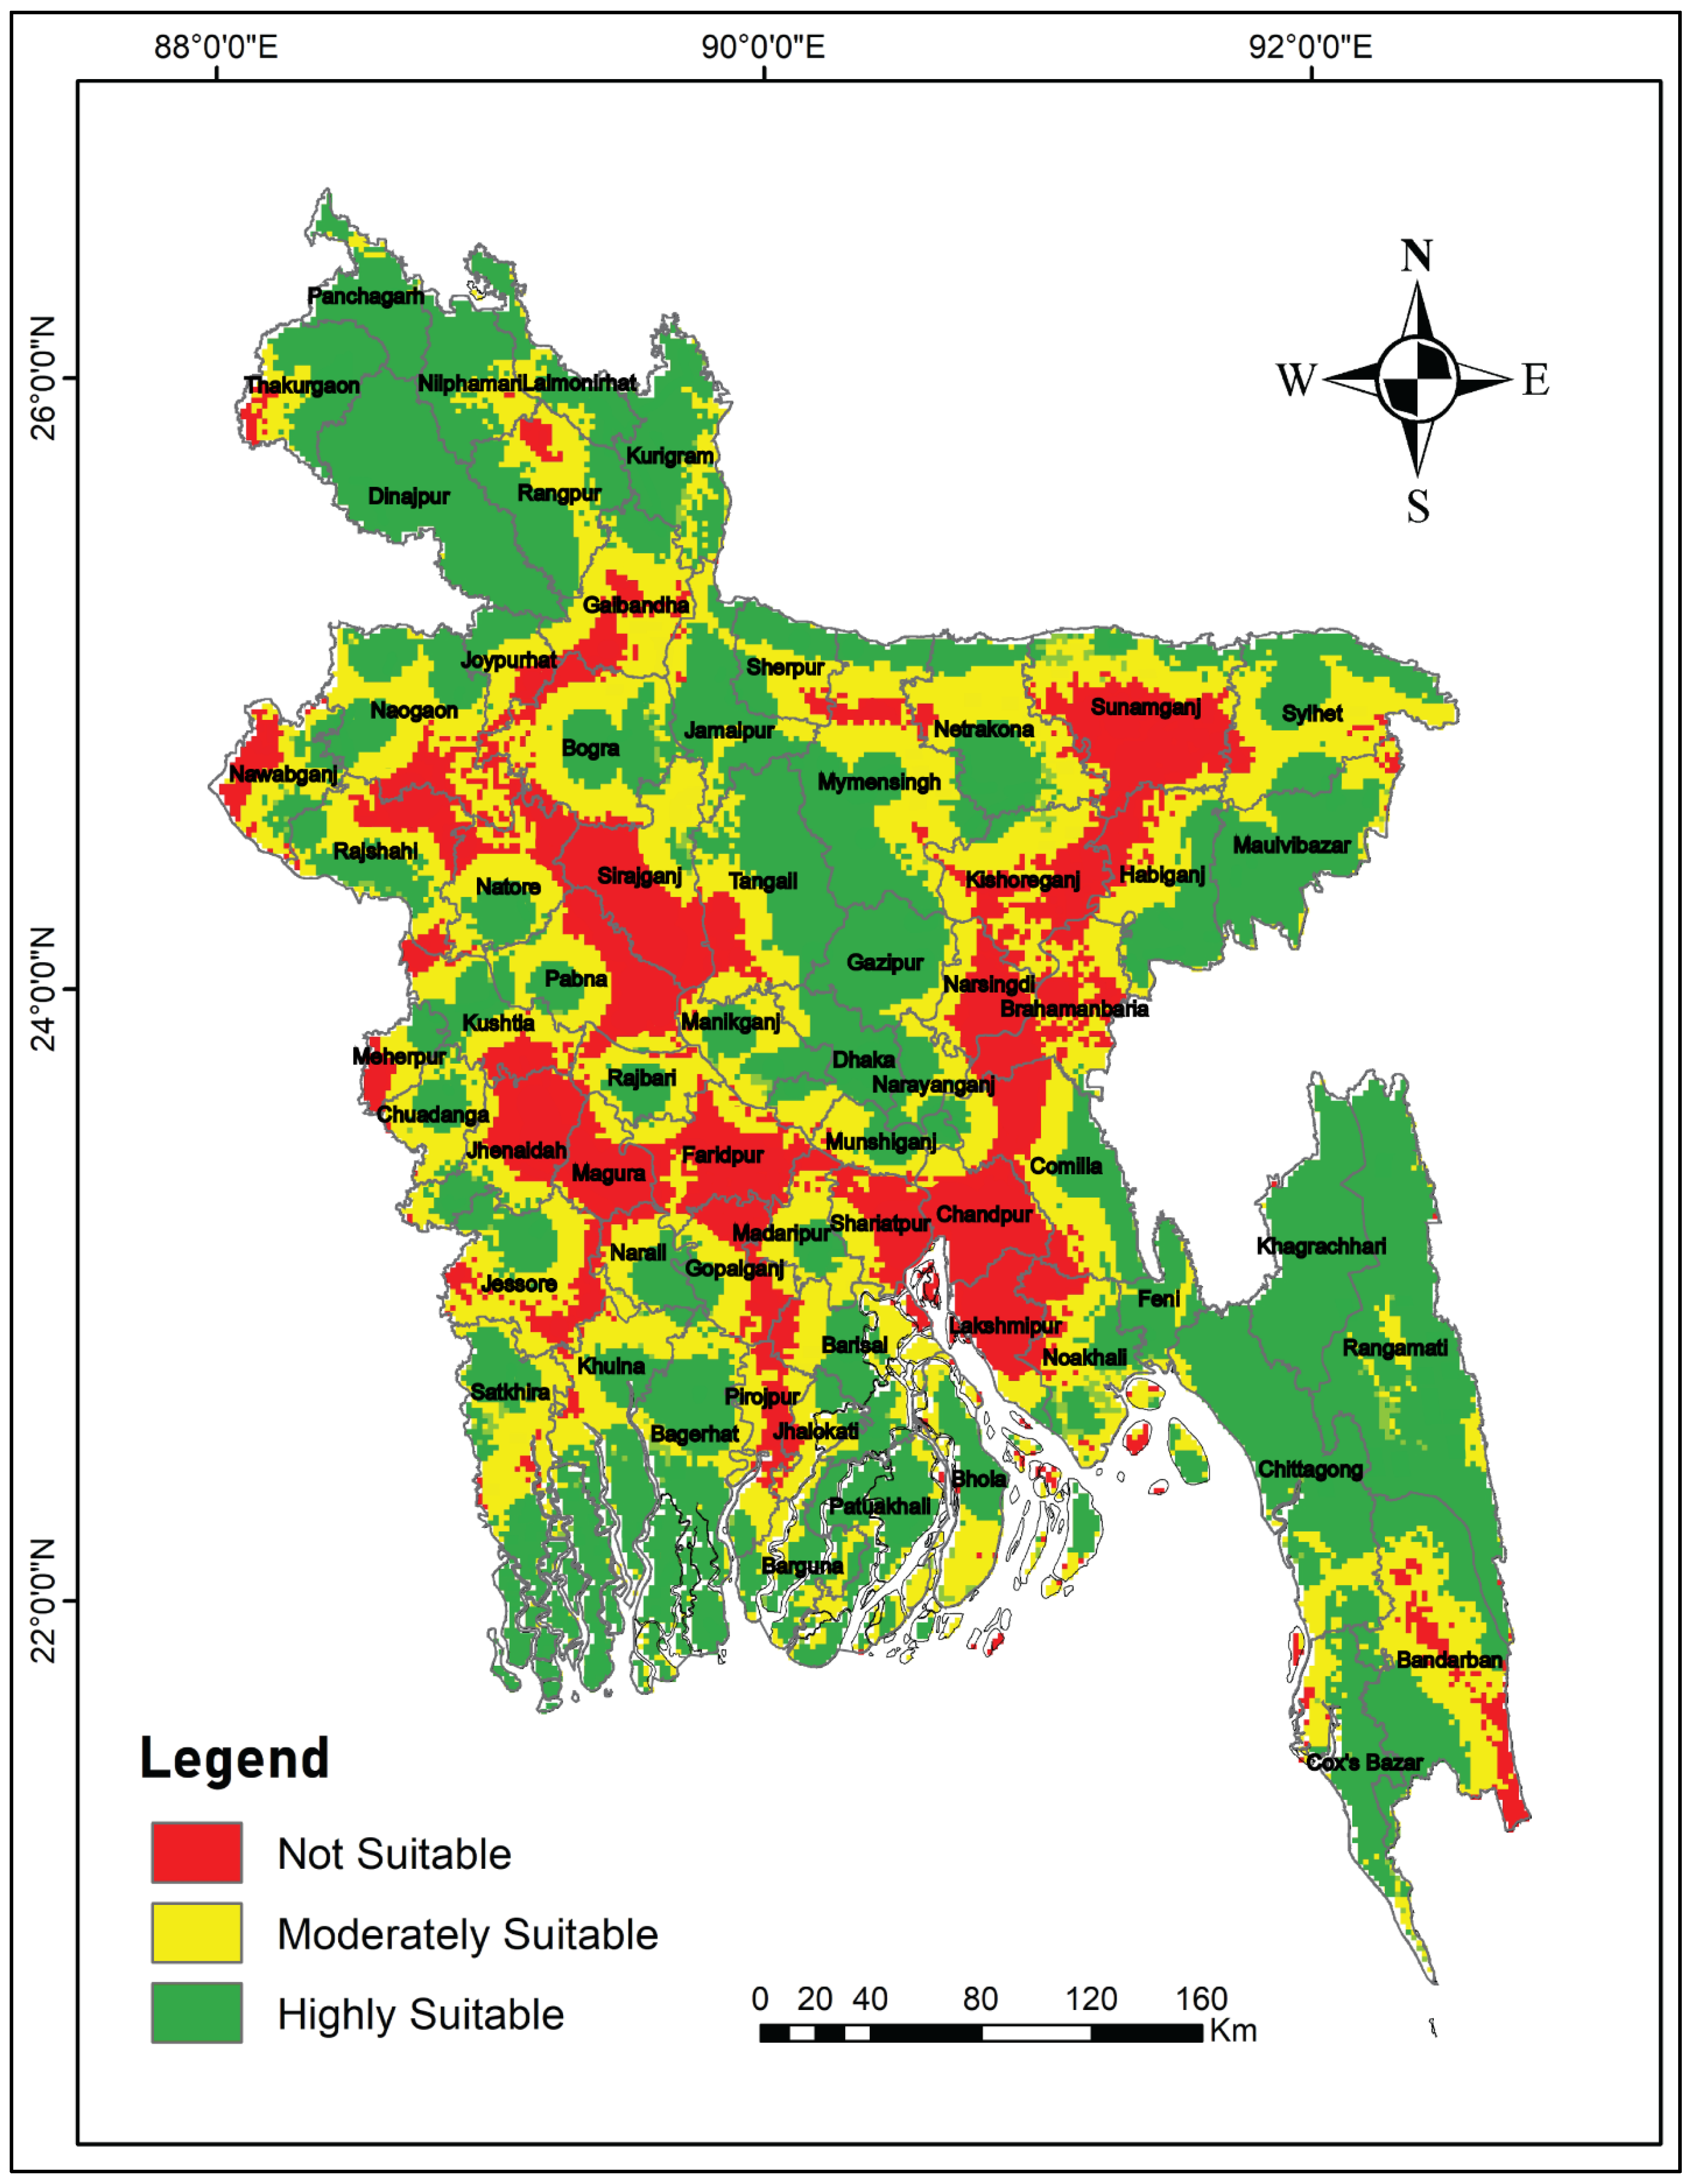
3.6. Ecotourism Suitability Mappings
4. Discussion
- Educate locals about ecotourism and their participation in its maintenance, encouraging environmentally conscious behavior;
- Ensure the tranquility and integrity of ecotourism areas by ensuring compliance through efficient law enforcement;
- Establish effective waste management procedures to prevent contamination and ensure clean tourist destinations;
- Enforce a tight code of conduct for ecotourists, including severe measures for infractions, to limit environmental and wildlife harm;
- Ensure that ecotourism economically benefits local and indigenous communities by creating job opportunities and supporting local businesses;
- Address the food security needs of ethnic groups living near ecotourism areas by ensuring access to nutritious food.
5. Conclusions
Author Contributions
Funding
Institutional Review Board Statement
Informed Consent Statement
Data Availability Statement
Acknowledgments
Conflicts of Interest
Appendix A

| District | Upazila |
|---|---|
| Panchagarh | Atwari, Boda, Panchagarh Sadar, Debiganj, Tentulia |
| Thakurgaon | Baliadangi, Thakurgaon Sadar, Birganj |
| Dinajpur | Kaharole, Biral, Birampur, Birganj, Bochaganj, Chirirbandar, Dinajpur Sadar, Fulbari, Ghoraghat, Hakimpur, Kaharole, Khansama, Nawabganj, Parbatipur |
| Gaibandha | Sundarganj |
| Kurigram | Bhurungamari, Char Rajibpur, Chilmari, Kurigram Sadar, Nageshwari, Phulbari, Rajarhat, Raumari, Ulipur |
| Lalmonirhat | Aditmari, Hatibandha, Kaliganj, Lalmonirhat Sadar, Patgram |
| Rangpur | Badarganj, Kaunia, Mitha Pukur, Pirgachha, Pirganj, Taraganj |
| Nilphamari | Dimla, Domar, Nilphamari Sadar |
| Joypurhat | Panchbibi |
| Naogaon | Badalgachhi, Niamatpur, Patnitala |
| Nawabganj | Nawabganj Sadar |
| Rajshahi | Charghat, Godagari, Matihar, Boalia, Paba, Rajpara, Shah Makhdum |
| Bogra | Bogra Sadar, Dhunat, Gabtali, Sariakandi, Shajahanpur |
| Jamalpur | Bakshiganj, Islampur, Jamalpur Sadar, Madarganj, Melandaha |
| Sherpur | Jhenaigati, Sreebardi |
| Mymensingh | Bhaluka, Dhobaura, Fulbaria, Muktagachha |
| Netrakona | Atpara, Durgapur, Kendua, Madan |
| Sunamganj | Tahirpur, Dowarabazar |
| Sylhet | Gowainghat, Jaintiapur, Companiganj, Fenchuganj, Sylhet Sadar |
| Maulvibazar | Juri, Kamalganj, Kulaura, Maulvi Bazar Sadar, Rajnagar, Sreemangal |
| Habiganj | Nabiganj, Chunarughat, Madhabpur, Bahubal, Nabiganj |
| Gazipur | Gazipur Sadar, Kaliakair, Kapasia, Sreepur |
| Tangail | Basail, Bhuapur, Gopalpur, Madhupur, Mirzapur, Sakhipur |
| Sirajganj | Sirajganj Sadar |
| Natore | Bagati Para, Baraigram |
| Kushtia | Bheramara |
| Pabna | Ishwardi, Pabna Sadar |
| Narayanganj | Rupganj, Sonargaon, Gazaria |
| Dhaka | Dohar, Nawabganj, Keraniganj, Savar, Dhamrai |
| Manikganj | Ghior, Shibalaya, Singair |
| Rajbari | Balia Kandi |
| Chuadanga | Chuadanga Sadar |
| Munshiganj | Tongibari |
| Jhenaidah | Maheshpur |
| Comilla | Burichang, Comilla Adarsha Sadar, Comilla Sadar Dakshin, Chauddagram |
| Madaripur | Madaripur Sadar |
| Narail | Kalia |
| Jessore | Chaugachha, Kotwali |
| Satkhira | Satkhira Sadar, Kalaroa, Shyamnagar, Debhata |
| Khulna | Batiaghata, Dacope, Koyra |
| Bagerhat | Bagerhat Sadar, Kachua, Fakirhat, Morrelganj, Rampal, Sarankhola |
| Pirojpur | Patharghata |
| Jhalokati | Jhalokati Sadar |
| Barisal | Babuganj, Bakerganj, Barisal Sadar (Kotwali), Gaurnadi |
| Barguna | Barguna Sadar |
| Bhola | Tazumuddin, Burhanuddin, Daulatkhan |
| Noakhali | Hatiya, Kabirhat, Companiganj, Subarnachar |
| Feni | Daganbhuiyan, Feni Sadar, Fulgazi, Parshuram |
| Chittagong | Banshkhali, Boalkhali, Chandanaish, Fatikchhari, Hathazari, Lohagara, Mirsharai, Patiya, Rangunia, Raozan, Sandwip, Satkania, Sitakunda, Anwara |
| Cox’s Bazar | Cox’s Bazar Sadar, Ramu, Teknaf, Ukhia |
| Bandarban | Alikadam, Naikhongchhari, Rowangchhari |
| Khagrachhari | Dighinala, Khagrachhari Sadar, Lakshmichhari, Mahalchhari, Manikchhari, Matiranga, Panchhari, Ramgarh |
| Rangamati | Baghai Chhari, Barkal, Belai Chhari, Jurai Chhari, Kaptai, Kawkhali (Betbunia), Langadu, Naniarchar, Rajasthali, Rangamati Sadar |
References
- Boyd, S.W.; Butler, R.W. Managing ecotourism: An opportunity spectrum approach. Tour. Manag. 1996, 17, 557–566. [Google Scholar] [CrossRef]
- Diamantis, D. The concept of ecotourism: Evolution and trends. Curr. Issues Tour. 1999, 2, 93–122. [Google Scholar] [CrossRef]
- Fung, T.; Wong, F.K.-K. Ecotourism planning using multiple criteria evaluation with GIS. Geocarto Int. 2007, 22, 87–105. [Google Scholar] [CrossRef]
- Krüger, O. The role of ecotourism in conservation: Panacea or Pandora’s box? Biodivers. Conserv. 2005, 14, 579–600. [Google Scholar] [CrossRef]
- Honey, M. Ecotourism and Sustainable Development. Who Owns Paradise? 2nd ed.; Island Press: Washington, DC, USA, 1999; Volume 22. [Google Scholar] [CrossRef]
- Rafa, N.; Nuzhat, S.; Uddin, S.M.N.; Gupta, M.; Rakshit, R. Ecotourism as a forest conservation tool: An ndvi analysis of the sitakunda botanical garden and ecopark in Chattogram, Bangladesh. Sustainability 2021, 13, 21. [Google Scholar] [CrossRef]
- Sahani, N. Application of analytical hierarchy process and GIS for ecotourism potentiality mapping in Kullu District, Himachal Pradesh, India. Environ. Dev. Sustain. 2020, 22, 6187–6211. [Google Scholar] [CrossRef]
- Ahmadi, M.; Darabkhani, M.F.; Ghanavati, E. A GIS-based Multi-criteria Decision-making Approach to Identify Site Attraction for Ecotourism Development in Ilam Province, Iran. Tour. Plan. Dev. 2015, 12, 176–189. [Google Scholar] [CrossRef]
- Buckley, R. Evaluating the net effects of ecotourism on the environment: A framework, first assessment and future research. J. Sustain. Tour. 2009, 17, 643–672. [Google Scholar] [CrossRef] [Green Version]
- Chaudhary, S.; Kumar, A.; Pramanik, M.; Negi, M.S. Land evaluation and sustainable development of ecotourism in the Garhwal Himalayan region using geospatial technology and analytical hierarchy process. Environ. Dev. Sustain. 2022, 24, 2225–2266. [Google Scholar] [CrossRef]
- Acharya, A.; Mondal, B.K.; Bhadra, T.; Abdelrahman, K.; Mishra, P.K.; Tiwari, A.; Das, R. Geospatial Analysis of Geo-Ecotourism Site Suitability Using AHP and GIS for Sustainable and Resilient Tourism Planning in West Bengal, India. Sustainability 2022, 14, 2422. [Google Scholar] [CrossRef]
- Ghorbanzadeh, O.; Pourmoradian, S.; Blaschke, T.; Feizizadeh, B. Mapping potential nature-based tourism areas by applying GIS-decision making systems in East Azerbaijan Province, Iran. J. Ecotour. 2019, 18, 261–283. [Google Scholar] [CrossRef]
- Costa, T.D.O.; De Assis, L.R.; Calijuri, M.L.; Assemany, P.P.; Lima, G.S. Definição de zonas prioritárias para a conservação e ecoturismo em uma área protegida. Rev. Arvore 2016, 40, 769–779. [Google Scholar] [CrossRef] [Green Version]
- Brandt, J.S.; Buckley, R.C. A global systematic review of empirical evidence of ecotourism impacts on forests in biodiversity hotspots. Curr. Opin. Environ. Sustain. 2018, 32, 112–118. [Google Scholar] [CrossRef]
- Stronza, A.L.; Hunt, C.A.; Fitzgerald, L.A. Ecotourism for conservation? In Routledge Handbook of Ecotourism; Routledge: London, UK, 2022; pp. 372–397. [Google Scholar] [CrossRef]
- Gössling, S. Ecotourism: A means to safeguard biodiversity and ecosystem functions? Ecol. Econ. 1999, 29, 303–320. [Google Scholar] [CrossRef]
- Weaver, D.B.; Lawton, L.J. Twenty years on: The state of contemporary ecotourism research. Tour. Manag. 2007, 28, 1168–1179. [Google Scholar] [CrossRef] [Green Version]
- UNWTO. International Tourism Highlights International Tourism Trends, 2019; UNWTO: Madrid, Spain, 2020; pp. 1–24. [Google Scholar]
- Movono, A.; Hughes, E. Tourism partnerships: Localizing the SDG agenda in Fiji Tourism partnerships. J. Sustain. Tour. 2020, 30, 2318–2332. [Google Scholar] [CrossRef]
- Rahman, S.A.; Islam, M.; Salman, A.; Rafiq, M.R. Evaluating bank erosion and identifying possible anthropogenic causative factors of Kirtankhola River in Barishal, Bangladesh: An integrated GIS and Remote Sensing approaches. Int. J. Eng. Geosci. 2021, 7, 179–190. [Google Scholar] [CrossRef]
- Malczewski, J. GIS-based land-use suitability analysis: A critical overview. Prog. Plan. 2004, 62, 3–65. [Google Scholar] [CrossRef]
- Pereira, J.M.; Duckstein, L. A multiple criteria decision-making approach to GIS-based land suitability evaluation. Int. J. Geogr. Inf. Syst. 1993, 7, 407–424. [Google Scholar] [CrossRef]
- Satty, T.L.; Vargas, L.G. Models, Methods, Concepts & Applications of the Analytic Hierarchy Process; International Series in Operations Research & Management Science; Springer Science & Business Media: Berlin/Heidelberg, Germany, 2001. [Google Scholar]
- Mahdavi, A.; Niknejad, M. Site suitability evaluation for ecotourism using MCDM methods and GIS: Case study-Lorestan province, Iran. J. Biodivers. Environ. Sci. 2014, 4, 2220–6663. [Google Scholar]
- Bunruamkaew, K.; Murayam, Y. Site suitability evaluation for ecotourism using GIS & AHP: A case study of surat Thani Province, Thailand. Procedia Soc. Behav. Sci. 2011, 21, 269–278. [Google Scholar] [CrossRef] [Green Version]
- Kumari, S.; Behera, M.D.; Tewari, H.R. Identification of potential ecotourism sites in West District, Sikkim using geospatial tools. Trop. Ecol. 2010, 51, 75–85. [Google Scholar]
- Ullah, K.M.; Hafiz, R. Finding suitable locations for ecotourism development in Cox’s Bazar using Geographical Information System and Analytical Hierarchy Process. Geocarto Int. 2014, 29, 256–267. [Google Scholar] [CrossRef]
- Rahman, M.A. Application of GIS in ecotourism development: A case study in Sundarbans, Bangladesh. Master’s Thesis, Mid Sweden Universrity, Sundsvall, Sweden, June 2010; pp. 1–89. Available online: https://www.diva-portal.org/smash/record.jsf?pid=diva2%3A326461 (accessed on 8 April 2023).
- Nagendra, H.; Karmacharya, M.; Karna, B. Evaluating forest management in Nepal: Views across space and time. Ecol. Soc. 2005, 10, 24. [Google Scholar] [CrossRef]
- Wyman, M.S.; Stein, T.V. Modeling social and land-use/land-cover change data to assess drivers of smallholder deforestation in Belize. Appl. Geogr. 2010, 30, 329–342. [Google Scholar] [CrossRef]
- Vuohelainen, A.J.; Coad, L.; Marthews, T.R.; Malhi, Y.; Killeen, T.J. The effectiveness of contrasting protected areas in preventing deforestation in Madre de Dios, Peru. Environ. Manag. 2012, 50, 645–663. [Google Scholar] [CrossRef] [PubMed]
- Manzo-Delgado, L.; López-García, J.; Alcántara-Ayala, I. Role of forest conservation in lessening land degradation in a temperate region: The Monarch Butterfly Biosphere Reserve, Mexico. J. Environ. Manag. 2014, 138, 55–66. [Google Scholar] [CrossRef]
- Masud, M.M.; Aldakhil, A.M.; Nassani, A.A.; Azam, M.N. Community-based ecotourism management for sustainable development of marine protected areas in Malaysia. Ocean Coast. Manag. 2017, 136, 104–112. [Google Scholar] [CrossRef]
- Martínez, Y.C.; Baños, M.R.; Monroy, H.C. Ecotourism as a path to sustainable development in an isolated Magic Town: The case study of La Trampa, Mexico. J. Tour. Anal. 2018, 25, 23–38. [Google Scholar] [CrossRef] [Green Version]
- Seifi, F.; Ghobadi, G.R.J. The Role of Ecotourism Potentials in Ecological and Environmental Sustainable Development of Miankaleh Protected Region. Open J. Geol. 2017, 7, 478–487. [Google Scholar] [CrossRef]
- Khondkar, D.M.; Anis, A. Bangladesh as an ecotourism destination. Univ. J. Mark. 2016, 16, 77–90. [Google Scholar]
- Hasan, S.S.; Deng, X.; Li, Z.; Chen, D. Projections of future land use in Bangladesh under the background of baseline, ecological protection and economic development. Sustainability 2017, 9, 505. [Google Scholar] [CrossRef] [Green Version]
- Tilman, D.; Clark, M.; Williams, D.R.; Kimmel, K.; Polasky, S.; Packer, C. Future threats to biodiversity and pathways to their prevention. Nature 2017, 546, 73–81. [Google Scholar] [CrossRef] [PubMed]
- Gigović, L.; Pamučar, D.; Lukić, D.; Marković, S. GIS-Fuzzy DEMATEL MCDA model for the evaluation of the sites for ecotourism development: A case study of ‘Dunavski ključ’ region, Serbia. Land Use Policy 2016, 58, 348–365. [Google Scholar] [CrossRef]
- Liu, Y.; Wang, Y.; Peng, J.; Du, Y.; Liu, X.; Li, S.; Zhang, D. Correlations between urbanization and vegetation degradation across the world’s metropolises using DMSP/OLS nighttime light data. Remote Sens. 2015, 7, 2067–2088. [Google Scholar] [CrossRef] [Green Version]
- WorldData, info. Available online: https://www.worlddata.info/asia/bangladesh/tourism.php (accessed on 8 April 2023).
- Sultana, S. Economic contribution of tourism in Bangladesh. J. Tour. Hosp. Sports 2016, 22, 223–237. [Google Scholar] [CrossRef]
- Shoeb-Ur-Rahman, M.; Shahid, R.B. A Growing Dilemma of Tourism Diffusion and Sustainability: Wows and Woes for Bangladesh Ecotourism! UTMS J. Econ. 2012, 3, 57–69. [Google Scholar]
- Islam, F.; Islam, N. Tourism in Bangladesh: An analysis of foreign tourist arrivals. J. Travel Tour. Res. 2006, 4, 1. [Google Scholar]
- Afroz, N.; Mahmud, M.S. Analyzing The Problem And Prospects Of Ecotourism: A Review On Bangladesh. IOSR J. Bus. Manag. 2017, 19, 59–65. [Google Scholar] [CrossRef]
- Ahsan, M.N. Ecotourism in Bangladesh: A new tool for economic development. J. Socioecon. Res. Dev. 2008, 5, 299–304. [Google Scholar]
- Ullah, K.M.; Urban, M.O.F.; Planning, R. Finding Suitable Locations for Ecotourism Development in Cox’s Bazar. Master’s Thesis, Bangladesh University of Engineering and Technology, Dhaka, Bangladesh, January 2013. [Google Scholar]
- Yang, L.; Meng, X.; Zhang, X. SRTM DEM and its application advances. Int. J. Remote Sens. 2011, 32, 3875–3896. [Google Scholar] [CrossRef]
- Rabus, B.; Eineder, M.; Roth, A.; Bamler, R. The shuttle radar topography mission—A new class of digital elevation models acquired by spaceborne radar. ISPRS J. Photogramm. Remote Sens. 2003, 57, 241–262. [Google Scholar] [CrossRef]
- Bagheri, S.; Karimzadeh, S.; Feizizadeh, B. Investigation and modeling of physical development of urban areas and its effects on light pollution using night light data. Int. J. Eng. Geosci. 2022, 8, 98–110. [Google Scholar] [CrossRef]
- Abdel-Basset, M.; Mohamed, M.; Abdel-Monem, A.; Elfattah, M.A. New extension of ordinal priority approach for multiple attribute decision-making problems: Design and analysis. Complex Intell. Syst. 2022, 8, 4955–4970. [Google Scholar] [CrossRef]
- Ataei, Y.; Mahmoudi, A.; Feylizadeh, M.R.; Li, D.-F. Ordinal Priority Approach (OPA) in Multiple Attribute Decision-Making. Appl. Soft Comput. J. 2020, 86, 105893. [Google Scholar] [CrossRef]
- Mahmoudi, A.; Abbasi, M.; Deng, X. Evaluating the Performance of the Suppliers Using Hybrid DEA-OPA Model: A Sustainable Development Perspective. Group Decis. Negot. 2022, 31, 335–362. [Google Scholar] [CrossRef]
- Mahmoudi, A.; Deng, X.; Javed, S.A.; Zhang, N. Sustainable Supplier Selection in Megaprojects: Grey Ordinal Priority Approach. Bus. Strategy Environ. 2021, 30, 318–339. [Google Scholar] [CrossRef]
- Mahmoudi, A.; Javed, S.A.; Mardani, A. Gresilient supplier selection through Fuzzy Ordinal Priority Approach: Decision-making in post-COVID era. Oper. Manag. Res. 2022, 15, 208–232. [Google Scholar] [CrossRef]
- Çiftçi, H.; Kuşak, L. Determination of Unsuitability Points on the Route of Van Gölü-Kapıköy Railway Line by Using GIS and AHP Method. Adv. GIS 2021, 1, 27–37. [Google Scholar]
- Razandi, Y.; Pourghasemi, H.R.; Neisani, N.S.; Rahmati, O. Application of analytical hierarchy process, frequency ratio, and certainty factor models for groundwater potential mapping using GIS. Earth Sci. Inform. 2015, 8, 867–883. [Google Scholar] [CrossRef]
- Xu, H. Modification of normalised difference water index (NDWI) to enhance open water features in remotely sensed imagery. Int. J. Remote Sens. 2007, 27, 3025–3033. [Google Scholar] [CrossRef]
- Mahdavi, A.; Niknejad, M.; Karami, O. A fuzzy multi-criteria decision method for locating ecotourism development. Casp. J. Environ. Sci. 2015, 13, 221–236. [Google Scholar]
- Bali, A.; Monavari, S.M.; Riazi, B.; Khorasani, N.; Zarkesh, M.M.K. A spatial decision support system for ecotourism development in caspian hyrcanian mixed forests ecoregion. Bol. Ciênc. Geodésicas 2015, 21, 340–353. [Google Scholar] [CrossRef] [Green Version]
- Kim, H.; Chung, Y.; Nishii, K.; Jung, B.D. The effect of accessibility improvement on tourist excursion behaviors. KSCE J. Civ. Eng. 2011, 15, 1443–1448. [Google Scholar] [CrossRef]
- Fragoudaki, A.; Giokas, D. Airport performance in a tourism receiving country: Evidence from Greece. J. Air Transp. Manag. 2016, 52, 80–89. [Google Scholar] [CrossRef]
- DeFries, R.S.; Townshend, J.R.G. NDVI-derived land cover classifications at a global scale. Int. J. Remote Sens. 1994, 15, 3567–3586. [Google Scholar] [CrossRef]
- Saaty, R.W. The analytic hierarchy process-what it is and how it is used. Math. Model. 1987, 9, 161–176. [Google Scholar] [CrossRef] [Green Version]
- Zhang, Z.; Liu, X.; Yang, S. A note on the 1-9 scale and index scale in ahp. Commun. Comput. Inf. Sci. 2009, 35, 630–634. [Google Scholar] [CrossRef]
- Cengiz, T.; Akbulak, C. Application of analytical hierarchy process and geographic information systems in land-use suitability evaluation: A case study of Dümrek village (Çanakkale, Turkey). Int. J. Sustain. Dev. World Ecol. 2009, 16, 286–294. [Google Scholar] [CrossRef]
- Pramanik, M.; Singh, P.; Dhiman, R.C. Identification of bio-climatic determinants and potential risk areas for Kyasanur forest disease in Southern India using MaxEnt modelling approach. BMC Infect. Dis 2021, 21, 1226. [Google Scholar] [CrossRef]
- Pramanik, M.; Chowdhury, K.; Rana, J.; Bisht, P.; Pal, R.; Szabo, S.; Pal, I.; Behera, B.; Liang, Q.; Padmadas, S.S.; et al. Climatic influence on the magnitude of COVID-19 outbreak: A stochastic model-based global analysis. Int. J. Environ. Health Res. 2022, 32, 1095–1110. [Google Scholar] [CrossRef]
- Thuiller, W.; Lavorel, S.; Araújo, M.B. Niche properties and geographical extent as predictors of species sensitivity to climate change. Glob. Ecol. Biogeogr. 2005, 14, 347–357. [Google Scholar] [CrossRef]
- Pramanik, M.; Diwakar, A.K.; Dash, P.; Szabo, S.; Pal, I. Conservation planning of cash crops species (Garcinia gummi-gutta) under current and future climate in the Western Ghats, India. Environ. Dev. Sustain. 2021, 23, 5345–5370. [Google Scholar] [CrossRef]
- Regmi, A.D.; Yoshida, K.; Pourghasemi, H.R.; DhitaL, M.R.; Pradhan, B. Landslide susceptibility mapping along Bhalubang–Shiwapur area of mid-Western Nepal using frequency ratio and conditional probability models. J. Mt. Sci. 2014, 11, 1266–1285. [Google Scholar] [CrossRef]
- Narayan, B.; Rajendran, C.; Sai, L.P. Scales to measure and benchmark service quality in tourism industry A second-order factor approach. Benchmarking Int. J. 2008, 15, 469–493. [Google Scholar] [CrossRef]
- BDNews24. Tourism Suspended Indefinitely in Ruma and Roang Chhari for Security Reasons. 2022. Available online: https://bangla.bdnews24.com/samagrabangladesh/olzdnxsgff (accessed on 23 April 2023).
- BDNews24. Tourism Restriction in Bandarban. 2022. Available online: https://bangla.bdnews24.com/samagrabangladesh/fihpiycmjm (accessed on 23 April 2023).
- BDNews24. Tourists’ Entry to CHT Is Restricted for Security Reasons. 2007. Available online: https://bdnews24.com/bangladesh/tourists-entry-to-cht-is-restricted-for-security-reasons (accessed on 23 April 2023).
- Kamruzzaman, M.; Fariha, M.S. Effectiveness of proper health and hygiene practices: A study on ensuring hygienic environment in Bangladeshi tourist destinations. In Proceedings of the International Conference on Industrial Engineering and Operations Management, Bandung, Indonesia, 6–8 March 2018; pp. 500–516. [Google Scholar]
- Islam, A.; Sakakibara, H.; Karim, R.; Sekine, M. Potable water scarcity: Options and issues in the coastal areas of Bangladesh. J. Water Health 2013, 11, 532–542. [Google Scholar] [CrossRef] [Green Version]
- Henok, B.G. Factors determining international tourist flow to tourism destinations: A systematic review. J. Hosp. Manag. Tour. 2021, 12, 9–17. [Google Scholar] [CrossRef]
- Hsu, T.-K.; Tsai, Y.-F.; Wu, H.-H. The preference analysis for tourist choice of destination: A case study of Taiwan. Tour. Manag. 2009, 30, 288–297. [Google Scholar] [CrossRef]
- Hiemstra, S.; Wong, K.K.F. Factors Affecting Demand for Tourism in Hong Kong. J. Travel Tour. Mark. 2002, 13, 41–60. [Google Scholar] [CrossRef]
- Saha, S.K.; Ahmed, M.F.; Roy, T.K.; Haldar, P.K. Community based ecotourism in income generation: A study on the sundarbans adjacent area of Bangladesh. Int. J. Bus. Manag. Soc. Res. 2015, 2, 80–91. [Google Scholar] [CrossRef]
- Shannon, G.; Larson, C.L.; Reed, S.E.; Crooks, K.R.; Angeloni, L.M. Ecological Consequences of Ecotourism for Wildlife Populations and Communities. In Ecotourism’s Promise and Peril; Springer: Cham, Switzerland, 2017; pp. 29–46. [Google Scholar] [CrossRef]
- Sato, C.F.; Wood, J.T.; Lindenmayer, D.B. The Effects of Winter Recreation on Alpine and Subalpine Fauna: A Systematic Review and Meta-Analysis. PLoS ONE 2013, 8, e64282. [Google Scholar] [CrossRef] [PubMed]
- Rakib, R.H.K.; Hassan, A. Social Media as a Technology Supported Enabler for Tourism Promotion in Bangladesh. In Technology Application in the Tourism and Hospitality Industry of Bangladesh; Springer: Singapore, 2021; pp. 243–258. [Google Scholar] [CrossRef]
- Adom, D. The place and voice of local people, culture, and traditions: A catalyst for ecotourism development in rural communities in Ghana. Sci. Afr. 2019, 6, e00184. [Google Scholar] [CrossRef]
- Munier, N.; Hontoria, E. Shortcomings of the AHP Method. In Uses and Limitations of the AHP Method. Management for Professionals; Springer: Cham, Switzerland, 2021. [Google Scholar] [CrossRef]
- Hartwich, F. Weighting of Agricultural Research Results: Strength and Limitations of the Analytic Hierarchy Process (AHP); Universotat Hohenheim: Stuttgart, Germany, 1999; Volume 9, pp. 1–18. [Google Scholar]

| Elements | Source | Year |
|---|---|---|
| Forests | Local Government Engineering Department, Bangladesh | 2017 |
| Vegetation | Landsat 8 Satellite Imagery | 2022 |
| Waterbodies | Landsat 8 Satellite Imagery | 2022 |
| Wetlands | Local Government Engineering Department, Bangladesh | 2018 |
| Elevation | SRTM DEM | 2022 |
| Slope | SRTM DEM | 2022 |
| Aspect | SRTM DEM | 2022 |
| Drainage | SRTM DEM | 2022 |
| Roads | Open Street Map | 2022 |
| Railway | Open Street Map | 2022 |
| Airports | Open Street Map | 2022 |
| Tourist Spots | Local Government Engineering Department, Bangladesh | 2021 |
| Hotels | Local Government Engineering Department, Bangladesh | 2021 |
| Growth Centers | Local Government Engineering Department, Bangladesh | 2021 |
| Health Centers | Local Government Engineering Department, Bangladesh | 2018 |
| Settlements | Local Government Engineering Department, Bangladesh | 2018 |
| Settlement Size | Bangladesh Bureau of Statistics | 2022 |
| Criteria | Sub-Criteria | Sources | Unit | Criteria Suitability Rating | ||||
|---|---|---|---|---|---|---|---|---|
| Very High | High | Moderate | Low | Very Low | ||||
| Natural Attractiveness | Proximity to Forests | [10] | km | <5 | 5~10 | 10~15 | 15~20 | >20 |
| Vegetation Distribution | [7,10] | Very High | High | Moderate | Low | Very Low | ||
| Waterbody Distribution | [58] | Very High | High | Moderate | Low | Very Low | ||
| Wetland Proximity | [12] | m | <500 | 500~2000 | 2000~4000 | 4000~6000 | >6000 | |
| Topographic Characteristics | Elevation | [8,59] | m | >100 | 50~100 | 25~50 | 0~25 | <0 |
| Slope | [25,39] | Degree | <5 | 5~15 | 15~25 | 25~35 | >35 | |
| Aspect | [24,60] | Flat | East | South | North | West | ||
| Surface Water Accessibility | [7,59,60] | m | <700 | 700~1400 | 1400~2100 | 2100~2800 | >2800 | |
| Accessibility | Distance from Roads | [7,24,60] | m | <500 | 500~1000 | 1000~1500 | 1500~2000 | >2000 |
| Distance from Railway | [61] | km | <10 | 10~20 | 20~30 | 30~40 | >40 | |
| Distance from Airports | [62] | km | <25 | 25~50 | 50~75 | 75~100 | >1000 | |
| Proximity to Facilities | Proximity to Hotels | [8] | km | <5 | 5~10 | 10~15 | 15~20 | >20 |
| Proximity to Growth Centers | [11] | km | <5 | 5~10 | 10~15 | 15~20 | >20 | |
| Proximity to Health Centers | [11] | km | <5 | 5~10 | 10~15 | 15~20 | >20 | |
| Community Characteristics | Proximity to Settlements | [10,24,60] | m | <1000 | 1000~2000 | 2000~3000 | 3000~4000 | >4000 |
| Settlement Size | [27] | Population per km2 | >500 | 500~1000 | 1000~5000 | 5000~10,000 | ||
| Criteria | Natural Attractiveness | Topographic Characteristics | Accessibility | Access to Facilities | Community Characteristics |
|---|---|---|---|---|---|
| Natural Attractiveness | 1 | 6 | 3 | 4 | 8 |
| Topographic Characteristics | 1/6 | 1 | ¼ | 1/3 | 4 |
| Accessibility | 1/3 | 4 | 1 | 3 | 6 |
| Access to Facilities | 1/4 | 3 | 1/3 | 1 | 5 |
| Community Characteristics | 1/8 | 1/4 | 1/6 | 1/5 | 1 |
| Criteria | Weight |
|---|---|
| Natural Attractiveness | 48 |
| Topographic Characteristics | 8 |
| Accessibility | 17 |
| Access to Facilities | 15 |
| Community Characteristics | 12 |
| Criteria | Sub-Criteria | Unit | Criteria Suitability Rating | ||||
|---|---|---|---|---|---|---|---|
| Very High | High | Moderate | Low | Very Low | |||
| Natural Attractiveness | Proximity to Forests | (Km2) | 48,698 | 28,038 | 23,611 | 19,184 | 28,038 |
| (%) | 33 | 19 | 16 | 13 | 19 | ||
| Vegetation Distribution | (Km2) | 23,611 | 73,785 | 35,417 | 10,330 | 4427 | |
| (%) | 16 | 50 | 24 | 7 | 3 | ||
| Waterbody Distribution | (Km2) | 2951 | 8854 | 23,611 | 87,066 | 25,087 | |
| (%) | 2 | 6 | 16 | 59 | 17 | ||
| Wetland Proximity | (Km2) | 1476 | 7379 | 10,330 | 14,757 | 113,629 | |
| (%) | 1 | 5 | 7 | 10 | 77 | ||
| Topographic Characteristics | Elevation | (Km2) | 7379 | 7379 | 13,281 | 116,580 | 2951 |
| (%) | 5 | 5 | 9 | 79 | 2 | ||
| Slope | (Km2) | 122,483 | 19,184 | 4427 | 1033 | 443 | |
| (%) | 83 | 13 | 3 | 0.7 | 0.3 | ||
| Aspect | (Km2) | 13,281 | 35,417 | 33,941 | 30,990 | 33,941 | |
| (%) | 9 | 24 | 23 | 21 | 23 | ||
| Surface Water Accessibility | (Km2) | 97,396 | - | 45,747 | 2951 | 1476 | |
| (%) | 66 | - | 31 | 2 | 1 | ||
| Accessibility | Distance from Roads | (Km2) | 60,504 | 33,941 | 17,708 | 8854 | 26,563 |
| (%) | 41 | 23 | 12 | 6 | 18 | ||
| Distance from Railway | (Km2) | 51,650 | 39,844 | 20,660 | 10,330 | 25,087 | |
| (%) | 35 | 27 | 14 | 7 | 17 | ||
| Distance from Airports | (Km2) | 13,281 | 36,893 | 47,222 | 32,465 | 17,708 | |
| (%) | 9 | 25 | 32 | 22 | 12 | ||
| Proximity to Facilities | Proximity to Hotels | (Km2) | 13,281 | 29,514 | 28,038 | 26,563 | 50,174 |
| (%) | 9 | 20 | 19 | 18 | 34 | ||
| Proximity to Growth Centers | (Km2) | 20,660 | 50,174 | 44,271 | 17,708 | 14,757 | |
| (%) | 14 | 34 | 30 | 12 | 10 | ||
| Proximity to Health Centers | (Km2) | 95,921 | 36,893 | 5903 | 2951 | 5903 | |
| (%) | 65 | 25 | 4 | 2 | 4 | ||
| Community Characteristics | Proximity to Settlements | (Km2) | 17,708 | 42,795 | 22,136 | 14,757 | 50,174 |
| (%) | 12 | 29 | 15 | 10 | 34 | ||
| Settlement Size | (Km2) | - | 22,136 | 39,844 | 84,115 | 1476 | |
| (%) | - | 15 | 27 | 57 | 1 | ||
Disclaimer/Publisher’s Note: The statements, opinions and data contained in all publications are solely those of the individual author(s) and contributor(s) and not of MDPI and/or the editor(s). MDPI and/or the editor(s) disclaim responsibility for any injury to people or property resulting from any ideas, methods, instructions or products referred to in the content. |
© 2023 by the authors. Licensee MDPI, Basel, Switzerland. This article is an open access article distributed under the terms and conditions of the Creative Commons Attribution (CC BY) license (https://creativecommons.org/licenses/by/4.0/).
Share and Cite
Abtahee, M.; Islam, A.A.; Haque, M.N.; Zonaed, H.; Ritu, S.M.; Islam, S.M.I.; Zaman, A. Mapping Ecotourism Potential in Bangladesh: The Integration of an Analytical Hierarchy Algorithm and Geospatial Data. Sustainability 2023, 15, 11522. https://doi.org/10.3390/su151511522
Abtahee M, Islam AA, Haque MN, Zonaed H, Ritu SM, Islam SMI, Zaman A. Mapping Ecotourism Potential in Bangladesh: The Integration of an Analytical Hierarchy Algorithm and Geospatial Data. Sustainability. 2023; 15(15):11522. https://doi.org/10.3390/su151511522
Chicago/Turabian StyleAbtahee, Muhallil, Afra Anika Islam, Md. Nazmul Haque, Hasan Zonaed, Samiha Mahzabin Ritu, Sk Md Imdadul Islam, and Atiq Zaman. 2023. "Mapping Ecotourism Potential in Bangladesh: The Integration of an Analytical Hierarchy Algorithm and Geospatial Data" Sustainability 15, no. 15: 11522. https://doi.org/10.3390/su151511522