Article

The Durability of High-Volume Fly Ash-Based Cement Composites with Synthetic Fibers in a Corrosive Environment: A Long-Term Study

Department of Civil Engineering, Manipal Institute of Technology, Manipal Academy of Higher Education, Manipal 576104, Karnataka, India
*
Author to whom correspondence should be addressed.
Sustainability 2023, 15(15), 11481; https://doi.org/10.3390/su151511481
Submission received: 31 May 2023 / Revised: 15 July 2023 / Accepted: 17 July 2023 / Published: 25 July 2023
(This article belongs to the Special Issue Sustainability of Reinforced Concrete)

Abstract

:
The utilization of class F fly ash (F-FA) is limited to 15–30% as a substitution for cement. The study intends to tap into the potential of high-volume F-FA as a pozzolan and micro filler by eliminating aggregates. The article presents the long-term behavior of a novel cement composite called no-aggregate concrete (NAC), incorporating 20% ordinary Portland cement (OPC) and 80% F-FA, with polypropylene (PP) fibers in 0.6, 0.8, and 1.0% volume fractions, in a corrosive environment. The bulk diffusion of preconditioned 100 mm cubes reveals that all mixtures’ chloride-binding capacity increases significantly with prolonged exposure. The total chloride content for mixtures M1, M2, and M3 is within acceptable limits as per EN 206. M4 with 1.0% PP fibers shows a higher total chloride content at 2 cm depth. The average chloride content for all mixtures is within 0.4%. The compressive strength of mixtures cured in water is about 90 MPa at 730 days, and is severely affected in the absence of fibers in a corrosive environment. The microstructure of mixtures at 730 days displays a cohesive, compact, continuous matrix, and the presence of unreacted F-FA.

1. Introduction

Corrosion of steel due to chloride ingress is the most common durability issue worldwide in reinforced concrete structures [1,2]. Mixing water, binder, chemical admixtures such as calcium chloride, and contaminated aggregates used for producing concrete constitute internal sources of chlorides. Application of de-icing salts, concrete exposure to seawater, contaminated soil, and groundwater possessing chloride salts are sources of external chlorides [1,3]. Concrete deterioration manifests as cracking and spalling due to the stress exerted by the corrosion products, affecting the structural member’s bond strength, ultimate strength, and serviceability [4]. The factors affecting the corrosion of reinforcement are the pore structure, water–cement ratio, the interfacial transition zone, and the type of binder. The transport mechanisms leading to chloride ingress are majorly attributable to the concrete pore system and the type of transport, such as water flow, diffusion due to gradient, and migration in an electric field [5,6,7].
Incorporating supplementary cementitious materials (SCMs) in concrete to assess their influence on fresh and hardened properties and durability of concrete has been discussed and widely promoted [8,9,10,11,12,13,14,15,16,17]. The researchers have acknowledged using F-FA to enhance concrete’s fresh and hardened properties [4,5,9,18,19,20,21,22]. The type of F-FA, its chemical composition, and reactivity play a crucial role in imparting the enhanced durability properties of concrete, such as the diffusivity of chlorides in reinforcement corrosion and strength [23,24]. Systematic reviews and research articles addressing the behavior of concrete incorporating high-volume F-FA are still in focus [25,26,27,28,29,30]. Recent trends have shown researchers promoting F-FA utilization by up to 70% [30,31,32,33]. Limited studies focus on the long-term durability of concretes containing F-FA greater than 50% [29,34].
Compound admixture and F-FA for producing M30 and M40 concrete reduce permeability, water absorption, and chloride ingress [35]. Concrete specimens comprising F-FA greater than 25% and tested for water-soluble chloride after ten years of exposure to the marine environment show that the initiation of corrosion prolongs for the same cover depth and water–binder ratio when compared to F-FA less than 25% [36]. Tests on reinforced concrete beams, which subject them to ponding for more than two years to determine the critical chloride threshold, reveal that concretes with 30% F-FA have a higher threshold than concretes with 70% slag and 15–30% limestone powder. However, the ponding test is unsuitable for simulating realistic scenarios for initiating corrosion [37].
When subjected to a chloride environment, concrete mixes containing F-FA and hydrated lime in varying proportions, as per ASTM C 1202, reveal that 50% F-FA and 20% hydrated lime performed better with lower diffusion coefficient values and charge densities [38]. Adding 2% nano-silica to high-volume F-FA reduces sorptivity, chloride penetration, and permeable voids [39]. Concrete mixes with high-volume F-FA, when subjected to the marine environment for 19–24 years, reveal that the addition of F-FA (56% or 58%) with a water–binder ratio between 0.31 and 0.46 yields a reduced chloride penetration of about 30–40 mm, irrespective of the type of aggregates used in the mix [40].
Recent studies focus on the behavior of engineered cement composites incorporating SCMs and different types of fibers in terms of their resistance to shrinkage, fatigue, temperature rise, permeability, and chloride ingress, with particular emphasis on the fiber–matrix interface [41]. The development of a theoretical model using the Papadakis model and experimental tests such as RCM and RCPT shows a good correlation and helps us to understand the reaction of pozzolan and the hydration of cement better for concrete containing F-FA in higher volumes [42]. A high-volume F-FA-engineered cement composite incorporating lime stone powder and silica fume reveals that the mechanical and durability properties reduce drastically for an F-FA/OPC ratio greater than 1.2, due to increased total porosity [43]. Modification of a high-volume F-FA cement composite using partial replacement of F-FA with metakaolin and quartz powder subjected to tidal zone and seawater attack reveals that the use of 10% quartz powder shows the best stability and promotes the formation of C–S–H gel. There is a strong correlation between compressive strength and gel/space ratio, as the surface fractal dimension decreases in the micro-region [44].
The use of nano-silica in fiber-reinforced concrete incorporating high-volume F-FA reveals that the mix comprising 0.2–1.0% polyvinyl fibers and nano-silica reduces the porosity at the fiber–matrix interface, and improves the flexural strength and critical crack tip opening [45]. The mechanical properties of concrete comprising polyvinyl alcohol fibers and ultra-fine F-FA reveal that the optimum content of ultra-fine F-FA to resist chloride penetration is 25%. [46]. A concrete mix incorporating PP fibers up to 0.5% and subjected to freeze–thaw cycles and wet–dry cycles to determine its resistance to chloride reveals that higher fiber content improves resistance to freeze–thaw cycles, but decreases resistance to chloride diffusion [47]. Concrete mixes containing varying amounts of F-FA with the highest replacement volume (35%) and PP fibers between 0–0.1%, investigated for chloride resistance, show reduced chloride ingress for a water–binder ratio of 0.25. Resistance to chloride increases with a higher fiber content and F-FA volume [16]. Studies on using hybrid fibers such as PP, coated basalt fibers, steel fibers, and their influence on engineered cement composites containing high-volume F-FA show that hybridization helps improve such composites’ strength and durability [48,49].

1.1. Summary of Literature

  • The mechanical and durability properties of concretes, cement pastes, and engineered cement composites incorporating F-FA as a partial replacement for OPC have been studied extensively. The utilized water–binder ratio varies between 0.25–0.46 for most of the studies.
  • Recent studies focus on the influence of the curing and the use of a hybrid system of fibers on mechanical and durability properties. Researchers have presented different views on using higher-volume fractions of PP fibers.
  • There are few long-term durability studies on chloride, sulfate, and the freeze–thaw resistance of concretes incorporating more than 50% F-FA. Most research articles add morphological studies to supplement the experimental findings.

1.2. Scope of the Present Study

The article introduces a novel cement composite, ‘NAC’, that utilizes 20% OPC and 80% F-FA as a binder and micro filler, eliminating total aggregate proportion. This study assesses the influence of 0.6, 0.8, and 1.0% volume fraction PP fibers in NAC subjected to an aggressive chloride environment for up to two years of exposure. Visual inspection, Volhard titration, and cube compression tests determine the free and bound chlorides, total chloride content, and compressive strength for all the mixes under the bulk diffusion transport mechanism. The article correlates the morphology with experimental findings using SEM images and EDX analysis.

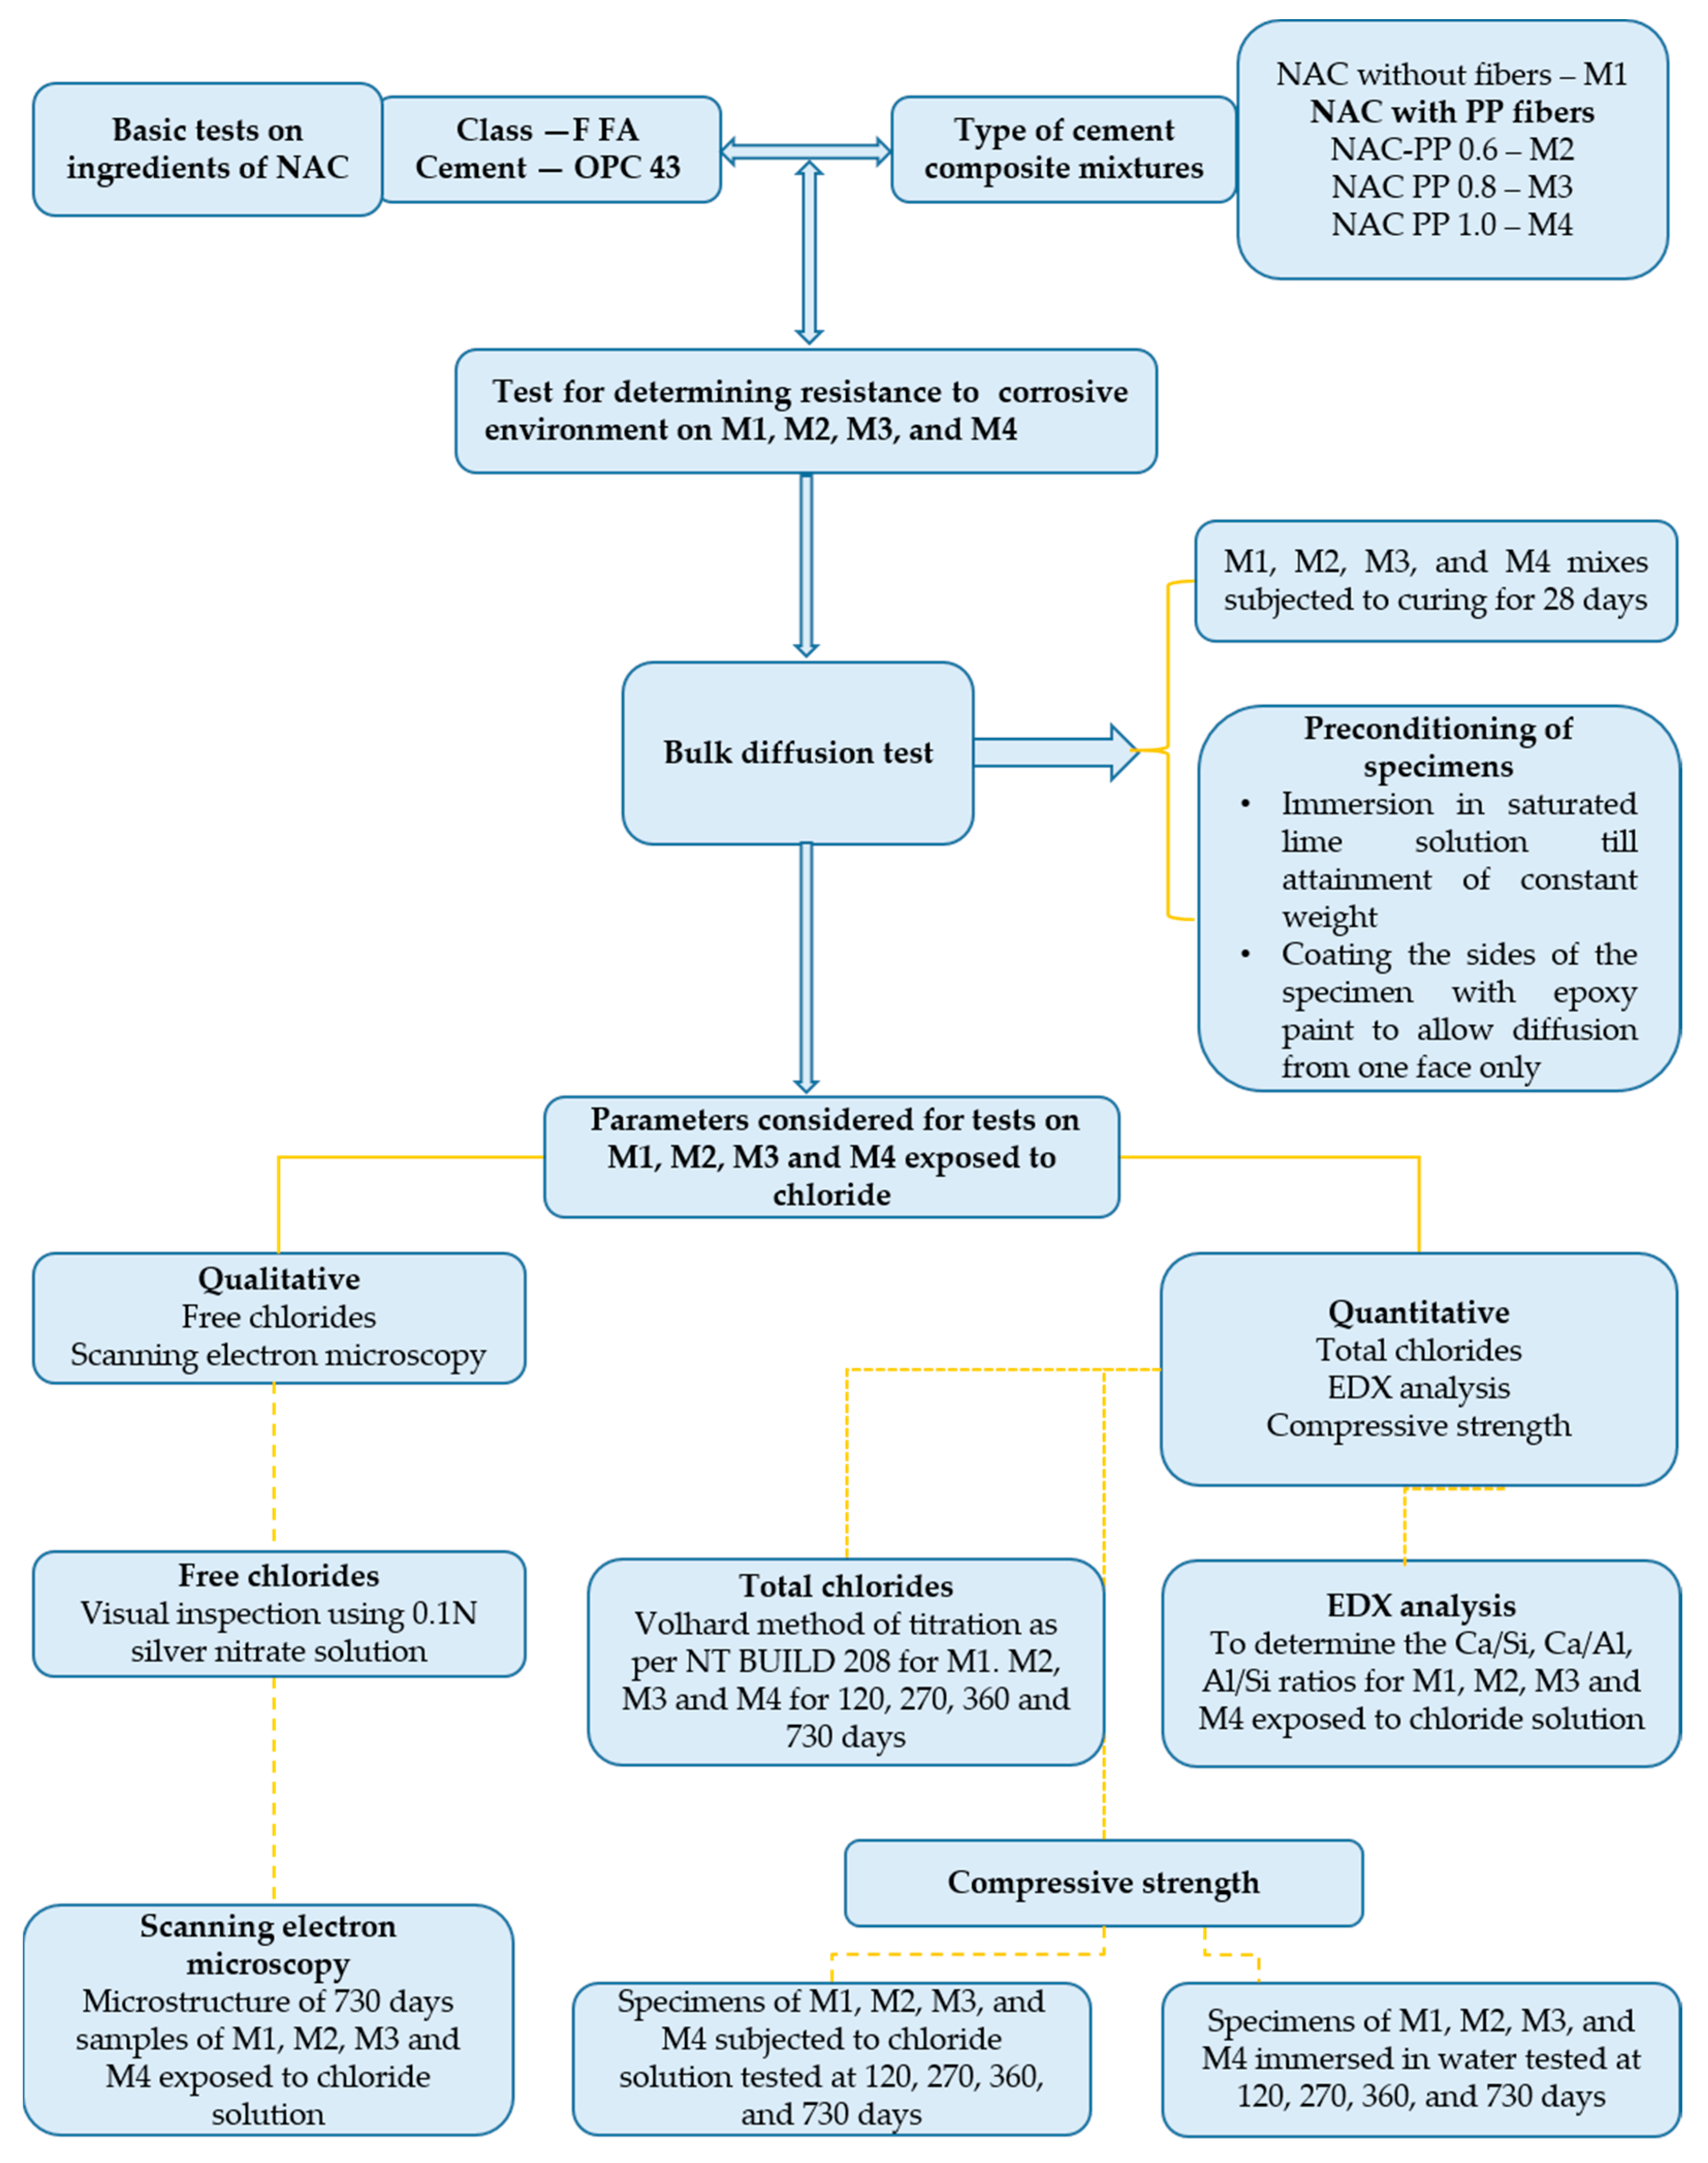
2. Materials and Methods

The present work uses OPC 43 grade cement, a high volume of F-FA of about 80%, potable water, PP fibers in three volume fractions, and polycarboxylic ether (PCE)-based plasticizer to achieve a low water–binder ratio. The chemical composition of F-FA and the tests to determine the physical properties of cement and F-FA used for the study are presented in Table 1 and Table 2, respectively.
The presence of tricalcium silicate, C3S, and dicalcium silicate, C2S, the two most abundant Bogue’s compounds, is detected in the XRD pattern of cement powder. In the case of the cement paste cured for different periods, along with C3S and C2S, hydration products such as ettringite, portlandite, and calcium silicate hydrates have been observed. Figure 1 displays the hydration products of neat cement paste cured for 3, 7, and 28 days, respectively.
The XRD pattern of F-FA indicates the presence of the mineral mullite, quartz, haematite, and lime, as presented in Figure 2. Mullite and quartz in NAC cured for different periods in the diffractogram depict the presence of unreacted F-FA. The peaks showing C–S–H confirm the progress of hydration. The reaction of C2S in NAC is not visible for 28 days of curing. However, these peaks are visible for neat cement paste. The peaks corresponding to mullite and quartz decrease with curing age, and the peak corresponding to C–S–H becomes more prominent. Hydration products such as ettringite and portlandite are not visible for NAC for all curing ages.
The PP fibers of length 12 mm, diameter 40 μm, relative density 0.92, and tensile strength of 800 MPa are used for producing mixtures with fibers. Table 3 presents the mix proportions of NAC with 0, 0.6, 0.8, and 1.0% volume fractions.

Methods

Figure 3 presents the research methodology designed to conduct the experimental investigation.
Briefly, 100 mm cubes were cast and cured under immersion for 28 days, followed by preconditioning of the specimens before subjecting them to a chloride environment. The preconditioning required the samples to be thoroughly dried after 28 days of curing under immersion, followed by immersion of dry specimens in saturated lime water until they attained constant weight. This process avoids the high concentration of chlorides at the surface, which gives a wrong indication of the behavior of mixes in resisting chloride penetration. After attaining a constant weight, the specimens are coated with epoxy paint on all five sides, leaving one face through which the chloride ingress is allowed. These processes are as per NT BUILD 443 [57], which specifies the guidelines for bulk diffusion as a transport mechanism to measure resistance to chloride ingress. The preconditioned specimens are exposed to a chloride environment by immersion in sodium chloride (NaCl) solution for 120, 270, 360, and 730 days of exposure.
After the specific exposure period, the specimens are tested for free chlorides based on visual inspection by spraying 0.1 N silver nitrate solution (AgNO3) to detect the penetration depth of free chlorides and the presence of combined chlorides, if any, by splitting the exposed specimens into two halves in the direction of diffusion. The total chloride content is determined by drilling the specimens at 2, 4, 6, and 8 cm depth to collect 5 gm of powder and then processing the sample thus collected for use with the Volhard titration method, as per NT BUILD 208 [58]. Figure 4 presents the preparation of the specimens for determining the test parameters. The samples subjected to diffusion are also tested for compressive strength and compared with those cured in water for the same duration, as per IS 516: 1959 [59]. The morphological studies of samples exposed for 730 days are conducted using SEM images and EDX analysis.

3. Results

The results of the visual inspection, total chloride content by weight of the binder, compressive strength, and microstructure analysis of the mixtures are presented in the subsequent sections.

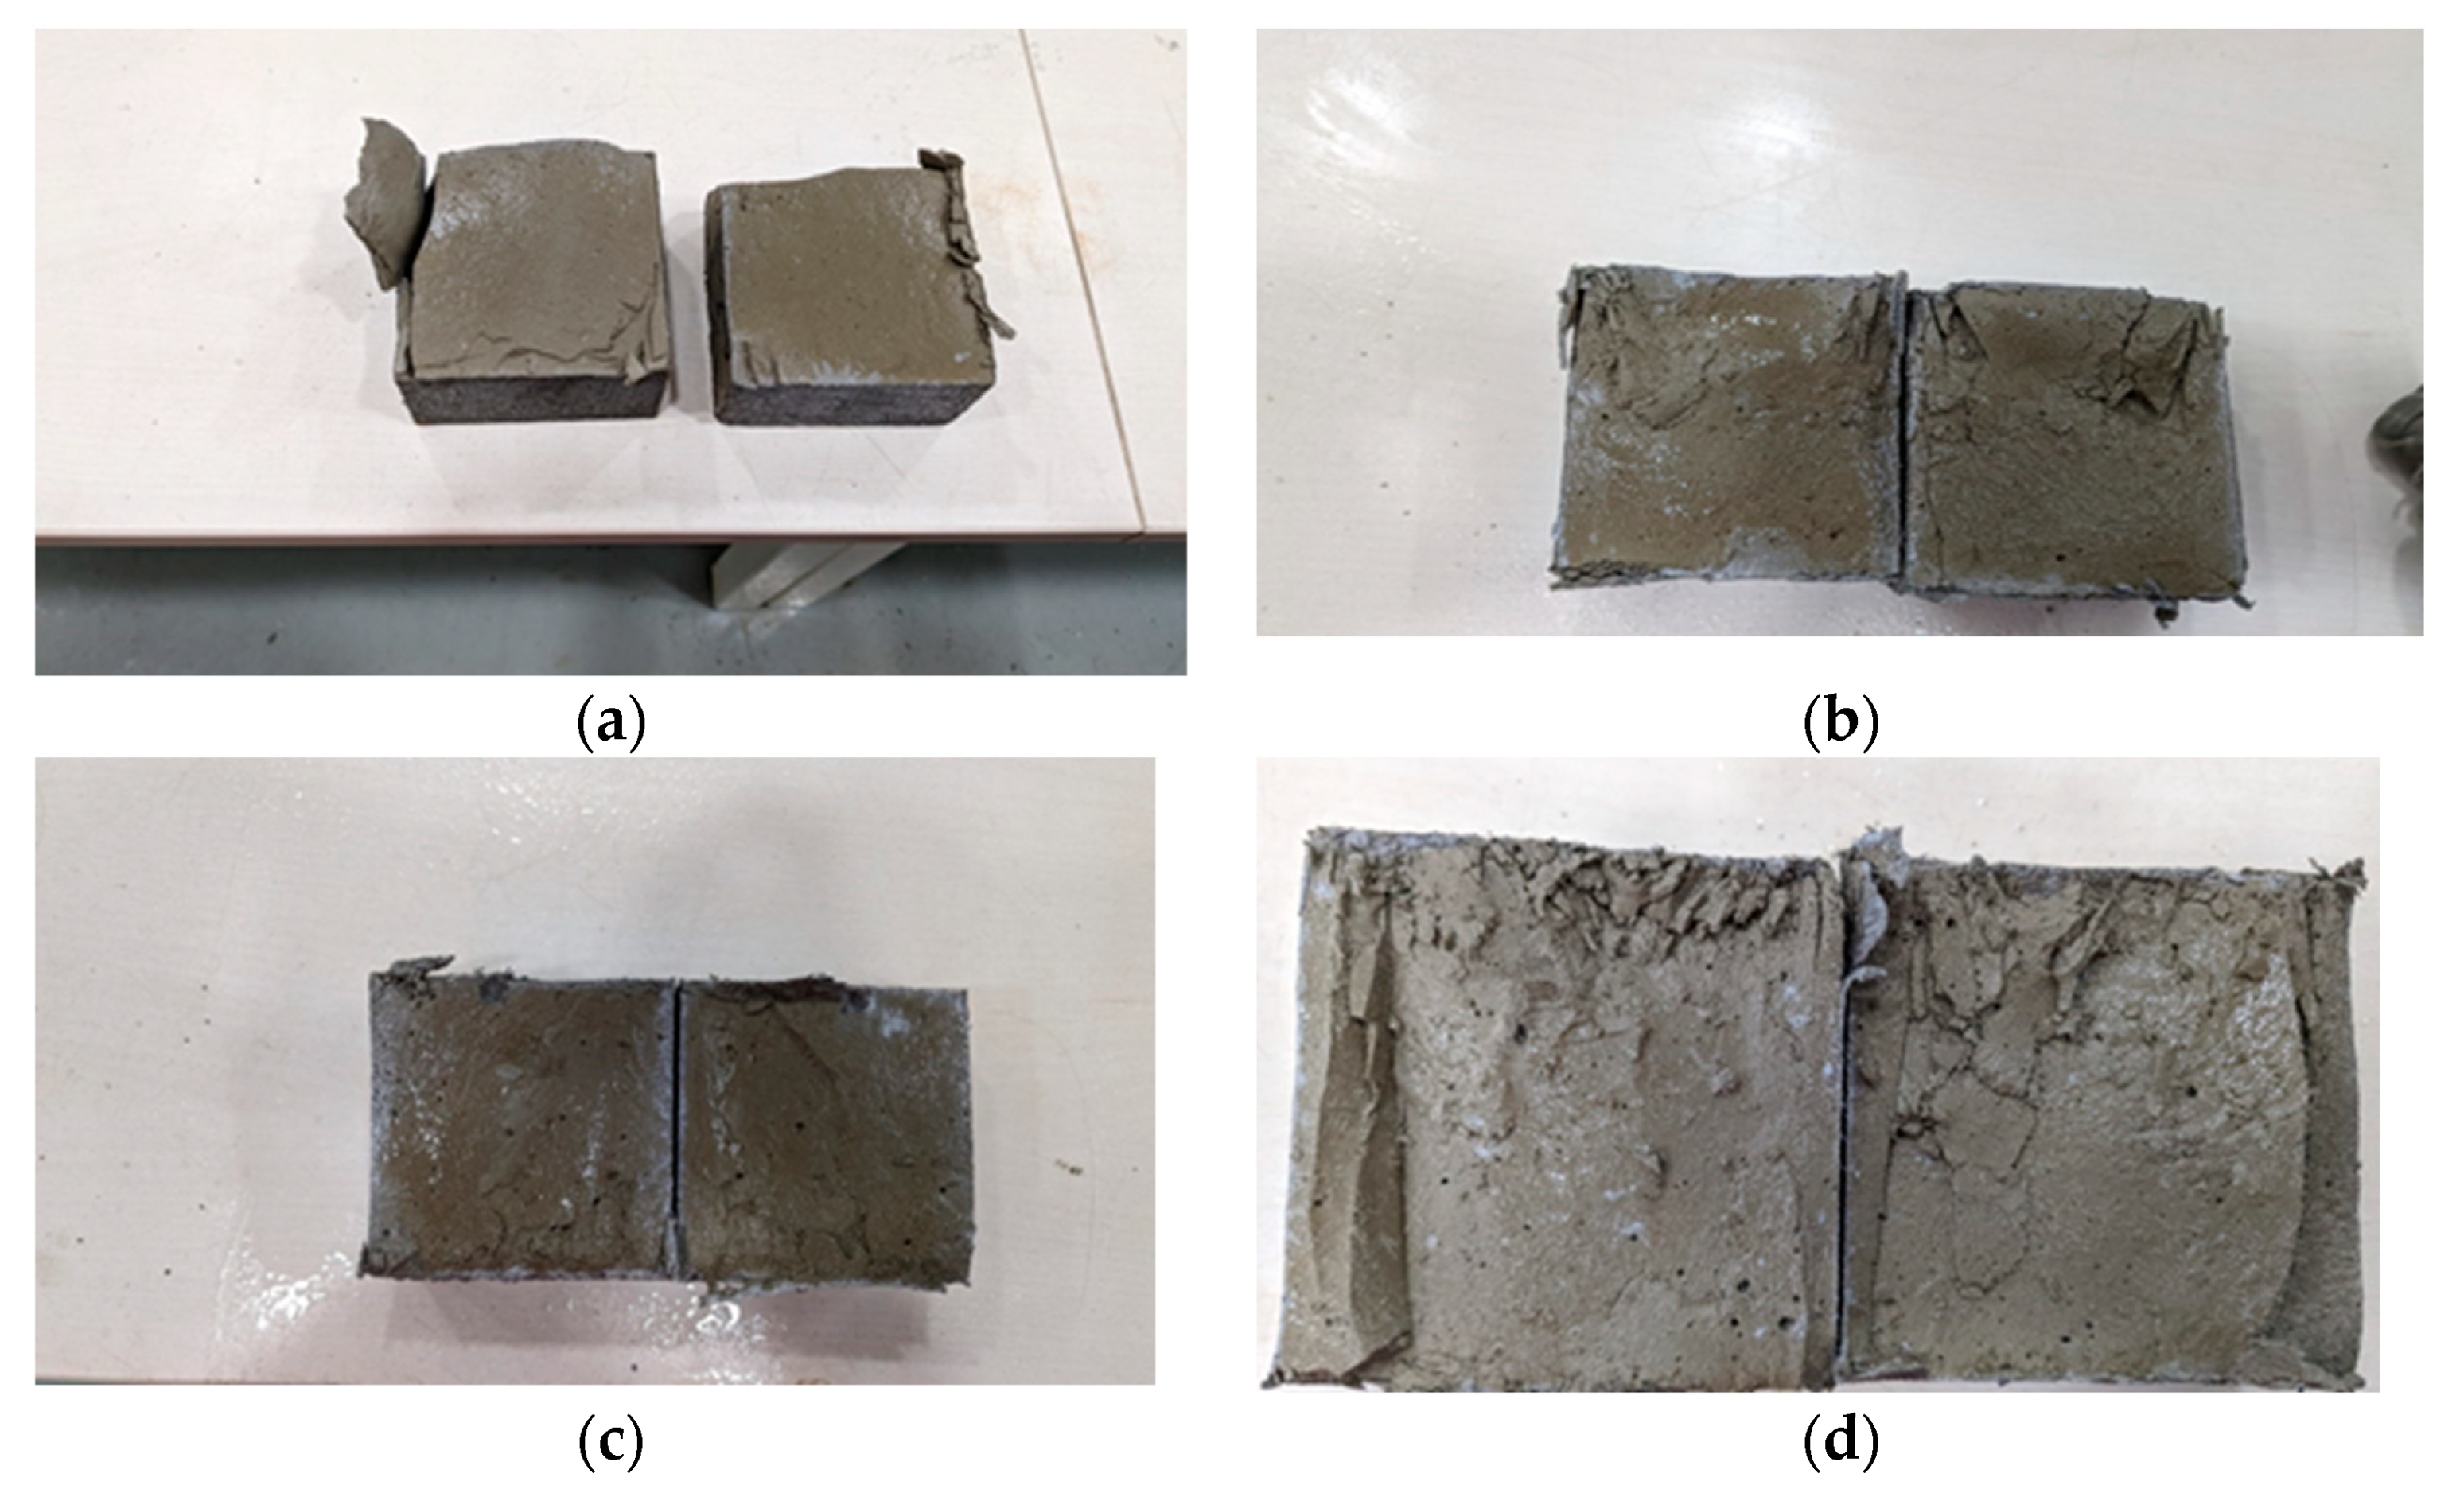
3.1. Free and Combined Chlorides

The presence of free and combined chlorides based on visual inspection by spraying AgNO3 solution of 0.1 N for mixes M1, M2, M3, and M4 for 120, 270, and 730 days are presented in Figure 5, Figure 6 and Figure 7, respectively. Figure 5 shows the presence of free chlorides at the outer periphery, and the combined chlorides towards the inner core of the split surface. The patches over the surface represent the precipitation of silver chloride (grey), and these patches tend to increase with fiber content at 120 days due to the presence of a fiber–matrix interface. The average penetration depth for M2, M3, and M4 from the surface is recorded as 0.3, 0.54, and 0.8 cm, respectively. The brown color indicates the presence of bound chlorides.
At 270 days, all mixes show a reduction in the free chloride content except for M1, with an average free chloride penetration depth of 0.62 cm. It was challenging to record the depth of free chlorides for mixes with fibers due to the presence of bound chlorides and the lack of a specific pattern of silver chloride precipitation near the surface, as observed in Figure 6.
With prolonged exposure to the chloride solution, all the mixtures improved their capacity to bind the chlorides. The visual inspection at 730 days noted the absence of free chlorides. Figure 7 shows the deeper intensity of the brown color and the reduction in grey patches in the inner core compared to the other exposure durations.

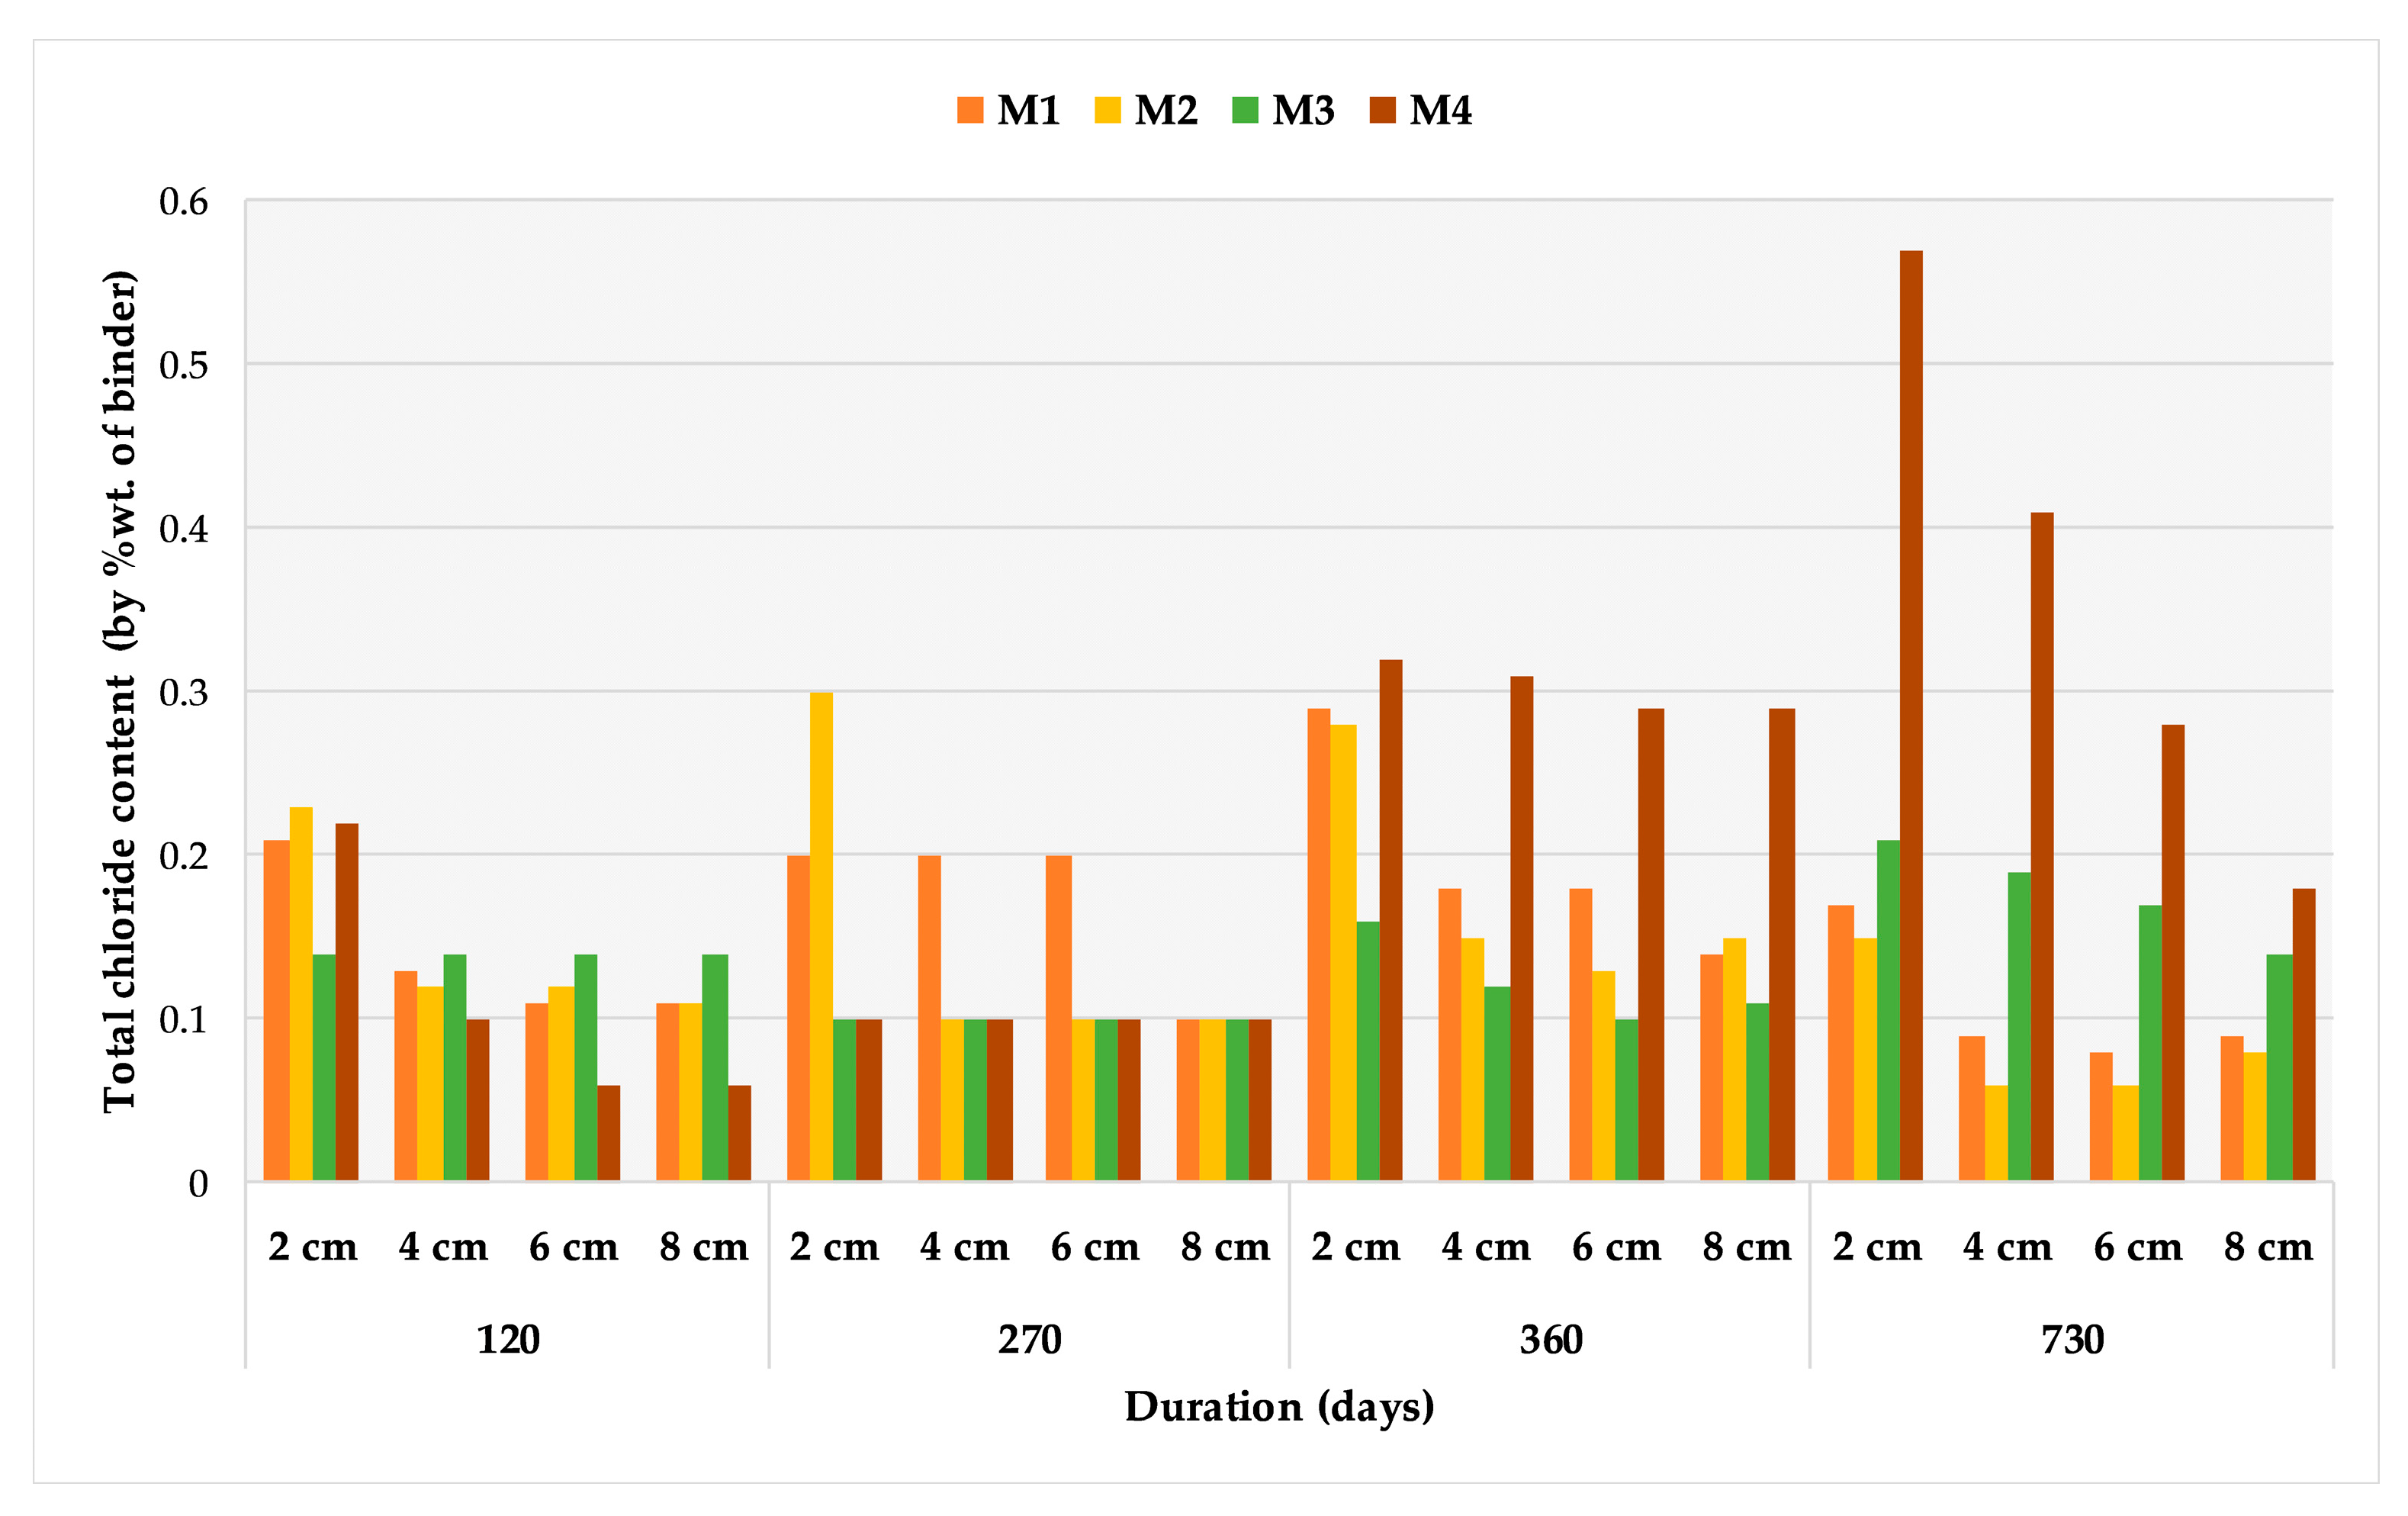
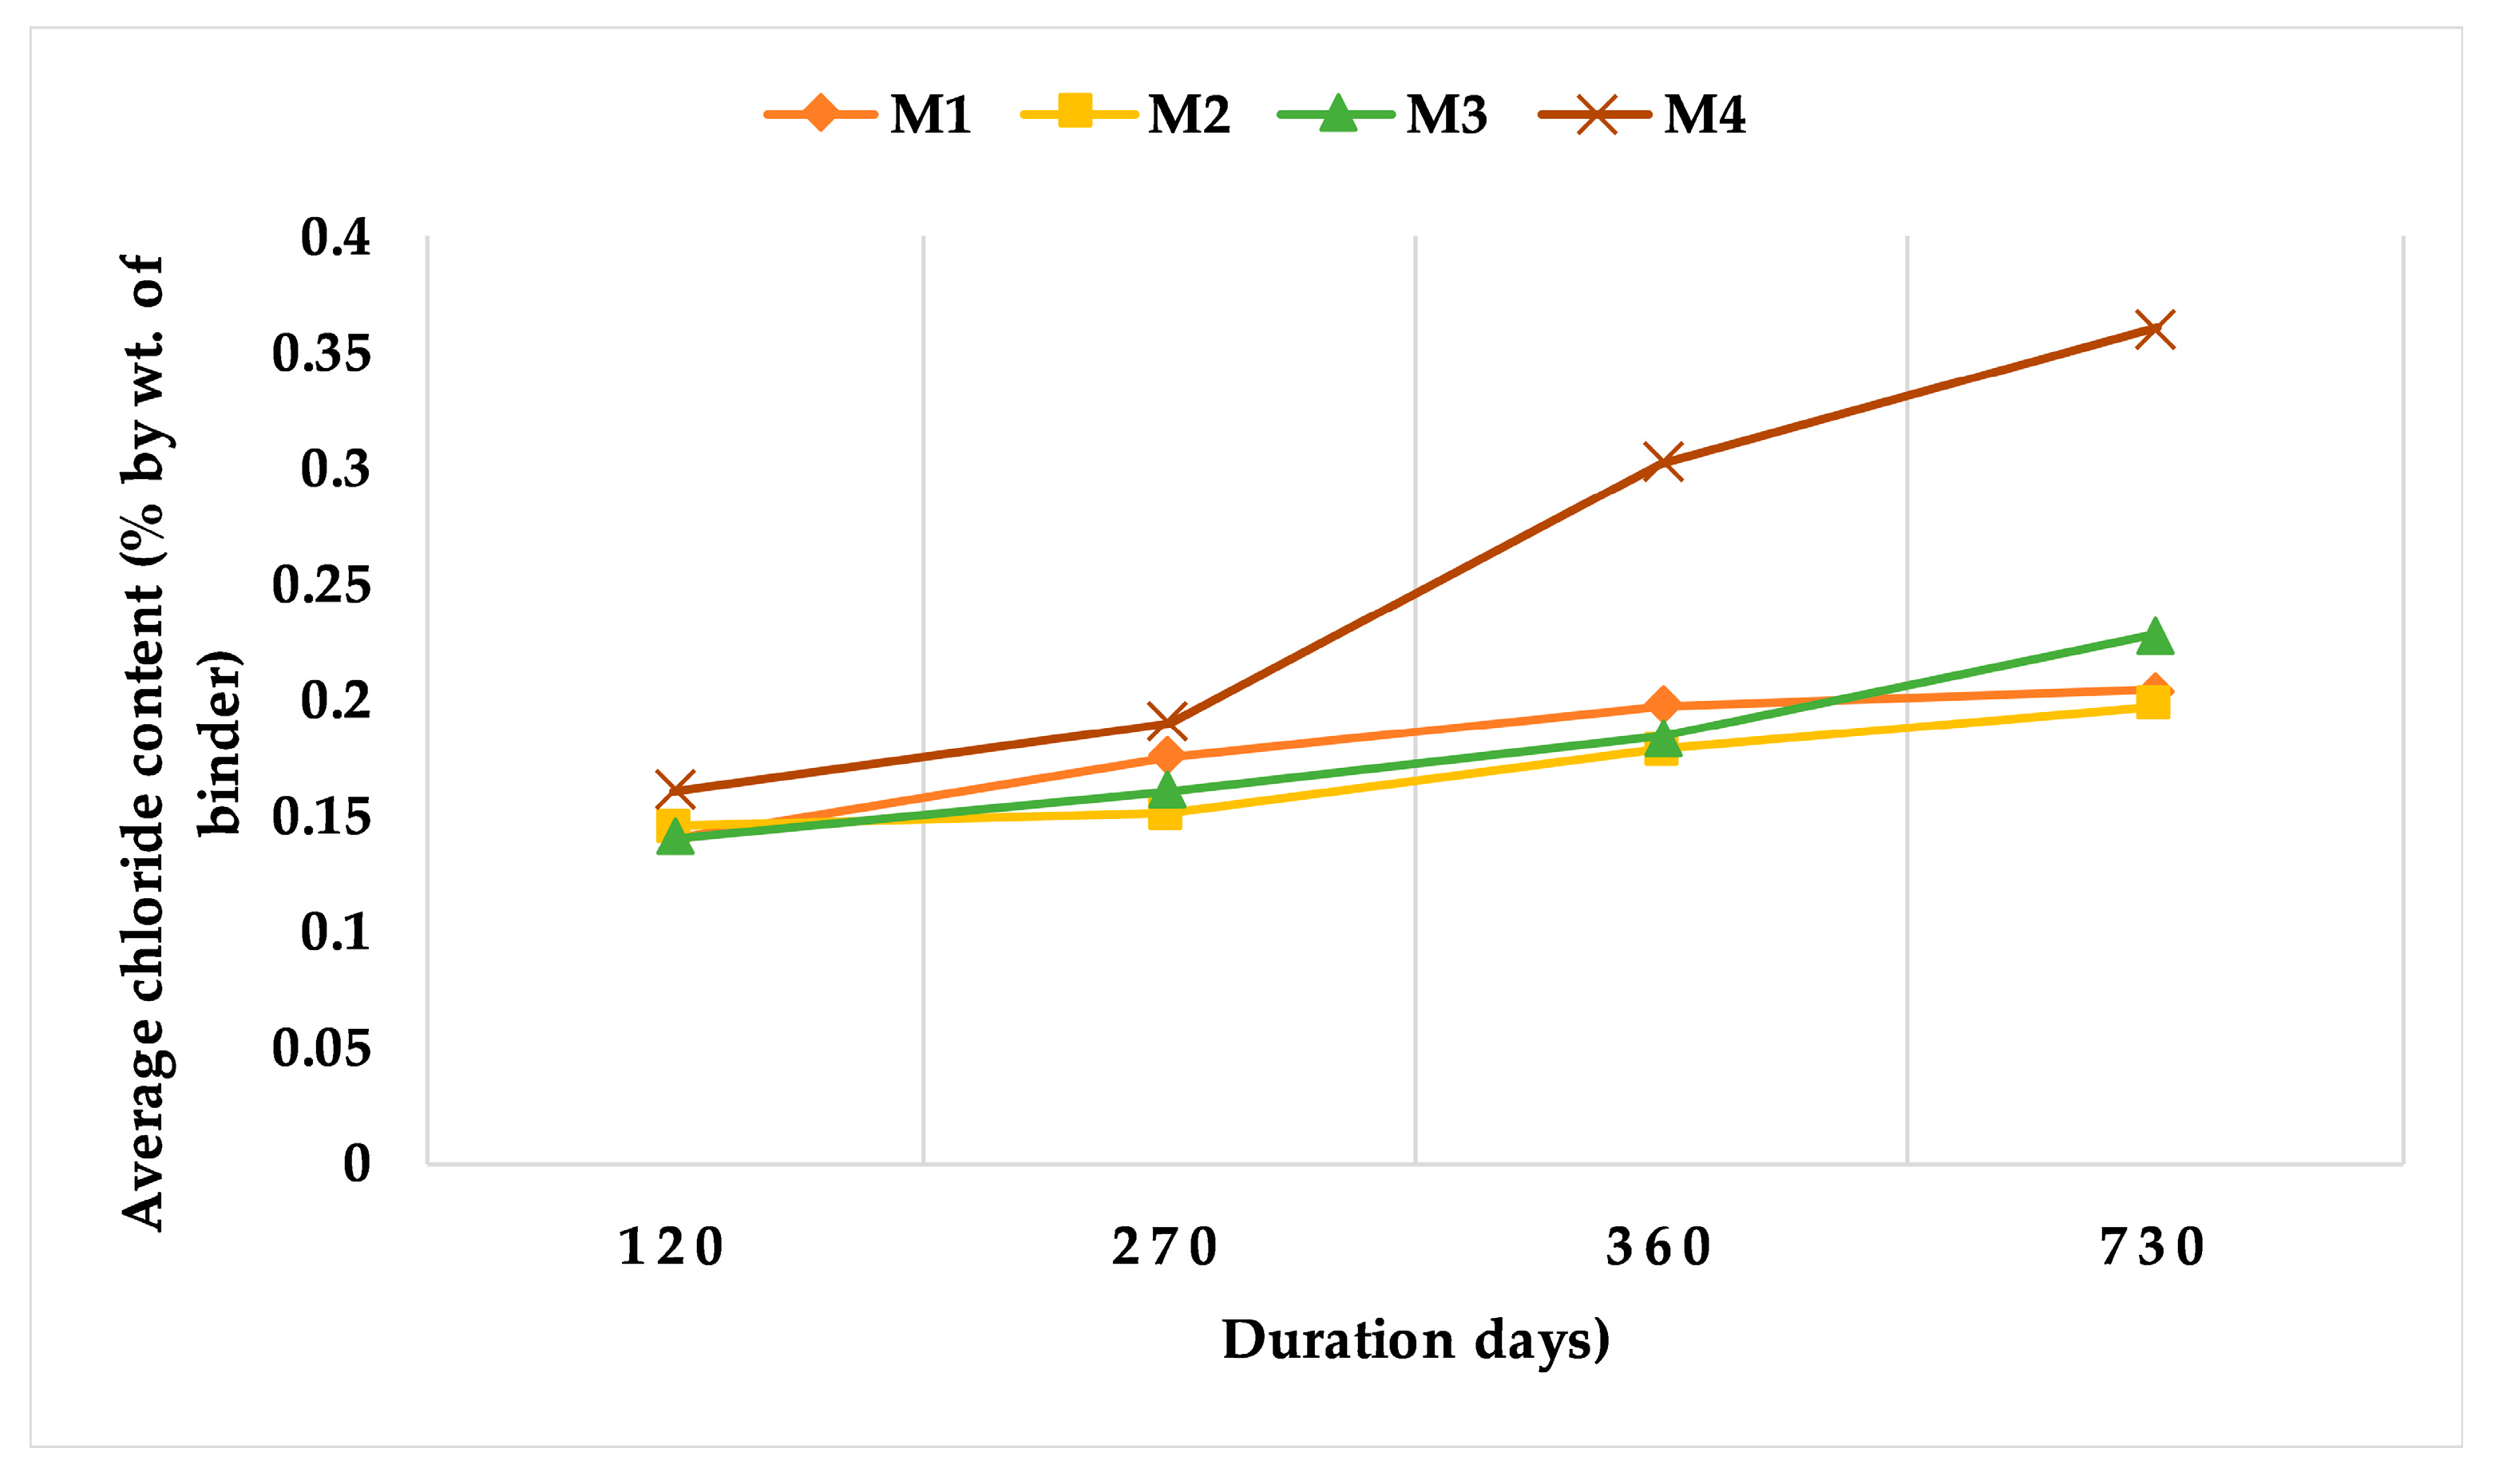
3.2. Total Chloride Content by Weight of the Binder

The preconditioned specimens were exposed to a corrosive environment and drilled after exposure to collect powdered samples at a specific depth to determine the total chloride content using Volhard titration. Figure 8 presents the chloride content in % by weight of binder at each depth for M1, M2, M3, and M4 for 120, 270, 360, and 730 days.
The values at 2 cm depth range between 0.14–0.21%, 0.3–0.1%, 0.32–0.16%, and 0.57–0.15% at 120, 270, 360, and 730 days exposure, respectively. The values at 8 cm depth are in the range of 0.06–0.14%, 0.1%, 0.11–0.29%, and 0.08–0.18% at 120, 270, 360, and 730 days. The samples collected at 2 cm from the specimens exposed to chloride solution have the highest concentration of total chlorides for all mixtures. The concentration reduces with an increase in depth, irrespective of exposure duration. For longer exposure durations, the M3 and M4 mixtures have a higher total chloride content at different depths. The total chloride content in mixtures M1, M2, and M3 for various exposure durations is within the limit specified according to EN 206: 2016 [60]. At 730 days of exposure, the highest chloride content recorded is 0.57% for M4 at 2 cm depth, and does not comply with the requirements.
Figure 9 presents the average chloride content by weight of the binder for each mixture at various exposure durations.
The average chloride content varies from 0.14–0.20% for M1 and M2, 0.14–0.13% for M3, and 0.16–0.36% for M4 between 120 and 730 days of exposure. The average chloride content increases with higher fiber content with prolonged exposure to a chloride environment. M4 shows the highest average chloride content, followed by M3, M2, and M1. The average chloride content for all mixes is within an acceptable range of 0.4% by weight of the binder.

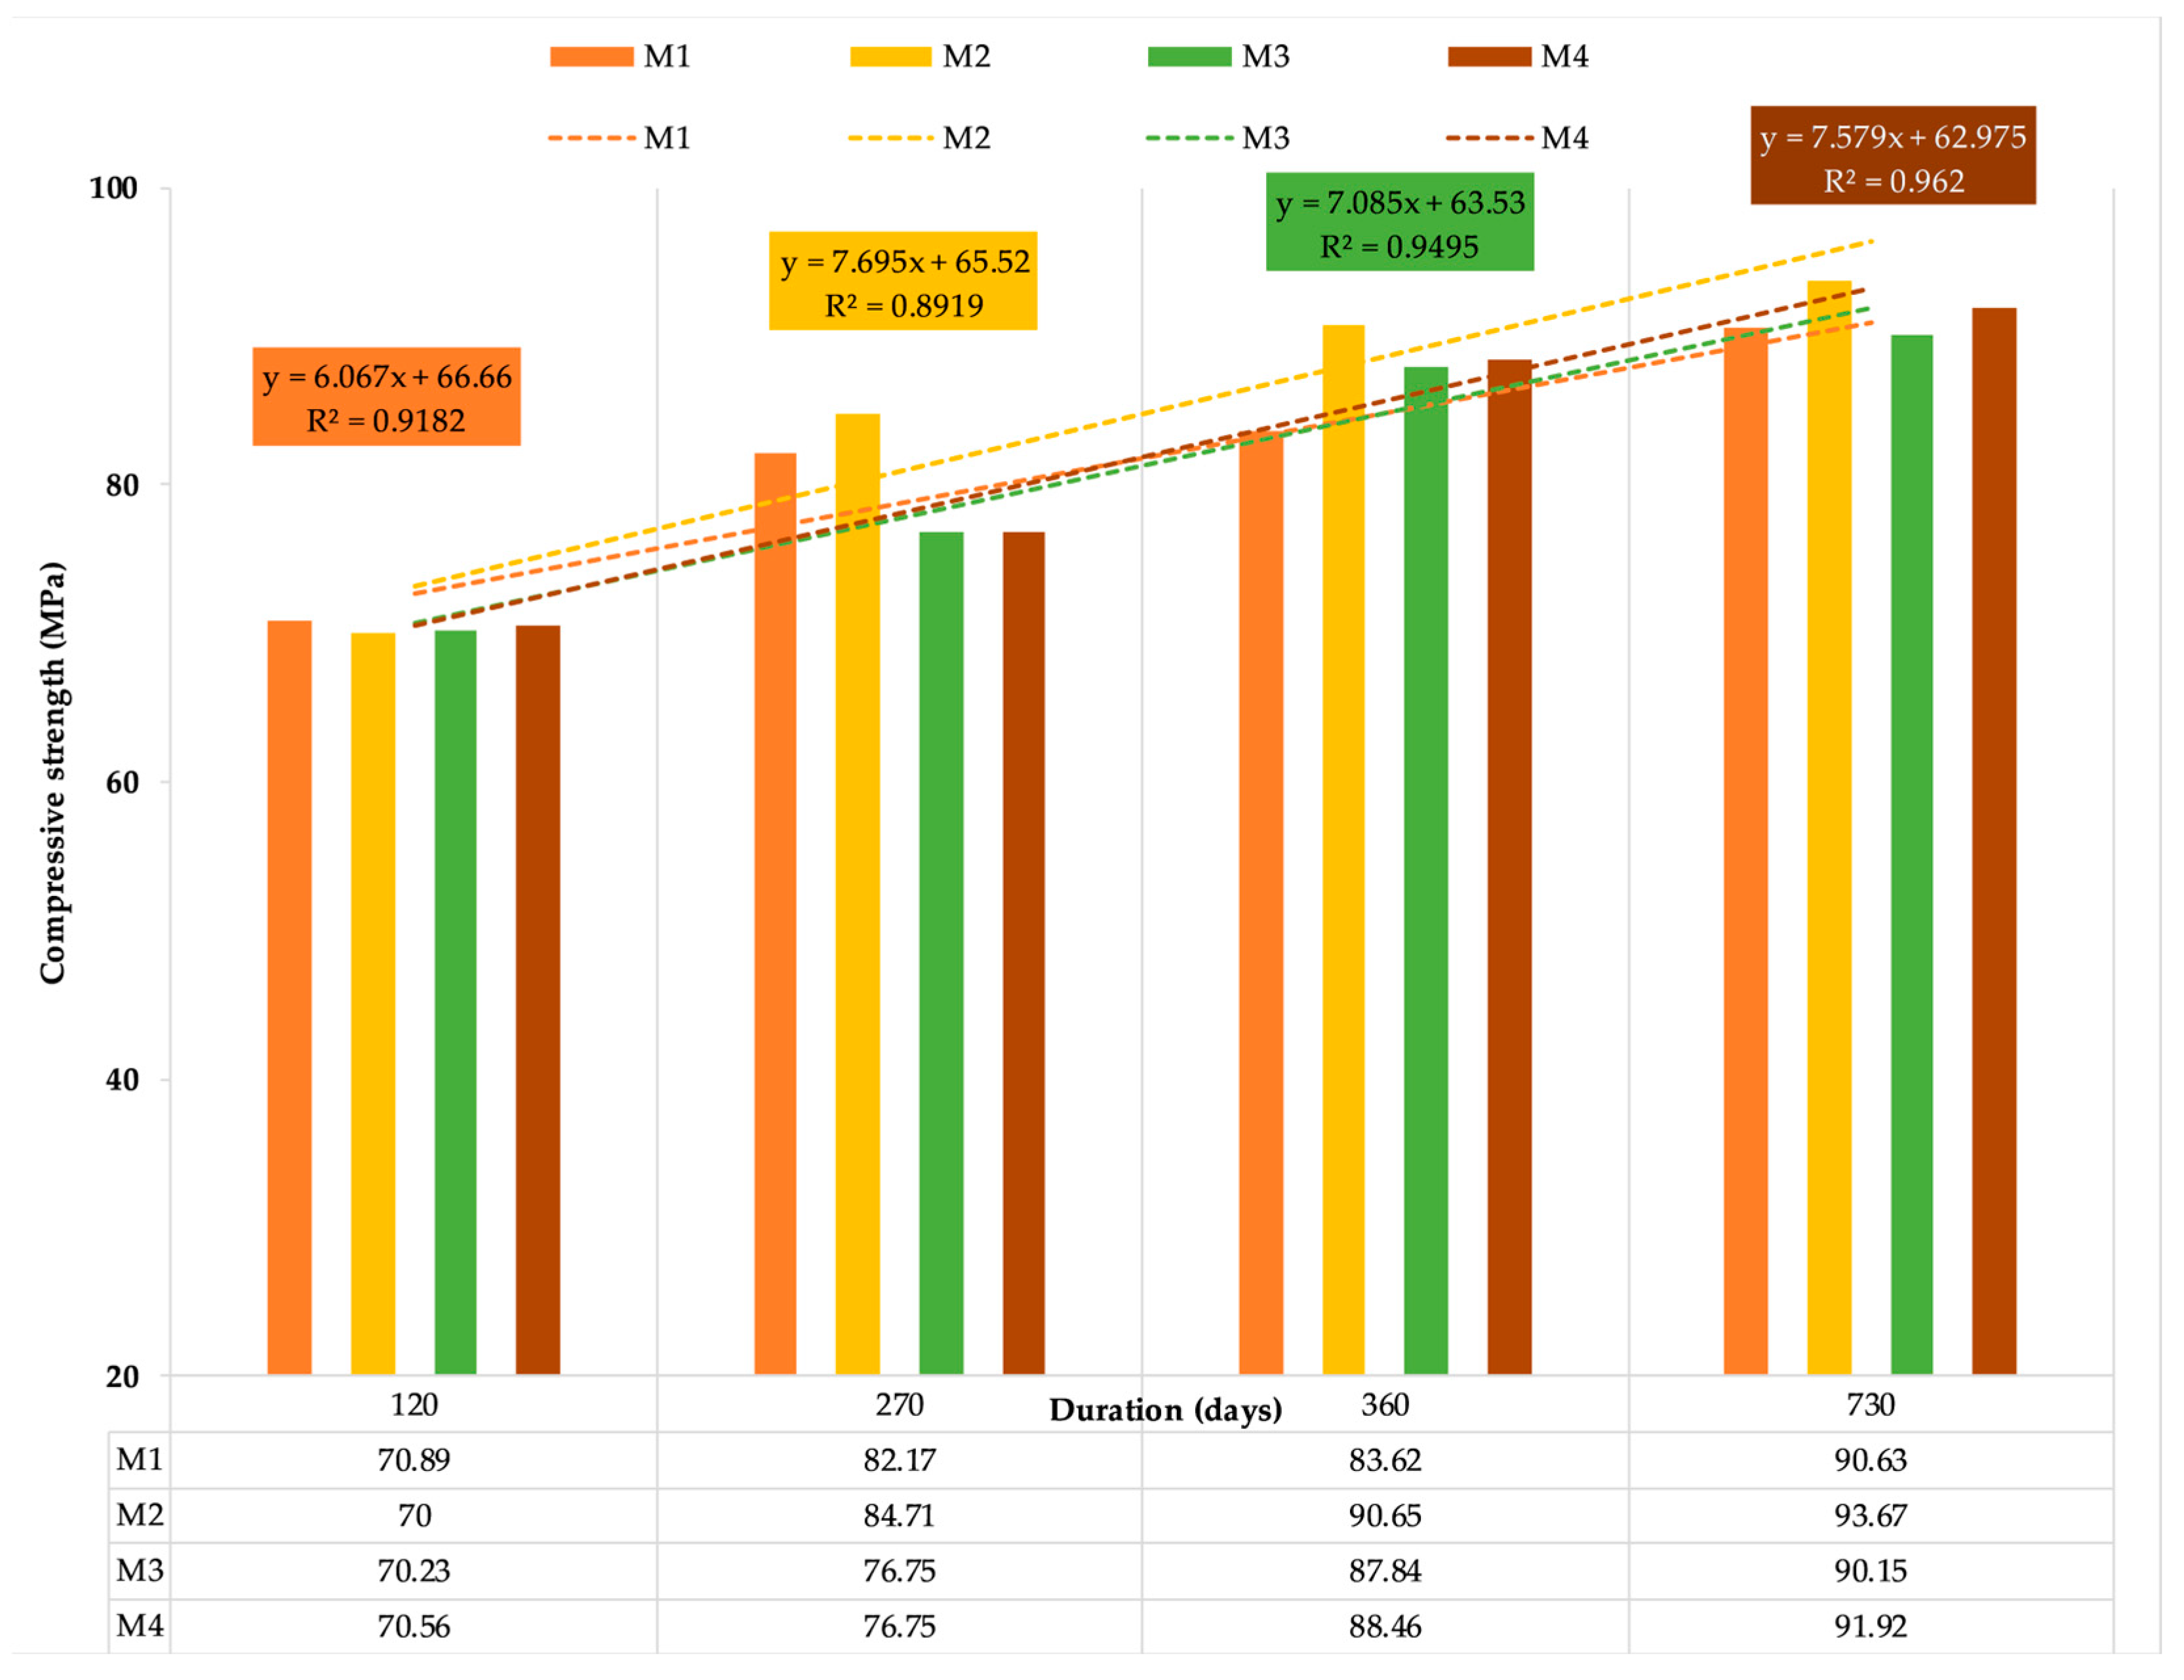
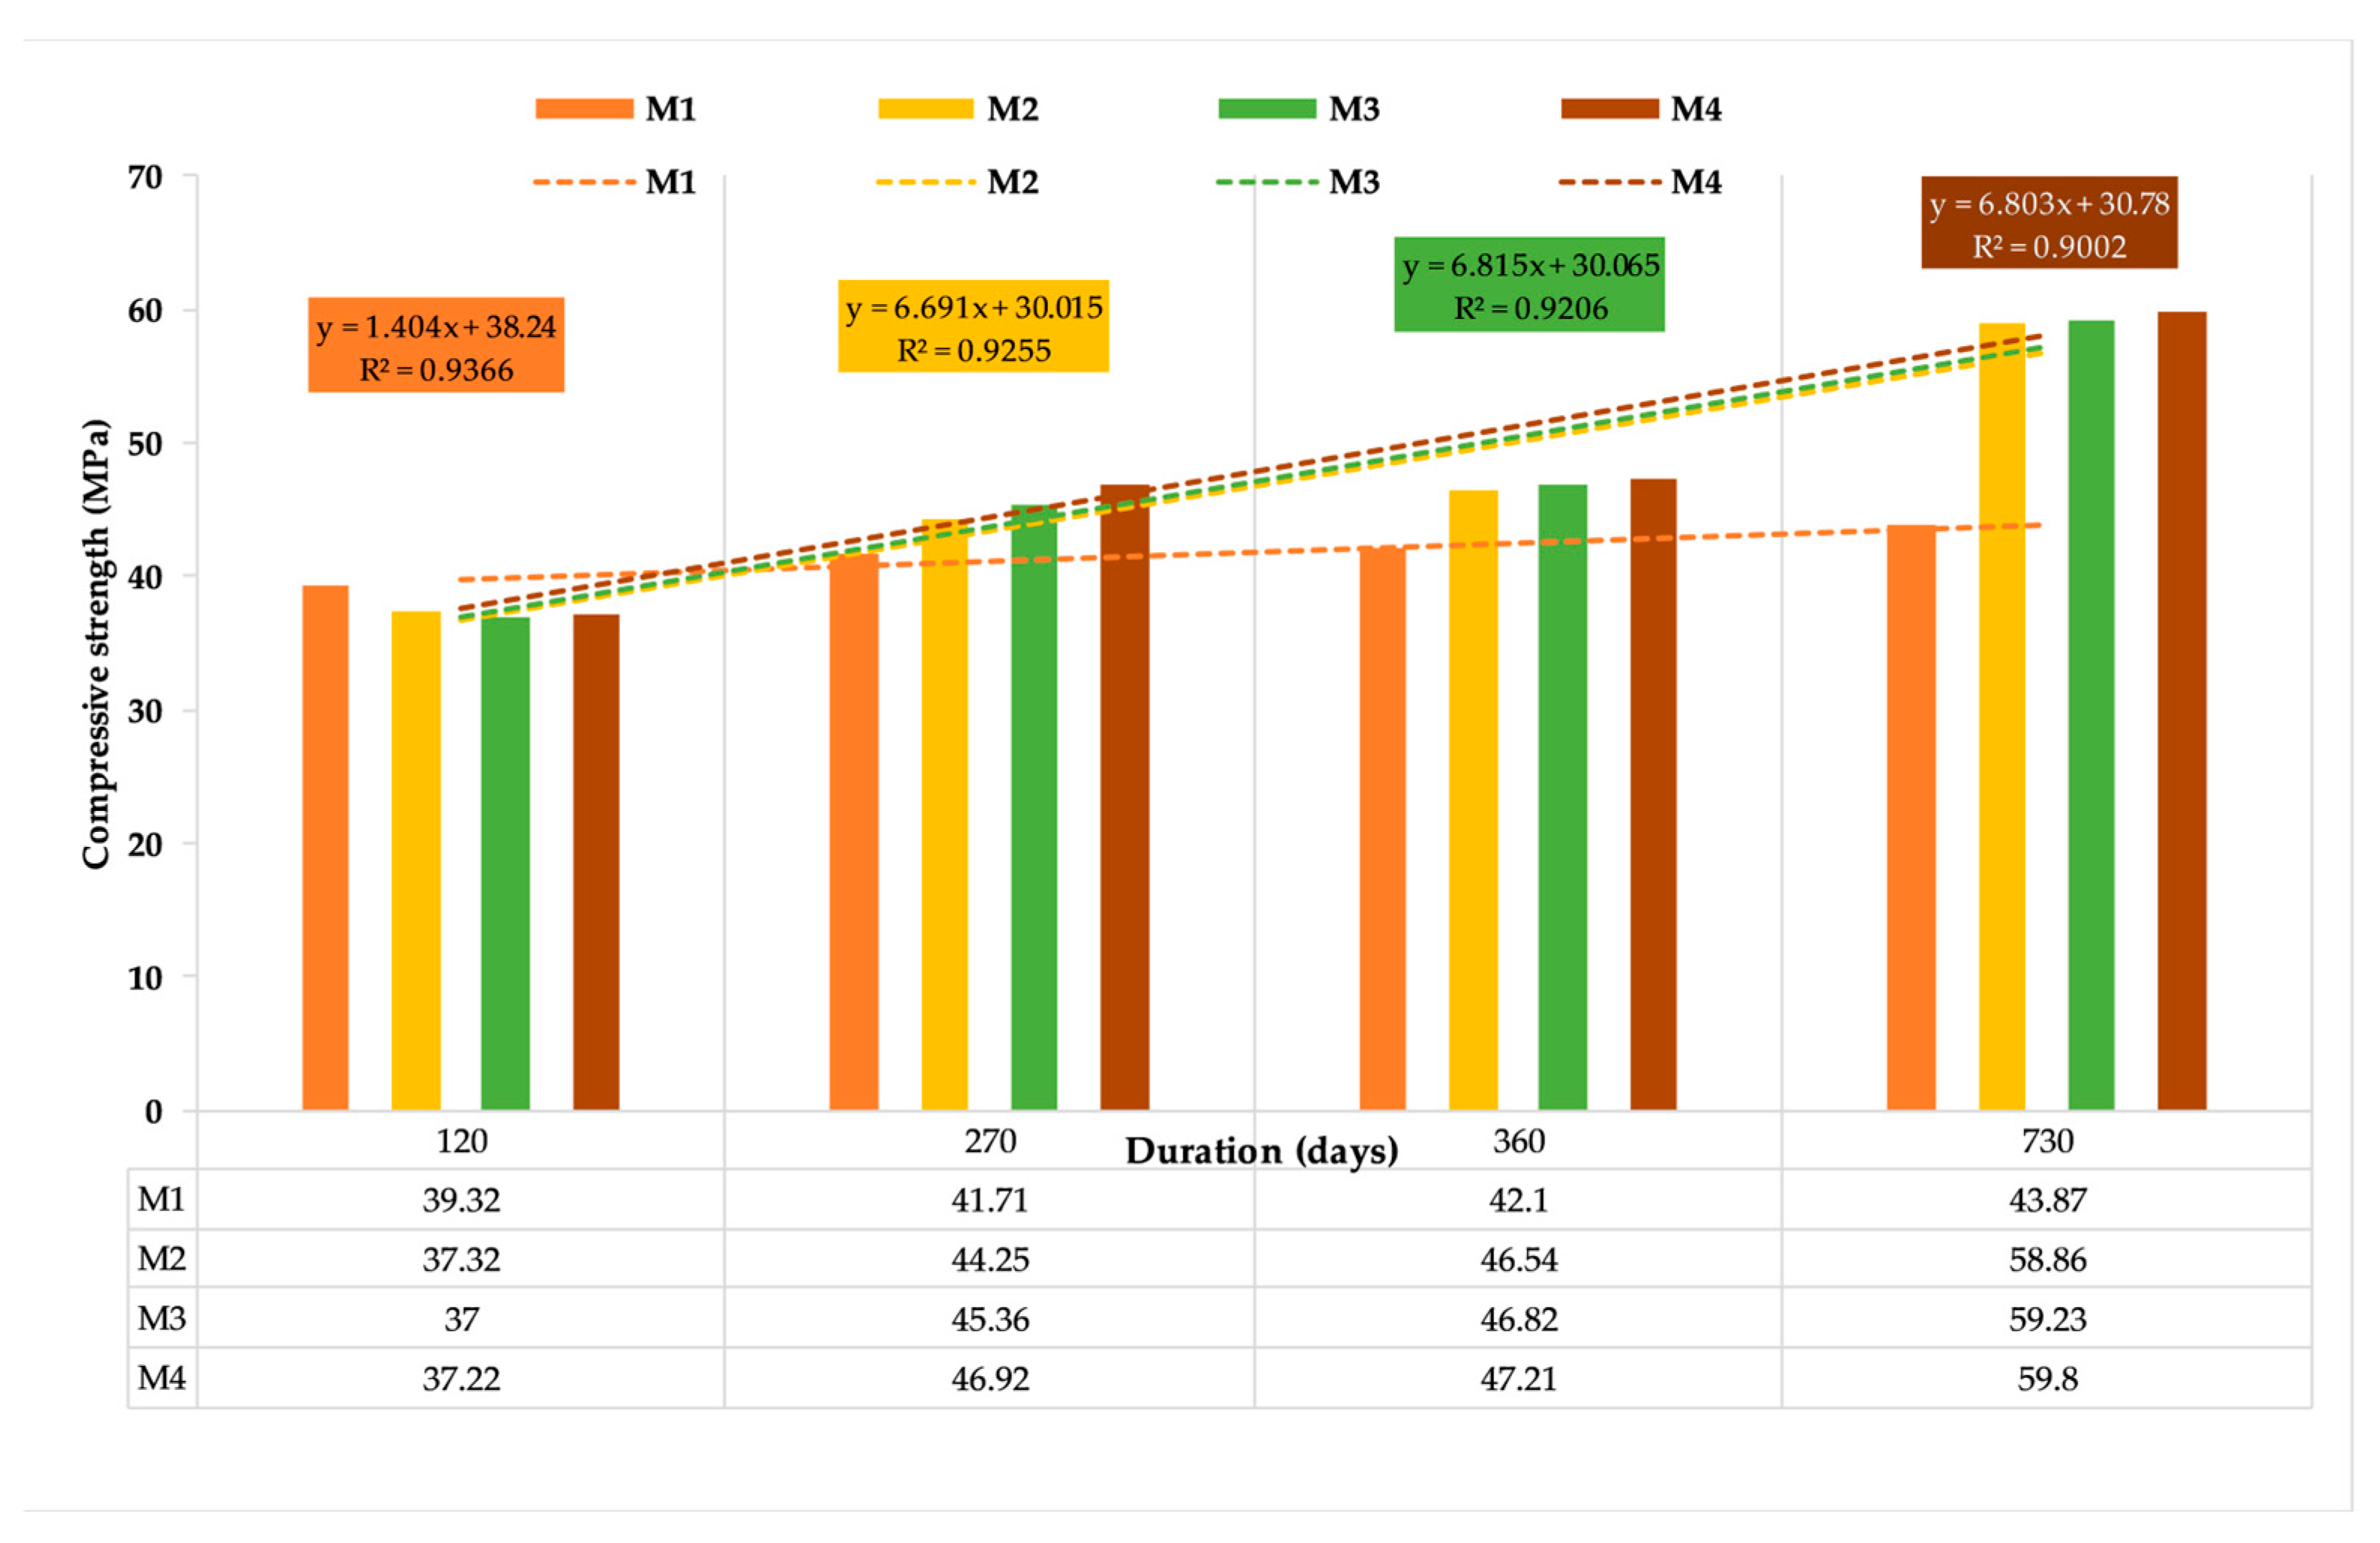
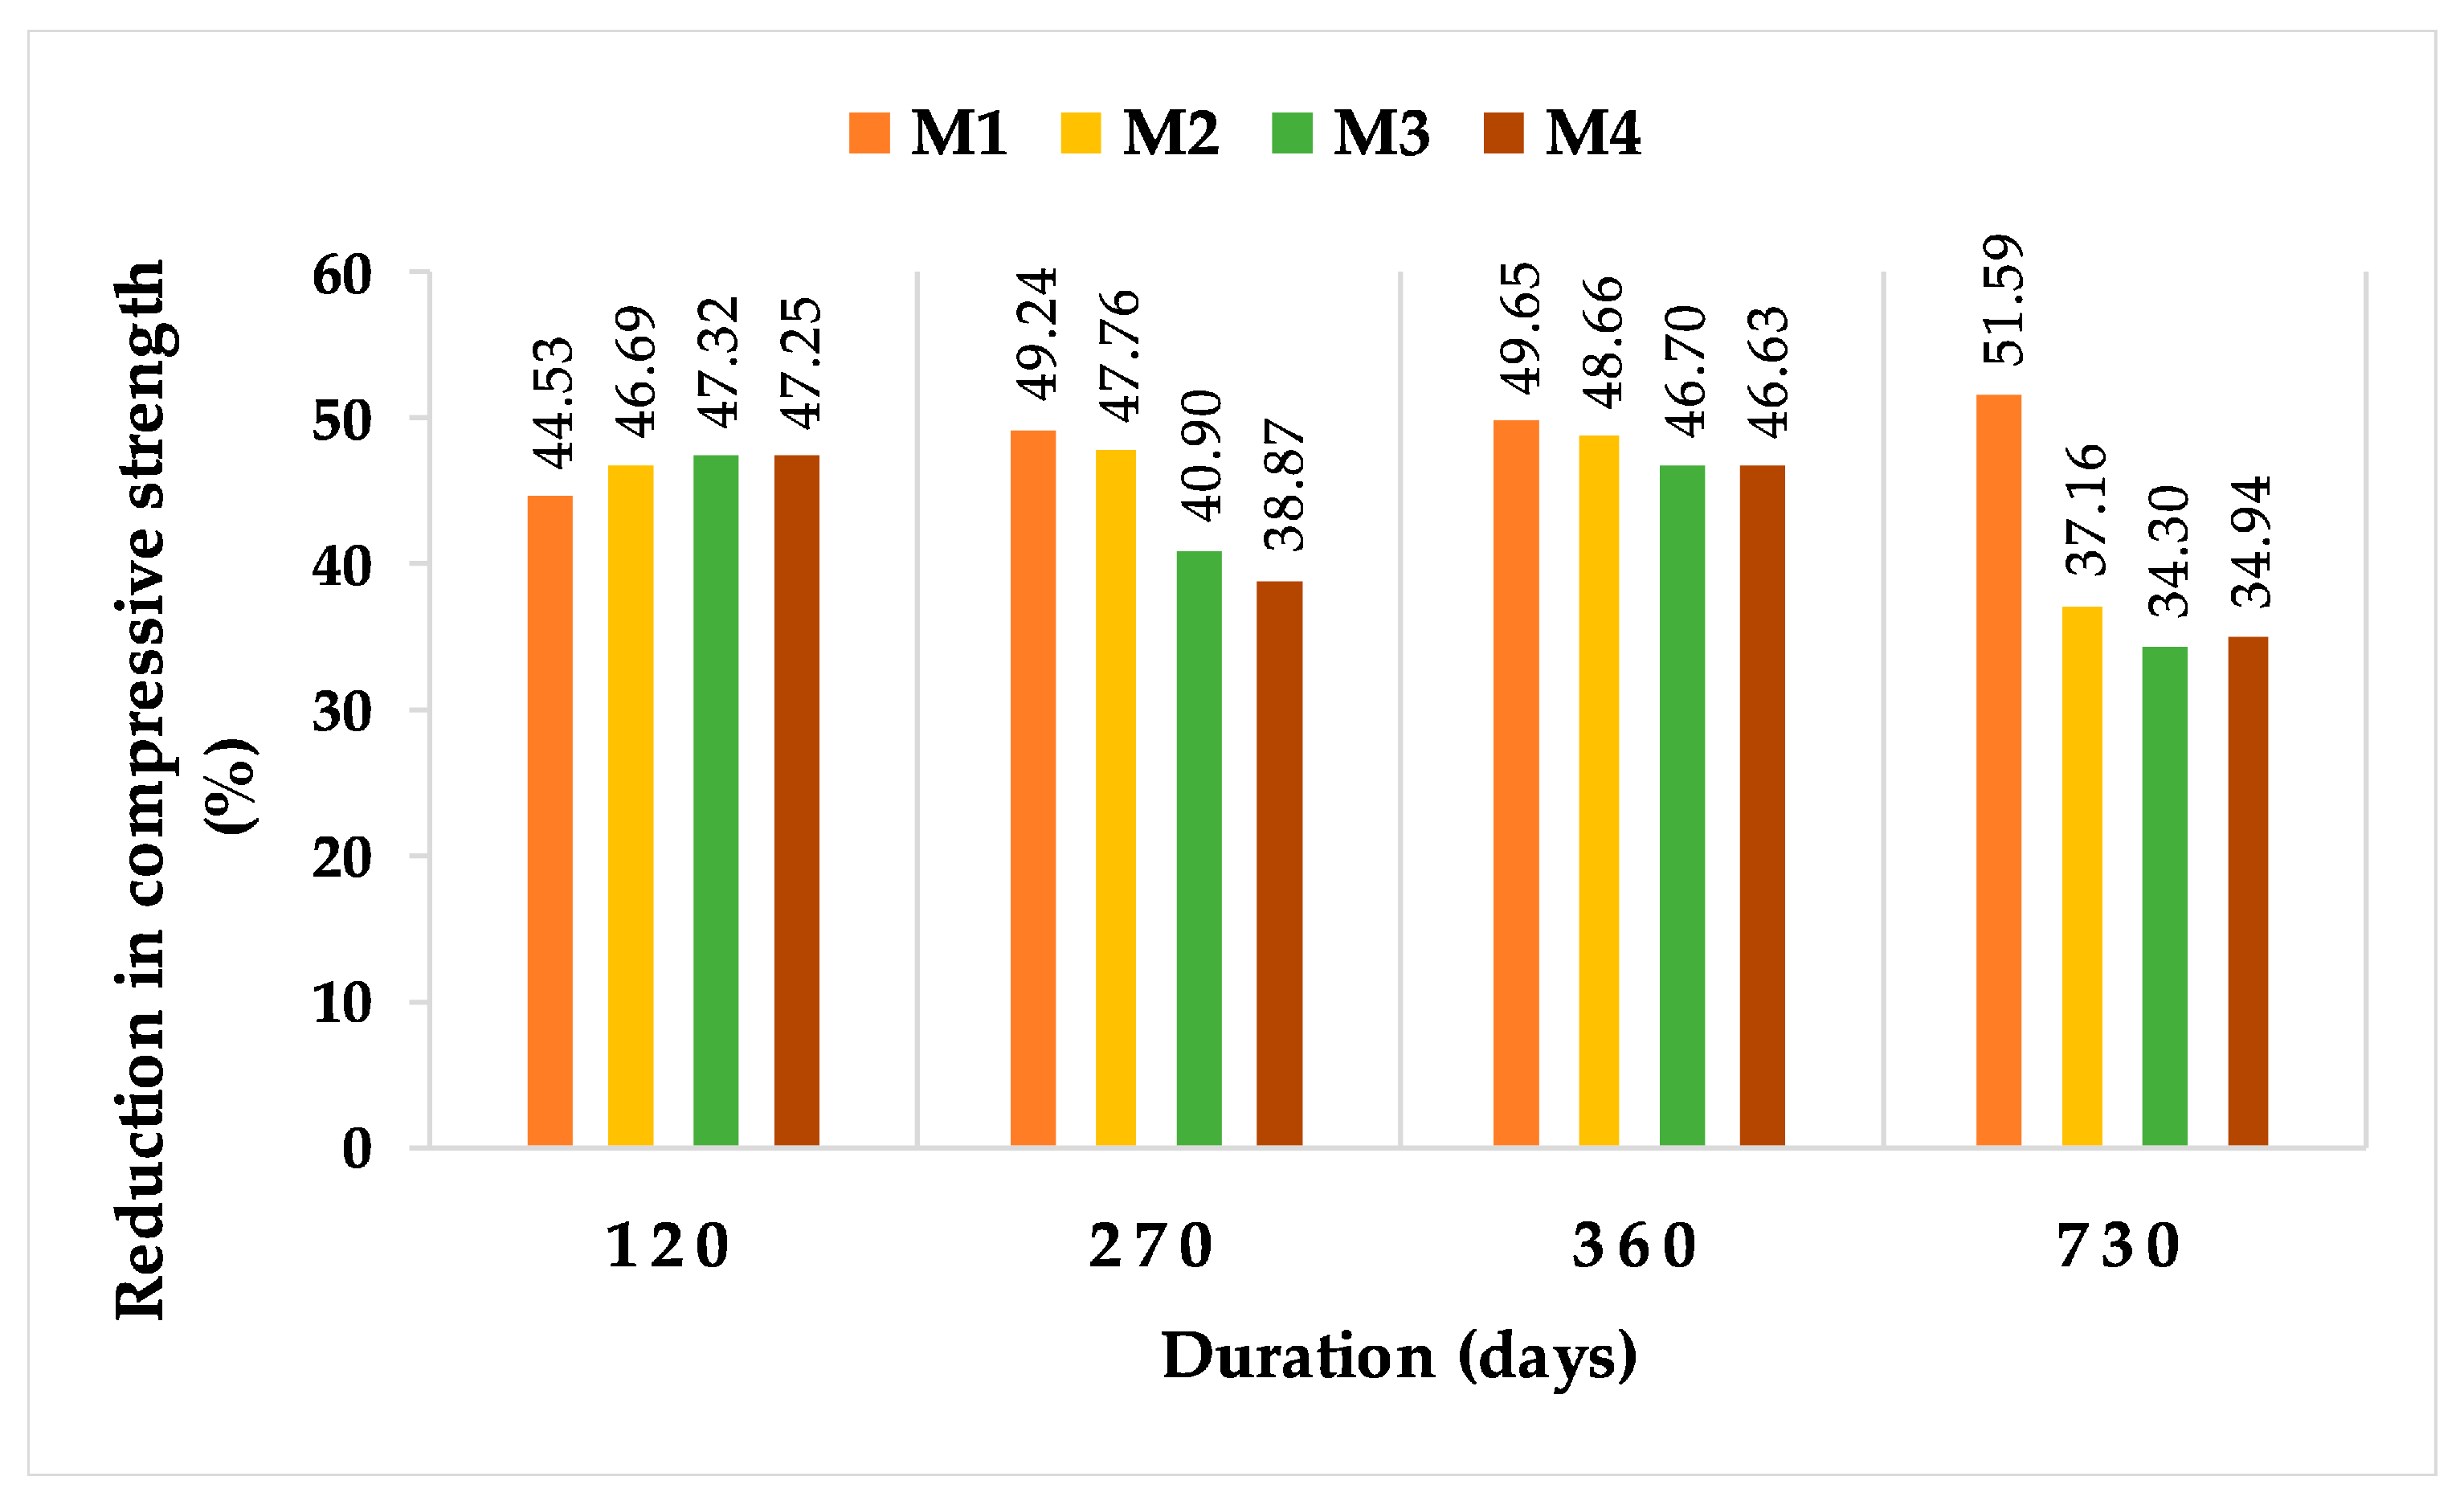
3.3. Compressive Strength

Figure 10 presents the compression test results of M1, M2, M3, and M4 immersed in water. At 120 days, the behavior of all mixtures under compression is similar, with an average compressive strength of about 70 MPa. With prolonged curing, the mixtures with fibers attain about 87 and 90 MPa average compressive strength at 360 and 730 days, respectively, showing less variation in strength gain. However, M2 gains slightly more strength amongst all the mixtures, at later ages. The R2 values for mixtures M1, M3, and M4 are above 0.9. However, the R2 value for mixture M2 is slightly less (0.89). There is a good correlation between strength gain and the duration of curing. The rate of strength gain decreases with an increase in the curing period for all mixtures.
The average compressive strength varies from 39.32–43.87 MPa for M1, 37.32–58.86 MPa for M2, 37–59.23 MPa for M3, and 37.22–59.8 MPa for M4 at 120 and 730 days exposure to chloride solution, as presented in Figure 11. All mixtures show a gradual increase in strength with time. The behavior of mixtures with fibers is almost similar, with less variation in strength at a specific exposure duration. M1 displays lesser strength at all ages in comparison to mixes with fibers. The R2 values for all mixtures are above 0.9.
The percentage reduction in compressive strength is 44.53 for M1 and 47.30 for M4 at 120 days, 49.24 for M1 and 38.86 for M4 at 270 days, 49.65 for M1 and 46.69 for M4 at 360 days, and 51.59 for M1 and 34.94 for M4 at 730 days of exposure to chloride solution, as presented in Figure 12. The strength reduction for all mixtures is similar at 120 days. With the increase in exposure, the mixtures with higher fiber content, M3 and M4, display better behavior in terms of strength retention. However, M1 experiences a 50% decrease in strength at 730 days. The higher fiber content improves the resistance to compression with age due to a stronger interface between the fibers and matrix, which arrests the crack propagation.

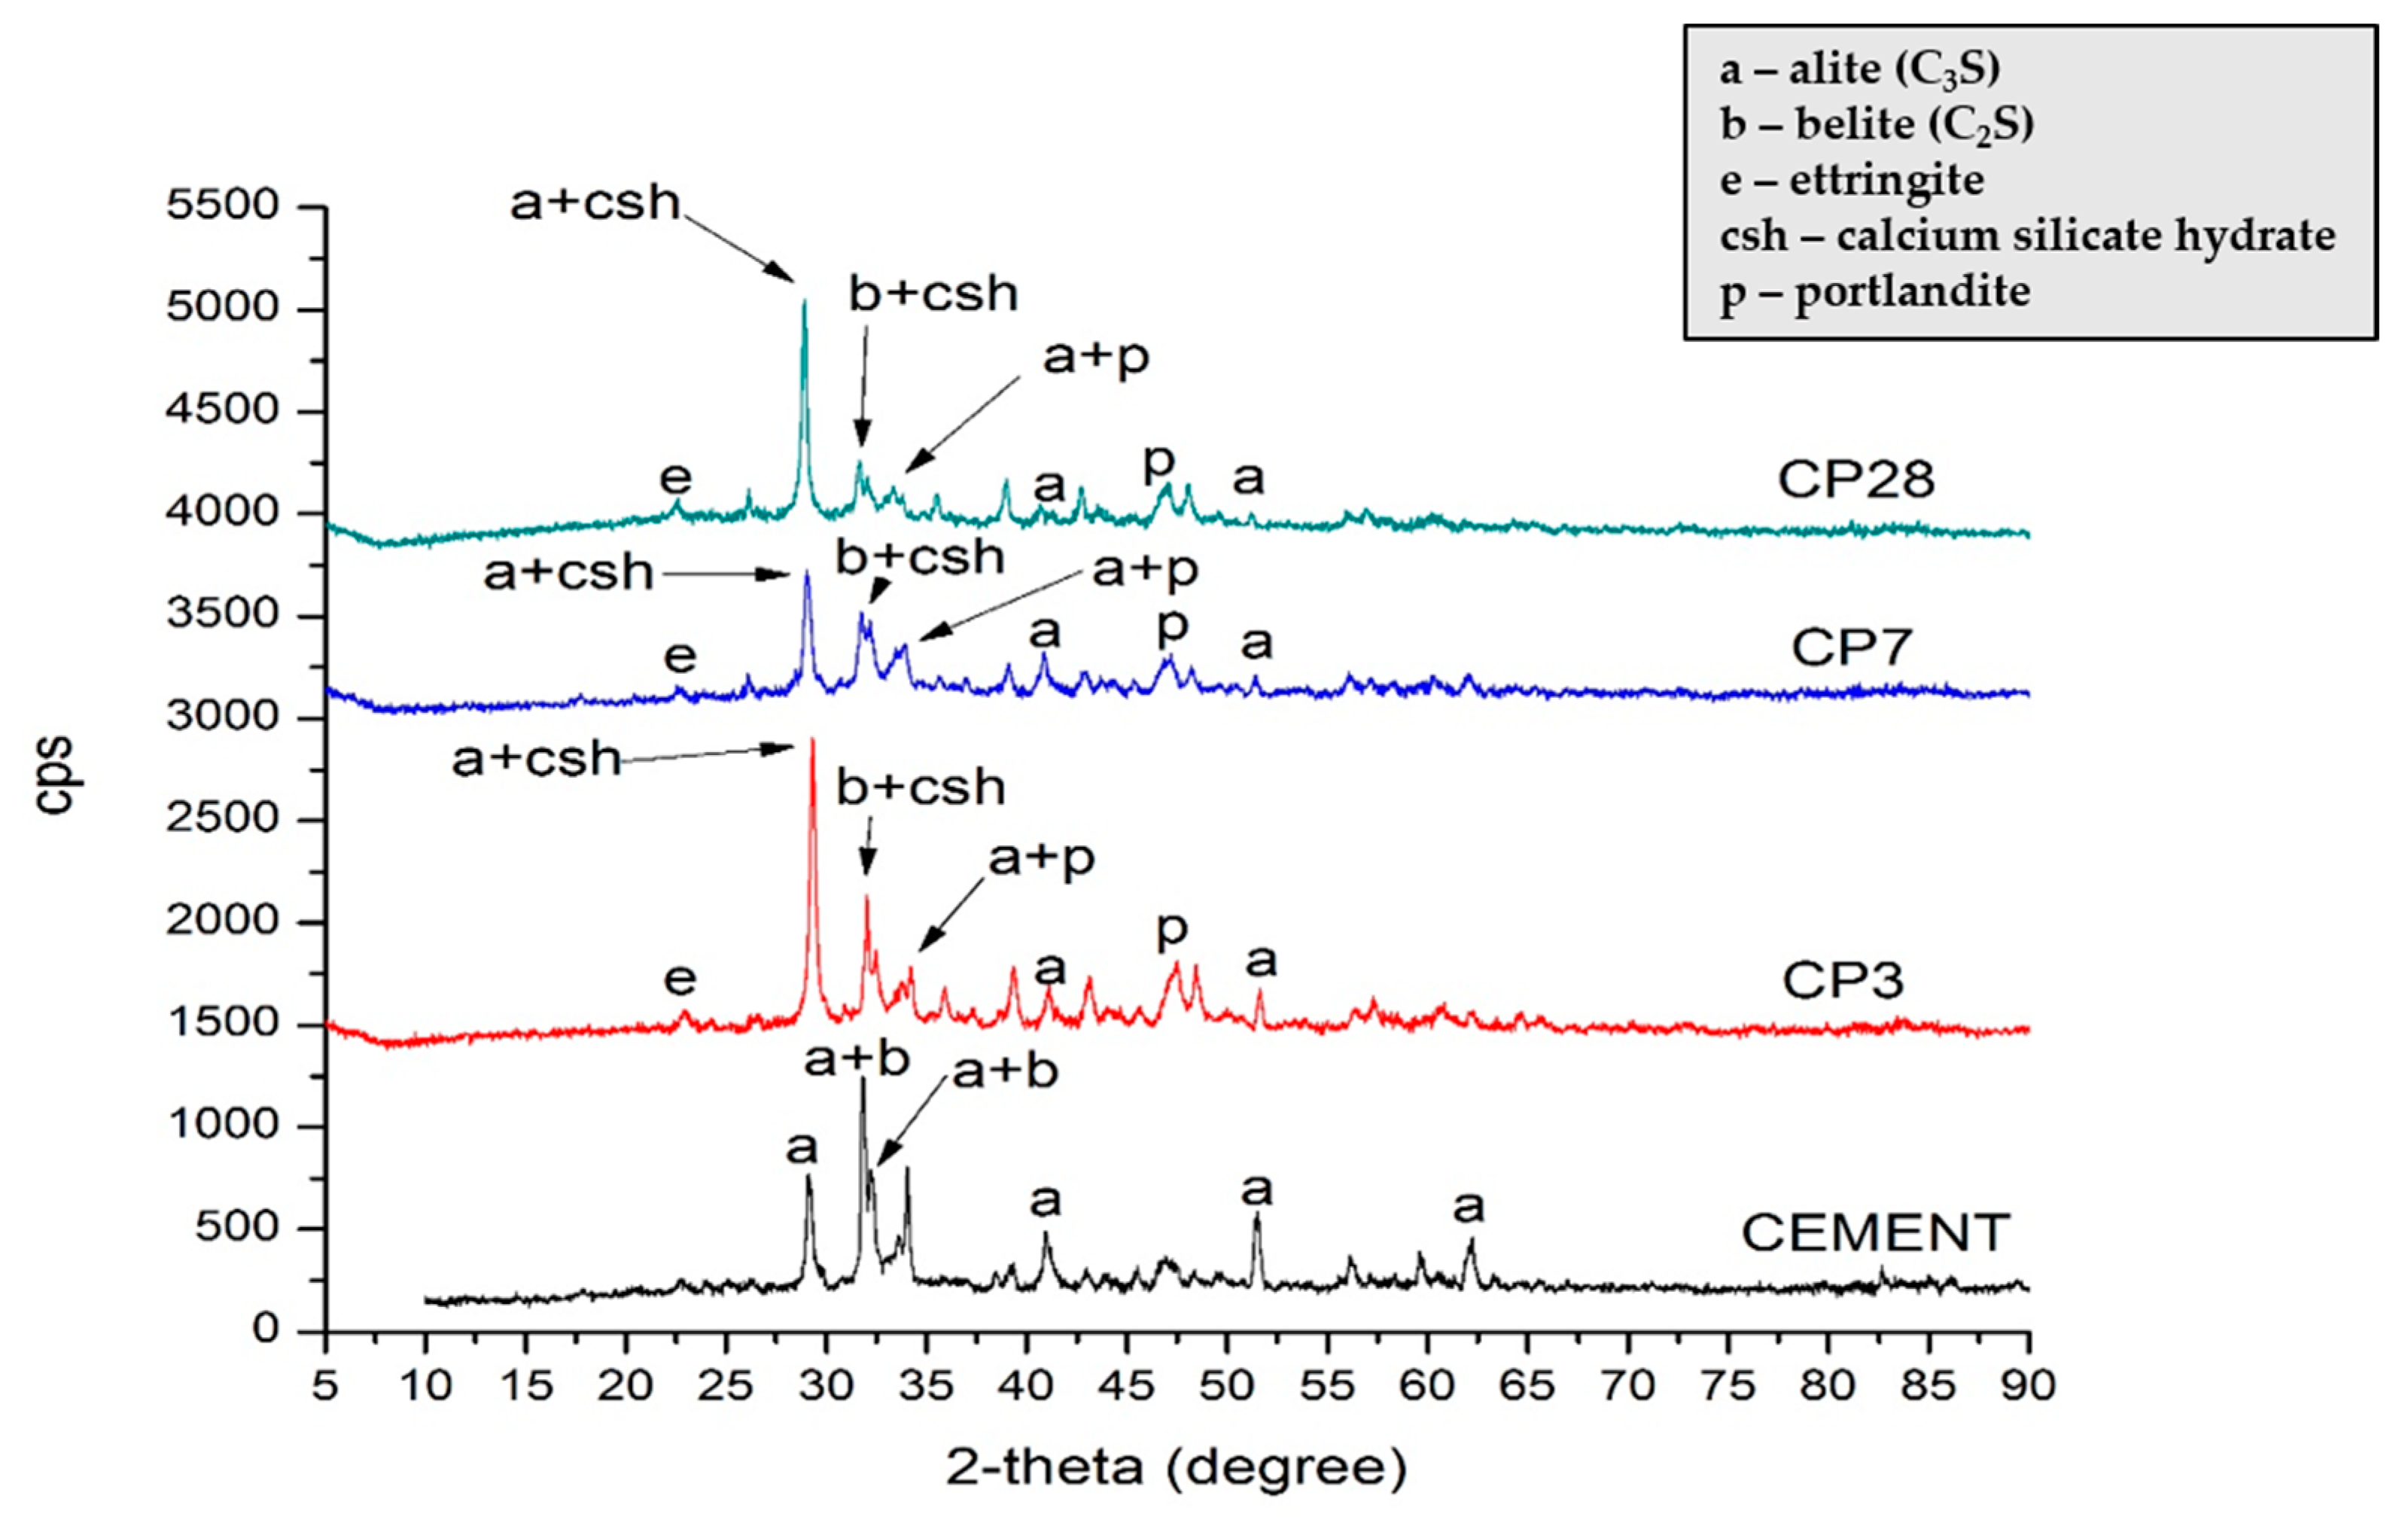
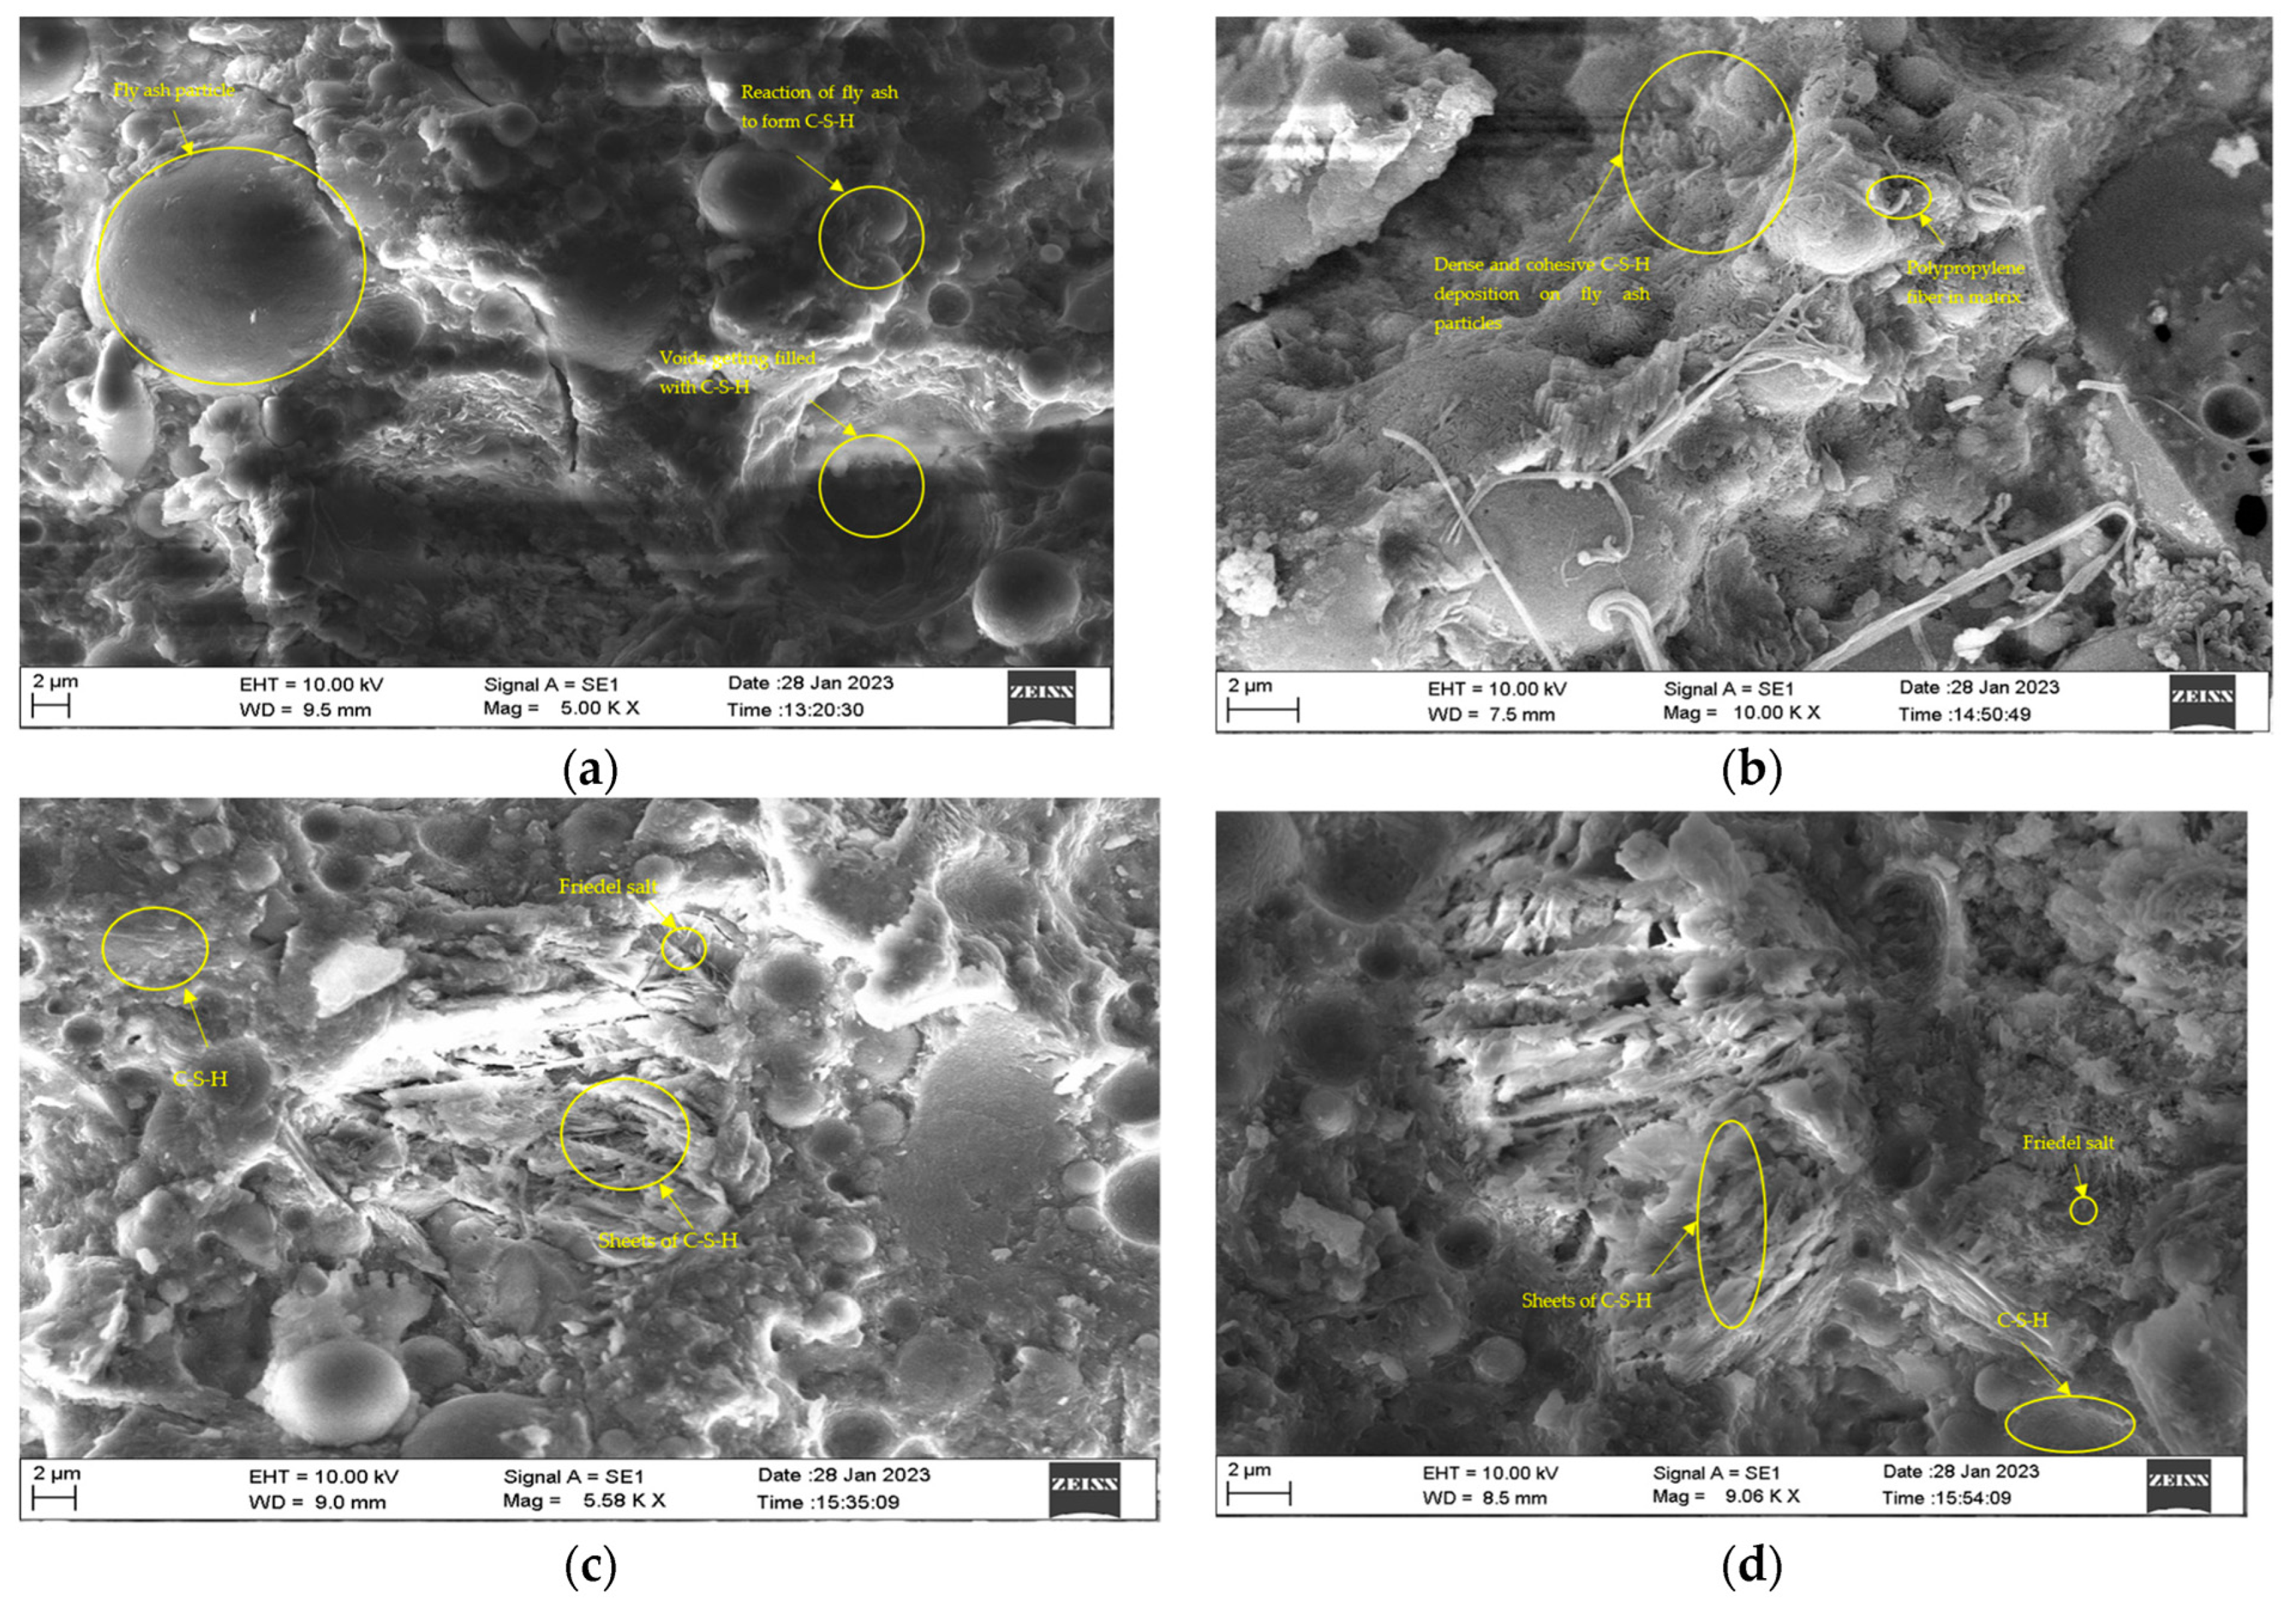
3.4. Microstructure of Chloride-Exposed Specimens

The microstructure of M1, M2, M3, and M4 exposed to a corrosive environment shows a dense matrix, and the deposition of hydration products due to the secondary reaction of reactive silica and alumina with the free lime. Figure 13a displays the microstructure of M1. The matrix is homogeneous, and does not show the presence of large voids. The microstructure of M2, as shown in Figure 13b, reveals the formation of secondary C–S–H (lighter shade) on F-FA particles, indicating the progress of hydration. Figure 13c shows the hydration of F-FA particles at 730 days and unreacted F-FA in the periphery for M3. Figure 13d shows the layers of C–S–H all over the surface and the formation of Friedel’s salt in M4. All four images show the availability of unreacted F-FA as a micro filler that aids in achieving a cohesive, compact, and continuous matrix.
The EDS spectrum of the specimens subjected to a corrosive environment for 730 days shows the presence of calcium, silicate, and aluminate in significant amounts in all the mixtures, as depicted in Figure 14a,b. The presence of chloride is indicated in mixes M3 and M4, as presented in Figure 14c,d. The calcium-to-silica, calcium-to-alumina, and alumina-to-silica ratios are shown in Figure 15 to understand the hydration products.
EDX analysis helps obtain elements’ atomic weights in all four mixtures. The Ca/Si, Ca/Al, and Al/Si ratios for M1, M2, M3, and M4 are determined. The Ca/Si is 0.77, 0.76, 0.81, and 0.82 for mixtures M1, M2, M3, and M4 at 730 days, respectively. The Ca/Al ratio is above 1 for all mixtures, and is highest for M4. The Al/Si for all the mixtures varies between 0.48–0.54. The lower values of Ca/Si indicate the progress of hydration over time, and are consistent with the results obtained for mixtures tested under compression. The higher values of Ca/Al suggest that the reaction of the aluminate phases in F-FA is lesser. The EDX spectrum also confirms the availability of alumina phases in the mixtures. The Al/Si ratio is essential in composites containing SCMs; the higher the ratio, the better the strength. The mixtures at 730 days have a low Al/Si ratio, showing the influence of chloride solution on strength gain.

4. Discussion

4.1. Total Chloride Content

The total chloride contents by weight of the binder at different depths (2, 4, 6, and 8 cm) for M1, M2, and M3 at 120, 270, 360, and 730 days for all mixtures indicate that the values obtained are well within the range specified by EN 206: 2016 [61], except for M4 (at 2 cm depth) at 730 days. The average chloride content in all four mixes exposed to chloride is within 0.4%. Free chlorides are the primary concern for pitting corrosion [62]. The porosity influences the binding capacity of chlorides, the concentration of the pore solution, and the aluminate phases in the system exposed to a corrosive environment. The present study uses 80% F-FA, and the visual inspection reveals that using high-volume F-FA improves the binding capacity of chlorides and effectively reduces the availability of free chloride with time, which is consistent with the findings presented by [63]. In the present study, based on the EDX spectrum and the analysis, the Ca/Al ratio is within the range of 1–2. The binding capacity of chlorides increases with the increase in aluminate phases. The formation of Friedel’s salt encourages the chloride binding capacity in mixtures M3 and M4. The total chloride content is also high for these mixtures. Adding PP fibers influences the total porosity and increases the binding sites’ availability and capacity [64]. However, the average chloride content variation in mixtures incorporating fibers is less. The potential of using 80% F-FA as a pozzolan and micro filler with the addition of PP fibers up to 1.0% offers excellent resistance to chloride ingress in the long term.

4.2. Compressive Strength
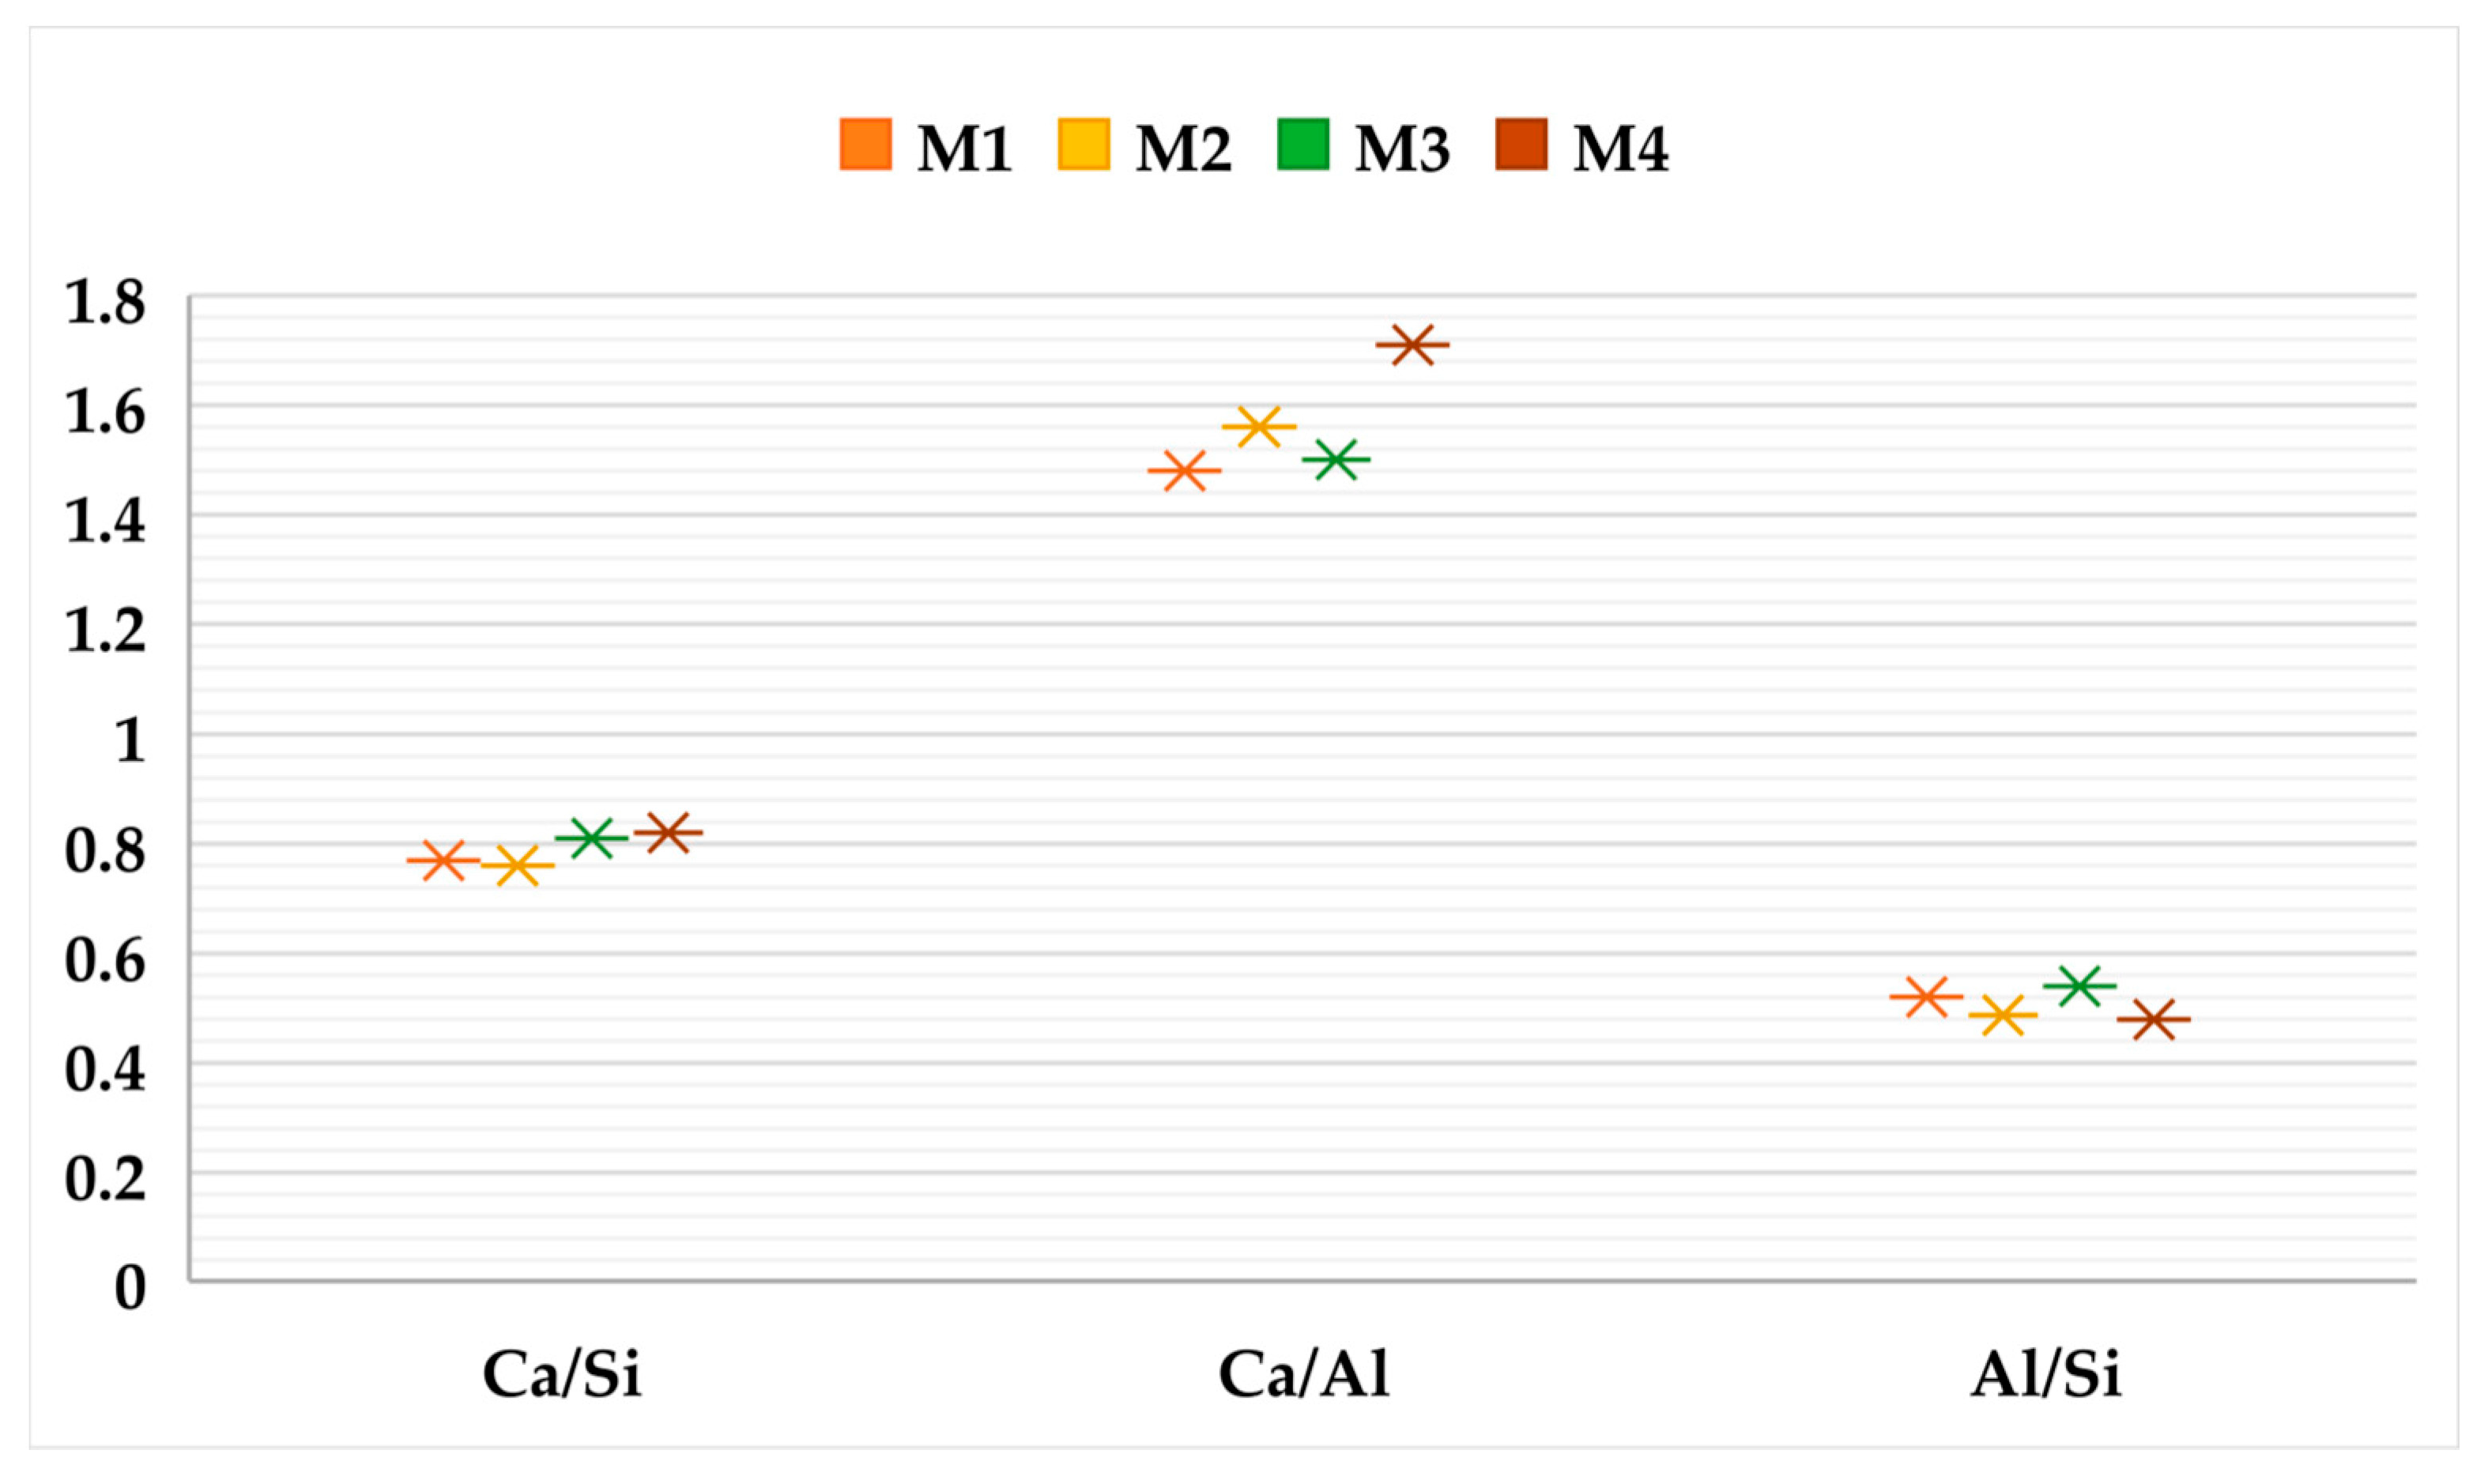
The tests under compression for mixes cured in water and those exposed to a corrosive environment show a continuous strength gain. The rate of strength gain reduces for all mixtures with time, irrespective of the exposure medium. The availability of water, cement particles, the glassy phase of F-FA, and free lime influences the rate of strength gain for specimens cured in water. With time, the microstructure becomes denser, reducing the pore size and thus hindering the formation of secondary C–S–H. In the case of specimens exposed to a corrosive environment, chloride in the pore solution will interfere with the hydration process. The mixtures with fibers show significant retention in compressive strength at all durations, unlike mix M1. The presence of fibers contributes to holding the shape and composite together due to the stitching effect, prevents cracking under load, and may further help prevent spalling. Adding 0.6, 0.8, and 1.0% fibers does not significantly contribute to the strength gain, but displays better values over M1 under normal curing conditions. Using fibers, however, helps prolong corrosion initiation by preventing chloride ingress due to the bridging effect [47]. The physiochemical characteristics of F-FA also largely influence pore refinement. The F-FA used for the present study has a PAI of 1.04, contributing significantly to early-age strength gain in all the mixes. The use of a low water–binder ratio is also crucial for designing durable high-volume F-FA cement composites [9,23,31,32].

4.3. Microstructure

The SEM images of all mixtures supplement the ability of NAC to offer superior resistance when exposed to a corrosive environment in the long term, indicating a dense and cohesive matrix in the formation of dense primary C–S–H, sheets of secondary C–S–H, and the deposition of C–S–H on F-FA. The lower Al/Si shows the availability of aluminate phases that help improve the ability to bind the chlorides [64]. The presence of F-FA all over the surface indicates its ability to enhance the microstructure as a micro filler [65].

5. Conclusions

This article presents the long-term behavior of NAC with a high volume fraction of PP fibers in response to a corrosive environment. The exposure duration is up to 2 years, and the considered parameters assess the presence of free and bound chlorides, the total chloride content, and the change in the compressive strength; the article also presents a morphological study using SEM images and EDX analysis.
Incorporating 80% F-FA improves the chloride retention of NAC significantly, and offers excellent resistance to the ingress of chlorides. Adding PP fibers up to 0.8% produces a similar trend, although 1% PP fiber specimens have the highest total chloride content amongst the test groups. The results, however, are within the acceptable range, as per EN 206.
There is a significant improvement in the compressive strength over time for specimens with fibers. However, the volume fraction of fibers plays an insignificant role in improving compressive strength. On the other hand, adding PP fibers retains the compressive strength significantly for all exposure durations.
The SEM images show a homogeneous matrix contributed by the presence of secondary C–S–H, unreacted F-FA, and a continuous matrix, indicating a dense microstructure. EDS analysis supplements the SEM images and experimental results on the compressive strength progression of all the samples.
The present study shows that mixes with and without fibers have an excellent resistance to chloride ingress, which will enable the application of NAC in both normal and corrosive environments.

Author Contributions

Conceptualization, H.K.S.; and G.N.; methodology, H.K.S.; investigation, H.K.S.; resources, L.P.K.; data curation, H.K.S.; writing—original draft preparation, H.K.S.; writing—review and editing, H.K.S., K.K.S. and L.P.K.; visualization, H.K.S.; supervision, G.N.; project administration, G.N. and K.K.S. All authors have read and agreed to the published version of the manuscript.

Funding

This research received no external funding, and the APC was funded by the Manipal Academy of Higher Education, Manipal 576104, Karnataka, India.

Institutional Review Board Statement

Not applicable.

Informed Consent Statement

Not applicable.

Data Availability Statement

Not applicable.

Acknowledgments

The authors credit the inventors, Bhanumathidas and N. Kalidas, INSWAREB, Vishakhapatnam, Andhra Pradesh, India, for allowing the authors to work on no-aggregate concrete, and for offering technical and technological support at various stages of the study. They hold the IP rights to no-aggregate concrete.

Conflicts of Interest

The authors declare no conflict of interest.

References

  1. Pradhan, B. Corrosion Behavior of Steel Reinforcement in Concrete Exposed to Composite Chloride–Sulfate Environment. Constr. Build. Mater. 2014, 72, 398–410. [Google Scholar] [CrossRef]
  2. Li, C.Q.; Zheng, J.J.; Lawanwisut, W.; Melchers, R.E. Concrete Delamination Caused by Steel Reinforcement Corrosion. J. Mater. Civ. Eng. 2007, 19, 591–600. [Google Scholar] [CrossRef]
  3. Łowińska-Kluge, A.; Błaszczyński, T. The Influence of Internal Corrosion on the Durability of Concrete. Arch. Civ. Mech. Eng. 2012, 12, 219–227. [Google Scholar] [CrossRef]
  4. Cabrera, J.G. Deterioration of Concrete Due to Reinforcement Steel Corrosion. Cem. Concr. Compos. 1996, 18, 47–59. [Google Scholar] [CrossRef]
  5. Thomas, M. Supplementary Cementing Materials in Concrete; CRC Press: Boca Raton, FL, USA, 2013; ISBN 978-0-429-07170-6. [Google Scholar]
  6. Hsu, S.; Chi, M.; Huang, R. Effect of Fineness and Replacement Ratio of Ground Fly Ash on Properties of Blended Cement Mortar. Constr. Build. Mater. 2018, 176, 250–258. [Google Scholar] [CrossRef]
  7. Yu, Z.; Ma, J.; Ye, G.; Van Breugel, K.; Shen, X. Effect of Fly Ash on the Pore Structure of Cement Paste under a Curing Period of 3 Years. Constr. Build. Mater. 2017, 144, 493–501. [Google Scholar] [CrossRef]
  8. Andrade, C.; Buják, R. Effects of Some Mineral Additions to Portland Cement on Reinforcement Corrosion. Cem. Concr. Res. 2013, 53, 59–67. [Google Scholar] [CrossRef]
  9. Malhotra, V.M.; Mehta, P.K. High-Performance, High-Volume Fly Ash Concrete: Materials, Mixture Proportioning, Properties, Construction Practice, and Case Histories; Supplementary Cementing Materials for Sustainable Development Inc.: Ottawa, ON, Canada, 2002; ISBN 978-0-9731507-0-4. [Google Scholar]
  10. Papadakis, V.G. Effect of Supplementary Cementing Materials on Concrete Resistance against Carbonation and Chloride Ingress. Cem. Concr. Res. 2000, 30, 291–299. [Google Scholar] [CrossRef]
  11. de Gutiérrez, R.M.; Díaz, L.N.; Delvasto, S. Effect of Pozzolans on the Performance of Fiber-Reinforced Mortars. Cem. Concr. Compos. 2005, 27, 593–598. [Google Scholar] [CrossRef]
  12. Reyes-Diaz, E.P.; Martínez-Villafañe, A.; Bastidas, J.M.; TiburcioT, C.G. Corrosion Behavior of Steel Embedded in Ternary Concrete Mixtures. Int. J. Electrochem. Sci. 2011, 6, 1892–1905. [Google Scholar] [CrossRef]
  13. Zhao, Q.; He, X.; Zhang, J.; Jiang, J. Long-Age Wet Curing Effect on Performance of Carbonation Resistance of Fly Ash Concrete. Constr. Build. Mater. 2016, 127, 577–587. [Google Scholar] [CrossRef] [Green Version]
  14. Tang, S.W.; Yao, Y.; Andrade, C.; Li, Z.J. Recent Durability Studies on Concrete Structure. Cem. Concr. Res. 2015, 78, 143–154. [Google Scholar] [CrossRef]
  15. Zhan, P.; Xu, J.; Wang, J.; Jiang, C. Multi-Scale Study on Synergistic Effect of Cement Replacement by Metakaolin and Typical Supplementary Cementitious Materials on Properties of Ultra-High Performance Concrete. Constr. Build. Mater. 2021, 307, 125082. [Google Scholar] [CrossRef]
  16. Chen, X.-F.; Quan, C.-Q.; Jiao, C.-J. Experimental Study of Chloride Resistance of Polypropylene Fiber Reinforced Concrete with Fly Ash and Modeling. Materials 2021, 14, 4417. [Google Scholar] [CrossRef] [PubMed]
  17. Fajardo, G.; Valdez, P.; Pacheco, J. Corrosion of Steel Rebar Embedded in Natural Pozzolan Based Mortars Exposed to Chlorides. Constr. Build. Mater. 2009, 23, 768–774. [Google Scholar] [CrossRef]
  18. Bhanumathidas, N.; Kalidas, N. Sustainable Development through Use of Fly Ash. In Proceedings of the Keynote Paper presented at National Seminar on Building Materials & Technology for Sustainable Development, Ahmedabad, Gujarat, 21–22 January 2005. [Google Scholar]
  19. Ramezanianpour, A.A. The Role of Supplementary Cementing Materials on Sustainable Development. In Cement Replacement Materials: Properties, Durability, Sustainability; Ramezanianpour, A.A., Ed.; Springer Geochemistry/Mineralogy; Springer: Berlin/Heidelberg, Germany, 2014; pp. 327–336. ISBN 978-3-642-36721-2. [Google Scholar]
  20. Hashmi, A.F.; Shariq, M.; Baqi, A. Use of HVFA Concrete for Sustainable Development: A Comprehensive Review on Mechanical and Structural Properties. Arab. J. Sci. Eng. 2022, 47, 12265–12288. [Google Scholar] [CrossRef]
  21. Shi, X.; Xie, N.; Fortune, K.; Gong, J. Durability of Steel Reinforced Concrete in Chloride Environments: An Overview. Constr. Build. Mater. 2012, 30, 125–138. [Google Scholar] [CrossRef]
  22. Khatib, J.; Jahami, A.; El Kordi, A.; Sonebi, M.; Malek, Z.; Elchamaa, R.; Dakkour, S. Effect of Municipal Solid Waste Incineration Bottom Ash (MSWI-BA) on the Structural Performance of Reinforced Concrete (RC) Beams. J. Eng. Des. Technol. 2021, 21, 862–882. [Google Scholar] [CrossRef]
  23. Chousidis, N.; Ioannou, I.; Rakanta, E.; Koutsodontis, C.; Batis, G. Effect of Fly Ash Chemical Composition on the Reinforcement Corrosion, Thermal Diffusion and Strength of Blended Cement Concretes. Constr. Build. Mater. 2016, 126, 86–97. [Google Scholar] [CrossRef]
  24. Chousidis, N.; Rakanta, E.; Ioannou, I.; Batis, G. Mechanical Properties and Durability Performance of Reinforced Concrete Containing Fly Ash. Constr. Build. Mater. 2015, 101, 810–817. [Google Scholar] [CrossRef]
  25. Bilodeau, A.; Malhotra, V.M. High-Volume Fly Ash System: Concrete Solution for Sustainable Development. Mater. J. 2000, 97, 41–48. [Google Scholar] [CrossRef]
  26. Qu, F.; Li, W.; Dong, W.; Tam, V.W.Y.; Yu, T. Durability Deterioration of Concrete under Marine Environment from Material to Structure: A Critical Review. J. Build. Eng. 2021, 35, 102074. [Google Scholar] [CrossRef]
  27. Phiêu, L.T.; Lành, H.S.; Thanh, H.T.T.; Dung, H.T.M.; Chánh, Đ.C.; Phước, H.T. The Influence of High-Volume Fly Ash Content on Mechanical Properties of Cement Paste. Tạp Chí Khoa Học Và Công Nghệ Đại Học Đà Nẵng 2022, 20, 121–125. [Google Scholar]
  28. Ho, L.S.; Huynh, T.-P. Long-Term Mechanical Properties and Durability of High-Strength Concrete Containing High-Volume Local Fly Ash as a Partial Cement Substitution. Results Eng. 2023, 18, 101113. [Google Scholar] [CrossRef]
  29. Herath, C.; Gunasekara, C.; Law, D.W.; Setunge, S. Performance of High Volume Fly Ash Concrete Incorporating Additives: A Systematic Literature Review. Constr. Build. Mater. 2020, 258, 120606. [Google Scholar] [CrossRef]
  30. Kumar, M.; Sinha, A.K.; Kujur, J. Mechanical and Durability Studies on High-Volume Fly-Ash Concrete. Struct. Concr. 2021, 22, E1036–E1049. [Google Scholar] [CrossRef]
  31. Aydin, E.; Arel, H.Ş. Characterization of High-Volume Fly-Ash Cement Pastes for Sustainable Construction Applications. Constr. Build. Mater. 2017, 157, 96–107. [Google Scholar] [CrossRef]
  32. Moon, G.D.; Oh, S.; Choi, Y.C. Effects of the Physicochemical Properties of Fly Ash on the Compressive Strength of High-Volume Fly Ash Mortar. Constr. Build. Mater. 2016, 124, 1072–1080. [Google Scholar] [CrossRef]
  33. Babalu, R.; Anil, A.; Sudarshan, K.; Amol, P. Compressive Strength, Flexural Strength, and Durability of High-Volume Fly Ash Concrete. Innov. Infrastruct. Solut. 2023, 8, 154. [Google Scholar] [CrossRef]
  34. Li, J.; Wu, Z.; Shi, C.; Yuan, Q.; Zhang, Z. Durability of Ultra-High Performance Concrete—A Review. Constr. Build. Mater. 2020, 255, 119296. [Google Scholar] [CrossRef]
  35. Yu, Y.; Yu, J.; Ge, Y. Water and Chloride Permeability Research on Ordinary Cement Mortar and Concrete with Compound Admixture and Fly Ash. Constr. Build. Mater. 2016, 127, 556–564. [Google Scholar] [CrossRef]
  36. Concrete Durability Presented by Acceptable Chloride Level and Chloride Diffusion Coefficient in Concrete: 10-Year Results in Marine Site|SpringerLink. Available online: https://link.springer.com/article/10.1617/s11527-013-0131-4 (accessed on 14 June 2023).
  37. Lollini, F.; Redaelli, E.; Bertolini, L. Investigation on the Effect of Supplementary Cementitious Materials on the Critical Chloride Threshold of Steel in Concrete. Mater. Struct. 2016, 49, 4147–4165. [Google Scholar] [CrossRef] [Green Version]
  38. Filho, J.H.; Medeiros, M.H.F.; Pereira, E.; Helene, P.; Isaia, G.C. High-Volume Fly Ash Concrete with and without Hydrated Lime: Chloride Diffusion Coefficient from Accelerated Test. J. Mater. Civ. Eng. 2013, 25, 411–418. [Google Scholar] [CrossRef] [Green Version]
  39. Shaikh, F.U.A.; Supit, S.W.M. Chloride Induced Corrosion Durability of High Volume Fly Ash Concretes Containing Nano Particles. Constr. Build. Mater. 2015, 99, 208–225. [Google Scholar] [CrossRef]
  40. Moffatt, E.G.; Thomas, M.D.A.; Fahim, A. Performance of High-Volume Fly Ash Concrete in Marine Environment. Cem. Concr. Res. 2017, 102, 127–135. [Google Scholar] [CrossRef]
  41. Ma, H.; Yi, C.; Wu, C. Review and Outlook on Durability of Engineered Cementitious Composite (ECC). Constr. Build. Mater. 2021, 287, 122719. [Google Scholar] [CrossRef]
  42. Liu, J.; Wang, Y. Predicting the Chloride Diffusion in Concrete Incorporating Fly Ash by a Multi-Scale Model. J. Clean. Prod. 2022, 330, 129767. [Google Scholar] [CrossRef]
  43. Turk, K.; Kina, C.; Nehdi, M.L. Durability of Engineered Cementitious Composites Incorporating High-Volume Fly Ash and Limestone Powder. Sustainability 2022, 14, 10388. [Google Scholar] [CrossRef]
  44. Rashad, A.M.; Ouda, A.S. Effect of Tidal Zone and Seawater Attack on High-Volume Fly Ash Pastes Enhanced with Metakaolin and Quartz Powder in the Marine Environment. Microporous Mesoporous Mater. 2021, 324, 111261. [Google Scholar] [CrossRef]
  45. Yu, J.; Zhang, M.; Li, G.; Meng, J.; Leung, C.K.Y. Using Nano-Silica to Improve Mechanical and Fracture Properties of Fiber-Reinforced High-Volume Fly Ash Cement Mortar. Constr. Build. Mater. 2020, 239, 117853. [Google Scholar] [CrossRef]
  46. Wang, J.; Dong, H. PVA Fiber-Reinforced Ultrafine Fly Ash Concrete: Engineering Properties, Resistance to Chloride Ion Penetration, and Microstructure. J. Build. Eng. 2023, 66, 105858. [Google Scholar] [CrossRef]
  47. Liu, Y.; Wang, L.; Cao, K.; Sun, L. Review on the Durability of Polypropylene Fibre-Reinforced Concrete. Adv. Civ. Eng. 2021, 2021, e6652077. [Google Scholar] [CrossRef]
  48. Ammasi, A.K. Ragul Strength and Durability of High Volume Fly Ash in Engineered Cementitious Composites. Mater. Today Proc. 2018, 5, 24050–24058. [Google Scholar] [CrossRef]
  49. Afroz, M.; Venkatesan, S.; Patnaikuni, I. Effects of Hybrid Fibers on the Development of High Volume Fly Ash Cement Composite. Constr. Build. Mater. 2019, 215, 984–997. [Google Scholar] [CrossRef]
  50. IS 4031-1; Methods of Physical Tests for Hydraulic Cement, Part 1: Determination of Fineness by Dry Sieving. Bureau of Indian Standards: Chandigarh, India, 1996.
  51. IS 4031-11; Methods of Physical Tests for Hydraulic Cement, Part 11: Determination of Density. Bureau of Indian Standards: Chandigarh, India, 1988.
  52. IS 4031-4; Methods of Physical Tests for Hydraulic Cement, Part 4: Determination of Consistency of Standard Cement Paste. Bureau of Indian Standards: Chandigarh, India, 1988.
  53. IS 4031-5; Methods of Physical Tests for Hydraulic Cement, Part 5: Determination of Initial and Final Setting Times. Bureau of Indian Standards: Chandigarh, India, 1988.
  54. IS 4031-6; Methods of Physical Tests for Hydraulic Cement, Part 6: Determination of Compressive Strength of Hydraulic Cement (Other than Masonry Cement). Bureau of Indian Standards: Chandigarh, India, 1988.
  55. IS 1727; Methods of Test for Pozzolanic Materials. Bureau of Indian Standards: Chandigarh, India, 1967.
  56. IS 3812-1; Specification for Pulverized Fuel Ash, Part 1: For Use as Pozzolana in Cement, Cement Mortar and Concrete. Bureau of Indian Standards: Chandigarh, India, 2003.
  57. NORDTEST; Author Concrete, Hardened: Accelerated Chloride Penetration (NT BUILD 443). Bureau of Indian Standards: Chandigarh, India, 1995.
  58. NT Build 208. Concrete, Hardened: Chloride Content by Volhard Titration; Nordtest: Esbo, Finland, 1996. [Google Scholar]
  59. IS 516; Method of Tests for Strength of Concrete. Bureau of Indian Standards: Chandigarh, India, 1959.
  60. Chalhoub, C.; François, R.; Carcasses, M. Critical Chloride Threshold Values as a Function of Cement Type and Steel Surface Condition. Cem. Concr. Res. 2020, 134, 106086. [Google Scholar] [CrossRef]
  61. EN 206-1:2000/A1:2004; Concrete-Part 1: Specification, Performance, Production and Conformity. British Standards Institution: London, UK, 2000.
  62. Liu, J.; Jiang, Z.; Zhao, Y.; Zhou, H.; Wang, X.; Zhou, H.; Xing, F.; Li, S.; Zhu, J.; Liu, W. Chloride Distribution and Steel Corrosion in a Concrete Bridge after Long-Term Exposure to Natural Marine Environment. Materials 2020, 13, 3900. [Google Scholar] [CrossRef]
  63. Khan, M.U.; Ahmad, S.; Al-Gahtani, H.J. Chloride-Induced Corrosion of Steel in Concrete: An Overview on Chloride Diffusion and Prediction of Corrosion Initiation Time. Int. J. Corros. 2017, 2017, e5819202. [Google Scholar] [CrossRef] [Green Version]
  64. Falaciński, P.; Machowska, A.; Szarek, Ł. The Impact of Chloride and Sulphate Aggressiveness on the Microstructure and Phase Composition of Fly Ash-Slag Mortar. Materials 2021, 14, 4430. [Google Scholar] [CrossRef]
  65. Du, S.; Zhao, Q.; Shi, X. High-Volume Fly Ash-Based Cementitious Composites as Sustainable Materials: An Overview of Recent Advances. Adv. Civ. Eng. 2021, 2021, e4976169. [Google Scholar] [CrossRef]
Figure 1. XRD pattern of cement powder and cement paste cured for 3, 7, and 28 days.
Sustainability 15 11481 g001
Figure 2. XRD pattern of NAC cured for 3, 7, and 28 days.
Sustainability 15 11481 g002
Figure 3. Research methodology.
Sustainability 15 11481 g003
Figure 4. (a) Preconditioning of specimens before exposure to chloride solution; (b) Split surface of NAC after exposure to chloride solution; (c) Color change observed after spraying with AgNO3 solution; (d) Powdered sample obtained at different depths after exposure to a chloride environment; (eg) Preparation of solution to determine total chloride as per NT BUILD 208; (h,i) Endpoint of the titration.
Sustainability 15 11481 g004
Figure 5. Visual inspection at 120 days for (a) M1, (b) M2, (c) M3, and (d) M4.
Sustainability 15 11481 g005
Figure 6. Visual inspection at 270 days for (a) M1, (b) M2, (c) M3, and (d) M4.
Sustainability 15 11481 g006
Figure 7. Visual inspection at 730 days for (a) M1, (b) M2, (c) M3, and (d) M4.
Sustainability 15 11481 g007
Figure 8. Total chloride content at different depths for M1, M2, M3, and M4.
Sustainability 15 11481 g008
Figure 9. Average chloride content for M1, M2, M3, and M4.
Sustainability 15 11481 g009
Figure 10. Compressive strength of M1, M2, M3, and M4 immersed in water.
Sustainability 15 11481 g010
Figure 11. Compressive strength of M1, M2, M3, and M4 exposed to corrosive environment.
Sustainability 15 11481 g011
Figure 12. Reduction in compressive strength of M1, M2, M3, and M4 exposed to a corrosive environment.
Sustainability 15 11481 g012
Figure 13. SEM images of specimens exposed to chloride solution for 730 days (a) M1, (b) M2, (c) M3, and (d) M4.
Sustainability 15 11481 g013
Figure 14. EDX spectrum of specimens exposed to chloride for 730 days for (a) M1, (b) M2, (c) M3, (d) M4.
Sustainability 15 11481 g014
Figure 15. Ratios of oxides present in the mix after exposure to chlorides for 730 days.
Sustainability 15 11481 g015
Table 1. Chemical composition of F-FA.
Chemical CompositionPercentage
SiO261.18
MgO1.77
SO30.31
Chlorides0.005
Na2O0.28
CaO3.08
K2O0.94
Al2O324.98
Fe2O34.47
Loss on ignition0.20
Table 2. Physical properties of cement and F-FA.
MaterialsTestsIS CodeResultsRequirementConformity
Cement: OPC 43 grade Fineness (90 µ)IS 4031 (part I) 1988/R2019 [50]7.3%<10%Yes
Specific gravityIS 4031 (part 11) 1988/R2019 [51]3.13--
ConsistencyIS 4031—(part 4)—1988 [52]30%--
Initial setting time IS 4031 (part 5) 1988/R2019 [53]190 min30 min
(minimum)
Yes
Final setting time IS 4031 (part 5) 1988/R2019 [53]270 min600 min
(maximum)
Yes
Compressive strength test on mortarIS 4031 (part 6) 1988/R2019 [54]3 days29.09 Mpa23 MPaYes
7 days35.11 Mpa33 MPaYes
28 days44.14 MPa43 MPaYes
Fly ash (Class-F) Fineness by wet sieve analysisIS 1727-1967 [55]12%34% as per IS 3812 [56]yes
Specific Gravity IS 1727-1967 [55]2.10--
Consistency IS 1727-1967 [55] (IS 4031-1988-part IV)31%--
Initial and final setting IS 1727-1967 [55] (IS 4031-1988-part V)285 min. and 320 min--
Compressive strength test for CM, 50 mm CubesIS 1727-1967 [55]47.03 MPa -
Compressive strength test for 80(OPC):20(F-FA), 50 mm cubesIS 1727-1967 [55]49.6 MPa--
PAI @ 28 days of curingIS 1727-1967 [55]1.054--
Table 3. Mix proportion of NAC with and without fibers in kg/m3.
Mix. No.NameCementFly AshWaterAdmixturePP Fibers
M1NAC3251300243.756.50
M2NAC PP 0.63251300243.756.55.52
M3NAC PP 0.83251300243.756.57.36
M4NAC PP 1.03251300243.756.59.2
Disclaimer/Publisher’s Note: The statements, opinions and data contained in all publications are solely those of the individual author(s) and contributor(s) and not of MDPI and/or the editor(s). MDPI and/or the editor(s) disclaim responsibility for any injury to people or property resulting from any ideas, methods, instructions or products referred to in the content.

