

Research on Power Battery Recycling in the Green Closed-Loop Supply Chain: An Evolutionary Game-Theoretic Analysis

1
School of Economics and Management, Xi’an University of Posts and Telecommunications, Xi’an 710061, China
2
School of Modern Post, Xi’an University of Posts and Telecommunications, Xi’an 710061, China
*
Author to whom correspondence should be addressed.
Sustainability 2023, 15(13), 10425; https://doi.org/10.3390/su151310425
Submission received: 3 June 2023
/
Revised: 30 June 2023
/
Accepted: 30 June 2023
/
Published: 2 July 2023
(This article belongs to the Topic Design Strategies for Battery Energy Storage and Electric Vehicles to Promote Circular Economy)
Abstract
:The used power batteries of new energy vehicles have become a combined issue of environmental pollution, resource scarcity, and economic sustainability. Power battery recycling is inevitably becoming the key link in the formation of the green closed-loop supply chain for new energy vehicles and the green cycle of the new energy vehicles industry. This study establishes a three-party evolutionary game model of “new energy vehicle manufacturers, power battery manufacturers, and power battery recyclers”, simulates the dynamic evolution process of each game player’s strategy, and analyzes the effects of the digital transformation factor and other factors leading to the evolution trend. The main results show that: (i) in the absence of sufficient incentives and constraints, the green closed-loop power battery supply chain cannot be formed naturally; (ii) digital transformation is an important factor in the journey of the green closed-loop supply chain for power battery recycling, and (iii) government rewards and penalties can promote the formation of the green closed-loop supply chain for power batteries. This research innovatively investigates the concept of the green closed-loop power battery supply chain and its formation mechanism, which provides theoretical support to promote the recycling of used power batteries to achieve sustainability.
1. Introduction
During the recent years, new energy vehicles have stood out as an option among various fuel-powered vehicles, due to their low pollution and energy consumption advantages. By the end of 2022, China had surpassed 13 million new energy vehicles [1], increasing the tightness in supply of lithium, cobalt, nickel, and other metal materials. As the new energy vehicle industry continues to progress, there is a rising concern about how to effectively manage used power batteries. Recycling used power batteries and metal materials can relieve the pressure of resource tension and achieve sustainable development [2]. According to statistics, in 2022, the actual amount of lithium batteries recycled in China is only 54.46% of the theoretical recycling volume, as shown in Figure 1. Meanwhile, according to the EVTank, the theoretical used battery recycling volume in China will reach 2,312,000 tons in 2026. Suppose these used batteries are not properly disposed of, they can potentially lead to environmental pollution, such as heavy metal contamination of soils, which leads to a great danger to the sustainability of the environment [3].
The Ministry of Industry and Information Technology and others jointly formulated the “Interim Measures for the Administration of Recycling and Utilization of New Energy Vehicle Power Batteries” on 26 January 2018 (hereafter referred to as the “Measures”) to solve the above problems. The “Measures” clearly stipulate that the new energy vehicle manufacturers (NEVMs) should take the main responsibility of power battery recycling and supply chain companies should fulfill obligations in all aspects to ensure effective usage and environmental protection of the batteries.
Currently, the primary emphasis of power battery recycling research is on technological advancements [4,5,6]. The green closed-loop supply chain perspective has not received adequate attention. In addition, digital transformation brings new business model opportunities and can also promote cooperation among green closed-loop supply chain actors [7]. Thus, encouraging the recycling of power batteries and making it easier for the establishment of a sustainable, eco-friendly, green, closed-loop supply chain is another crucial topic that needs attention.
We extract a three-party game model consisting of NEVMs, power battery manufacturers (PBMs), and power battery recyclers (PBRs) from reality. We take into account the green closed-loop supply chain relationship and explore the decision-making process of power battery recycling stakeholders along with their influential factors, in response to national policy, to promote enhancements in the recycling system.
The innovation of this paper is that we focused on the reverse part of the green closed-loop supply chain of power batteries based on a game model under the conditions of limited rationality and incomplete information. Unlike previous studies that take the government as the subject of the game, the focus of this study is not on the gains and losses of the government, but on the mechanism of the formation of the green closed-loop supply chain for power battery recycling under government rewards and penalties. In addition, this study innovatively introduces the variable of digital transformation and explores the impact of digital transformation and other influences on the green behavior of power battery supply chain subjects. Finally, based on the simulation results, the study finds that NEVMs are the key nodes in the formation of the green closed-loop supply chain of power batteries, which provides an important reference for further promoting green power battery recycling.
The main questions we will discuss are: the impact of digital transformation and other factors on power battery recycling and the formation mechanism of the green closed-loop supply chain of power batteries. The following is the organization of the remainder of our study. In Section 2, we combed through the relevant literature. Section 3 develops an evolutionary game model of power battery recycling and examines its stability. We then proceed to a simulation analysis, based on Section 3, in Section 4. Finally, we give the conclusions and implications, proposing strategic recommendations for enterprises and government.
2. Literature Review
The existing literature on battery recycling has been fruitful. The literature is evaluated and analyzed from the following angles: power battery recycling, green closed-loop supply chain and its influencing factors, and theoretic models of power battery recycling.
2.1. Power Battery Recycling
While the production process and sales process of power batteries are similar to the pattern of ordinary products, the reverse recycling of power batteries is very different from ordinary products. Scholars employ various theories to explore power battery recycling from different perspectives. In terms of the recycling process, there are two ways to recycle used power batteries: step utilization and disassembly. After the used power battery is recovered by the recycler, it will first go through residual power detection. When the residual energy reaches the step utilization standard, the power battery could be used in step utilization to play its residual value [8]. Some scholars have analyzed the problems existing in the process of step utilization in our country and have put forward some suggestions for achieving efficient cyclable power battery echelon utilization, such as breaking through the technical bottleneck of step utilization, improving the standard system, etc. [9,10]. The second situation is: if the used power battery fails to meet the requirements of step utilization after detection, it must be professionally disassembled, and the disassembled raw materials will be recycled [11]. At the current stage, the power batteries mostly use ternary material batteries and lithium iron phosphate batteries. Ternary material batteries provide better energy density compared to lithium iron phosphate batteries, but the capacity of the ternary battery decreases rapidly after decommissioning, and considering the safety factors, it is not suitable for step utilization. Considering that there are too many participants in the step utilization, this paper chooses to discuss the process of power battery disassembly and recycling.
Concerning the current state of power battery recycling, Li et al. [12] addressed the state in China, proposing to speed up the construction of the recycling system. Jiao and Evans [13] found that building a business model for power battery recycling could help reduce production costs. Based on the extended producer responsibility (EPR) perspective, Ma [14] discussed the interests of relevant subjects to the EPR and proposed more effective suggestions for power battery recycling.
On the factors affecting recycling, according to some scholars, power battery recycling can be influenced by recycling policies and incentives, such as subsidies [15,16]. Government subsidies can influence the price of recycling, which in turn provides a positive incentive for recycling behavior [17]. The factors that affect enterprises’ participation in power battery recycling are not only the relevant regulations, policies, and economic factors formulated by the government, but also the social responsibility of enterprises and the environmental awareness of consumers [18]. Some scholars have conducted research on consumer willingness to recycle and found that perceived behavior has the greatest impact on consumer recycling behavior [19]. Wang and Li [20] introduced product quality heterogeneity as a new variable in the game model of market recovery and analyzed how the government would formulate the optimal plan to deal with discarded products when multiple parties are involved in recycling.
In terms of the power battery recovery mode, some scholars use the game theory approach to study the subjects of pure electric vehicle power battery recycling and believe that the government, enterprises, and consumers should collaborate to establish an effective recycling system [21]. Tang et al. [22] conducted a comparative analysis of power battery recycling models under the incentive and penalty mechanism, finding that total social welfare was the highest among the recycling modes of manufacturers and retailers. Zheng et al. [23] proposed cooperation with producers to establish a nationwide internet recycling information platform. In addition, through the simulation analysis, it is found that the recycling mode requires a large investment upfront, the recovery efficiency is low, the middle stage is obvious, and the later stage presents steady and sustained growth. Lui and Ma [24] developed a model of power batteries and investigated the role of influencing factors such as subsidy model and scale effect of recyclers.
2.2. Green Closed-Loop Supply Chain and Its Influencing Factors
Supply chain is a complex network that is based on collaborative and mutually beneficial relationships between multiple agents, and any changes or actions taken by one stakeholder can create a ripple reaction to the entire network [25]. Closed-loop supply chain is a model that integrates forward supply chain activities with reverse logistics processes, which is defined as a closed loop connected end to end, and the products produced are in this closed loop from production to scrap recovery [26]. From production to recycling to reuse, each stage will influence the others. All participants involved in power battery recycling, including NEVMs, PBMs, and PBRs, are considered key subjects in the closed-loop supply chain.
The green closed-loop supply chain is a closed-loop supply chain that maximizes environmental benefits by recovering and reusing waste resources [27,28]. Green closed-loop supply chain aims to achieve both economic and environmental benefits, without sacrificing one for the other. It seeks to find a balance between the two, achieving the best possible outcomes for both. In the field of power batteries, the establishment of the green closed-loop supply chain is to achieve a closed-loop from sales to recycling, especially the proper disposal of used power batteries.
The recycling subjects can be divided into three modes: manufacturing enterprises, sales enterprises, and recycling and dismantling enterprises according to the recycling subjects [29]. Yao and Teng [30] studied the closed-loop supply chain that consisted of manufacturers, retailers, and recyclers based on fairness concerns, and analyzed the impact of competitive behavior of the two retailers. Some scholars also apply the system dynamics model to study waste recycling patterns in the context of closed-loop supply chains [31].
Achieving an efficient and environmentally friendly green closed-loop supply chain system is important. Like in the closed-loop supply chain, collaboration among multiple enterprises in the green closed-loop supply chain can enhance the efficiency and benefits of the supply chain [32,33]. Asymmetric information in the green closed-loop supply chain will lead to the reduction of the manufacturer’s profits in the recycling process, while the retailer’s profits will increase [34]. If the government can effectively coordinate the roles of members by offering various incentive policies to those within the green closed-loop supply chain, then both profits and output are likely to improve [35]. Zhang et al. [36] indicated that the power battery recycling rate is the highest, and the total profits are highest when the government imposes incentives and penalties on vehicle companies.
Scholars have also explored other influences in addition to the government. During the battery recycling process, some scholars have found that technological innovation can increase the recycling rate while enhancing the economic benefits of the circulation system [35,37,38]. With the development of digital technology, scholars have found that digital transformation can also catalyze collaboration in the green closed-loop supply chain [39].
Digital transformation involves leveraging digital technologies to reconfigure business models and enhance the overall user experience [40,41]. However, few scholars have investigated the combination of the green closed-loop supply chain and digital transformation. Research on enterprise digital transformation has focused on several aspects of business management, organizational structure, and production efficiency [42,43,44]. Whether digital transformation can promote power battery recycling, thus forming a green closed-loop, becomes a question worth exploring.
2.3. Theoretic Models of Power Battery Recycling
Evolutionary game focuses on the dynamic process of strategy selection within a group, with a focus on understanding the evolutionary stability of equilibria [45].
In the area of recycling, scholars have conducted in-depth discussions. Xu et al. [46] studied the relationship between online and offline recycling enterprises of e-waste with the help of an evolutionary game model. Wang et al. [47] studied the evolutionary stability strategies in different stages of industrial development by building an evolutionary game model, and proposed that the government should take the leading position in the e-waste recycling industry. Li et al. [48] analyzed the strategy of each subject in the government regulation game of e-waste recycling governance by building an evolutionary game model of manufacturers, recycling enterprises, and the government, and proposed policy recommendations.
The research model of e-waste recycling provides references for power batteries. Wang et al. [49] investigated the factors influencing the investment patterns of PBRs based on the evolutionary game model. Zhang et al. [50] have verified the importance of government participation in power battery recycling based on the evolutionary game model, proposing a typical mechanism for establishing urban revolving subsidies. Other scholars discussed the EPR mechanism based on an evolutionary game model and proposed that the dynamic rewards and penalties could positively promote power battery recycling [51].
Meanwhile, evolutionary game models have been applied to the construction of green closed-loop supply chains. Huo et al. [52] explored the choice and equilibrium degree of different manufacturing companies under different recycling decision conditions. Zhang et al. [53] employed an evolutionary game model to explore the reversal mechanism for the development of closed-loop supply chains to promote their development towards being low carbon and green.
In conclusion, the process of power battery recycling is a multi-stakeholder dynamic game process, involving multiple interests. The specific mechanism and influencing factors remain to be explored. This research investigates how to promote green recycling of power batteries and how the green closed-loop supply chain is formed. It analyzes how digital transformation and other factors impact power battery recycling and makes targeted strategic recommendations.
3. Evolutionary Game Model Building
Optimal collaboration in power battery recycling requires all subjects to possess complete information transparency and be fully rational. However, in reality, it can be difficult for agents to maintain these qualities in a complex market environment. Given that the power battery recycling business is in its infant stage, the instability of cooperation and uncertainty about the future development of the industry make the various subjects in the green closed-loop supply chain have a certain degree of mistrust. Therefore, it is hard for the game subjects to have complete information conditions and complete rationality [34]. Evolutionary game theory examines the dynamic evolution process of group selection strategy, as it considers the bounded rationality and incomplete information transparency of agents within the game [54]. Evolutionary game theory focuses more on the trend of changing strategies compared to classical game theory [55].
As a result, to explore power battery recycling in the green closed-loop supply chain research framework, choosing the evolutionary game model is the most feasible and appropriate course of action.
3.1. Game Model Assumptions
The strategy choice of each subject of battery recycling can be seen as an evolutionary game process. Therefore, this paper hypothesis three subjects: NEVMs, PBMs, and PBRs, and we assume that all three subjects are bounded rationality, as shown in Figure 2.
The model does not account for other players who may affect each side of the game. The parameter assumptions of this paper are shown in Table 1, Table 2 and Table 3.
- (a)
- NEVMs
The NEVMs select either of two strategies: “green” or “non-green”. “green” indicates that NEVMs actively participate in green power battery recycling and establish a green recycling network. “non-green” means that NEVMs are not involved in power battery recycling.
- (b)
- PBMs
The PBMs select either of two strategies: “green” or “non-green”. “green” means PBMs actively participate in green power battery recycling, actively cooperate with other manufacturers, buy back raw materials from battery recycling companies that meet national standards, etc. “non-green” means that PBMs are not involved in power battery recycling and choose low-priced metal materials.
- (c)
- PBRs
The PBRs also select either of two strategies: “green” or “non-green”. “green” means PBRs actively participate in green power battery recycling, strictly implement national regulations and industry standards, and dismantle the used power batteries. “non-green” means that PBRs dismantle power batteries in a non-environmentally friendly way to seek higher profits.
Considering the reality of power battery recycling, we also make the following assumptions:
- (d)
- We posit that the level of digital transformation for NEVMs, PBMs, and PBRs are , , and , and their fundamental benefits are , and , respectively.
- (e)
- Assume that the strategic risk cost of choosing green strategies for NEVMs, PBMs and PBRs, respectively, are , and . When both NEVMs and PBMs choose the green strategies, NEVMs pay assistance cost and PBMs pay technology cost . When both NEVMs and PBRs choose the green strategies, NEVMs pay assistance cost and PBRs pay technology cost .
- (f)
- When all three subjects choose green strategies, the supply chain generates additional benefits . The coefficients of benefits for each of the three are , , and , respectively. When only two subjects choose the green strategies, we consider the synergistic benefits generated and the distribution coefficient , as shown in Table 2.
Government rewards and penalties can influence the decision-making process and income of subjects [56]. Therefore, new parameters are introduced into the model, as shown in Table 3. Government rewards for the subject who chooses green strategies are , and the government penalties for the subject who chooses non-green strategies are .
3.2. Strategy Combinations and Payment Matrix
Table 4 displays the resulting strategy combinations and payoff matrix based on the aforementioned assumptions.
3.3. Replicator Dynamics Equations
According to the above results, the replication dynamic equations are established [57]. The expected benefits of NEVMs’ choosing green strategies and the expected benefits when they choose non-green strategies are obtained from . The average expected return is ().
This leads to the replication dynamic equation for the NEVMs to choose green strategies as:
Similarly, the expected benefits of PBMs’ choosing green strategies and the expected benefits when they choose non-green strategies are obtained from . The average expected return is (). The replication dynamics equation for PBMs choosing green strategies is:
The expected benefits of PBRs’ choosing green strategies and the expected benefits, when they choose non-green strategies, are obtained from . The average expected return is (). The replication dynamics equation for PBRs choosing green strategies is:
3.4. Tripartite Stability Analysis
According to Lyapunov’s indirect methodology [58,59], to further analyze the system stability, we introduce the Jacobi matrix of the evolutionary game.
As the game process evolves, based on the principle of stability of differential equations, the dynamic system tends to a stable state when the replicated dynamic equations of the three parties are equal to zero [60]. Combining Equations (1)–(3), let , eight equilibrium points can be obtained: , , , , , , , . Weibull demonstrated that the ESS for evolutionary games involving multiple populations (two or more) must be a pure strategic equilibrium and a strict Nash equilibrium [61]. As mixed strategic equilibrium cannot satisfy the requirements of strict Nash equilibrium, only pure strategic equilibrium points are selected for further discussion in this study. Then, the pure strategic equilibrium points ~ are incorporated into Formula (4). The results are listed in Table 5 after solving for the Jacobian matrix eigenvalues.
According to the judgment criteria of the equilibrium point in Lyapunov’s rule, [58,59], combined with the results in Table 5, all eight equilibrium points may be ESS, but in reality, we hope to evolve toward points . Therefore, the more the level of digital transformation of the subjects, the higher the government rewards, and the more severe the government penalties, the more conducive circumstances will be to power battery recycling.
4. Simulation and Analysis
The influence of various parameters on multi-party strategy selection needs to be reflected more directly. To illustrate the influence trend more intuitively between variables, we use Matlab2016b to conduct numerical simulations and set the variable parameters as reasonably as possible.
According to the way some scholars set their values [62,63] and research, simulation values are shown in Table 6:
4.1. Initial Evolutionary Paths Analysis
The parameters were set based on the initial conditions listed in Table 6. As a result, the system ultimately evolved to the steady state.
Figure 3 illustrates the initial evolutionary path.
Through the preliminary evolution path, we find that the numerical simulation results are consistent with the theoretical analysis. Secondly, the rate at which the three subjects converge decreases as their initial willingness to participate increases. Thirdly, the initial value change does not change the stability inequality of . Upon observation, it was found that regardless of the initial values, the system always evolved towards . Therefore, the stable state of evolution remains unchanged with changes in the initial values. This state can be explained by the fact that the current conditions make it challenging to achieve green recycling. The proper disposal of used power batteries poses is a major challenge. NEVMs and PBRs are more incentivized to prioritize the development of a green closed-loop supply chain, as the cost of their operations has increased. This has raised their awareness and willingness to pay more for power battery recycling.
4.2. Sensitivity Analysis
- (1)
- Sensitivity analysis of digital transformation degree
The simulation of is performed first. It is assumed that the average digital transformation of each agent is 1 and the probability of participating is 0.5.
Based on the information provided in Figure 4a, the decision-making of NEVMs and PBRs is sensitive to . Power battery makers’ decisions are less sensitive to . From Figure 4b,d, we can see that the decision-making of NEVMs is more sensitive to than that of PBRs.
The increased level of digital transformation has changed the direction of NEVMs and PBRs strategy choices while increasing the rate of convergence of gaming strategies to (green, green, green), which is a result we would like to see. One plausible explanation for the above state is that the higher the degree of digital transformation, the lower the expected cost of the subject’s participation, and thus the expected return of the participation is relatively high [64]. In this process, the digital transformation achievements of NEVMs, such as the establishment of cloud cooperation platforms, will promote the participation of all subjects.
- (2)
- Sensitivity analysis of additional benefits.
This section analyzes the impact of the additional benefits (, ) of power battery recycling.
As seen in Figure 5, the additional benefits promote the convergence of subjects’ choices towards “choosing green strategies”. The higher the added benefit, the faster the convergence. In this case, NEVMs, PBMs, and PBRs converge quickly to (green, green, green).
Based on , we vary the digitization level and get:
After we change the additional benefits, from Figure 6, digital transformation still contributes significantly to the convergence of NEVMs and PBRs. Therefore, we argue that green collaboration among subjects in power battery recycling facilitates the enhancement of additional benefits and thus influences the choice of subject strategies [64,65].
Overall, the additional benefits can drive the choice of green strategies by the subjects. In this process, digital transformation plays a positive moderating role.
- (3)
- Sensitivity analysis of government rewards and penalties.
Even though we know that government rewards and penalties can have some effect, it is still a question that needs to be explored as to which specific subjects receive rewards and penalties. The results of the simulation are as follows:
As can be seen from Figure 7a, NEVMs and PBRs are sensitive to government rewards. Government rewards for NEVMs or PBRs makers could give a positive boost. As shown in Figure 7c, for PBMs, the effect of government rewards is not as great as the other two agents. Therefore, subsidizing PBMs to promote power battery recycling has limited effectiveness. Figure 8 illustrates that government penalties also have a significant effect on the decisions of NEVMs and PBRs. Government penalties could facilitate the evolution of NEVMs and PBRs toward choosing green strategies. Therefore, whether the government rewards or penalizes, both NEVMs, and PBRs, especially NEVMs, are the objects that the government or regulatory agencies should consider.
- (4)
- Other Parameters Simulation
If PBRs want to disassemble batteries more efficiently and completely, they need to invest more funds into the research and development of equipment and disassembling technology. From Figure 9, we find that when the cost of technology upgrades for recycling and dismantling enterprises is continuously reduced, the power battery recycling enterprises will switch from non-green strategies to green strategies. High technical input costs will make enterprises hesitant to participate in power battery recycling. Similarly, we can simulate any parameter, and the results are consistent with the theory. However, due to space limitations, we will not repeat the details.
5. Conclusions and Implications
5.1. Conclusions
Based on the incomplete information and limited rationality of each subject, this study explores the power battery recycling problem. Distinguished from other studies that consider the government or consumers as important recycling subjects [17,18,19,50], this study establishes an evolutionary model, which involves three subjects: NEVMs, PBMs, and PBRs, aiming to explore the formation of the green closed-loop supply chain for power batteries. Next, based on the stability analysis, we conducted simulation analyses by using Matlab2016b software to investigate the effects of digital transformation, additional benefits, and government rewards and penalties on the strategy choice of the three subjects. The influence mechanism and evolutionary trajectory of the three subjects were deduced and solved. The key conclusions of this study are:
Firstly, with the assumption that all subjects in the game are finitely rational, all subjects are aiming at maximizing their interests. The final result is that neither NEVMs nor PMRs will adopt green recycling strategies. As can be seen, in power battery recycling that lacks sufficient incentives and constraints, most enterprises tend to adopt non-green strategies, and the final result will inevitably lead to the inability to form a green closed-loop supply chain, which seriously affects the sustainability of the environment and resources.
Secondly, the digital transformation of each subject can potentially enlarge the effect of benefits on decision-making, which provides a new research direction for power battery recycling. As the level of digitization of the subject increases, the convergence of the subject’s decision toward “choosing green strategies” accelerates. At the same time, the increase in additional benefits can drive the evolution of the subject’s behavior in the direction of “green”, and digital transformation can amplify this effect, which can lead to an eco-friendlier green closed-loop supply chain.
Finally, government rewards and penalties can influence the strategic decisions made by power battery recycling subjects. With the strengthening of government rewards and penalties, the strategy of some subjects in the reverse supply chain has shifted from “non-green” to “green”, which has greatly promoted the formation of a green closed-loop supply chain. The NEVMs are the most sensitive to changes in government rewards and penalties and should be the main target of government subsidies and regulation. Meanwhile, technology input cost is also an important factor. Due to the consideration of investment risk and return rate, the high cost will make it difficult for PBRs to choose green strategies.
5.2. Implications
The results and conclusions from this paper led to several proposed management implications.
Firstly, power battery recycling is a key part of the green closed-loop supply chain. The profits of new energy vehicles are mainly concentrated on the sales process, resulting in people’s attention being on top of production and sales. To promote the formation of the green closed-loop supply chain, we should pay more attention to power battery recycling to achieve the closed-loop from production to sales, to recycling and reproduction. Strategies such as battery coding and responsibility tracing can be adopted in the industry to clarify the main responsibility of power battery recycling. Power battery buyback contracts can also be signed with consumers in the sales process to ensure that used power batteries are properly disposed of.
Secondly, the corporate profits of all subjects involved in the green closed-loop supply chain, especially the whole life cycle profits, must be protected to promote more companies to choose green strategies in the battery recycling process. Meanwhile, as digital transformation can amplify the benefit-driven effect, NEVMs, PBMs, and PBRs need to seize the opportunities brought by digitalization, accelerate transformation efforts, strengthen cooperation, enhance corporate efficiency, and promote harmonious economic and environmental development. In addition, the government should provide technical support and professional advice on green technologies for PBRs to reduce the cost and risk of choosing green strategies for enterprises.
Thirdly, one way for government and regulatory agencies to incentivize power battery recycling is to build a system of reasonable rewards and penalties. NEVMs and PBRs should be the main targets of government policies. Reward and penalty policies that are set too high or too low can be detrimental to the achievement of effective green power battery recycling. When rewards and penalties policies are too high, they may create unintended consequences such as corruption and cheating to meet the targets. On the other hand, when rewards and penalties policies are too low, they may fail to generate enough incentive for companies to make the necessary investments in green power battery recycling technologies and infrastructure. As such, government or regulatory agencies must devise appropriate guidelines to ensure that rewards and penalties are reasonable and effective in encouraging sustainable recycling practices. For example, government or regulatory agencies could provide support for companies’ technological innovation. Meanwhile, the government can offer subsidies based on the subjects’ performance in meeting specific recycling targets, such as the percentage of batteries recycled [66].
Finally, the NEVMs are strong promoters of power battery recycling, in line with the “Measure’s requirements”. NEVMs are at the forefront of digital transformation and should take on greater responsibilities in this area. They must be proactive in their efforts toward driving power battery recycling. Given their role as creators of the allocation mechanism and primary beneficiaries of collaboration in the green closed-loop supply chain, NEVMs should play a leading role in developing recycling systems and promoting power battery recycling. In this process, government policies and financial support will also play an important role. Therefore, they should take more action, and the government should give them more support and policy help at this time.
5.3. Limitations
We acknowledge that basic model assumptions have some significant limitations, which could open up new research directions in the future. This paper only focuses on analyzing NEVMs, PBMs, and PBRs as subjects in the context of power battery recycling. There are many other subjects that we did not add to our model. Secondly, this paper is analyzed under the framework of a static game, but in reality, power battery recycling is a lengthy and repetitive game process. Finally, the test of the model is not combined with data from real companies. Therefore, future research could focus on the following three areas: first, the inclusion of other subjects, such as consumers, when constructing the evolutionary game model; second, an analysis of strategy selection of players in long-term repeated games under incomplete information; and third, the combination of theoretical findings and empirical research to test the replicability of our results.
Author Contributions
Conceptualization, G.L. and M.L.; methodology, M.L.; software, M.L.; validation, G.L. and M.L.; formal analysis, G.L.; investigation, G.L.; resources, G.L.; data curation, M.L.; writing—original draft preparation, G.L. and M.L.; writing—review and editing, G.L., M.L., S.L. and Y.L.; visualization, M.L.; supervision, G.L.; project administration, G.L.; funding acquisition, Y.L. All authors have read and agreed to the published version of the manuscript.
Funding
This work was supported by the “National Social Science Fund” of China [NO. 22BGL010].
Institutional Review Board Statement
Not applicable.
Informed Consent Statement
Not applicable.
Data Availability Statement
The data presented in this study are available on request from the corresponding author.
Conflicts of Interest
The authors declare no conflict of interest.
References
- China’s New Energy Vehicle Holdings Reached 13.1 Million Units, Showing Rapid Growth. Available online: https://www.gov.cn/xinwen/2023-01/11/content_5736281.htm (accessed on 11 January 2023).
- Dqa, B.; Gw, B.; Tg, B.; Bw, B.; Tao, D.B. Potential impact of the end-of-life batteries recycling of electric vehicles on lithium demand in China: 2010–2050. Sci. Total Environ. 2020, 764, 142835. [Google Scholar] [CrossRef]
- Richa, K.; Babbitt, C.W.; Gaustad, G.; Xue, W. A future perspective on lithium-ion battery waste flows from electric vehicles. Resour. Conserv. Recycl. 2014, 83, 63–76. [Google Scholar] [CrossRef]
- Huang, Z.; Zhu, J.; Qiu, R.; Ruan, J.; Qiu, R. A cleaner and energy-saving technology of vacuum step-by-step reduction for recovering cobalt and nickel from spent lithium-ion batteries. J. Clean. Prod. 2019, 229, 1148–1157. [Google Scholar] [CrossRef]
- Zhu, J.; Mathews, I.; Ren, D.; Li, W.; Bazant, M.Z. End-of-life or second-life options for retired electric vehicle batteries. Cell Rep. Phys. Sci. 2021, 2, 100537. [Google Scholar] [CrossRef]
- Meng, K.; Xu, G.; Peng, X.; Youcef-Toumi, K.; Li, J. Intelligent disassembly of electric-vehicle batteries: A forward-looking overview. Resour. Conserv. Recycl. 2022, 182, 106207. [Google Scholar] [CrossRef]
- Berman, S.J. Digital transformation: Opportunities to create new business models. Strategy Leadersh. 2012, 40, 16–24. [Google Scholar] [CrossRef]
- Zhu, G.; He, X. Disassembly and Step Utilization of Waste Lithium Ion Power Battery. Adv. Mater. Ind. 2017, 9, 43–46. [Google Scholar] [CrossRef]
- Wei, M. Consider Reverse Recovery of Power Battery for Step Utilization. China Storage Transp. 2021, 6, 178–179. [Google Scholar] [CrossRef]
- Li, J.; Wang, Z.; Xu, D.; Liu, D. A Comparative Analysis of Relevant Policies is Made on Retired Power Batteries. Mod. Electr. Power 2021, 38, 316–324. [Google Scholar] [CrossRef]
- Li, Y.; Lan, T. Research on vehicle power battery recovery and step utilization. Stand. Qual. Light Ind. 2020, 2, 116–119. [Google Scholar] [CrossRef]
- Li, Y.; Zhou, W.; Huang, Y. The ldea of Establishment New Energy Automotive Battery Recycling System. Resour. Recycl. 2012, 1, 28–30. [Google Scholar]
- Jiao, N.; Evans, S. Business Models for Sustainability: The Case of Second-life Electric Vehicle Batteries. Procedia CIRP 2016, 40, 250–255. [Google Scholar] [CrossRef] [Green Version]
- Ma, Y. EPR Government Power Battery Manufacturer and Consumer Three Party Evolutionary Game Analysis. Logist. Eng. Manag. 2018, 40, 132–135. [Google Scholar]
- Zhang, S.; Zhang, M.; Yu, X.; Hao, R. What keeps Chinese from recycling: Accessibility of recycling facilities and the behavior. Resour. Conserv. Recycl. 2016, 109, 176–186. [Google Scholar] [CrossRef]
- Shen, Y.; Song, Z.; Gao, T.; Ma, J. Research on Closed-Loop Supply Chain Decision Making of Power Battery Considering Subsidy Transfer under EPR System. Sustainability 2022, 14, 2488. [Google Scholar] [CrossRef]
- Mitra, S.; Webster, S. Competition in remanufacturing and the effects of government subsidies. Int. J. Prod. Econ. 2008, 111, 287–298. [Google Scholar] [CrossRef]
- Ravi, V.; Shankar, R.; Tiwari, M.K. Analyzing alternatives in reverse logistics for end-of-life computers: ANP and balanced scorecard approach. Comput. Ind. Eng. 2005, 48, 327–356. [Google Scholar] [CrossRef]
- Tang, Y.; Zhang, Q.; Liu, B.; Li, Y.; Ni, R.; Wang, Y. What influences residents’ intention to participate in the electric vehicle battery recycling? Evidence from China. Energy 2023, 276, 127563. [Google Scholar] [CrossRef]
- Wang, X.; Li, J. Endogenous Selection of Enterprise Waste Treatment Model under EPR System. Chin. J. Manag. 2019, 16, 728–735. [Google Scholar]
- Qiao, F. Recycle Mode Choice of Waste Pure Electric Vehicle Power Battery Based On Game Theory. Master’s Thesis, Beijing Jiaotong University, Beijing, China, 2015. [Google Scholar]
- Tang, Y.; Zhang, Q.; Li, Y.; Wang, G.; Li, Y. Recycling Mechanisms and Policy Suggestions for Spent Electric Vehicles’ Power Battery -A Case of Beijing. J. Clean. Prod. 2018, 186, 388–406. [Google Scholar] [CrossRef]
- Zheng, C.; Zhang, H.; Guo, D.; Wang, J.; Li, C. AnyLogic—Based simulation of recovery model for lithium battery of the electric vehicle. J. Shandong Univ. Technol. (Nat. Sci. Ed.) 2019, 33, 25–28. [Google Scholar] [CrossRef]
- Liu, J.; Ma, J. Research on Reverse Subsidy Mechanism of Power Battery Closed-loop Supply Chain Considering Cascade Utilization. Ind. Eng. Manag. 2021, 26, 80–88. [Google Scholar] [CrossRef]
- Wieland, A. Dancing the Supply Chain: Toward Transformative Supply Chain Management. J. Supply Chain Manag. 2021, 57, 58–73. [Google Scholar] [CrossRef]
- Savaskan, R.C. Management of closed-loop supply chains for recoverable products. Northwestern University: Evanston, IL, USA, 2000. [Google Scholar]
- Rybaczewska-Baejowska, M.; Masternak-Janus, A. Assessing and Improving the Eco-Efficiency of Manufacturing: Learning and Challenges from a Polish Case Study. Energies 2021, 14, 8125. [Google Scholar] [CrossRef]
- Handfield, R.B.; Walton, S.V.; Goizueta, R.C.; Seegers, L.K.; Melnyk, S.A. ‘Green’ supply chain: Best practices from the furniture industry. J. Oper. Manag. 1997, 15, 293–315. [Google Scholar] [CrossRef]
- Savaskan, R.C.; Bhattacharya, S.; Wassenhove, L. Closed-Loop Supply Chain Models with Product Remanufacturing. Manag. Sci. 2004, 50, 239–252. [Google Scholar] [CrossRef] [Green Version]
- Yao, M.; Teng, C. Decision models for closed-loop supply chain with two competingretailers considering fairness concerns. Comput. Integr. Manuf. Syst. 2017, 23, 1731–1738. [Google Scholar] [CrossRef]
- YU, Y. Comparative Study on E-waste Recycling Model Based on System Dynamics. Master’s Thesis, Beijing Jiaotong University, Beijing, China, 2019. [Google Scholar]
- Huang, Z.; Nei, J.; Zhao, Y. The cooperation recovery strategies across the closed-loop supply chain. J. Ind. Eng. Eng. Manag. 2019, 33, 147–152. [Google Scholar] [CrossRef]
- Zu-Jun, M.; Zhang, N.; Dai, Y.; Hu, S. Managing channel profits of different cooperative models in closed-loop supply chains. Omega 2016, 59, 251–262. [Google Scholar] [CrossRef]
- Zhang, P.; Yu, L.; Xiong, Z. Designing Contracts for A Closed-loop Supply Chain with Information Asymmetry under the Government’s Reward-penalty Mechanism. Chin. J. Manag. Sci. 2020, 28, 89–100. [Google Scholar] [CrossRef]
- Heydari, J.; Govindan, K.; Jafari, A. Reverse and closed loop supply chain coordination by considering government role. Transp. Res. Part D Transp. Environ. 2017, 52, 379–398. [Google Scholar] [CrossRef]
- Zhang, Z.; Guo, M.; Yang, W. Analysis of NEV Power Battery Recycling under Different Government Reward-Penalty. Sustainability 2022, 14, 538. [Google Scholar] [CrossRef]
- Li, X.; Du, J.; Cheng, Y.; Hanif, S.; Mu, D.; Cui, Y. Electric vehicle battery recycling: System dynamics game based analysis for the influencing factors. Environ. Eng. Manag. J. 2019, 18, 1123–1136. [Google Scholar] [CrossRef]
- Wang, W.; Da, Q. The Decision-Making Model of the Electronic Product Manufacturer about Collection and Remanufacturing based on Premium and Penalty Mechanism. Chin. J. Manag. Sci. 2008, 16, 57–63. [Google Scholar]
- Stank, T.; Esper, T.; Goldsby, T.J.; Zinn, W.; Autry, C. Toward a Digitally Dominant Paradigm for twenty-first century supply chain scholarship. Int. J. Phys. Distrib. Logist. Manag. 2019, 49, 917–956. [Google Scholar] [CrossRef]
- Fitzgerald, M.; Kruschwitz, N.; Bonnet, D.; Welch, M. Embracing Digital Technology: A New Strategic Imperative. MIT Sloan Manag. Rev. 2014, 55, 1. [Google Scholar]
- Reis, J.C.G.d.; Amorim, M.P.C.; Melão, N.F.R.; Matos, P.S.L. Digital Transformation: A Literature Review and Guidelines for Future Research. In Proceedings of the Trends and Advances in Information Systems and Technologies, Naples, Italy, 27–29 March 2018; pp. 411–421. [Google Scholar]
- Bai, P.; Yu, L. Digital Economy Development and Firms’ Markup: Theoretical Mechanisms and Empirical Facts. China Ind. Econ. 2021, 11, 59–77. [Google Scholar] [CrossRef]
- Wena, H.; Wen, C.; Leea, C.-C. Impact of digitalization and environmental regulation on total factor productivity. Inf. Econ. Policy 2022, 61, 101007. [Google Scholar] [CrossRef]
- Gaglio, C.; Kraemer-Mbula, E.; Lorenz, E. The effects of digital transformation on innovation and productivity: Firm-level evidence of South African manufacturing micro and small enterprises. Technol. Forecast. Soc. Change 2022, 182, 121785. [Google Scholar] [CrossRef]
- Kim, D.H.; Kim, D.H. A system dynamics model for a mixed-strategy game between police and driver. Syst. Dyn. Rev. 1997, 13, 33–52. [Google Scholar] [CrossRef]
- Xu, L.; Li, S.; Zheng, J. Cooperation Mechanism of E-waste Recycling in “nternet + Recycling Environment Based on Evolutionary Game. Oper. Res. Manag. Sci. 2018, 27, 87–98. [Google Scholar]
- Wang, Z.; Wang, Q.; Chen, B.; Wang, Y. Evolutionary game analysis on behavioral strategies of multiple stakeholders in E-waste recycling industry. Resour. Conserv. Recycl. 2020, 155, 104618. [Google Scholar] [CrossRef]
- Li, B.; Wang, Q.; Chen, B.; Sun, T.; Wang, Z.; Cheng, Y. Tripartite evolutionary game analysis of governance mechanism in Chinese WEEE recycling industry. Comput. Ind. Eng. 2022, 167, 108045. [Google Scholar] [CrossRef]
- Wang, M.; Liu, C.; Zhong, Y. Research on Investment Model Selection of Power Battery Recyclers Based on Evolutionary Game. Ind. Eng. Manag. 2021, 26, 161–170. [Google Scholar] [CrossRef]
- Zhang, H.M.; Zhu, K.X.; Hang, Z.X.; Zhou, D.; Zhou, Y.; Xu, Z. Waste battery-to-reutilization decisions under government subsidies: An evolutionary game approach. Energy 2022, 259, 124835. [Google Scholar] [CrossRef]
- He, L.; Sun, B. Exploring the EPR system for power battery recycling from a supply-side perspective: An evolutionary game analysis. Waste Manag. 2022, 140, 204–212. [Google Scholar] [CrossRef] [PubMed]
- Huo, L.; Shao, Y.; Lin, X. Research on recovery strategies in remanufaction close-oop supply chain based on evolutionary game perspective. Appl. Res. Comput. 2018, 35, 727–732. [Google Scholar]
- Zhang, J.; Wen, S.; Lv, X.; Sun, T. Evolutionary Game Analysis of Closed-Loop Supply Chain under the Background of Low-Carbon Economy. Ind. Eng. Manag. 2023, 3, 1–14. Available online: https://kns.cnki.net/kcms/detail/31.1738.T.20230324.1009.002.html (accessed on 1 May 2023).
- Smith, J.; Price, G.R. The logic of animal conflict. Nature 1973, 246, 15–18. [Google Scholar] [CrossRef]
- Easley, D.; Kleinberg, J. Networks, Crowds, and Markets: Reasoning about a Highly Connected World; Cambridge University Press: Cambridge, UK, 2010. [Google Scholar]
- Chen, C.K.; ‘Ulya, M.A. Analyses of the reward-penalty mechanism in green closed-loop supply chains with product remanufacturing. Int. J. Prod. Econ. 2019, 210, 211–223. [Google Scholar] [CrossRef]
- Cressman, R.; Tao, Y. The replicator equation and other game dynamics. Proc. Natl. Acad. Sci. USA 2014, 111, 10810–10817. [Google Scholar] [CrossRef]
- Waldner, F.; Klages, R. Symmetric Jacobian for local Lyapunov exponents and Lyapunov stability analysis revisited. Chaos Solitons Fractals 2012, 45, 325–340. [Google Scholar] [CrossRef] [Green Version]
- Yang, Y.; Yang, W.; Chen, H.; Li, Y. China’s energy whistleblowing and energy supervision policy: An evolutionary game perspective. Energy 2020, 213, 118774. [Google Scholar] [CrossRef]
- Ma, B.; Jiang, X. Stability analysis of the three-group 2 × 2 × 2 asymmetric evolutionary game. Oper. Res. Manag. Sci. 2022, 31, 38–45. [Google Scholar]
- Weibull, J.W. Evolutionary Game Theory; MIT Press: Cambridge, MA, USA, 1997. [Google Scholar]
- He, X. Evolutionary Game Study of Power Battery Recycling Decision Based on Closed-loop Supply Chain. Master’s Thesis, Jiangxi University of Science and Technology, Ganzhou, China, 2021. [Google Scholar]
- Wei, L.; Wang, C. Regulatory Strategies of New Energy Vehicle Powzer Battery Recycling Based on SD Evolutionary Game. J. Syst. Sci. Math. Sci. 2023, 5, 1–17. Available online: https://kns.cnki.net/kcms/detail//11.2019.o1.20230111.1326.010.html (accessed on 31 May 2023).
- Zhang, Y.; Ma, X.; Pang, J.; Xing, H.; Wang, J. The impact of digital transformation of manufacturing on corporate performance —The mediating effect of business model innovation and the moderating effect of innovation capability. Res. Int. Bus. Financ. 2023, 64, 101890. [Google Scholar] [CrossRef]
- Pedro, F.; Arnaldo, C. How to boost green innovation and performance through collaboration in the supply chain: Insights into a more sustainable economy. J. Clean. Prod. 2022, 359, 132005. [Google Scholar] [CrossRef]
- Zhang, M.; Wu, W.; Song, Y. Study on the impact of government policies on power battery recycling under different recycling models. J. Clean. Prod. 2023, 413, 137492. [Google Scholar] [CrossRef]
Figure 1.
The amount of lithium battery recycling in China, 2018–2022. Data source: China YiWei Institute of Economics (http://www.evtank.cn/) (accessed on 31 May 2023).
Figure 1.
The amount of lithium battery recycling in China, 2018–2022. Data source: China YiWei Institute of Economics (http://www.evtank.cn/) (accessed on 31 May 2023).
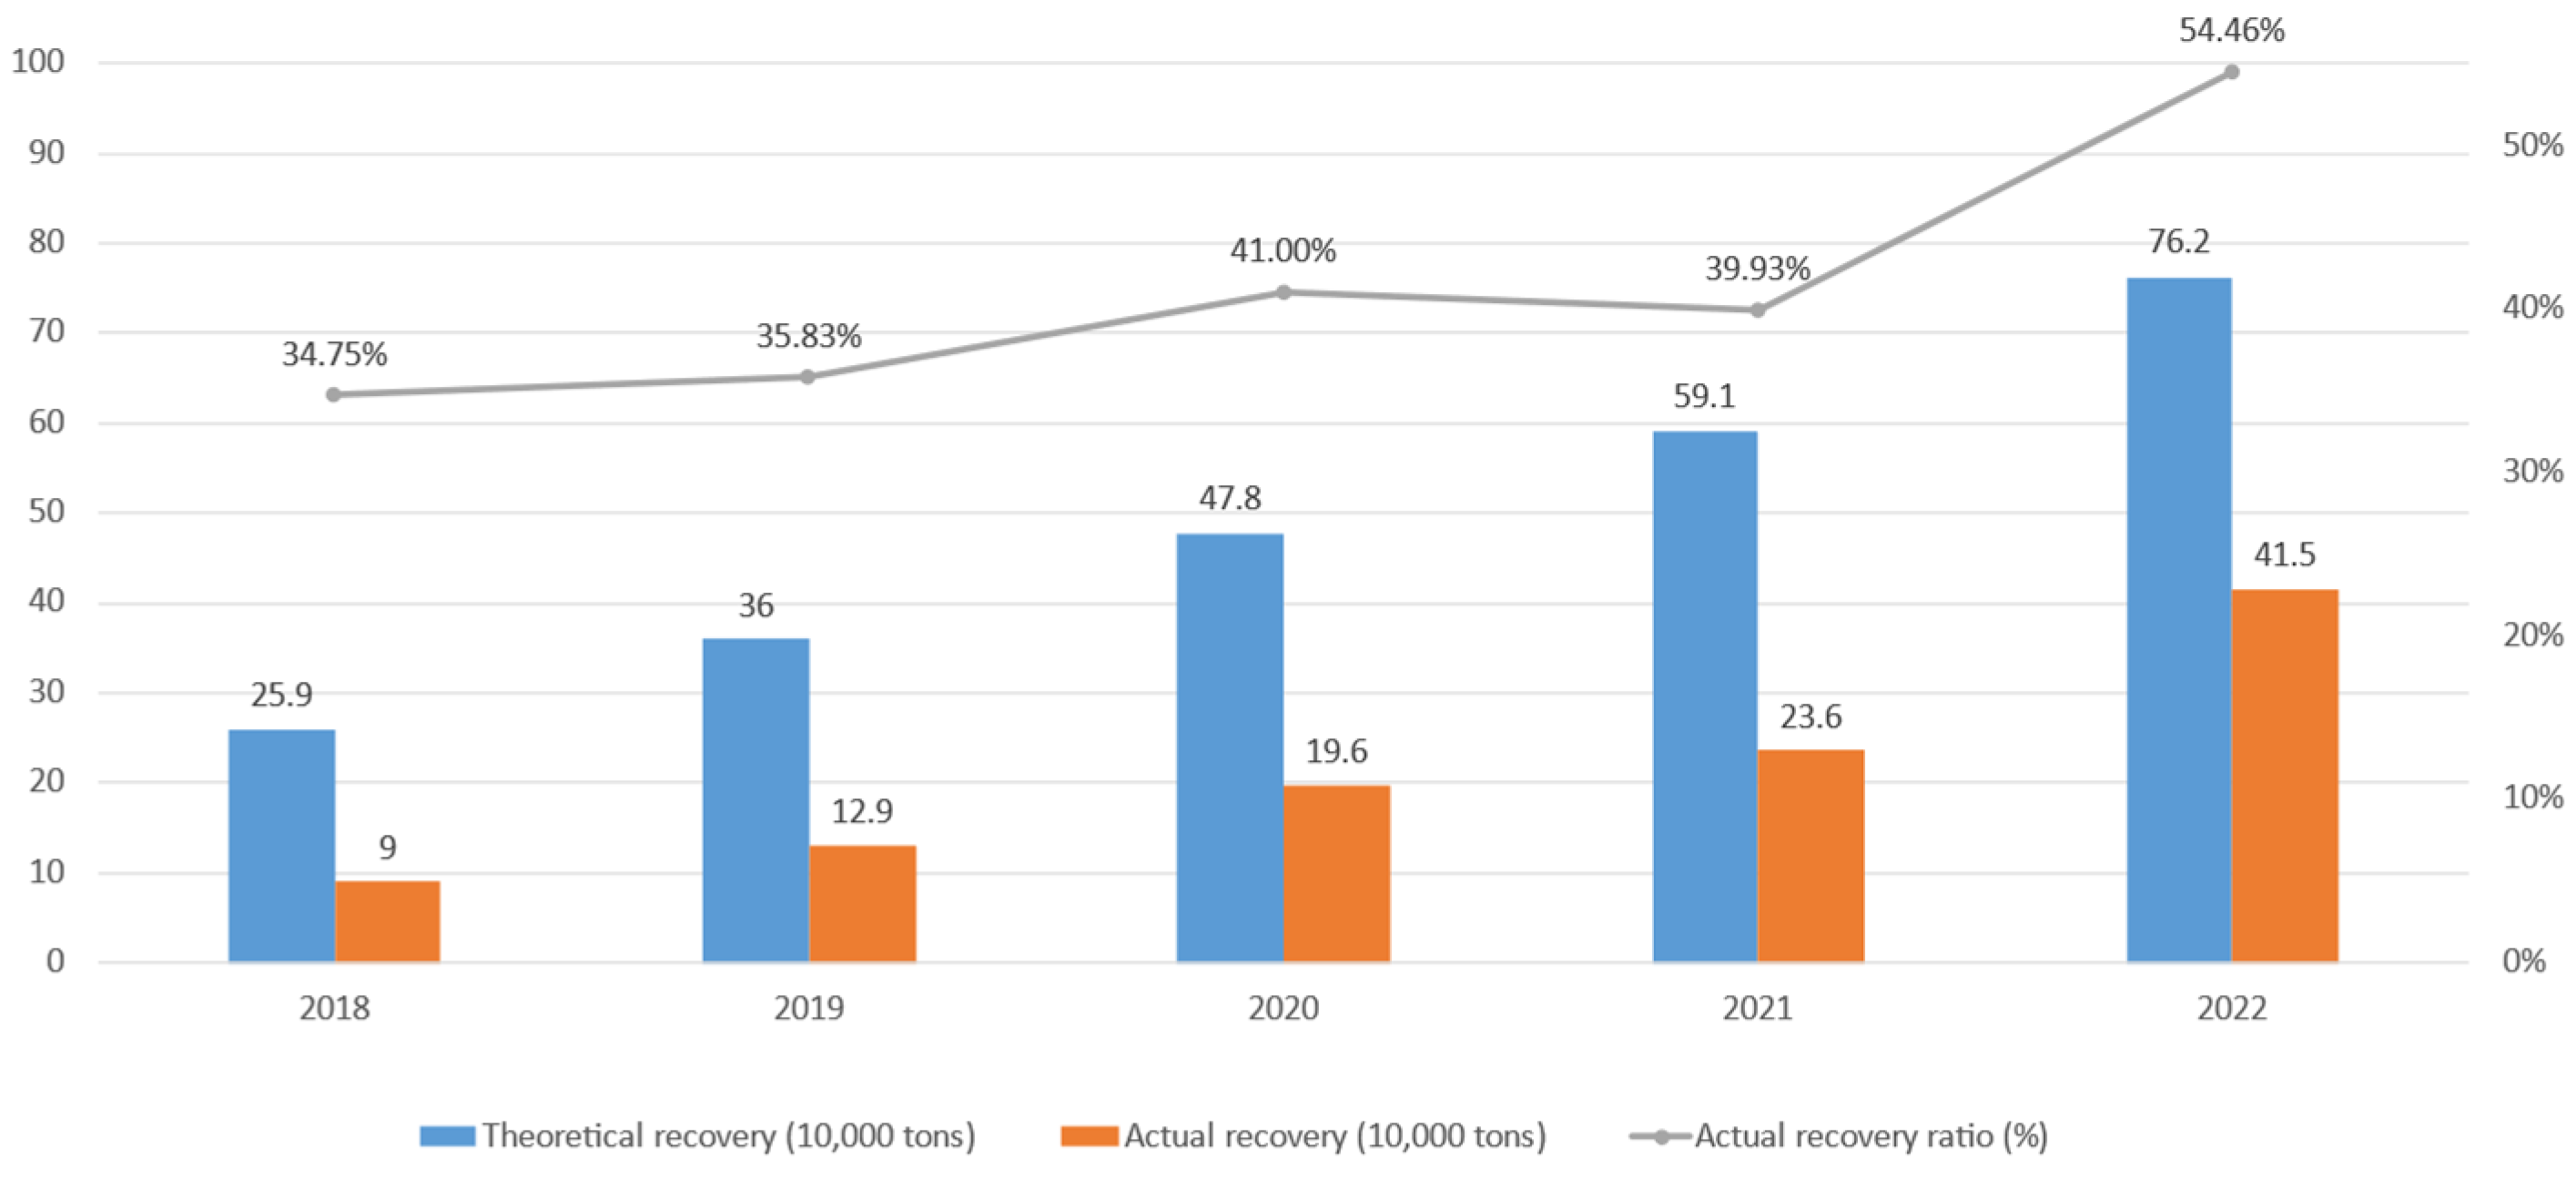
Figure 2.
Power battery recycling process chart.
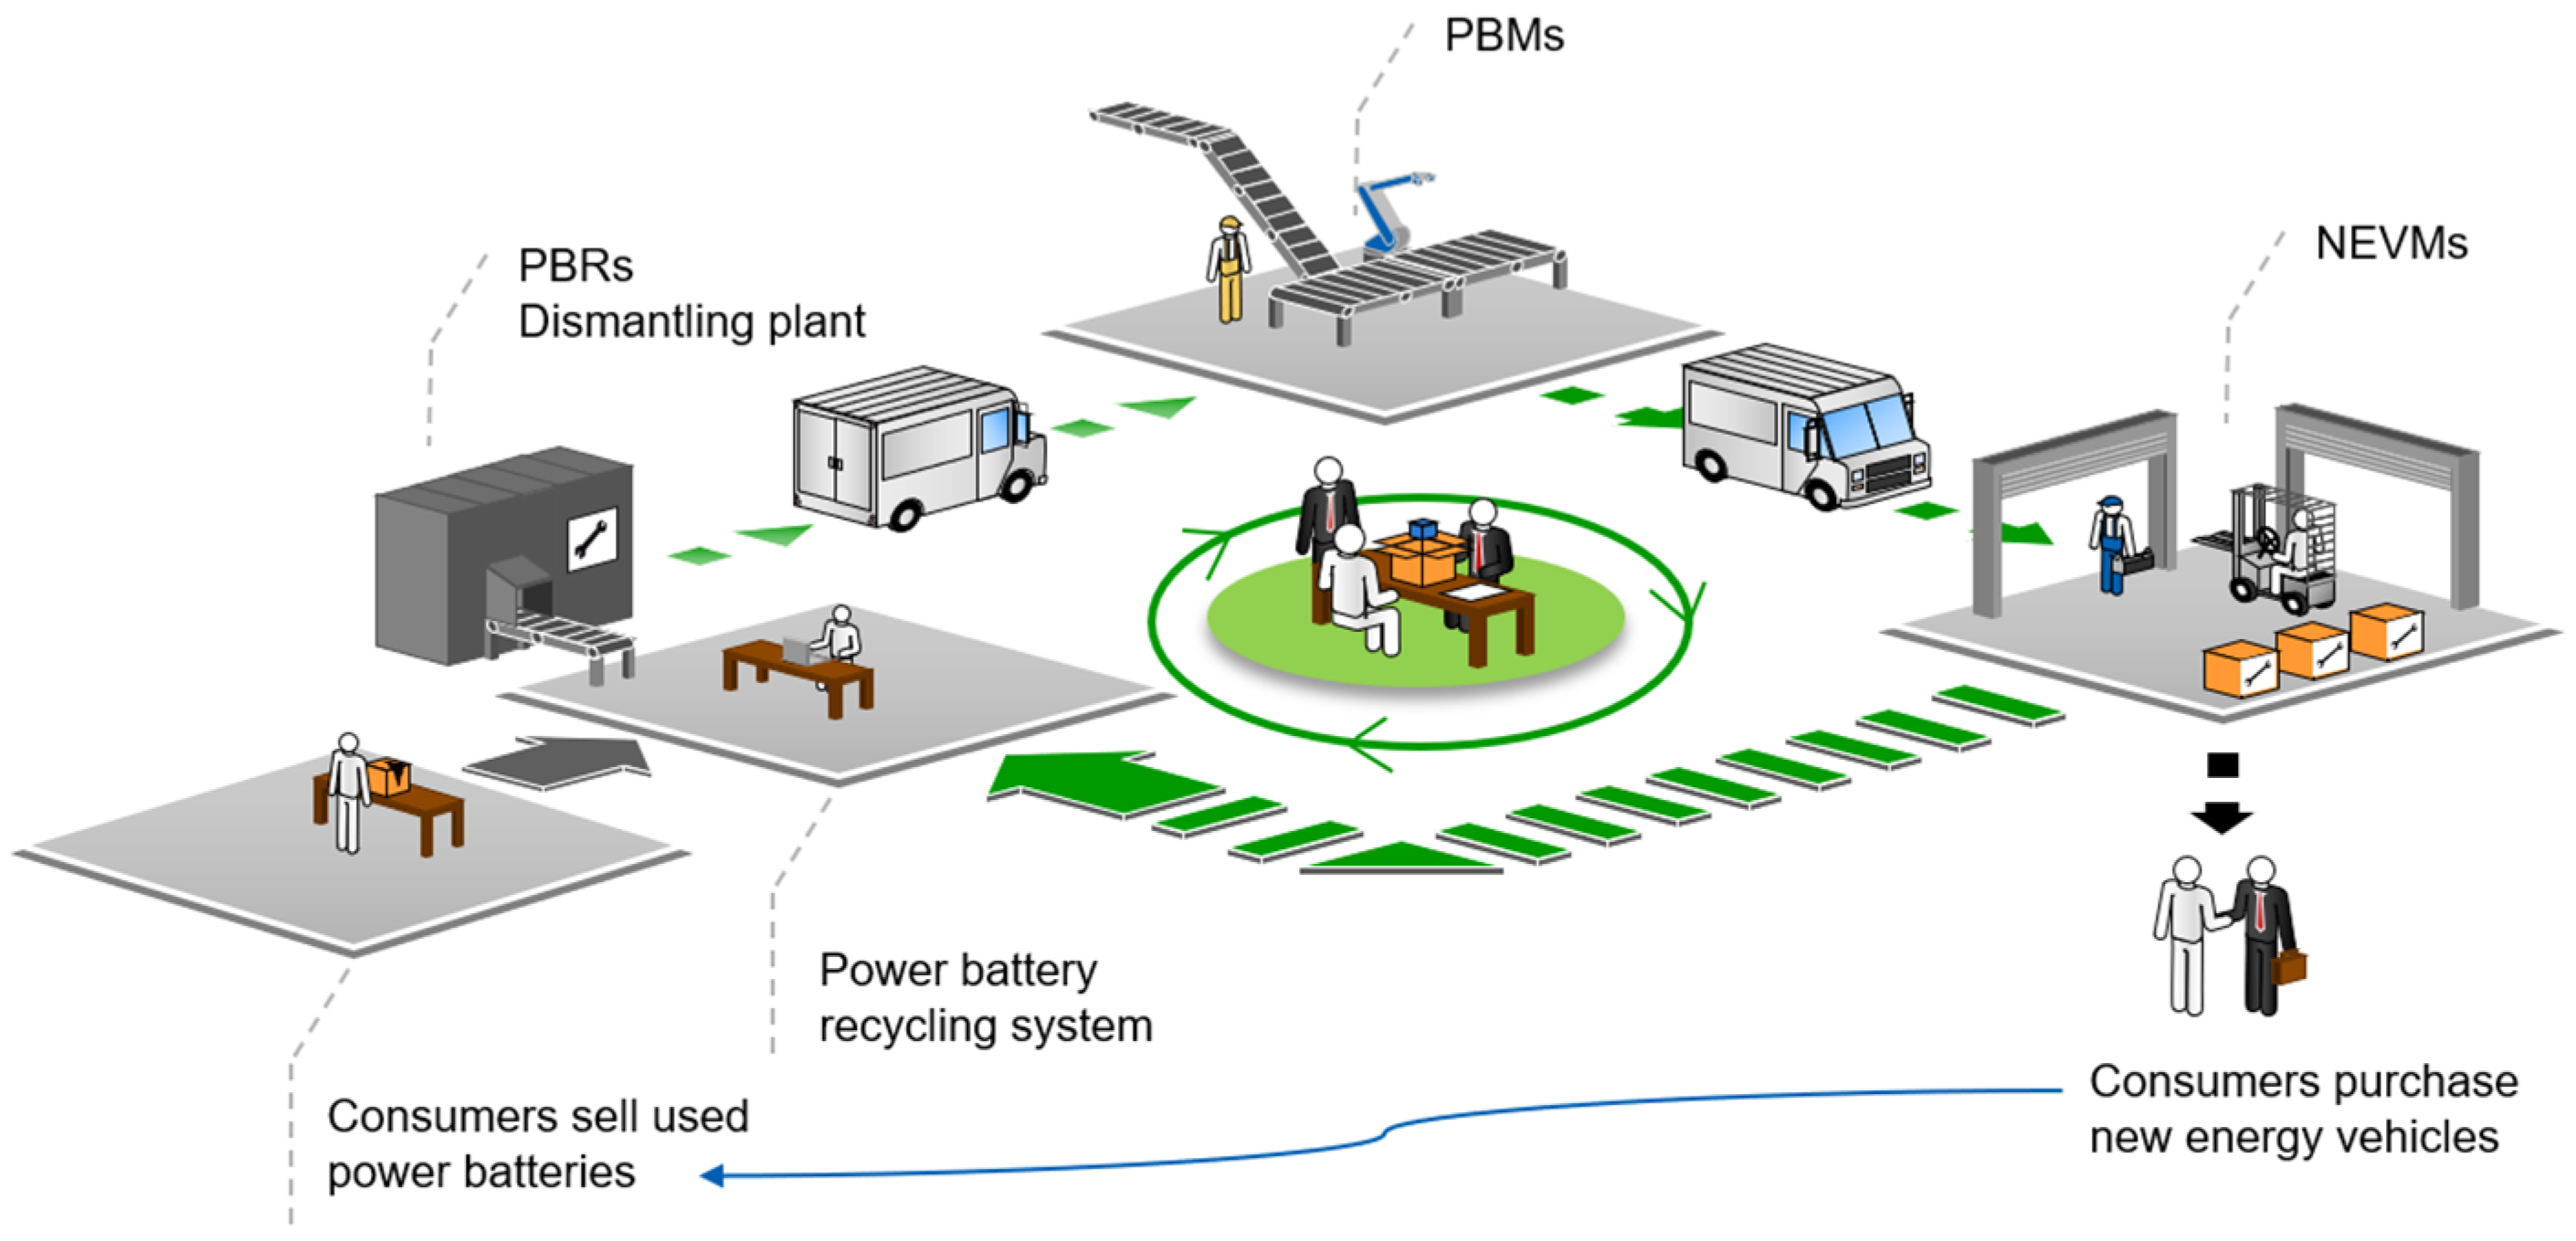
Figure 3.
Initial evolution paths. Different color.
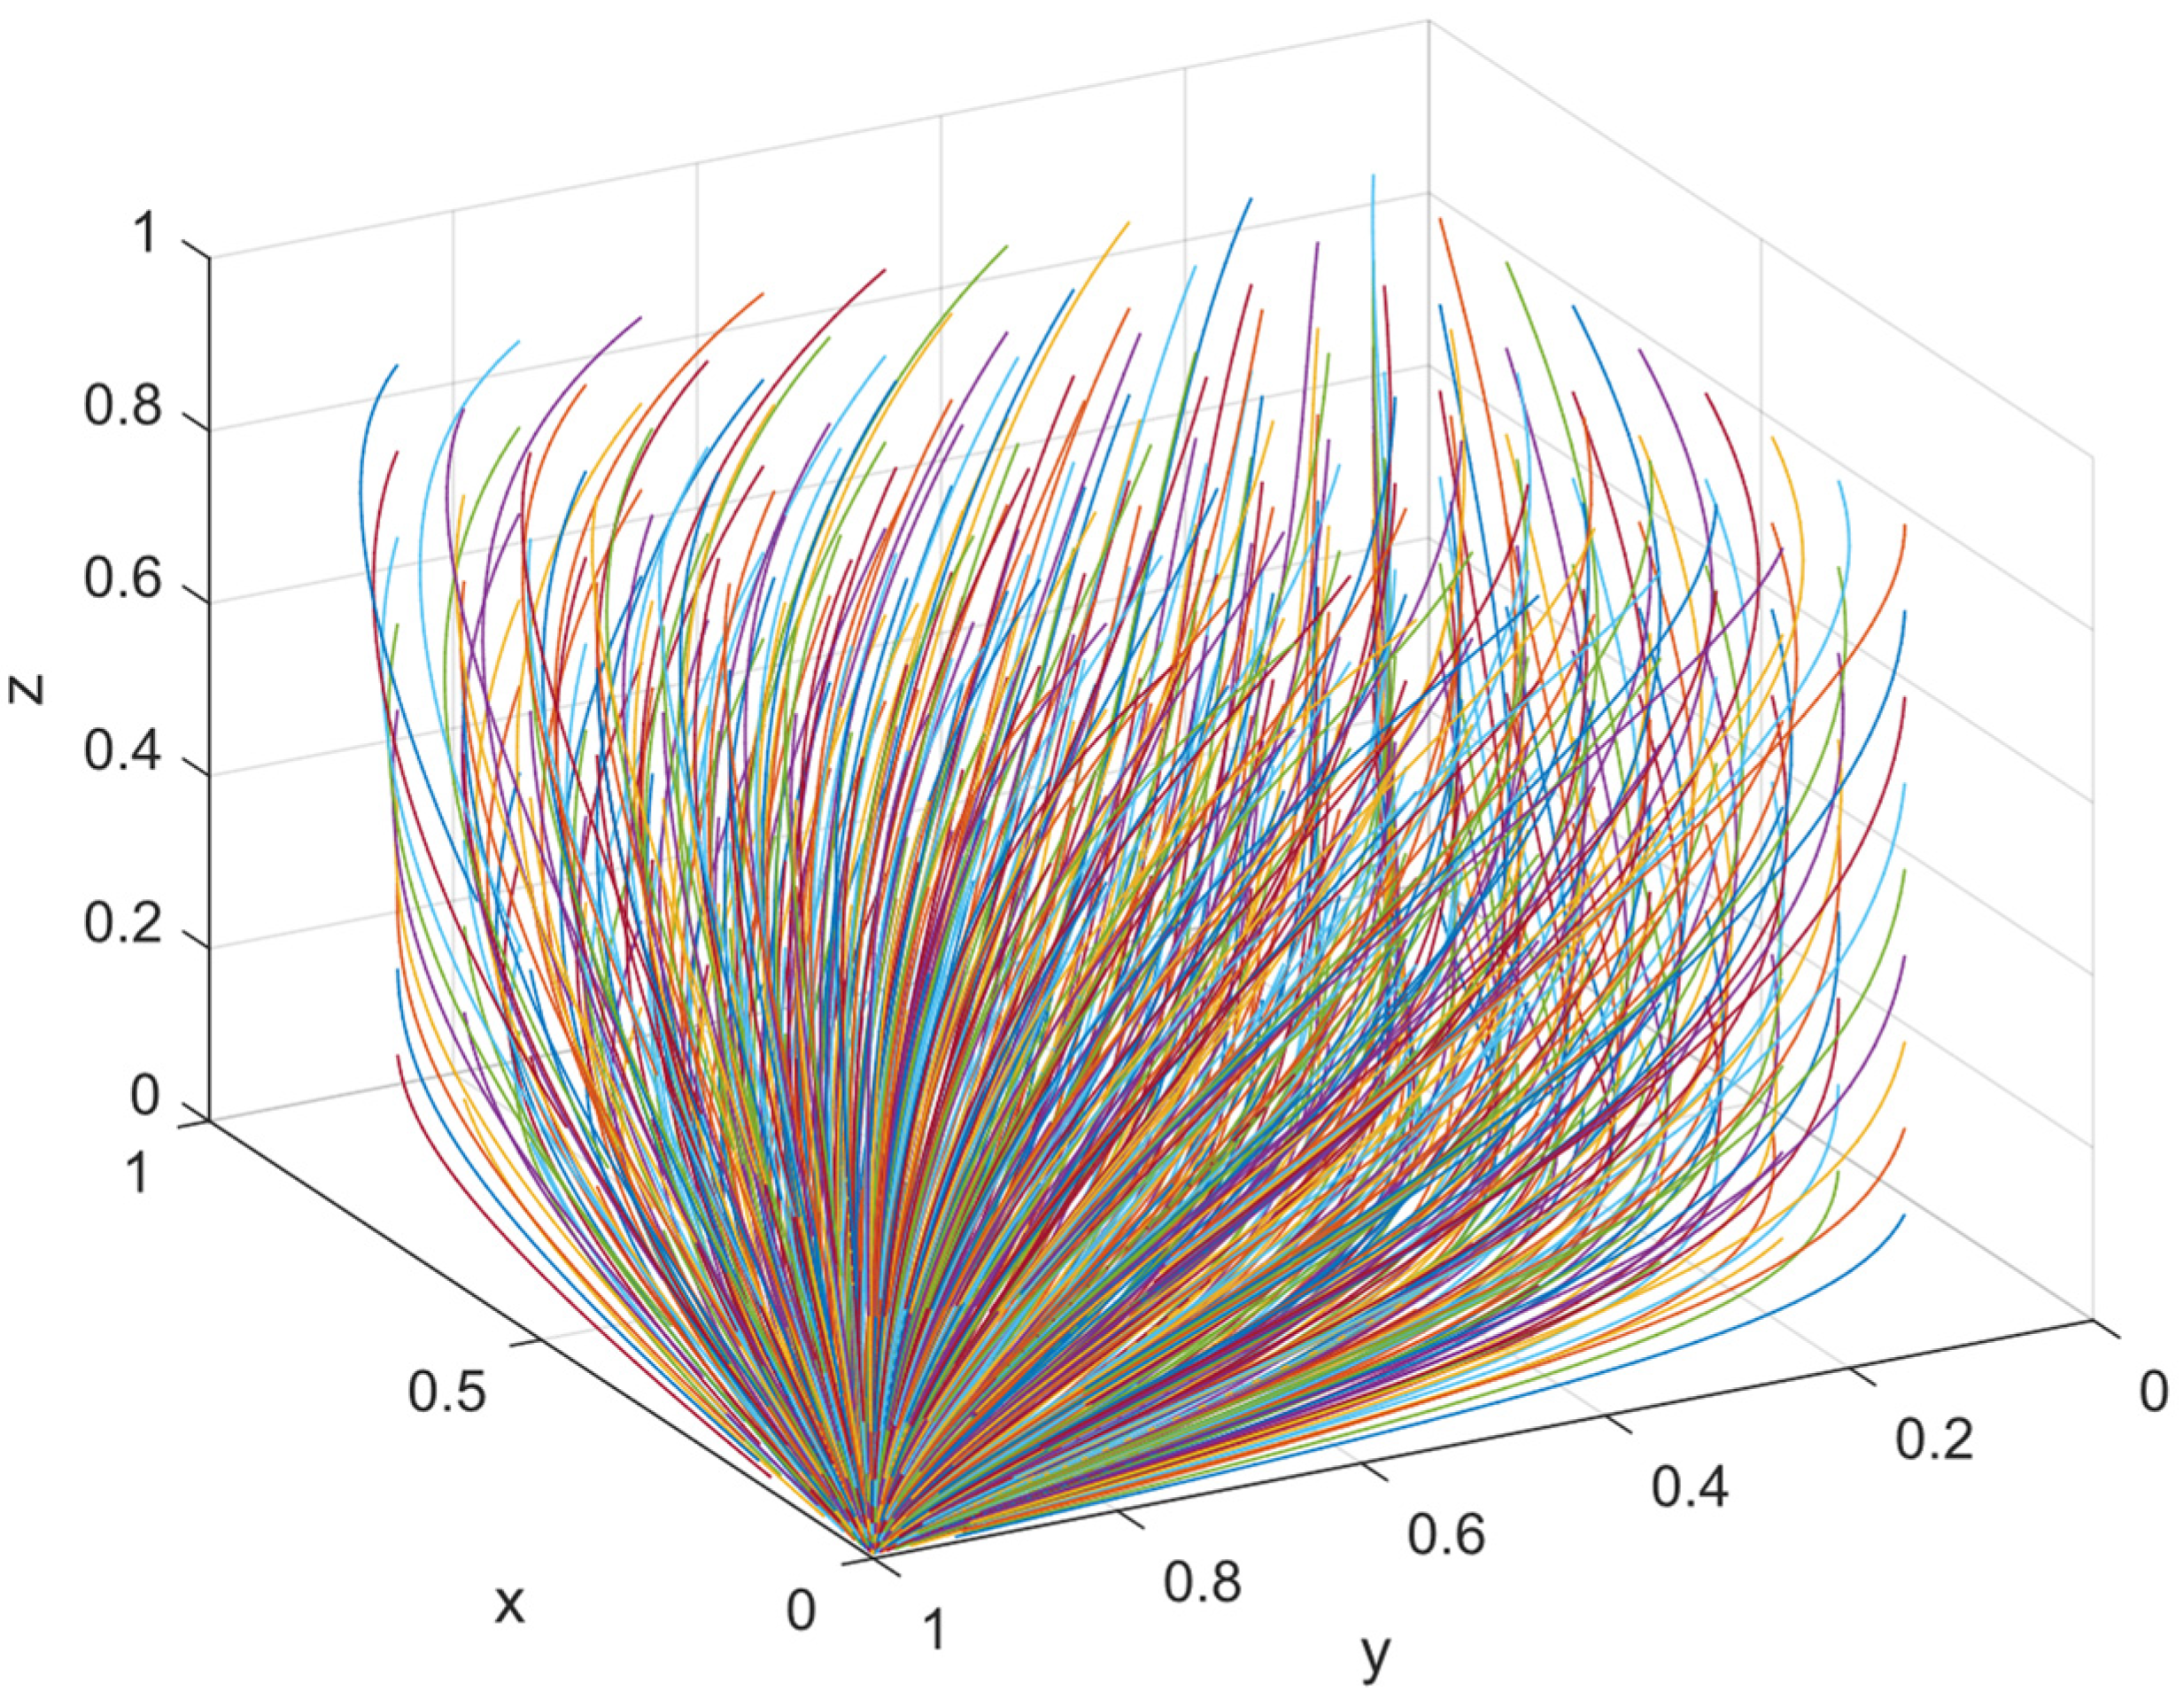
Figure 4.
Sensitivity analysis of α.

Figure 5.
Sensitivity analysis of the additional benefits.

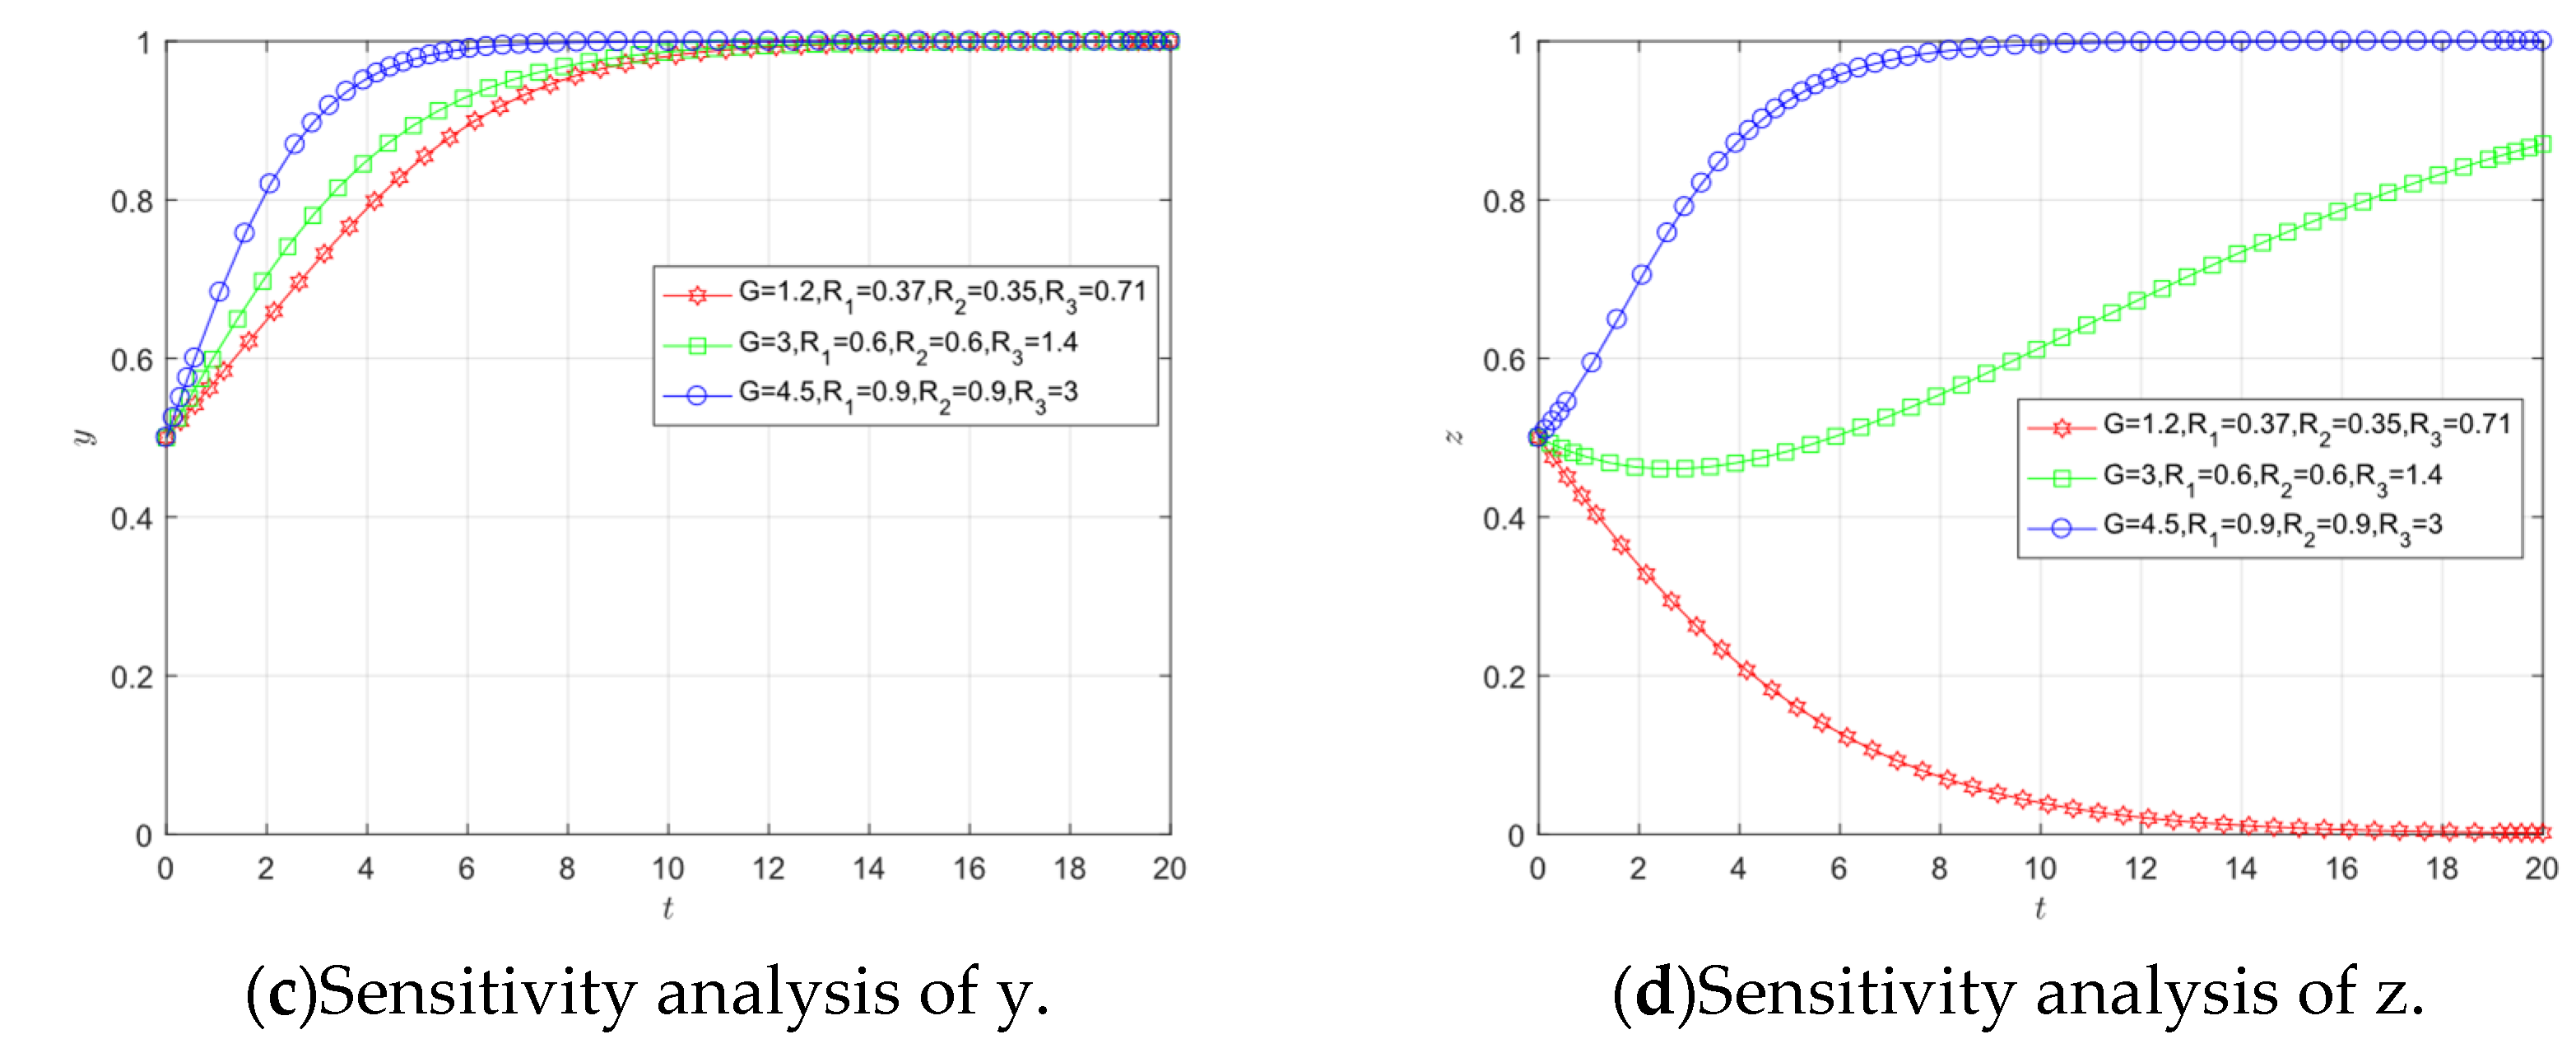
Figure 6.
Further sensitivity analysis of α.
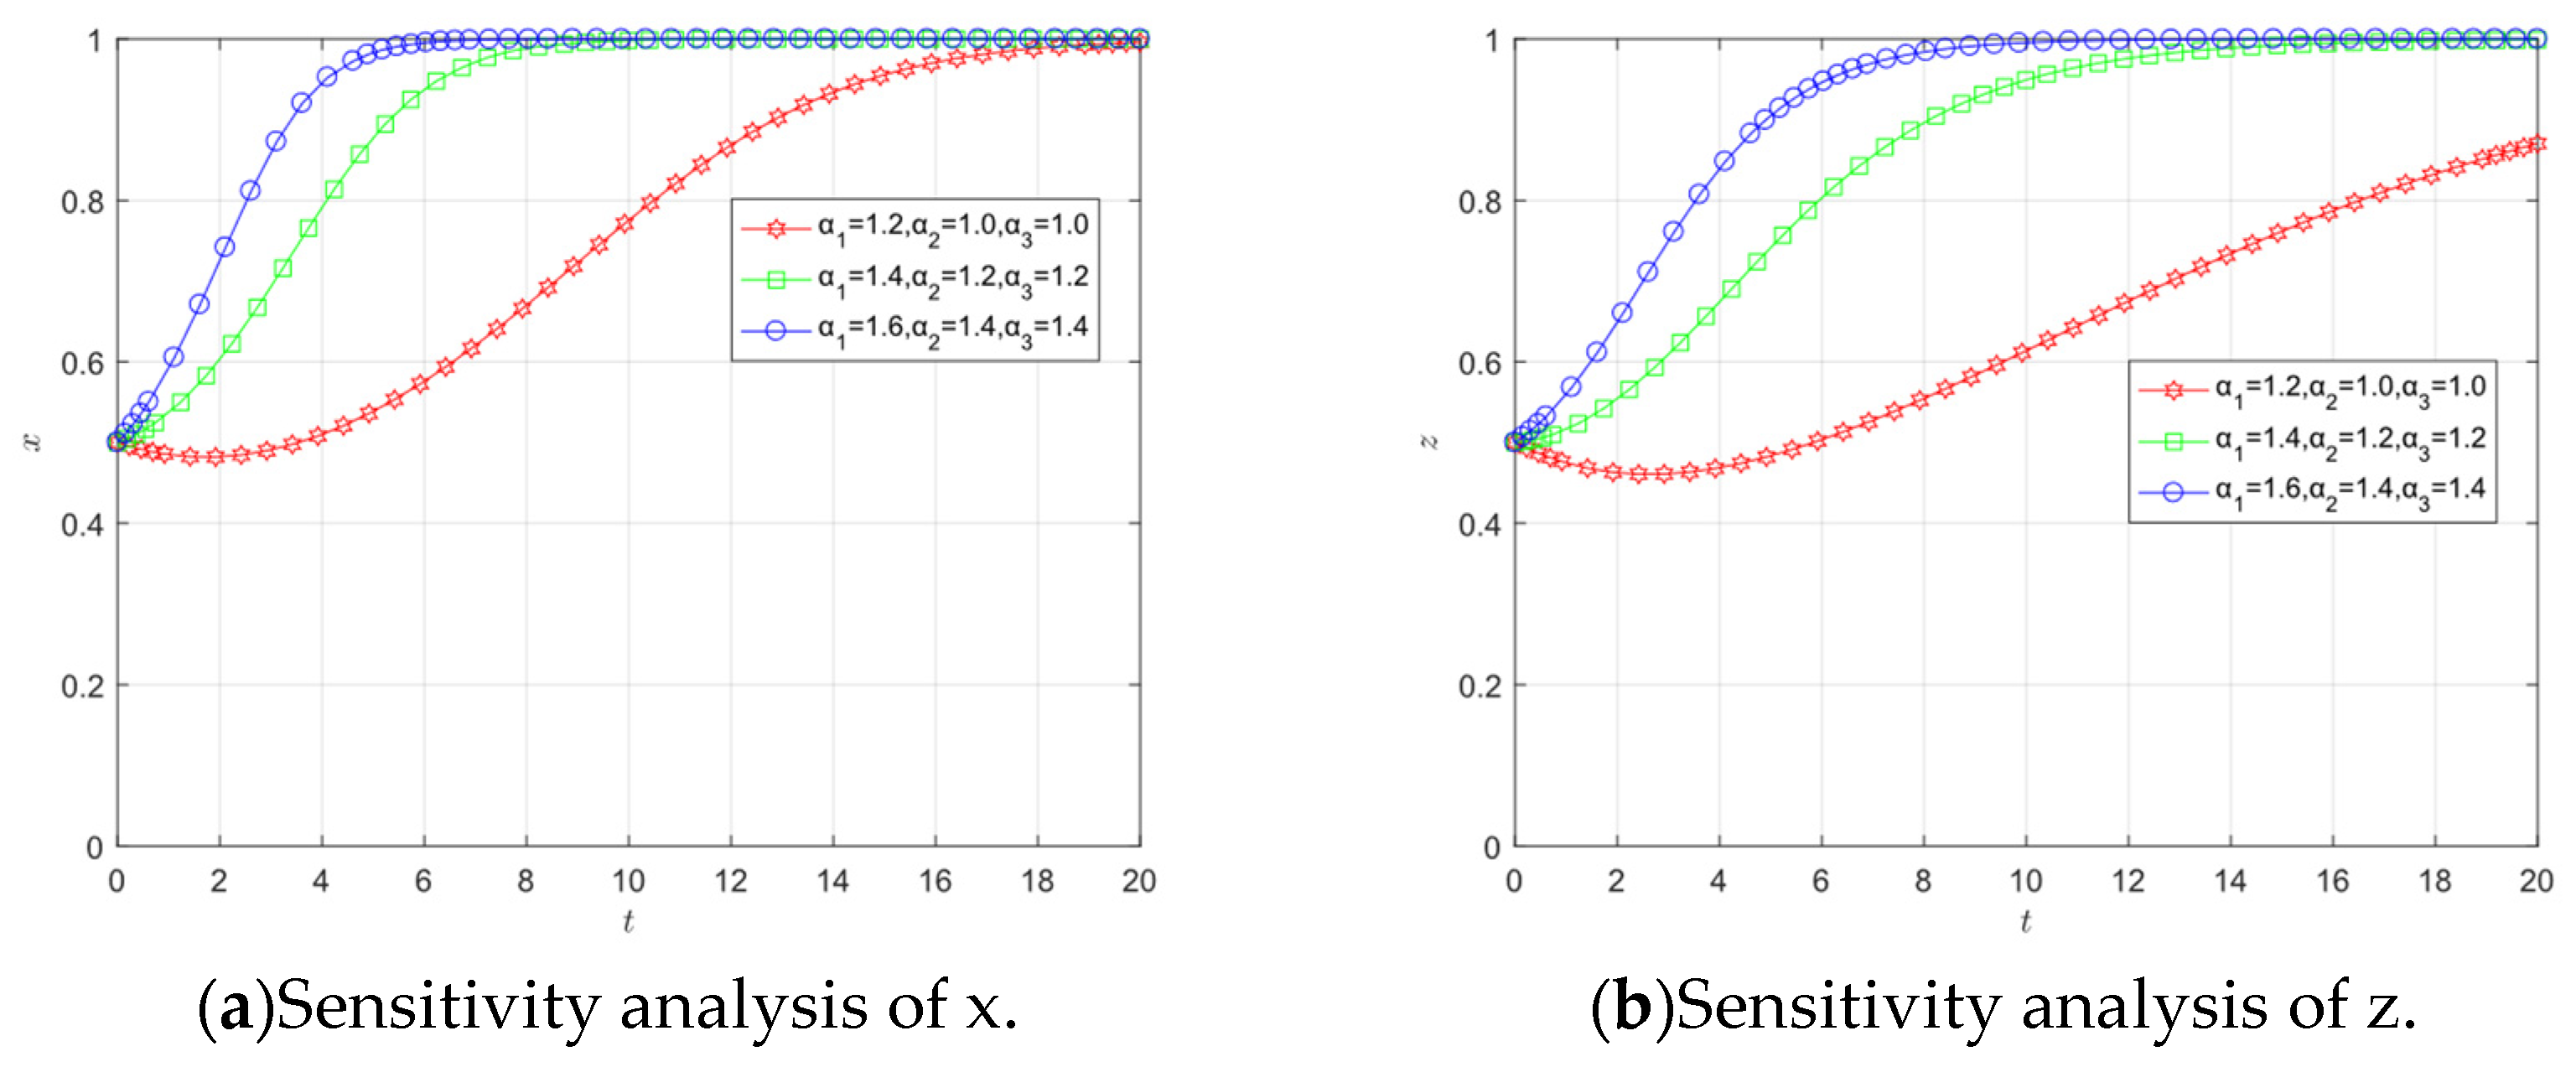
Figure 7.
Sensitivity analysis of S.

Figure 8.
Sensitivity analysis of P.
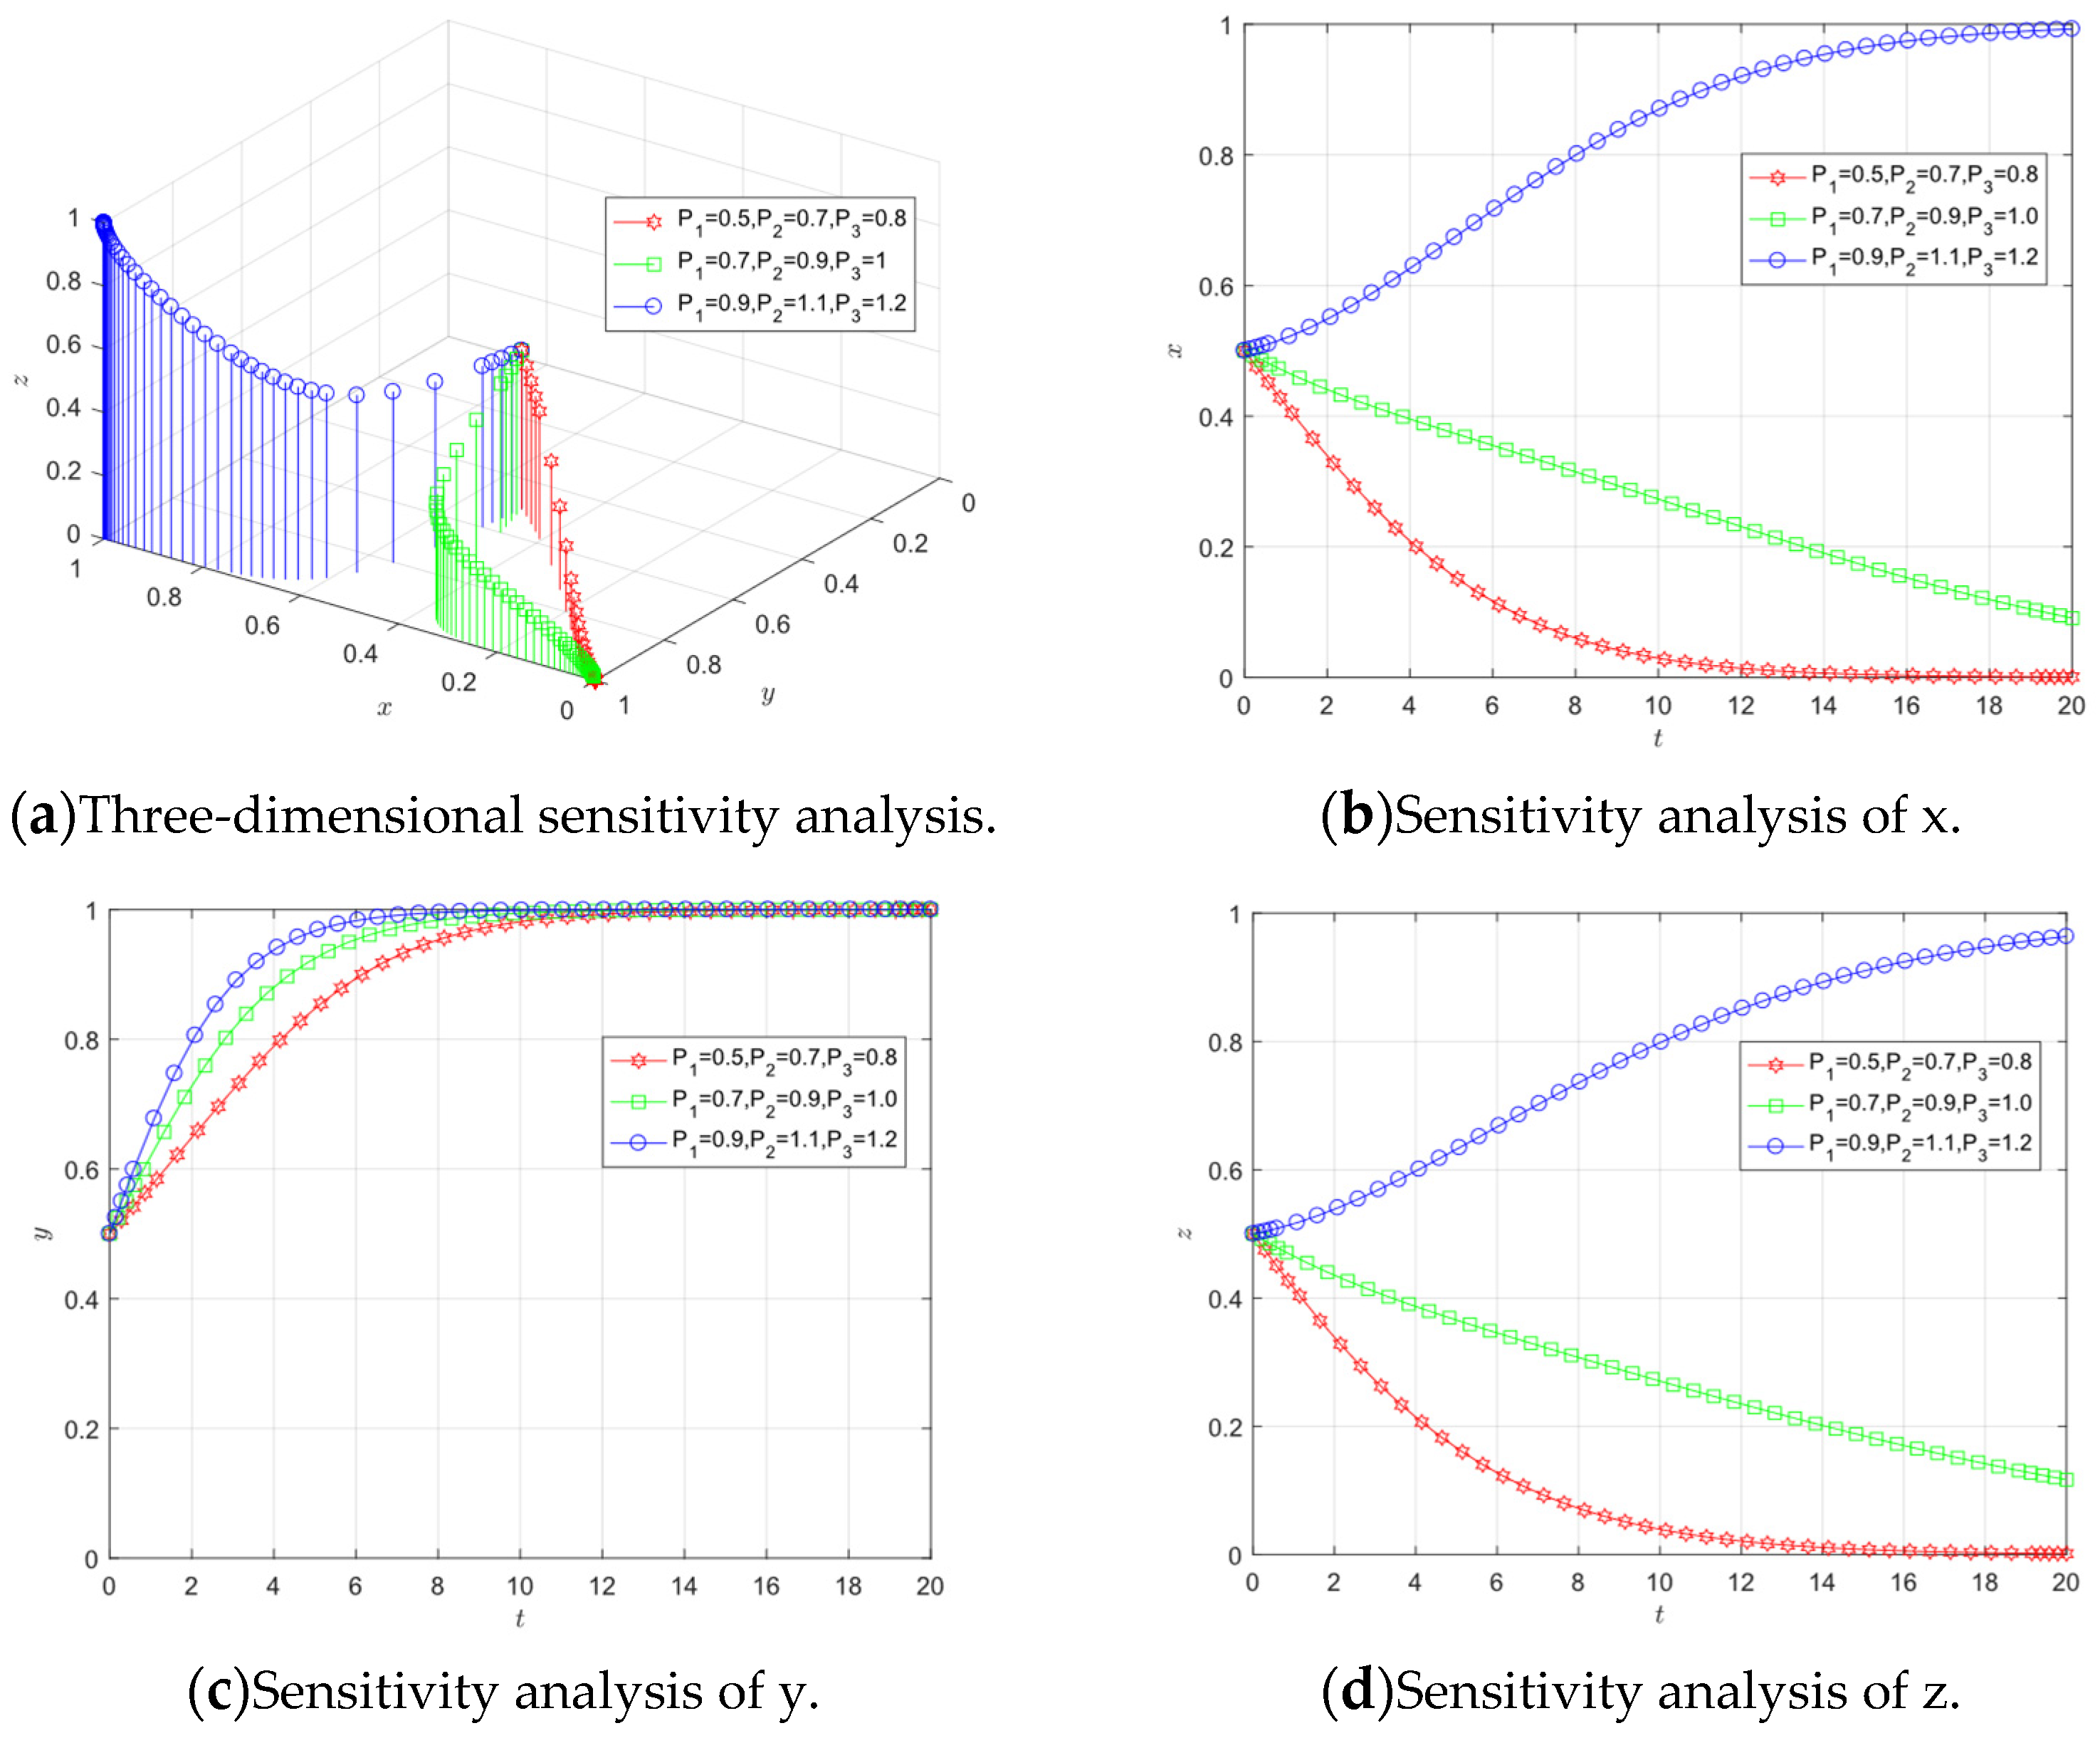
Figure 9.
Sensitivity analysis of K4.


Table 1.
Strategies for each subject.
| Probability | Implication | Range |
|---|---|---|
| Probability of NEVMs choosing green strategies | ||
| Probability of NEVMs choosing non-green strategies | ||
| Probability of PBMs choosing green strategies | ||
| Probability of PBMs choosing non-green strategies | ||
| Probability of PBRs choosing green strategies | ||
| Probability of PBRs choosing non-green strategies |
Table 2.
Fundamental parameters of power battery recycling.
| Parameters | Implication | Range |
|---|---|---|
| NEVMs’ digital transformation degree | ||
| PBMs’ digital transformation degree | ||
| PBRs’ digital transformation degree | ||
| The fundamental benefits of NEVMs | ||
| The fundamental benefits of PBMs | ||
| The fundamental benefits of PBRs | ||
| The strategic risk cost of NEVMs | ||
| The strategic risk cost of PBMs | ||
| The strategic risk cost of PBRs | ||
| Cost of NEVMs assistance to PBMs | ||
| Cost of NEVMs assistance to PBRs | ||
| PBMs’ technology input | ||
| PBRs’ technology input | ||
| Additional benefits when all three subjects choose green strategies | ||
| Additional earnings distribution factor for NEVMs | ||
| Additional earnings distribution factor for PBMs | ||
| Additional earnings distribution factor for PBRs | ||
| Benefits of collaboration between NEVMs and PBMs | ||
| Benefits of collaboration between NEVMs and PBRs | ||
| Benefits of collaboration between PBMs and PBRs | ||
| Gain factor when NEVMs and PBMs collaborate | ||
| Gain factor when NEVMs and PBRs collaborate | ||
| Gain factor when PBMs and PBRs collaborate |
Table 3.
Government rewards and penalties parameters.
| Parameters | Implication | Range |
|---|---|---|
| Government rewards for NEVMs choosing green strategies | ||
| Government rewards for PBMs choosing green strategies | ||
| Government rewards for PBRs choosing green strategies | ||
| Government penalties for NEVMs choosing non-green strategies | ||
| Government penalties for PBMs choosing non-green strategies | ||
| Government penalties for PBRs choosing non-green strategies |
Table 4.
Tripartite strategy combination and payment matrix.
| Strategies | NEVMs | PBMs | PBRs |
|---|---|---|---|
Table 5.
Equilibrium points and eigenvalues .
| Equilibrium Points | Eigenvalues | ||
|---|---|---|---|
Table 6.
Simulation values.
| Parameters | Initial Value | Parameters | Initial Value | Parameters | Initial Value |
|---|---|---|---|---|---|
| 1.2 | 0.5 | 0.6 | |||
| 1 | 0.55 | 0.5 | |||
| 1 | 0.45 | 0.4 | |||
| 0.45 | 1.82 | 0.6 | |||
| 0.26 | 0.5 | 0.3 | |||
| 0.3 | 0.2 | 0.7 | |||
| 1.45 | 0.3 | 0.5 | |||
| 0.5 | 0.37 | 0.7 | |||
| 1.8 | 0.35 | 0.8 | |||
| 0.4 | 0.71 | - | - |
Disclaimer/Publisher’s Note: The statements, opinions and data contained in all publications are solely those of the individual author(s) and contributor(s) and not of MDPI and/or the editor(s). MDPI and/or the editor(s) disclaim responsibility for any injury to people or property resulting from any ideas, methods, instructions or products referred to in the content. |
© 2023 by the authors. Licensee MDPI, Basel, Switzerland. This article is an open access article distributed under the terms and conditions of the Creative Commons Attribution (CC BY) license (https://creativecommons.org/licenses/by/4.0/).
Share and Cite
MDPI and ACS Style
Li, G.; Lu, M.; Lai, S.; Li, Y. Research on Power Battery Recycling in the Green Closed-Loop Supply Chain: An Evolutionary Game-Theoretic Analysis. Sustainability 2023, 15, 10425. https://doi.org/10.3390/su151310425
AMA Style
Li G, Lu M, Lai S, Li Y. Research on Power Battery Recycling in the Green Closed-Loop Supply Chain: An Evolutionary Game-Theoretic Analysis. Sustainability. 2023; 15(13):10425. https://doi.org/10.3390/su151310425
Chicago/Turabian StyleLi, Gang, Mengyu Lu, Sen Lai, and Yonghong Li. 2023. "Research on Power Battery Recycling in the Green Closed-Loop Supply Chain: An Evolutionary Game-Theoretic Analysis" Sustainability 15, no. 13: 10425. https://doi.org/10.3390/su151310425
Note that from the first issue of 2016, this journal uses article numbers instead of page numbers. See further details here.