
Spatial Distribution of Future Demand for Space Cooling Applications and Potential of Solar Thermal Cooling Systems


1
Unit of Energy Efficient Building, Faculty of Engineering Science, Universität Innsbruck, 6020 Innsbruck, Austria
2
Dr. Jakob Energy Research GmbH & Co. KG, 71834 Weinstadt, Germany
3
Neyer Brainworks GmbH, 6700 Bludenz, Austria
*
Author to whom correspondence should be addressed.
Sustainability 2023, 15(12), 9486; https://doi.org/10.3390/su15129486
Submission received: 9 April 2023
/
Revised: 30 May 2023
/
Accepted: 6 June 2023
/
Published: 13 June 2023
(This article belongs to the Topic Advances in Solar Heating and Cooling)
Abstract
:Demand for space cooling systems is growing worldwide. The main reasons are socioeconomic developments such as the growing world population and the rise of economic wealth, especially in developing countries. These developments run simultaneously with global warming effects, increasing the need for cooling. This study introduces the development of the Cooling Demand Market Index (CDMI), which indicates the demand for cooling appliances worldwide at a spatial resolution of 1 km. It is based on population density, Gross Domestic Product (GDP)/capita and Cooling Degree Days (CDD) per climate zone. The CDMI is calculated for 2020 and 2050 in four different future scenarios in accordance with the Spatial Socioeconomic Pathways (SSP) and Representative Concentration Pathways (RCP). Further, the Solar Thermal Cooling Index (STCI) was developed to spatially estimate the worldwide potential to use solar thermal cooling systems based on solar availability and limitations due to maximum heat rejection temperature. Results of the CDMI show that the economic demand for cooling solutions is increasing, especially in developing countries, and that India will be by far the largest market by 2050. Countries such as Burundi and the Democratic Republic of the Congo show the strongest national increases in CDMI. The STCI indicates that ammonia absorption chillers and zeolite adsorption chillers can serve the vast majority of the market thanks to their capability to run at high condenser temperatures.
1. Introduction
Global warming is progressing unabated, as the past eight years were the warmest years since the beginning of the weather record [1]. Global surface temperature in the period 2011–2020 was already 1.09 °C above the level in the period 1850–1900, of which the human-caused share likely contributed 1.07 °C [2]. As a consequence, in 2022, Europe experienced its second warmest June and warmest October in history, with 1.6 °C and 2.0 °C above the 1991–2020 average, respectively [3]. Between 2010 and 2020, heat waves were the hazardous events causing the highest number of deaths in Europe and Asia [4]. To remedy this trend, space cooling is necessary not only for reasons of comfort but particularly for reasons of human health [5,6]. The rates of extreme heat waves in Europe, Pakistan and India will increase [7,8]. Furthermore, the First Street Foundation predicts that in 30 years, an estimated 107 million people in the United States alone will suffer from extreme heat events with temperatures above 50 °C [9]. Especially urban populations are vulnerable to these extreme weather conditions, along with the effects of urban heat islands (UHI) [4].
The fundamental reason for global warming is human activity on the planet [10]. Looking at the period between 1990 and 2018, the world Gross Domestic Product (GDP) increased by 279.5% [11], while the annual world final energy consumption grew by 58.6% [12] and the annual GHG emissions by 63.4% [13]. In the same period, the world population grew by an estimated 44.4% [14]. Outstanding is the energy consumption for cooling purposes, which more than tripled from 1990 to 2021 [15]. The economic and demographic developments in the hot climate regions are the driving factors for the increase in cooling demand [6]. According to the baseline scenario of the International Energy Agency (IEA) report The Future of Cooling, energy consumption for space cooling will triple again by 2050 (compared to 2016) [6] (p. 61). Some areas will experience a greater demand for cooling than others. The IEA predicts a high increase, especially in Asian countries and particularly in India, in installed capacity in the residential sector from 2030 onwards. Figure 1 shows the development according to installed capacity in the residential sector, according to the Future of Cooling report. Until around 2020, the USA is shown as the country with by far the largest installed cooling capacity. China experienced the fastest growth in installed capacity between 2005 and 2030, while countries such as India, Indonesia, Brazil and Mexico are predicted to experience the highest rise from 2030 onwards.
As an example, the electricity consumption for space cooling in the Association of Southeast Asian Nations (ASEAN) increased 7.5 times from 1990 to 2017 [16]. This development is associated with risks for the energy infrastructure, such as in India and Indonesia [17]. The energy consumption for cooling purposes is increasing rapidly in these two countries, which suggests that they will play a major role in the future cooling market. Heating is largely provided via fossil fuels such as gas, whereas cooling relies mainly on electricity [18]. The peak load of electricity caused by cooling applications during very hot hours might place a serious strain on their electricity grids. In 2050, the share of space cooling will account for more than 40% of the peak electricity load in both India and Indonesia [6] (p. 64). For countries that experience extremely hot days, such as the United States or the Middle East, space cooling can account for 70% of peak residential electrical energy demand [6]. In addition to demographic and socioeconomic factors, the development of the demand for space cooling is also linked to climatological changes. Global warming impacts regions of the world unequally. It is experienced that the northern polar circle is affected most intensely by the warming effect [2]. As a further result of this inhomogeneous development, climatic conditions change, causing the climate zones to shift [19]. As these developments are already identified, action is needed to address this issue.
In order to meet the high cooling demand in the future in an efficient and low-CO2 way, buildings’ design and envelope must lead to a decrease in cooling demand [20]. At the same time, the energy efficiency of electric-driven appliances such as conventional air conditioners must increase to reduce the required energy input [6]. Furthermore, the system providing cooling energy needs to increase its share of renewable energy sources, such as solar thermal cooling or photovoltaic (PV)-driven compression cooling technologies [6]. In short, building components should perform thermally at a high level to reduce cooling demand, which is then met efficiently and sustainably.
The EU-funded SWITCH-Asia project, BEEN (Building Energy Efficiency in Nepal), addresses this topic, contributing to establishing energy-efficient building strategies in Nepal [21]. Nepal’s population grew by 61% from 1990 to 2020 and will grow by an additional 19% from 2020 until 2050 [22]. Nepalese urbanization will increase by 82%, which is one of the highest rates worldwide [22], and the GDP per capita is one of the lowest but might increase sevenfold in the meantime [23]. An estimated 1 million new homes will be built in Nepal in the next decade [21]. Early consideration of measures to increase buildings’ cooling demand seems promising for future development.
This report deals with the two interrelated topics of the development of cooling demand and its coverage by renewable energy. First, based on a newly created methodology, future demand for cooling appliances derived from future Spatial Socioeconomic Pathways (SSP) and Representative Concentration Pathways (RCP) is presented. Second, these scenarios are then set in relation to a map showing the future potential of different solar cooling appliances to estimate their future market potential.
2. Materials and Methods
2.1. Factors Influencing Space Cooling Demand
The actual energy demand for space cooling is bound to the thermal performance of buildings, which is strongly influenced by their design, selected materials [6] (p. 33), occupation behavior [24,25] and several other factors. This section presents aspects influencing the space cooling demand of buildings and points out measures identified in the literature to reduce it.
2.1.1. Building Design and Structure Strategies
The International Energy Agency (IEA) advises “Improving the energy performance of buildings” in its policy actions to curb cooling-related energy [6] (p. 78). Measures to increase a building’s energy performance can be either active or passive. The latter takes strategies such as adapted building design (like window area and orientation, external shading, night ventilation), choice of building materials (thermal mass is helpful), and elements such as cool roofs into account. The impact of single measures on a building turns out to be very individual in scientific studies.
The architecture and design of buildings are the first steps to mitigating the energy demand of buildings, especially new ones. It must be designated for both the building’s purpose and its environment, speaking of its climate. The compactness of buildings quantified in the volume/surface ratio is important considering the heat/cold stored in the building and losses through its envelope [26]. The level of compactness must be reasonable for a building’s concept.
A building’s orientation is important in relation to solar irradiation. Façades facing the equator are best to collect solar gains in the cold season. In general, big façades or windows facing south are favorable at the equator as east, and west façades receive increased solar radiation at a high zenith angle in the morning and evening. The orientation and location of a building in relation to neighboring buildings also affect its performance. Close construction leads to mutual shading, which, depending on the urban structure and building, may have a major impact on energy demand.
External shadings block solar radiation and thus prevent heat gain, which would cause an increase in cooling demand. External shading devices can be separated into passive and active systems. Both types may also play an aesthetic role in a building’s design and appearance [27]. There is a great variety in the geometric and material selection of shading devices. A detailed analysis of different tilting, rotating and folding active shading devices is part of a study by Al Dakheel et al. [28].
The selection and characteristics of glazing systems influence the solar transmittance of incident solar radiation. Windows must be properly selected to match the needs of building energy demands, thus transmitting solar heat gain for heating purposes and reflecting (preferably non-visible) solar radiation when it comes to cooling [27]. The relevant characteristics are the g-value or solar heat gain coefficient (SHGC) for solar radiation and the u-value for its insulating behavior. The Passive House Institute published a world map giving advice on window type selection based on climatic conditions to counteract building energy demand [29] (p. 89). Besides the characteristics, the orientation, size and number of windows [30] and the window-to-wall ratio [31] are also of interest. Glazing systems further transmit daylight into buildings, reducing the need for artificial lighting and thus internal heat gains.
The airtightness of a building’s envelope is necessary to reduce the heat gain from the infiltration of ambient air. A building without an airtight envelope experiences uncontrolled air mass flow through cracks or gaps in the air. This tends to be extremely disadvantageous if the ambient air is humid, polluted or does not correlate with desired indoor air conditions, in nearly all cases. Low airtightness can either result in negative conditions of indoor air temperatures or increase the demand for air conditioning and cooling [27].
Using natural ventilation is one of the cheapest and most energy-efficient measures to reduce the need for mechanical cooling in a building. It is affected by the temperature and pressure difference between indoors and outdoors [32]. Especially nocturnal natural ventilation can have a great impact if the ambient temperature is cold enough to cool a building’s mass down [26]. Depending on the building design, basically, three different kinds of ventilation are available: single-sided, cross- or stack-ventilation [32]. The correct use of natural ventilation is of great importance when it comes to building energy demand. Natural ventilation during the day might lead to additional heat input, but it is necessary to supply the occupants with fresh air and secure high indoor air quality. Strategies such as a solar chimney [26] or windcatcher [33] can be used to support the air mass flow and thus the impact of natural ventilation.
Thermal insulation reduces heat flux through opaque constructions such as walls and roofs. It is necessary to reduce heat gain from outside in the case of cooling. In regions where the outdoor temperature is constantly above or below the desired indoor temperature, insulation of buildings is necessary. There is a wide range of materials and methods to insulate a building, such as commercially most commonly applied expanded polystyrene (EPS), extruded polystyrene (XPS), polyurethane (PUR), mineral wool or vacuum insulation panels [32]. Additionally, biomass-based insulation, e.g., wood fiberboard and straw, is partly available. The Passive House Institute published a world map giving advice on cost-optimized u-values for opaque construction based on climatic conditions to counteract building energy demand [29] (p. 88). Economically speaking, the selection of insulation, its width and the position of installation are crucial to creating a convenient payback time for the customer [32]. Furthermore, the selection of materials based on mineral oil must be considered critical in terms of environmental friendliness [32].
The term “cool roofs” here refers to roof systems and designs that have a high albedo and thus reflect a high share of solar radiation. Cool roofs have the potential to reduce the cooling demand of buildings and are an easy measure as a building retrofit solution [34] if good roof insulation cannot be applied. Experimental studies showed a decrease in solar reflectance of about 0.04 in less than one year due to exposure to environmental conditions [35].
Green roofs promise a passive cooling effect considering the evapotranspiration phenomenon, the shading effect of vegetation, their insulation potential and decelerating roof heating thanks to their mass-related heat capacity [36]. However, green roofs show only a small effect on highly insulated roofs [37]. Thus, their advantage is primarily expressed in their property as an insulating layer, which means they could be displaced by insulating measures.
The total thermal heat capacity of a building is relevant for the time span of heating and cooling actions. Usually, a 24-h temperature variation (day/night) can be dampened inside the building. A high thermal heat capacity of a building’s interior prevents it from quickly overheating, e.g., due to solar radiation. The potential heat/cold stored in a building depends on its structure [30]. Wood stores less heat compared to concrete or clay. A high thermal capacity and high thermal conductivity are beneficial when there are no periods when the total building mass heats up but only daily variations in heat fluxes. It is best combined with nocturnal ventilation. If the total mass heats up, more energy is required to cool it down again. Lightweight constructions, however, tend to heat up faster on the one hand but cool down faster on the other hand, as less heat is stored in the construction [30].
The integration of latent heat storage in the form of phase change material (PCM) in construction is partially considered a promising solution to shift peak loads of cooling demand and help regulate indoor air temperature [38,39,40]. However, those systems face challenges due to the high investment costs of PCM [39], the long-term stability of phase change cycles, limitations in heat transfer due to the low thermal conductivity of PCM itself, and especially the impact of hot weather conditions that may prevent the PCM from solidifying [40].
The comparability of studies’ results and the single impact of measures is not possible in a general way, as some studies base the impact either on sensible cooling load [41], sensible cooling demand [42,43], electrical cooling demand [44], financial savings [45] or change in indoor temperature [44,46]. Even if buildings show a similar cooling load, the annual cooling demand can differ drastically if the climatic conditions require cooling only during short time frames during the year, compared to a constant demand in tropical regions [29]. Furthermore, the impact of measures depends on a building’s design, e.g., cool roof concepts promise better performances for single-storey buildings compared to multi-storey buildings. Concepts of passive measures to reduce the cooling demand of buildings gain importance. The number of associated yearly scientific publications on the Web of Science with either “passive cooling” or passive building design” mentioned in the topic or title doubled from 2016 to 2022 [47], see Figure 2. The number of countries of origin for studies accounts for 122 and 118, respectively.
2.1.2. Low-Energy Cooling Strategies
Besides passive measures described in the previous section, this section briefly describes the application and potential of three active low-energy cooling strategies.
Evaporative cooling uses evaporating water that absorbs heat, changes phase and creates a cooling effect. It is one of the oldest and most efficient cooling strategies and was already used in the Middle East around 2500 B.C. [48]. There are direct and indirect evaporative cooling strategies [26] as well as systems using either air or water as a medium [49], of which this study only points out air-driven systems. In the direct one, air flows over or in between wet or damp surfaces. The heat from the air gets extracted, causing it to cool down. The direct evaporative cooling systems also increase the humidity of fresh air, which is beneficial in dry, hot climates [27]. However, indirect evaporative cooling does not affect the humidity or indoor air, as the cooling effect caused by evaporation is applied on parts of the construction instead of air [26] or on secondary air flow, cooling down the primary fresh air flow via a heat exchanger [48]. Evaporative cooling is limited in its application to arid climates [27].
A related strategy to evaporative cooling is desiccant cooling, which is promising in hot and humid climates [49]. The method makes use of liquid or solid desiccants that absorb moisture from the air and reject moisture when regenerated via heat. The system, however, requires an additional method to cool down the now warm and dry air, which could again be evaporative cooling.
Radiative cooling is a relatively simple system. Collectors make use of long-wave radiative heat exchange with the night sky and can cool the heat transfer medium up to 5 K [50] to 7 K [51] below ambient temperature. The radiative heat flux lies in the range of 60 W/m² (±30%) [52]. Experimental studies using photovoltaic thermal (PVT) collectors [53] and simulation studies using photonic radiative coolers [54] prove the concept. Radiative cooling has the potential to run as a renewable supporting system, decreasing the load on main cooling systems [52].
2.1.3. Mitigation of Urban Heat Islands (UHI)
A structurally influencing parameter is the location of a building. The effect of UHI leads to higher temperatures in city centers [55,56], several Cooling Degree Days (CDD) of up to 6.5 times higher than in suburban areas [57] and thus a higher demand for cooling [58]. These facts gain weight, considering urbanization will increase globally from 56.2% in 2020 to 68.4% in 2050 [22]. The UHI phenomenon can locally lead to an increase in space cooling demand of 10% up to 120% [59]. Their intensity is individually variable for each city and metropole, among other factors dependent on the urban building structure, infrastructure and topology [60,61,62]. Mitigation options cover a wide range of possibilities, from passive cool pavements [34,63], urban green spaces [64,65,66,67,68,69], green roof and/or green wall installations [70,71], high reflecting roofs [72], the cooling effect of water bodies [73] or adaptation of the buildings themselves [74,75]. The impact of these results may bring cooling effects from 2 K [75] for daily average summer temperatures up to 10 K [65,66] maximum temperature difference to UHI temperatures. Though, it is to say that the mitigation options target different kinds of effects and the impact strongly depends on specific aspects, such as quantity and quality of action (e.g., amount and selection of vegetation) or distance from the action to the point of influence (e.g., distance from green spaces). A case study analysis for South Creek, Australia, concluded that both urban mitigation and building adaptation are necessary to face future challenges of space cooling in urban areas, decreasing cooling energy needs by up to 70% [75]. However, a study on mitigation and implementation strategies in the United States among 148 respondents reveals, among others, that the lack of public education on UHI mitigations and the lack of effective communication between researchers and code writers account for the greatest implementation gaps [76]. The mitigation of UHI and adaptation are crucial parts of future urban development strategies. The United Nations Environment Program (UNEP) published “A sustainable cooling handbook for cities” in 2021, where actions on urban, building and technical scales are described and a “whole system” approach is followed [77].
2.2. Solar Options to Answer the Cooling Demand
2.2.1. Solar Cooling Technologies
There are different ways to cover future space cooling demand, such as district cooling solutions or vapor compression chillers (VCC) driven with electricity from the grid. Solar cooling technologies, namely solar photovoltaic (PV)-driven VCC and solar thermal-driven cooling devices, such as sorption chillers, are promising options to meet future cooling demand, at least partly, while operating sustainably [6,78,79]. Besides the technological difference between solar electric and solar thermal solutions, a major difference lies in their concept. Solar thermal solutions rely on a total system of solar collector plants, piping and heat storages, which are crucial for operation when no sun is available, whereas electric solutions can rely on the grid and are rather PV supported (except for island solutions with electric battery stacks).
Solar thermal cooling systems are not as widespread as conventional cooling solutions, but their number is increasing. The number of worldwide installed solar thermal cooling systems grew from one thousand in 2011 [80], to over 1200 in 2014 [81], about 1350 at the end of 2015 [16] to about 2000 deployed systems in 2020 [82]. Most of these systems are installed in Europe [16]. However, with about 99% in 2016, the vast majority of space cooling worldwide is electric driven [6] (p. 23). Furthermore, 93% of air-conditioning appliances in 2016 were either packaged units or mini- and multi-ductless split units [6] (p. 21). To address this circumstance and implement sustainable and energy-efficient solutions in this scope, it is necessary to both provide electricity from renewable sources and for small-scale sorption to establish itself on the market, which is already happening [82]. Besides, hybrid solutions enter the market by combining the benefits of both technological approaches at convenient economic efficiency [83]. In further course, this study will focus on solar thermal systems.
The thermal-driven chillers can be grouped into closed and open systems [84]. Absorption (AbC) and adsorption chillers (AdC) are closed systems, whereas desiccant-evaporative systems are open systems. The performance of chillers is measured using the thermal Coefficient of Performance (COPth), which is dependent on the relation between the temperature level of the heat source, chilled water and cooling water (heat rejection temperature) for a single unit. AbCs and AdCs are different in this aspect. AdCs can run at a lower heat source temperature compared to AbCs, whereas AbCs using ammonia as the refrigerant can reach lower chilled water temperatures [79,85,86]. Depending on the sorption material, the application of a sorption chiller can be more limited compared to that of a VCC.
2.2.2. International Energy Agency (IEA) Solar Heating and Cooling (SHC) Task 65—Solar Cooling for the Sunbelt Regions
The IEA SHC Task 65, which started in July 2020, aims to promote solar cooling technologies [87]. Its main objective, among others, is to increase the audience, raise attention on solar cooling solutions and establish a technical and economic database to provide a standardized assessment of demo use cases [87]. At the center of the activities is the Sunbelt area, which is defined as the regions between the 20th and 40th latitudes of both the northern and southern hemispheres [87]. The first results aim to present the foundation and potential solutions for the adaptation of systems, components and buildings in Subtask A but also create the database for market uptake of solar cooling systems in Subtask B as well as techno-economic analyses in Subtask C [88,89]. This task is of importance when it comes to reaching the targets defined in the Strategic Work Plan for 2019–2024 [78] and 2024–2029 [90] of the IEA SHC Technology Collaboration Program, especially in the countries with fast-growing cooling demand in the Sunbelt region, such as India.
The Sunbelt region includes 85 countries and territories (such as the Western Sahara). Based on SSP3 data from Wang for 2020 [91], the Sunbelt is home to approximately 3.8 billion people in the northern hemisphere and 290 million people in the southern hemisphere. Thus, about half the world’s population lives in the Sunbelt region. In 2020, an estimated 324 urban agglomerations, more than every second worldwide, with more than one million inhabitants located in the Sunbelt [22]. It is defined by a great variety of countries in several terms (Figure 3). The human development index (HDI) of the Sunbelt countries ranges from 0.397 in Chad to 0.947 in Australia [92].
In both northern and southern Sunbelt, arid climate is widely spread covering 47% and 57% of land mass, respectively. The Köppen–Geiger climate classification BWh (Arid, desert, hot) is the most dominant climate zone when it comes to land mass possession. Temperate climates cover 35% and 37% of the land mass, respectively. Tropical, continental, polar and alpine climates combined make up only up to 18%.
2.3. Future Scenarios Considered
To picture reliable future developments of cooling relevant parameters in this study, two scenarios of wide scientific application [95,96,97], i.e., the contribution of Working Group I to the Intergovernmental Panel on Climate Change (IPCC) Fifth [98] and Sixth [99] Assessment reports (The Physical Science Basis), have been chosen. These two scenarios are the Representative Concentration Pathways (RCP) and the Shared Socioeconomic Pathways (SSP).
RCPs consider different global warming behaviors based on specific scenarios for the trend of global GHG emissions until the year 2100. “The RCPs are the product of an innovative collaboration between integrated assessment modelers, climate modelers, terrestrial ecosystem modelers and emission inventory experts.” [100]. The following four RCPs are part of this study: RCP2.6, RCP4.5, RCP6.0 and RCP8.5. They consider a rise in global mean surface temperature of 1.0 °C (RCP2.6) to 2.0 °C (RCP8.5) until the mid of the 21st century compared to the period of 1986–2005 [101] (p. 90). Further descriptions of the RCPs can be found in [100,101].
SSPs picture the socioeconomic developments for five different pathways (SSP1–SSP5). They are defined “as reference pathways describing plausible alternative trends in the evolution of society and ecosystems over a century timescale, in the absence of climate change or climate policies.” [102]. They are based on different assumptions in fields such as technology transfer and development, lifestyle and fossil constraints [103]. According to O’Neill et al., they can be referred to as SSP1—Sustainability, SSP2—Middle of the Road, SSP3—Regional Rivalry, SSP4—Inequality and SSP5—Fossil-fueled Development. Further information on SSPs can be found in [103,104].
Scenarios using data from both pathways are labeled according to IPCC AR6 and the Physical Science Report as SSPX-Y, with X referring to the SSP and Y referring to the RCP model [104]. In accordance to Table 1 of [104] presenting the most suitable matches of SSPs and RCPs and considering the availability of Geoinformation Systems (GIS) data, the following four scenarios for the year 2050 have been chosen for investigation: SSP1-2.6, SSP2-4.5, SSP4-6.0 and SSP5-8.5.
- SSP1-2.6: This scenario considers the least global warming (RCP 2.6) of all scenarios assessed. The SSP1 scenario considers the lowest world population in 2050 compared to the other SSP scenarios because of investments into peoples’ education and health. This scenario represents the most environment-friendly way and dissipates from resource-intensive development [103].
- SSP2-4-5: This scenario considers global warming in the middle of the 21st century between 0.9 °C and 2.0 °C, relative to the reference period of 1986–2005 [101] (p. 90). The socioeconomic developments follow historical patterns, with a perfect globally connected market, uneven developments in economic growth and only slow progress in achieving sustainability goals [103].
- SSP4-6.0: This scenario considers global warming in the middle of the 21st century between 0.8 °C and 1.8 °C, relative to the reference period of 1986–2005 [101] (p. 90). The global warming in scenario RCP 6.0 is going to run predominantly during the second half of the 21st century. SSP4 represents an international as well as national inequality socioeconomic development. Economic growth is moderate. A great disparity between a well-educated and capital-intensive society and a low-income and labor-intensive one is growing worldwide [103].
- SSP5-8.5: This scenario considers a strong increase in CO2 emissions and an increase in global mean surface temperature between 1.4 °C and 2.6 °C, relative to the reference period of 1986–2005 by the middle of the 21st century [101] (p. 90). The socioeconomic developments are influenced by energy-intensive and fossil-fueled technologies. This leads to economic and capital growth in emerging economies, along with high investments in health, education, and institutions to enhance human and social capital [103].
2.4. Development of Methodologies
Two new methodologies have been developed in the course of this study. Their purpose is to spatially identify the development and intensity of space cooling demand and to picture the potential of future solar cooling systems, respectively. Both methodologies create dimensionless indices. The indices are based on Geographic Information System (GIS) tools. The applied software is QGIS, a free and open-source GIS software. GIS software offers the combination of quantitative information from different backgrounds on a spatial level, given in raster information at a specific resolution.
2.5. Cooling Demand Market Index
2.5.1. Previous Studies
Previous studies have already assessed a future prediction for cooling energy demand. A study from 2019 by Sachs et al. [105] created a GIS-based energy density map showing the spatial distribution of heating and cooling energy consumption data derived from the International Energy Agency (IEA). Their methodology was based on historic country-specific and weighted energy consumption data for 2010 from the IEA, downscaled to a resolution of 1 km² raster using both population density and Cooling Degree Days (CDD) and Heating Degree Days (HDD) information. A 2022 study by Salata et al. [95] using GIS software put the focus on qualitative future projections in cooling demand for Italy only. The study considered two RCP scenarios (RCP4.5 and RCP8.5), topographic data and Cooling Degree Hours (CDH) to give statements about where cooling demand is increasing. The resolution of the GIS raster was 12 km. Economic aspects are not considered in their applied methodology. A similar study by Mutschler et al. [106] focused on Switzerland only, considering population, topographic characteristics, CDD development and RCP scenarios.
An important study on the future market for cooling is the Future of Cooling report, published by the IEA in 2018 [6]. This report puts focus on the historical and future development of global cooling energy demand per country. It takes into consideration the worldwide increase in CDD and outlines the importance of demographic and economic developments. Enerdata published a report in 2019 [107] on the current state of air conditioning (AC) in households. The report concludes that the future sale of AC units will increase. However, the report further concludes that a prediction on energy consumption shows great deviation, depending on both space cooling demand and the building quality and the efficiency of cooling applications. The 2009 study by Isaac and van Vuuren [108] predicts the residential energy demand for heating and cooling for both 2050 and 2100. The applied methodology in this study also makes use of population density, climate condition represented in CDD and economic power given in GDP/capita, besides data for housing area and efficiency of cooling systems. The study’s outcomes indicate an enormous increase in cooling demand in developing countries, especially in Asia. The study with the most related methodology was performed by Andrijevic et al. and published in an article in 2021 [109]. This study focuses on the identification of gaps in the access to cooling applications, quantified in the share of the population that lacks access to cooling. The methodology is also based on both RCP and SSP scenarios and additionally considers financial inequality and urbanization. Furthermore, GIS software with a grid raster of approximately 50 km was used to estimate the heat impact, quantified via CDD, on the population.
Most of the previous studies focus on the prediction of future cooling energy demand on a national scale. GIS software was primarily applied for detailed urban or national studies.
2.5.2. Developed Methodology
The methodology developed differs significantly from the previous studies and follows a different approach. The target of this methodology is to identify the need for cooling applications on a global scale with high spatial resolution. It also goes one step further from only country-based analyses to results for specific locations.
Forecasts to predict space cooling demand in the world are dependent on different aspects. First to mention is the climate, or hot air temperature, which physically causes discomfort to the human and may result in death in extreme conditions. The second is the number of people or the population density. Space cooling demand only occurs when human activity is present. Third is the economic power of the people, as economic wealth is a necessity to purchase cooling appliances in the first place and to finance their running in the second place. These three aspects have been previously identified as the main contributors to the increasing demand for cooling. However, no study has yet combined these data in a quantitative methodology, resulting in a global raster grid of high spatial resolution to predict the demand for cooling.
Not considered are additional aspects such as the effect of UHI, which is an inconsistent parameter due to its individual behavior based on local circumstances (Section 2.1.3). The thermal performance of the envelope is strongly dependent on its quality, design and mode of operation (Section 2.1.1 and Section 2.1.2). Therefore, the quality of buildings is not an aspect that can be treated uniformly but should be treated individually. A further aspect is the efficiency and selection of cooling devices, as they affect the amount of energy required to meet the cooling demand. However, this technical aspect does not affect the amount of sensible cooling required itself. Thus, the parameters of UHI, building quality and system efficiency are not considered in the proposed methodology.
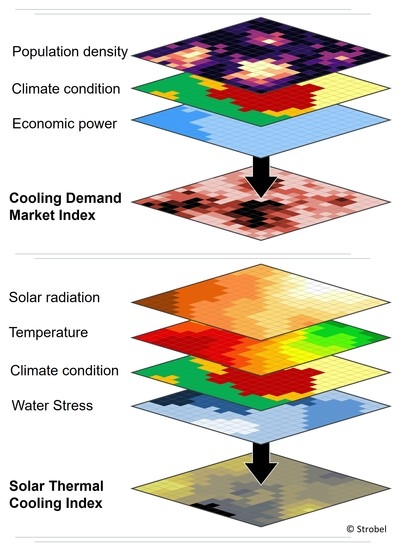
The Cooling Demand Market Index (CDMI) developed in this study aims to spatially indicate and identify the demand for cooling solutions for the latest and future prognoses as a dimensionless index. It considers data from demographic, socioeconomic and climatological backgrounds. The CDMI was developed using QGIS software and its resolution is 30 arc-seconds, which equals approximately 1 km of grid at the equator. The CDMI is applied for the years 2020 and 2050, including four different scenarios for 2050 based on SSP and RCP developments. In the following, the assessment for each of the three index parameters is presented.
2.5.3. Rating of Climate Zones
The illustration of climate zones across the globe is used to picture the climatological impact on the space cooling need. The rating of the climate zones was based on historical data. The annual amount of CDD from 1970 until 2018 for dry bulb base temperatures of 18 °C, 22 °C, 23 °C, 24 °C and 25 °C [110] across the Köppen–Geiger climate zone classification for 1980 until 2016 [111] has been analyzed. The area-specific sums of CDD for the different base temperatures were weighted to create an evaluation across all base temperatures. The weighting on the CDD base temperatures decreases at higher temperatures, to avoid a high base temperature becoming too important in the rating. Otherwise, climates with a high number of CDD at a base temperature of 22 °C would experience a significantly lower rating compared to those, that also have a high number of CDD at a base temperature of 25 °C. The highest weighted CDD results of all climate zones are rated as the maximum with 10 points. The other climate zones are then rated in relation to it. Table 1 shows the weighting of each CDD base temperature and the exemplary calculation of XClimate for two climate zones. BWh is the climate zone with the highest value of weighted CDD. As such, it is rated with the highest score of 10. Csa has a sum of weighted CDD of 1644, which accounts for 42% of the highest score, resulting in a rating of 4.2.
The rating labeled as XClimate with values between 0 and 10 was created using a linear approach between the climate zone with the highest CDD (XClimate = 10) and the one with the lowest (XClimate = 0). Figure 4 presents the results with XClimate per climate zone.
2.5.4. Rating of Population Density
Population density is applied in the CDMI using data from Wang et al. [91], accessed through the SSP Scenario Database of the International Institute for Applied Systems Analysis (IIASA) [112], with data available at a high resolution of 1 km across the globe. These data consider individual regard of demographic issues such as the development of the total population, urbanization and migration [91]. Using population data on a resolution of 1 km allows detailed outcomes for investigating the total population per climate zone in the future. The rating (XPopulation) of the population density is oriented on a maximum value of 10,000 persons/km². This value was chosen as the maximum to avoid giving disproportionate weighting to data cells with a (calculated) population density of 100,000 or higher. Cells with a population density below 10,000 persons/km² are rated as linear; see Figure 5. The linear rating of the population density takes into account a double factor for double population density. If the climate and economic conditions for two cells are the same, but the population is double in one area compared to the other, the CDMI will result in a double value. Therefore, each resident receives the same value. For the 2020 analysis, population data from SSP3 have been applied, being closest in terms of world population compared to data from the United Nations Development Program (UNDP).
2.5.5. Rating of Economic Power
Economic power in the methodology is considered as GDP per capita, as income convergence is not part of SSP scenarios [112]. This is considered sufficient as the GDP and the income level show a vastly consistent relationship [113]. This applies in particular to low- and medium-income countries [114]. The representation of economic power, in contrast to population density, does not take into consideration a linear relationship between rating and GDP per capita. Instead, a logarithmic approach was followed (Figure 6). It is to consider, that rising economic power does not forcibly correlate with higher meeting of cooling demand. Instead, the fast-rising GDP of countries of lower income is of relevance [16]. In contrast to the two previous CDMI factors, economic power is considered only on an international level, not considering different values within a country. A low economic power in a country is represented in a low rating, so the likeliness that the people invest in space cooling is represented as low. This takes into account, that the population in countries of low economic power rather answer their base-level goods. However, the rating increases strongest for GDP/capita below 10,000 $/capita. Therefore, investing in cooling applications is significantly more likely, once the basic needs are fulfilled. In combination with a high climatic rating the acquisition is considered as a priority and the CDMI increases. Country-specific data for population are based on Samir et al. [115], country-specific data for national GDP (in 2005 $ PPP) are based on Cuaresma [23] and geographic data for GIS representation are based on Natural Earth Data [116]. Data for country-specific GDP/capita in 2020 are derived from World Bank [94]. For countries and territories without data given for 2020 (such as South Sudan, Guadeloupe or Norfolk Islands), nor for 2050 scenarios, a GDP of 1000 $/capita were used, to show at least some representation, except for Venezuela and the island of Taiwan were data from the IMF [117] were used. For countries and territories not represented by Cuaresma [23], the values of 2020 have been maintained for 2050 scenarios. Figure 6 shows the applied rating (XEconomic Power) of GDP, with a maximum rating of 30,000 $/capita (PPP 2011).
2.5.6. Calculation of CDMI
The index derives from the multiplication of the three named parameters. Each of the three parameters is rated with values from 0 to 10. These parameters are then multiplied with each other. This ensures that if any of the parameters have a low value, the CDMI is directly impacted.
Figure 7 shows the methodology of CDMI calculation. The data information of the three parameters is stored in three raster grids. The multiplication of this information leads to the CDMI results.
Table 2 presents the datasets used for CDMI calculation. Different datasets were used, considering the referenced period and scenario.
2.6. Solar Thermal Cooling Index
2.6.1. Developed Methodology
The aim of the Solar Thermal Cooling Index (STCI) is to illustrate in a simplified way how promising or limited a selected solar cooling system is at a specific point in the world. For this approach, GIS software (QGIS) was also used to create geographic maps based on environmental and climate parameters. The systems considered are solar-thermal-fired only. A short comparison of the system is provided in the following Table 3. The two absorption chillers (AbC) differ in that one uses ammonia (chemical formula: NH3) as refrigerant and water as sorption material, whereas the other uses water as the refrigerant and Lithium-Bromide (chemical formula: LiBr) as liquid sorption material.
The STCI simplifies the concept of solar thermal cooling systems, considering if operation is possible and the influence of heat source temperature on solar yield. Parameters such as additional system components or system costs are not taken into account.
First, the availability of solar radiation is represented by the Global Horizontal Irradiation (GHI). Second, based on water stress, ambient temperatures and climatic conditions, the lowest possible cooling temperature was calculated.
2.6.2. Availability of Solar Radiation and Solar Thermal Collector Efficiency
This parameter indicates the availability of solar radiation in a simplified way, using the GHI with average data per m² and day. Solar irradiance is crucial for the solar thermal cooling system to provide the required thermal capacity to run the chiller. As written in Table 3, the different types of chillers run at different heat source temperatures. The yield of a solar collector strongly depends on its structure. An evacuated tube collector (ETC) was considered for this analysis because it was able to serve all the required temperatures on the chillers’ hot side. Even though the availability of solar radiation is simplified in the STCI, the performance of the ETC in respect of both desired outlet temperature and ambient temperature was considered. The following two factors were considered: the hotter Tamb, the more efficient the ETC. The higher the desired collector outlet temperature, the less efficient the ETC. The impact on desired outlet temperature, GHI and ambient temperature is shown in Figure 8.
2.6.3. Ambient Temperature
The ambient temperature is respected not only in the efficiency of solar thermal collectors but also in its impact on a chillers COPth. It is to separate between dry and wet bulb air temperatures, speaking of the possibility of make use of evaporative cooling. The STCI uses the average temperature of the warmest month, according to data from Cui et al. [19].
2.6.4. Water Stress (WS)
This parameter affects heat rejection. There are open wet, closed wet, dry and hybrid coolers to reject excess heat from the chiller to the ambient. Most efficient is the application of open wet coolers, as they can cool down the medium to wet bulb temperature [118]. One of the most significant disadvantages of open wet coolers is the consumption of water. Therefore, water availability is the third parameter in the STCI, given as water stress using projected data from the World Resources Institute [119]. “Water stress (WS) is an indicator of competition for water resources and is defined informally as “the ratio of demand for water by human society divided by available water” [119]. It considers both the rising water demand by humans using SSP as well as the change in water supply due to climatic developments using RCP. The spatial data on WS allows us to determine whether wet cooling is a technical option.
2.6.5. Climate Zone
Dry coolers are applicable in every climate. Wet coolers, however, perform best if the ambient temperature is rather dry than humid to make use of evaporative cooling. Though, to check if the climate has potential for wet cooling applications, it is instructed in the STCI that wet cooling is only for climates with dry summers, such as BWh, BWk, BSh, BSk, Csa, Csb, Csc, Dsa, Dsb, Dsc and Dsd in the Köppen–Geiger climate classification. An overview of climate zone descriptions can be found in Appendix A.
2.6.6. Calculation of STCI
The STCI considers two conditions. The first condition is whether the sorption chiller can operate at the lowest cooling temperature possible. This condition takes into consideration the opportunity to run dry or wet coolers. The second condition is the availability of solar irradiance and the temperature-specific efficiency of evacuated tube collectors. The inlet temperature of the cooling temperature Tcool of the chiller is limited by the maximum temperature; see Table 3. It is advantageous if a cooling system can still be operated at high outside temperatures, thus with high cooling temperatures. The resulting chiller inlet temperature exiting a dry cooler is fixed as follows:
The resulting chiller inlet temperature exiting a wet cooler is fixed as follows:
Wet coolers are preferred in the STCI, but applied only if the climate zone has dry summer and if the WS is lower than 0.4 (values ≥ 0.4 equal high WS). Thus, the selection of the resulting cooling temperature depends on these two criteria, summarized in the following two conditions:
The calculated cooling temperature is then linear rated from 0.5 (highest Tcool) to 1 (25 °C) individually for each chiller type, pictured in the parameter YT,cool. This relation is shown in Figure 9.
The STCI is calculated by multiplying the GHI with the rating of cooling temperature and the efficiency of ETC at the desired heat source temperature of the chiller. This way, the STCI gives combined information on whether a specific chiller can run in the first place, where the COPth is lower than in other places and how much solar radiation is available. Figure 10 shows the methodology of the STCI calculation graphically, and Table 4 presents the applied data for the STCI.
3. Results
The outcome of CDMI and STCI results in newly generated raster grids as .tif data file. These raster grids have a high spatial resolution. The values for each raster cell were analyzed using commands in QGIS software and further treated in Microsoft Excel.
3.1. Cooling Demand Market Index (CDMI)
The CDMI results are distributed at a resolution of 30 arc-seconds (approximately 1 km). It represents the momentary situation for each year and scenario. The values of CDMI reach from 0, for example, on Svalbard Island, up to 1000, for example, in Qatar, which combines high economic power with high population density in the center and is situated in Köppen–Geiger climate zone BWh, the highest rated in the methodology.
The spatial results In total show high variation. The most striking parameter on the CDMI from a global perspective is population density. Low-populated areas with a population density below 50 are generally related to low CDMI values, regardless of the climate zone or economic power of a country. This follows the proposed methodology to picture the demand for space cooling based on human activity displayed as population density. The most eye-catching on a global map in Figure 11 is the nationwide high CDMI for India.
The different data for the three applied parameters cause a partly great deviation between the results for 2050. For further analysis of the data, the total national CDMI is defined as the cumulative sum of all individual CDMI raster values within a country’s borders. The worldwide CDMI will rise between an additional 99% in SSP4-6.0 and 142% in SSP5-8.5. These two scenarios show the greatest deviation, not only in total but also for single countries. The total national CDMI for Canada in SSP5-8.5 is 66% higher than in SSP4-6.0 (due to strong climate zone shift), whereas for Iraq it is 16% lower (due to lower population).
The national CDMI varies between the scenarios for 2050. Figure 12 shows the 20 countries with the highest national CDMI worldwide for each scenario. India has by far the highest demand, followed by China in each case. The next three countries are Indonesia, Nigeria and the United States, but they vary in their order depending on the scenario. Following these three countries, the national CDMI shows a small drop to Pakistan and Brazil, followed by Mexico and Egypt. In total, these nine countries are the ones with the highest national CDMI for each scenario. Other countries experience varying positions on the list. These results match in general with the forecast of the IEA report Future of Cooling [6] (p. 62), that until 2050 the energy consumption for space cooling will increase most intensively in India, followed by China, Indonesia, the Middle East, the US and then Brazil and Mexico. Significant in every future scenario are the outstanding results for India, which has a cumulative CDMI more than twice as high as China in SSP5-8.5. The total Indian population lies between 1.54 billion (SSP5) and 1.73 billion (SSP2). This is hundreds of millions more people compared to the next highest population in China. Another aspect is the hot climate in India, which is expanding further due to global warming. The last aspect is the significant economic growth from less than 2000 $/capita up to 14,600 $/capita (SSP4) and 30,400 $/capita (SSP5).
The accumulated CDMI results for scenario SSP4-6.0 are the lowest among the four scenarios. The reason for this is primarily the low economic power in SSP4. The worldwide median of national GDP per capita in SSP4 is approximately 16,000 $/capita, whereas it is nearly twice as much in SSP5, at 29,600 $/capita. This difference in economic power between these two pathways has more effect than the worldwide projected population, which is around 560 million higher in SSP4 compared to SSP5. For SSP1 and SSP2, the median value of national GDP per capita accounts for about 25,700 $/capita and 22,200 $/capita, respectively.
The strongest development of CMDI from 2020 to SSP5-8.5 is identified for Burundi and the Democratic Republic of the Congo. Those two countries show a high rise in GDP and population growth. Additionally, Greenland shows a strong potential variation in CDMI, but primarily because the total values are very low in 2020 and small changes go along with high percentual changes. However, 13 of the top 20 countries in growing CDMI are located in Africa; see Figure 13.
The CDMI maps are most expressive at a small scale. The demographic developments also consider movements and urban growth. The results of the CDMI do not represent the installed stack of space cooling devices, but the potential demand for cooling applications instead. Thus, there is a great change in CDMI, especially in developing countries, whereas it is increasing less in developed countries. Figure 13 shows exemplary CDMI results for locations in India, Nigeria and England, respectively. These locations represent areas of different demographic distribution as well as different economic developments. For the southeast region of England, including London, there is only a minor change from 2020 to the different 2050 scenarios. The reasons for this are a neglectable change in population, a constant high economic power, which has the highest rating in 2020 already, and no change in climate zone. The developments pictured in Figure 14a,b show, first of all, great difference between 2020 and 2050.
However, the different scenarios for 2050 for India and Nigeria show a difference in total national CDMI of 24.2% and 13.9% between SSP4-6.0 and SSP5-8.5, respectively. For 2020, the CDMI for the pictured regions of Patna, India, and Lagos, Nigeria, are primarily driven by the high population and the already CDD intensive climates.
The CDMI shows a high variety of values. A high CDMI value requires high base values in the three parameters, such as high population density, high economic power and a cooling-intensive climate. Raster cells with a CDMI ≥500 are called “hot spots” in the following analysis. Those hot spots are already present in the year 2020. Figure 15 presents the 20 countries with highest area of CDMI hot spots for 2020 and 2050, SSP5-8.5 scenario. The total number of hot spots rises sharply from 2020 to 2050 as areas of high population density lie in developing countries. The results for hot spots match demographic parameters such as very high population density in Asian and African countries as well as the fact that approximately 90% of future urbanization is happening in warm climates in developing countries [20]. The presence of densely populated urban areas is a necessity for a hot spot. In 2020, most hot spots are located in Mexico, followed by Peru and Brazil. Spain is the only European Country in the top 20 countries with the highest area of hot spots. Most countries of this list are located either in Asia or South America. This changes drastically for the scenario SSP5-8.5. Of the 20 countries for 2050 with the highest number of hot spots, 11 new countries, such as India, Pakistan or Nigeria, join the list. The ranking in cooling hot spots does not correlate with the ranking in cumulative national CDMI.
3.2. Future Solar Thermal Cooling Index
The results of the STCI are given in a new raster grid with values between 0 and 5. They take into account only technical, not economic, information and differ for each cooling system. The absorption chiller (AbC) using ammonia (NH3) and the adsorption chiller (AdC) using zeolite show the largest area of application, covering 100% of the respected area on the map. Based on the data quality of the applied sources, no data for Global Horizontal Irradiation (GHI) are available north of 60° latitude, resulting in a spatial limit of the STCI. Furthermore, the geographic dataset for water stress (WS) has areas of no data across the world, especially in Australia. Areas, where no data is available, are colored white in the figures. This causes another limitation in the spatial coverage of the STCI.
Figure 16 and Figure 17 show the STCI results on a global scale for AbC on NH3 and for AbC using Lithium-Bromide (LiBr). It shows that the absorption chillers using NH3 can operate in all areas considered in the methodology. Absorption chillers using LiBr, however, are not able to operate in parts of India, Arabian Peninsula and parts of the Sahara due to the too hot and/or too humid climate conditions. The capability to operate at high cooling temperatures is therefore advantageous and expands the range of applications. Due to the possibility of running on wet chillers in parts of the Sahara region, the STCI is higher compared to southern regions in the area of the Congo. The STCI is driven by solar availability. As a result, Australia has higher STCI results compared to Europe, even though the temperature is hotter, causing lower values for YT,cool.
3.3. Potential of Solar Thermal Cooling Based on Both Indeces
The potential market for individual solar thermal cooling systems is analyzed by accumulating the CDMI covered by the area of potential application based on STCI. The results are presented in Table 5. Due to its limitation in maximum condensing temperature, LiBr AbC has the lowest market share. Absorption chillers using NH3 and adsorption chillers using zeolite can cover all cooling demands. A deviation is given between the indices because the areas are not filled with data from [119].
4. Discussion
This study presents two innovative methodologies to create simplified statements on both demand for space cooling solutions using the Cooling Demand Market Index (CDMI) and predicting the potential performance of different solar thermal cooling systems using the Solar Thermal Cooling Index (STCI).
4.1. Discussion on Results
The results for the CDMI represent a momentary state of economic demand for space cooling equipment. The results don’t consider any potential installation of equipment in the previous years before 2050. The CDMI results show that the global demand for space cooling appliances will increase due to climatological and socioeconomic developments. Results cannot be directly compared with installed cooling capacity or cooling-related energy consumption. Driving factors for the development of the CDMI are economic growth and the rise of the population. The greatest increase from 2020 to 2050 was experienced in countries located in southern and central Asia and sub-Saharan Africa. This economic development correlates with the forecasts from the African and Asian Development Banks [121,122]. Scenario SSP5-8.5 shows the highest area of cooling hot spots, which is 78% higher compared to SSP4-6.0. This is reasonable as SSP5-8.5 is based on the combination of SSP5 described as “Fossil-fueled development—Taking the highway” [103] and RCP8.5, considering the strongest global warming scenario with a mid-term increase in global surface temperature of 2.4 °C and in the long term of 4.4 °C [2] (p. 14). The correlation of the three different parameters causes an individual development of CDMI for each country and region. Furthermore, the countries show unique behavior between the scenarios that may not match global trends. Outstanding are the results for India, which has both the highest national CDMI and the highest number of hot spots worldwide in each scenario. India will be of great interest for the future cooling market as well as experiencing extreme heat waves and agriculture risks [123]. In general, Southern Asia will experience higher temperatures and increased water stress in the future [119].
4.2. Uncertainties in Methodologies
There is potential for improving the level of detail and increasing the basic dataset for refining the CDMI, namely through integrating data resembling urbanization with the associated UHI as well as the Gini coefficient regarding income inequality. Using the same value of economic power across nations does not take into account the deviation between rural areas characterized by agriculture and urban areas defined through service or manufacturing. The need for cooling in the CDMI is based on population density. An alternative could be to base the need for cooling on the floor area of buildings. This way, the needs of non-residential buildings, such as hotels or day-use offices, could be integrated as well. Another challenge is the integration of global warming and increased cooling demand within a climate zone. Further information and data are required to estimate the increased cooling demand due to global warming. Data in the quality of CDD have more expression about the cooling demand compared to forecasts of average daily or monthly air temperature. The adaptation of a building’s design and the aligned selection of materials are crucial to passively lowering the space cooling demand. On the other hand, this affects the validity of CDD as a parameter to indicate space cooling demand.
The STCI results outline the potential limitations of different sorption chillers in combination with the potential solar thermal yield. It is a simplified method to cover different solar thermal cooling systems using fixed data for future forecasts, such as the average daily GHI and the mean air temperature of the warmest month. The results show indications for solar thermal systems that are not limited to the results of the STCI. The application of solar thermal cooling systems doesn’t only depend on environmental conditions. Other aspects, such as the economic payback time, the establishment of a global sales market, its thermal capacity and the customers’ awareness, play a vital role in the spread of those systems. The performance of a solar thermal system must be adapted to the correspondent application and process. More detailed data to use in the individual parameters, such as wet bulb temperature, humidity or hourly values for solar radiation, would lead to more expressive results in the STCI. The study and its results serve as a first step to investigating the issue of future cooling demand. Further studies with more detailed background data are recommended.
4.3. Comparison to Other Studies
Previous studies have considered similar parameters to create future predictions, such as on future national cooling energy demand. The Cooling Demand Market Index (CDMI), however, contributes new data and information on the future demand for cooling applications at a high spatial resolution of ≤1 km on a global scale. The applied data are based on RCP and SSP scenarios and picture different future developments, which offers the possibility to see the results in a picture with related studies.
The CDMI is not to be compared with the installed cooling capacity or the number of cooling applications. This makes the direct comparison of results from other studies more difficult on the one hand, but offers new information on the other hand, which has not been available yet. However, the CDMI was compared with previous projections, such as the International Energy Agency reports “The Future of Cooling” and “The Future of Cooling Southeast Asia”. The results of this article match the statement “In many countries, especially in Africa and South Asia, household fan ownership is expected to grow rapidly as more people gain access to electricity, providing greater comfort until households can afford to buy an AC” [6] (p. 22). Furthermore, results match the future development of an increase in installed cooling capacity in residential AC cooling capacity according to the Baseline Scenario of the Future of Cooling report, see Figure 1. Other studies, such as [108] or [109], target population that is affected by a cooling gap, respectively, and the energy consumption related to residential space cooling accompanied by CO2 emissions. The outstanding role of India when it comes to the demand for space cooling is in line with the results of [108]. The driving role of economic growth is backed by literature: “Besides climate change, cooling demand increase is mainly due to income growth in regions with a high potential cooling demand […]” [108] (p. 513). It is to say that the majority of previous studies do not present results on a national level aside from the most relevant ones, which are the USA, China and India. However, the results of this article match the statements and global developments of the named studies.
In contrast to the previous studies, the results of this study are characterized by their very high spatial resolution on a global level. This offers detailed information to specify the future demand for cooling applications in individual regions, cities, agglomerations and climates. The results indicate where options like adaptation and optimization of buildings and urban areas are promising, or even necessary. A further unique feature of this study is the comparison of spatial data on cooling systems with the CDMI maps.
5. Conclusions
The demand for space cooling is growing on a global scale, without a doubt. Buildings must adapt to be prepared for future, not historic, climate conditions. Demand for heating decreases while cooling demand increases. The structures of cities and the architecture and operation strategies of buildings must adapt to the new challenges. This includes the consequent integration of passive measures.
Two new spatial indices for forecasts of both demands for cooling applications and the potential and limitations of solar thermal cooling systems have been developed in the framework of this study. The Cooling Demand Market Index (CDMI) is the first of its kind to present at global, high-resolution raster grid statement on the future demand for cooling applications combining demographic, environmental and economic data. The results show the following:
- The growing population and especially the increasing economic power of developing countries are the main drivers of future demand for cooling appliances.
- In all four future scenarios analyzed, India, China, the United States, Indonesia, Nigeria, Pakistan, Brazil, Mexico and Egypt are the countries with the highest CDMI in 2050.
- The highest percentage increase in national CDMI is found in African countries.
- Cooling demand hot spots, which are characterized by high population density, hot climate and sufficient economic power to purchase cooling applications, are primarily located in Africa, south and southeast Asia and south America.
- The STCI indicates the highest potential of solar thermal cooling systems, especially in Africa and the United States.
- The application of wet coolers is restricted as arid air conditions and the availability of water are required. This hinders the application of chillers using LiBr, which require a lower cooling temperature than other chillers, in large areas of the world.
- Regarding sorption chiller systems, absorption chillers using ammonia and adsorption chillers using zeolite have the potential to address the highest CDMI.
Author Contributions
Conceptualization, M.S.; methodology, M.S. and U.J.; software, M.S.; validation, M.S. and U.J.; formal analysis, M.S., W.S., U.J. and D.N.; investigation, M.S. and U.J.; resources, M.S.; data curation, M.S.; writing—original draft preparation, M.S.; writing—review and editing, M.S., W.S., U.J. and D.N.; visualization, M.S.; supervision, W.S. and U.J.; project administration, D.N.; funding acquisition, U.J. and D.N. All authors have read and agreed to the published version of the manuscript.
Funding
This research conducted under Building Energy Efficiency in Nepal (BEEN) project was funded by European Commission under the SWITCH-Asia-promoting sustainable consumption and production program, contract number ACA/2021/428-648 and conducted under IEA SHC Task 65 funded through the Austrian Research Promotion Agency (FFG), the program “research cooperation international energy agency” and the Federal Ministry on Climate Action, Environment, Energy, Mobility Innovation and Technology, contract number 883011.
Institutional Review Board Statement
Not applicable.
Informed Consent Statement
Not applicable.
Data Availability Statement
The data presented in this study on CDMI and STCI are available on request from the corresponding author. Data are only available for non-commercial usage. The data are not publicly available due to terms of privacy.
Conflicts of Interest
The authors declare no conflict of interest.
Abbreviations and Symbol
| Abbreviation | Meaning |
| AbC | Absorption Chiller |
| AdC | Adsorption Chiller |
| ASEAN | Association of Southeast Asian Nations |
| BEEN | Building Energy Efficiency in Nepal (SWITCH-Asia project) |
| CDD | Cooling Degree Days |
| CDMI | Cooling Demand Market Index |
| COPth | Thermal Coefficient of Performance |
| ETC | Evacuated Tube Collector |
| GDP | Gross Domestic Product |
| GHG | Greenhouse Gases |
| GHI | Global Horizontal Irradiation |
| GIS | Geographical Information System |
| HDD | Heating Degree Days |
| IEA | International Energy Agency |
| IIASA | International Institute for Applied Systems Analysis |
| IPCC | Intergovernmental Panel on Climate Change |
| PCM | Phase Change Material |
| PVT | Photovoltaic Thermal (Collector) |
| SHC | Solar Heating and Cooling |
| SHGC | Solar Heat Gain Coefficient |
| STCI | Solar Thermal Cooling Index |
| UHI | Urban Heat Island |
| VCC | Vapor Compression Chiller |
| WS | Water Stress |
| Symbol | Meaning |
| XClimate | Rating of climate zone (following Köppen-Geiger climate classification) between 0 and 10. This dimensionless factor is based on an analysis of CDD. A high score corelates with a high number of CDD and represents a higher demand for cooling. |
| XPopulation | Rating of population density with values between 0 (no population) to 10 (population density of ≥10,000 persons/km²). |
| XEconomic Power | Rating of economic power per country or region with values between 0 and 10. It’s based on the national GDP per capita. The rating increases logarithmically from 0 (0 $/capita) to 10 (≥30,000 $/capita). |
| Tcool, dry | Inlet heat rejection temperature running into the chiller, exiting a dry cooler. This temperature is defined as 2 K above ambient dry bulb temperature. |
| Tcool, wet | Inlet heat rejection temperature running into the chiller, exiting a wet cooler. This temperature is defined as 3 K below ambient dry bulb temperature. |
| Tcool | Resulting inlet heat rejection temperature to consider in the STCI calculation. Based on climate condition, it’s either Tcool,dry or Tcool,wet. |
| YT,cool | Rating of Tcool, based on individual behavior of different chiller types between 0.5 and 1. |
| Solar yieldTm | This parameter indicates the solar thermal yield of an evacuated tube collector based on the average daily solar radiation per m². |
Appendix A

Table A1.
List of climate zone codes and description according to Köppen-Geiger climate classification [111].
Table A1.
List of climate zone codes and description according to Köppen-Geiger climate classification [111].
| Code | Description |
|---|---|
| Af | Tropical, rainforest |
| Am | Tropical, monsoon |
| Aw | Tropical, savannah |
| BWh | Arid, desert, hot |
| BWk | Arid, desert, cold |
| BSh | Arid, steppe, hot |
| BSk | Arid, steppe, cold |
| Csa | Temperate, dry summer, hot summer |
| Csb | Temperate, dry summer, warm summer |
| Csc | Temperate, dry summer, cold summer |
| Cwa | Temperate, dry winter, hot summer |
| Cwb | Temperate, dry winter, warm summer |
| Cwc | Temperate, dry winter, cold summer |
| Cfa | Temperate, no dry season, hot summer |
| Cfb | Temperate, no dry season, warm summer |
| Cfc | Temperate, no dry season, cold summer |
| Dsa | Cold, dry summer, hot summer |
| Dsb | Cold, dry summer, warm summer |
| Dsc | Cold, dry summer, cold summer |
| Dsd | Cold, dry summer, very cold winter summer |
| Dwa | Cold, dry winter, hot summer |
| Dwb | Cold, dry winter, warm summer |
| Dwc | Cold, dry winter, cold summer |
| Dwd | Cold, dry winter, very cold winter |
| Dfd | Cold, no dry season, hot summer |
| Dfb | Cold, no dry season, warm summer |
| Dfc | Cold, no dry season, cold summer |
| Dfd | Cold, no dry season, very cold winter |
| ET | Polar, tundra |
| EF | Polar, frost |
References
- World Metereological Organization. Past Eight Years Confirmed to Be the Eight Warmest on Record; Press Release Number: 12012023; WMO: Geneva, Switzerland, 2023. [Google Scholar]
- Masson-Delmotte, V.; Zhai, P.; Pirani, A.; Connors, C.P.; Péan, C.; Berger, S.; Caud, N.; Chen, Y.; Goldfarb, L.; Gomis, M.I. (Eds.) IPCC, 2021: Summary for Policymakers. In Climate Change 2021: The Physical Science Basis. Contribution of Working Group I to the Sixth Assessment Report of the Intergovernmental Panel on Climate Change; Cambridge University Press: Cambridge, UK; New York, NY, USA, 2021; pp. 3–32. [Google Scholar]
- Copernicus Climate Change Service. Global Climate Highlights: 2022 Saw Record Temperature in Europe and across the World. Available online: https://climate.copernicus.eu/2022-saw-record-temperatures-europe-and-across-world (accessed on 1 March 2023).
- Pörtner, H.-O.; Roberts, D.C.; Adams, H.; Adelekan, I.; Adler, C.; Adrian, R.; Aldunce, P.; Ali, E.; Ara Begum, R.; Bednar-Friedl, B.; et al. Climate Change 2022: Impacts, Adaptation and Vulnerability: Contribution of Working Group II to the Sixth Assessment Report of the Intergovernmental Panel on Climate Change; Cambridge University Press: Cambridge, UK; New York, NY, USA, 2022. [Google Scholar]
- Pavanello, F.; de Cian, E.; Davide, M.; Mistry, M.; Cruz, T.; Bezerra, P.; Jagu, D.; Renner, S.; Schaeffer, R.; Lucena, A.F.P. Air-conditioning and the adaptation cooling deficit in emerging economies. Nat. Commun. 2021, 12, 6460. [Google Scholar] [CrossRef]
- Dean, B.; Dulac, J.; Morgan, T.; Remme, U. The Future of Cooling: Opportunities for Energy-Efficient Air Conditioning. 2018. Available online: https://www.iea.org/reports/the-future-of-cooling (accessed on 8 June 2023).
- Zachariah, M.; Arulala, T.; Krishna, A.R.; Saeed, F.; Jha, R.; Dhasmana, M.K.; Mondal, A.; Bonnet, R.; Vautard, R.; Philip, S.; et al. Climate Change Made Devastating Early Heat in India and Pakistan 30 Times More Likely. 2022. Available online: https://www.worldweatherattribution.org/climate-change-made-devastating-early-heat-in-india-and-pakistan-30-times-more-likely/ (accessed on 13 January 2023).
- Rousi, E.; Kornhuber, K.; Beobide-Arsuaga, G.; Luo, F.; Coumou, D. Accelerated western European heatwave trends linked to more-persistent double jets over Eurasia. Nat. Commun. 2022, 13, 3851. [Google Scholar] [CrossRef]
- Amodeao, M.; Bauer, M.; Kyra, B.; Cawley, H.; Chadwick, S.; Eby, M.; Freeman, N.; Hoang, T.; Hsieh, H.; Kaminski, M.; et al. The 6th National Risk Assessment: Hazardous Heat; First Street Foundation: New York, NY, USA, 2022. [Google Scholar]
- Summary for Policymakers. In Global Warming of 1.5°C: An IPCC Special Report on the Impacts of Global Warming of 1.5°C above Pre-Industrial Levels and Related Global Greenhouse Gas Emission Pathways, in the Context of Strengthening the Global Response to the Threat of Climate Change, Sustainable Development, and Efforts to Eradicate Poverty; IPCC (Ed.) Cambridge University Press: Cambridge, UK; New York, NY, USA, 2022; pp. 3–24. ISBN 9781009157940. [Google Scholar]
- World Bank Group. World GDP 1960–2023. Available online: https://www.macrotrends.net/countries/WLD/world/gdp-gross-domestic-product (accessed on 1 March 2023).
- IEA. Key World Energy Statistics 2021: Final Consumption, World Total Final Consumption (TFC) by Source. Available online: https://www.iea.org/reports/key-world-energy-statistics-2020/final-consumption (accessed on 1 March 2023).
- IEA. Global Energy-Related CO2 Emissions, 1990–2020. Available online: https://www.iea.org/data-and-statistics/charts/global-energy-related-co2-emissions-1990-2020 (accessed on 1 March 2023).
- United Nations, Department of Economic and Social Affairs, Population Division. World Population Prospects: The 2022 Revision, Online Edition. Available online: https://population.un.org/dataportal/data/indicators/49/locations/900/start/1950/end/2100/line/linetimeplotsingle (accessed on 1 March 2023).
- IEA. Space Cooling. Available online: https://www.iea.org/reports/space-cooling (accessed on 1 March 2023).
- IEA. The Future of Cooling in Southeast Asia; International Energy Agency: Paris, France, 2019. [Google Scholar]
- Sherman, P.; Lin, H.; McElroy, M. Projected global demand for air conditioning associated with extreme heat and implications for electricity grids in poorer countries. Energy Build. 2022, 268, 112198. [Google Scholar] [CrossRef]
- Li, D.H.; Yang, L.; Lam, J.C. Impact of climate change on energy use in the built environment in different climate zones—A review. Energy 2012, 42, 103–112. [Google Scholar] [CrossRef]
- Cui, D.; Liang, S.; Wang, D. Observed and projected changes in global climate zones based on Köppen climate classification. WIREs Clim. Chang. 2021, 12, e701. [Google Scholar] [CrossRef]
- Sachar, S.; Campbell, I.; Kalanki, A. Solving the Clobal Cooling Challenge: How to Encounter the Climate Threat from Room Air Conditoners. 2018. Available online: https://rmi.org/wp-content/uploads/2018/11/Global_Cooling_Challenge_Report_2018.pdf (accessed on 1 August 2022).
- SWITCH-Asia Programme; European Commission. Buliding Energy Efficiency in Nepal (BEEN): Promoting Climate-Responsive Building Design and Retrofitting. Available online: https://www.switch-asia.eu/project/building-energy-efficiency-in-nepal-been/ (accessed on 19 March 2023).
- United Nations, Department of Economic and Social Affairs, Population Division. World Urbanization Prospects: The 2018 Revision. 2018. Available online: https://population.un.org/wup/Download/ (accessed on 7 March 2023).
- Crespo Cuaresma, J. Income projections for climate change research: A framework based on human capital dynamics. Glob. Environ. Chang. 2017, 42, 226–236. [Google Scholar] [CrossRef] [Green Version]
- Wagner, A. Exploring Occupant Behavior in Buildings: Methods and Challenges; Springer: Cham, Switzerland, 2018; ISBN 978-3-319-61464-9. [Google Scholar]
- Díaz, J.A.; Jiménez, M.J. Experimental assessment of room occupancy patterns in an office building. Comparison of different approaches based on CO2 concentrations and computer power consumption. Appl. Energy 2017, 199, 121–141. [Google Scholar] [CrossRef]
- Pacheco, R.; Ordóñez, J.; Martínez, G. Energy efficient design of building: A review. Renew. Sustain. Energy Rev. 2012, 16, 3559–3573. [Google Scholar] [CrossRef]
- Gupta, N.; Tiwari, G.N. Review of passive heating/cooling systems of buildings. Energy Sci. Eng. 2016, 4, 305–333. [Google Scholar] [CrossRef] [Green Version]
- Al Dakheel, J.; Tabet Aoul, K. Building Applications, Opportunities and Challenges of Active Shading Systems: A State-of-the-Art Review. Energies 2017, 10, 1672. [Google Scholar] [CrossRef] [Green Version]
- Schnieders, J.; Feist, W.; Schulz, T.; Benjamin, K.; Rongen, L.; Wirtz, R. Passivhäuser für Verschiedene Klimazonen: Abschlussbericht; gefördert unter dem Az: 26577 von der Deutschen Bundesstiftung Umwelt; Wolfgang Feist: Darmstadt, Germany, 2011. [Google Scholar]
- Friedrichsen, S. Nachhaltiges Planen, Bauen und Wohnen; Springer: Berlin/Heidelberg, Germany, 2018; ISBN 978-3-662-56552-0. [Google Scholar]
- Shree, V.; Goyal, N.; Saxena, A.; Bhattacharyya, S.; Dwivedi, A.; Goel, V. Assessment of thermal loading in energy-efficient buildings: Parametric review on the window design aspects. J. Therm. Anal. Calorim. 2023, 148, 2703–2718. [Google Scholar] [CrossRef]
- Elaouzy, Y.; El Fadar, A. Energy, economic and environmental benefits of integrating passive design strategies into buildings: A review. Renew. Sustain. Energy Rev. 2022, 167, 112828. [Google Scholar] [CrossRef]
- Jomehzadeh, F.; Nejat, P.; Calautit, J.K.; Yusof, M.B.M.; Zaki, S.A.; Hughes, B.R.; Yazid, M.N.A.W.M. A review on windcatcher for passive cooling and natural ventilation in buildings, Part 1: Indoor air quality and thermal comfort assessment. Renew. Sustain. Energy Rev. 2017, 70, 736–756. [Google Scholar] [CrossRef]
- Kolokotsa, D.-D.; Giannariakis, G.; Gobakis, K.; Giannarakis, G.; Synnefa, A.; Santamouris, M. Cool roofs and cool pavements application in Acharnes, Greece. Sustain. Cities Soc. 2018, 37, 466–474. [Google Scholar] [CrossRef]
- Yuan, J.; Emura, K.; Sakai, H. Evaluation of the solar reflectance of highly reflective roofing sheets installed on building roofs. J. Build. Phys. 2013, 37, 170–184. [Google Scholar] [CrossRef]
- D’Orazio, M.; Di Perna, C.; Di Giuseppe, E. Green roof yearly performance: A case study in a highly insulated building under temperate climate. Energy Build. 2012, 55, 439–451. [Google Scholar] [CrossRef]
- Jaffal, I.; Ouldboukhitine, S.-E.; Belarbi, R. A comprehensive study of the impact of green roofs on building energy performance. Renew. Energy 2012, 43, 157–164. [Google Scholar] [CrossRef]
- Gholamibozanjani, G.; Farid, M. A Critical Review on the Control Strategies Applied to PCM-Enhanced Buildings. Energies 2021, 14, 1929. [Google Scholar] [CrossRef]
- Zeinelabdein, R.; Omer, S.; Gan, G. Critical review of latent heat storage systems for free cooling in buildings. Renew. Sustain. Energy Rev. 2018, 82, 2843–2868. [Google Scholar] [CrossRef]
- Souayfane, F.; Fardoun, F.; Biwole, P.-H. Phase change materials (PCM) for cooling applications in buildings: A review. Energy Build. 2016, 129, 396–431. [Google Scholar] [CrossRef]
- Uehara, Y.; Uno, T. Evaluation of Energy-Saving and Improvement of the Thermal Environment of the House with High Thermal Insulation, Heat Storage Performance, and Fitting Adjustment. Energies 2022, 15, 6728. [Google Scholar] [CrossRef]
- Andric, I.; Kamal, A.; Al-Ghamdi, S.G. Efficiency of green roofs and green walls as climate change mitigation measures in extremely hot and dry climate: Case study of Qatar. Energy Rep. 2020, 6, 2476–2489. [Google Scholar] [CrossRef]
- Irshad, A.S.; Noori, A.G. Evaluating the effects of passive cooling and heating techniques on building energy consumption in Kandahar using CLTD method. Mater. Today: Proc. 2022, 57, 595–602. [Google Scholar] [CrossRef]
- Ávila-Hernández, A.; Simá, E.; Ché-Pan, M. Research and development of green roofs and green walls in Mexico: A review. Sci. Total Environ. 2022, 856, 158978. [Google Scholar] [CrossRef] [PubMed]
- Wijesuriya, S.; Kishore, R.A.; Bianchi, M.V.; Booten, C. Potential energy savings benefits and limitations of radiative cooling coatings for U.S. residential buildings. J. Clean. Prod. 2022, 379, 134763. [Google Scholar] [CrossRef]
- Garshasbi, S.; Feng, J.; Paolini, R.; Jonathan Duverge, J.; Bartesaghi-Koc, C.; Arasteh, S.; Khan, A.; Santamouris, M. On the energy impact of cool roofs in Australia. Energy Build. 2023, 278, 112577. [Google Scholar] [CrossRef]
- Clarivate. Web of Science—Search. Available online: https://www.webofscience.com/wos/woscc/basic-search (accessed on 19 March 2023).
- Duan, Z.; Zhan, C.; Zhang, X.; Mustafa, M.; Zhao, X.; Alimohammadisagvand, B.; Hasan, A. Indirect evaporative cooling: Past, present and future potentials. Renew. Sustain. Energy Rev. 2012, 16, 6823–6850. [Google Scholar] [CrossRef]
- Yang, Y.; Cui, G.; Lan, C.Q. Developments in evaporative cooling and enhanced evaporative cooling—A review. Renew. Sustain. Energy Rev. 2019, 113, 109230. [Google Scholar] [CrossRef]
- Ito, S.; Miura, N. Studies of Radiative Cooling Systems for Storing Thermal Energy. J. Sol. Energy Eng. 1989, 111, 251–256. [Google Scholar] [CrossRef]
- Ezekwe, C.I. Performance of a heat pipe assisted night sky radiative cooler. Energy Convers. Manag. 1990, 30, 403–408. [Google Scholar] [CrossRef]
- Vall, S.; Castell, A. Radiative cooling as low-grade energy source: A literature review. Renew. Sustain. Energy Rev. 2017, 77, 803–820. [Google Scholar] [CrossRef] [Green Version]
- Eicker, U.; Dalibard, A. Photovoltaic–thermal collectors for night radiative cooling of buildings. Sol. Energy 2011, 85, 1322–1335. [Google Scholar] [CrossRef]
- Wang, W.; Fernandez, N.; Katipamula, S.; Alvine, K. Performance assessment of a photonic radiative cooling system for office buildings. Renew. Energy 2018, 118, 265–277. [Google Scholar] [CrossRef]
- Su, M.A.; Ngarambe, J.; Santamouris, M.; Yun, G.Y. Empirical evidence on the impact of urban overheating on building cooling and heating energy consumption. iScience 2021, 24, 102495. [Google Scholar] [CrossRef]
- Mentaschi, L.; Duveiller, G.; Zulian, G.; Corbane, C.; Pesaresi, M.; Maes, J.; Stocchino, A.; Feyen, L. Global long-term mapping of surface temperature shows intensified intra-city urban heat island extremes. Glob. Environ. Chang. 2022, 72, 102441. [Google Scholar] [CrossRef]
- Moustris, K.P.; Zacharia, P.; Larissi, I.K.; Nastos, P.T.; Paliatsos, A.G. Cooling and Heating Degree-Days Calculation for representative Locations within the Greater Athens Area, Greece. Rhodes, Greece. Available online: https://www.researchgate.net/publication/233776116 (accessed on 18 August 2022).
- Boudali Errebai, F.; Strebel, D.; Carmeliet, J.; Derome, D. Impact of urban heat island on cooling energy demand for residential building in Montreal using meteorological simulations and weather station observations. Energy Build. 2022, 273, 112410. [Google Scholar] [CrossRef]
- Li, X.; Zhou, Y.; Yu, S.; Jia, G.; Li, H.; Li, W. Urban heat island impacts on building energy consumption: A review of approaches and findings. Energy 2019, 174, 407–419. [Google Scholar] [CrossRef]
- Mihalakakou, G.; Flocas, H.A.; Santamouris, M.; Helmis, C.G. Application of Neural Networks to the Simulation of the Heat Island over Athens, Greece, Using Synoptic Types as a Predictor. J. Appl. Meteorol. 2002, 41, 519–527. [Google Scholar] [CrossRef]
- Roy, S.; Akther, M.; Sumi, F.; Hoque, M.; Dutta, S. Factors Influencing Urban Heat Island Formation and its Effects on Public Health in Bangladesh. IOSR J. Environ. Sci. Toxicol. Food Technol. 2019, 13, 77–87. [Google Scholar]
- Dixon, P.G.; Mote, T.L. Patterns and Causes of Atlanta’s Urban Heat Island–Initiated Precipitation. J. Appl. Meteor. 2003, 42, 1273–1284. [Google Scholar] [CrossRef]
- Wardeh, Y.; Kinab, E.; Escadeillas, G.; Rahme, P.; Ginestet, S. Review of the optimization techniques for cool pavements solutions to mitigate Urban Heat Islands. Build. Environ. 2022, 223, 109482. [Google Scholar] [CrossRef]
- Wang, C.; Ren, Z.; Dong, Y.; Zhang, P.; Guo, Y.; Wang, W.; Bao, G. Efficient cooling of cities at global scale using urban green space to mitigate urban heat island effects in different climatic regions. Urban For. Urban Green. 2022, 74, 127635. [Google Scholar] [CrossRef]
- Algretawee, H.; Rayburg, S.; Neave, M. Estimating the effect of park proximity to the central of Melbourne city on Urban Heat Island (UHI) relative to Land Surface Temperature (LST). Ecol. Eng. 2019, 138, 374–390. [Google Scholar] [CrossRef]
- Semenzato, P.; Bortolini, L. Urban Heat Island Mitigation and Urban Green Spaces: Testing a Model in the City of Padova (Italy). Land 2023, 12, 476. [Google Scholar] [CrossRef]
- Lemoine-Rodríguez, R.; Inostroza, L.; Falfán, I.; MacGregor-Fors, I. Too hot to handle? On the cooling capacity of urban green spaces in a Neotropical Mexican city. Urban For. Urban Green. 2022, 74, 127633. [Google Scholar] [CrossRef]
- Alavipanah, S.; Wegmann, M.; Qureshi, S.; Weng, Q.; Koellner, T. The Role of Vegetation in Mitigating Urban Land Surface Temperatures: A Case Study of Munich, Germany during the Warm Season. Sustainability 2015, 7, 4689–4706. [Google Scholar] [CrossRef] [Green Version]
- Yu, Z.; Xu, S.; Zhang, Y.; Jørgensen, G.; Vejre, H. Strong contributions of local background climate to the cooling effect of urban green vegetation. Sci. Rep. 2018, 8, 6798. [Google Scholar] [CrossRef] [Green Version]
- Iaria, J.; Susca, T. Analytic Hierarchy Processes (AHP) evaluation of green roof- and green wall- based UHI mitigation strategies via ENVI-met simulations. Urban Clim. 2022, 46, 101293. [Google Scholar] [CrossRef]
- Cuce, E. Thermal regulation impact of green walls: An experimental and numerical investigation. Appl. Energy 2017, 194, 247–254. [Google Scholar] [CrossRef]
- Governatori, M.; Cedillo-González, E.I.; Manfredini, T.; Siligardi, C. Solar reflective properties of porcelain tiles for UHI mitigation: Effect of highly reflective frits in the engobe’s formulation. Mater. Today Sustain. 2022, 20, 100255. [Google Scholar] [CrossRef]
- Wu, Z.; Zhang, Y. Water Bodies’ Cooling Effects on Urban Land Daytime Surface Temperature: Ecosystem Service Reducing Heat Island Effect. Sustainability 2019, 11, 787. [Google Scholar] [CrossRef] [Green Version]
- He, B.-J. Towards the next generation of green building for urban heat island mitigation: Zero UHI impact building. Sustain. Cities Soc. 2019, 50, 101647. [Google Scholar] [CrossRef]
- Garshasbi, S.; Haddad, S.; Paolini, R.; Santamouris, M.; Papangelis, G.; Dandou, A.; Methymaki, G.; Portalakis, P.; Tombrou, M. Urban mitigation and building adaptation to minimize the future cooling energy needs. Sol. Energy 2020, 204, 708–719. [Google Scholar] [CrossRef]
- Wang, C.; Wang, Z.-H.; Kaloush, K.E.; Shacat, J. Perceptions of urban heat island mitigation and implementation strategies: Survey and gap analysis. Sustain. Cities Soc. 2021, 66, 102687. [Google Scholar] [CrossRef]
- Campbell, I.; Sachar, S.; Meisel, J.; Nanavatty, R. Beating the Heat: A Sustainable Cooling Handbook for Cities; United Nations Environment Programme: Nairobi, Kenya, 2021; ISBN 978-92-807-3894-0. [Google Scholar]
- IEA SHC TCP Executive Committee. IEA SHC TCP Strategic Work Plan 2019–2024. 2018. Available online: https://www.iea-shc.org/Data/Sites/1/media/documents/members-area/shc_tcp-strategic_plan_2019-2024-final-aug_2018.pdf (accessed on 4 March 2023).
- Jakob, U. Solar cooling technologies. In Renewable Heating and Cooling; Elsevier: Amsterdam, The Netherlands, 2016; pp. 119–136. ISBN 9781782422136. [Google Scholar]
- Henning, H.-M. Solar Cooling Position Paper: IEA SHC Task 38 Solar Air-Conditioning and Refrigeration. 2011. Available online: http://www.iea-shc.org/data/sites/1/publications/IEA-SHC-Solar-Cooling-Position-Paper.pdf (accessed on 28 March 2023).
- Mugnier, D.; Jakob, U. Status of solar cooling in the World: Markets and available products. WIREs Energy Environ. 2015, 4, 229–234. [Google Scholar] [CrossRef]
- Jakob, U.; Neyer, D. Chapter 4.5: Solar Air Conditioning and Cooling. In Solar Heat Worldwide: Global Market Development and Trends 2021. Detailed Market Figures 2020; Edition 2022; Weiss, W., Spörk-Dür, M., Eds.; International Energy Agency: Paris, France, 2022; pp. 30–33. [Google Scholar]
- Jakob, U.; Neyer, D. Chapter 4.6: Solar Air Conditioning and Cooling. In Solar Heat Worldwide: Global Market Development and Trends in 2020. Detailed Market Figures 2019; Edition 2021; Weiss, W., Spörk-Dür, M., Eds.; International Energy Agency: Paris, France, 2021; pp. 28–31. [Google Scholar]
- Kohlenbach, P.; Jakob, U. Solar Cooling: The Earthscan Expert Guide to Solar Cooling Systems; Routledge: London, UK, 2013; ISBN 978-0-415-63975-0. [Google Scholar]
- Al-Yasiri, Q.; Szabó, M.; Arıcı, M. A review on solar-powered cooling and air-conditioning systems for building applications. Energy Rep. 2022, 8, 2888–2907. [Google Scholar] [CrossRef]
- Ghafoor, A.; Munir, A. Worldwide overview of solar thermal cooling technologies. Renew. Sustain. Energy Rev. 2015, 43, 763–774. [Google Scholar] [CrossRef]
- Neyer, D.; Jakob, U. Solar Cooling for the Sunbelt Regions—A new IEA SHC Task. In Proceedings of the ISES EuroSun 2020 Conference—13th International Conference on Solar Energy for Buildings and Industry, EuroSun 2020, Online, 1–3 September 2020; Charalambides, A., Streicher, W., Mugnier, D., Eds.; International Solar Energy Society: Freiburg, Germany, 2020; pp. 1–8. ISBN 978-3-9820408-2-0. [Google Scholar]
- IEA SHC. IEA-SHC Task65—About. Available online: https://task65.iea-shc.org/about (accessed on 13 February 2023).
- Jakob, U.; Vasta, S.; Weiss, W.; Neyer, D.; Kohlenbach, P. Solar Cooling for the Sunbelt Regions. In Proceedings of the ISES Solar World Congress 2021, Virtual, 25–29 October 2021; Renné, D., Weber, E., Hachem-Vermette, C., Frank, E., Eds.; International Solar Energy Society: Freiburg, Germany, 2021; pp. 1–8, ISBN 978-3-9820408-7-5. [Google Scholar]
- IEA SHC TCP Executive Committee. IEA SHC TCP Strategic Work Plan 2024–2029. 2023. Available online: https://www.iea-shc.org/Data/Sites/1/media/iea-shc-strategic-plan-2024-2029-final.pdf (accessed on 28 March 2023).
- Wang, X.; Meng, X.; Long, Y. Projecting 1 km-grid population distributions from 2020 to 2100 globally under shared socioeconomic pathways. Sci. Data 2022, 9, 563. [Google Scholar] [CrossRef]
- United Nations Development Programme. Table 2. Human Development Index trends, 1990–2021. Available online: https://hdr.undp.org/data-center/documentation-and-downloads (accessed on 13 March 2023).
- World Bank Group. World Bank Analytical Classifications: Historical Classification by Income. 2022. Available online: https://datahelpdesk.worldbank.org/knowledgebase/articles/906519-world-bank-country-and-lending-groups (accessed on 13 March 2023).
- The World Bank. GDP per Capita (Constant 2015 US$). Available online: https://data.worldbank.org/indicator/NY.GDP.PCAP.KD (accessed on 7 March 2023).
- Salata, F.; Falasca, S.; Ciancio, V.; Curci, G.; Grignaffini, S.; de Wilde, P. Estimating building cooling energy demand through the Cooling Degree Hours in a changing climate: A modeling study. Sustain. Cities Soc. 2022, 76, 103518. [Google Scholar] [CrossRef]
- Yaduvanshi, A.; Singh, R.; Kumar, R. Population changes and sustainability of energy drive cooling demand related risks in urbanized India. Energy Build. 2022, 260, 111891–111901. [Google Scholar] [CrossRef]
- Díaz-López, C.; Jódar, J.; Verichev, K.; Rodríguez, M.L.; Carpio, M.; Zamorano, M. Dynamics of Changes in Climate Zones and Building Energy Demand. A Case Study in Spain. Appl. Sci. 2021, 11, 4261. [Google Scholar] [CrossRef]
- Kirtman, B.; Power, S.B.; Adedoyin, J.A.; Boer, G.J.; Bojario, R.; Camilloni, I.; Doblas-Reyes, F.J.; Fiore, A.M.; Kimoto, M.; Meehl, G.A.; et al. Near-term Climate Change: Projections and Predictability. In Climate Change 2013: The Physical Science Basis. Contribution of Working Group I to the Fifth Assessment Report of the Intergovernmental Panel on Climate Change; Stocker, T.F., Qin, D., Plattner, G.K., Tignor, M., Allen, S.K., Boschung, J., Nauels, A., Xia, Y., Bex, V., Midgley, P.M., Eds.; Cambridge University Press: Cambridge, UK; New York, NY, USA, 2013; pp. 953–1028. [Google Scholar]
- Lee, J.-Y.; Marotzke, J.; Bala, G.; Cao, L.; Corti, S.; Dunne, J.P.; Engelbrecht, F.; Fischer, E.; Fyfe, J.C.; Jones, D.; et al. Future Global Climate: Scenario-Based Projections and Near-Term Information. In Climate Change 2021: The Physical Science Basis. Contribution of Working Group I to the Sixth Assessment Report of the Intergovernmental Panel on Climate Change; Masson-Delmotte, V., Zhai, P., Pirani, A., Connors, C.P., Péan, C., Berger, S., Caud, N., Chen, Y., Goldfarb, L., Gomis, M.I., et al., Eds.; Cambridge University Press: Cambridge, UK; New York, NY, USA, 2021; pp. 553–672. [Google Scholar]
- Van Vuuren, D.P.; Edmonds, J.; Kainuma, M.; Riahi, K.; Thomson, A.; Hibbard, K.; Hurtt, G.C.; Kram, T.; Krey, V.; Lamarque, J.-F.; et al. The representative concentration pathways: An overview. Clim. Chang. 2011, 109, 5–31. [Google Scholar] [CrossRef]
- IPCC. Scenario Process for AR5: Representative Concentration Pathways (RCPs). Available online: https://sedac.ciesin.columbia.edu/ddc/ar5_scenario_process/RCPs.html (accessed on 5 March 2023).
- O’Neill, B.C.; Kriegler, E.; Riahi, K.; Ebi, K.L.; Hallegatte, S.; Carter, T.R.; Mathur, R.; van Vuuren, D.P. A new scenario framework for climate change research: The concept of shared socioeconomic pathways. Clim. Chang. 2014, 122, 387–400. [Google Scholar] [CrossRef] [Green Version]
- O’Neill, B.C.; Kriegler, E.; Ebi, K.L.; Kemp-Benedict, E.; Riahi, K.; Rothman, D.S.; van Ruijven, B.J.; van Vuuren, D.P.; Birkmann, J.; Kok, K.; et al. The roads ahead: Narratives for shared socioeconomic pathways describing world futures in the 21st century. Glob. Environ. Chang. 2017, 42, 169–180. [Google Scholar] [CrossRef] [Green Version]
- Fuglestvedt, J.; Guivarch, C.; Jones, C.; Meinshausen, M.; Micholls, Z.R.; Platter, G.-K.; Riahi, K.; Rogelj, J.; Szopa, S.; Tebaldi, C.; et al. Cross-Chapter Box 1.4: The SSP Scenarios as Used in Working Group I (WGI). In Climate Change 2021: The Physical Science Basis. Contribution of Working Group I to the Sixth Assessment Report of the Intergovernmental Panel on Climate Change; Masson-Delmotte, V., Zhai, P., Pirani, A., Connors, C.P., Péan, C., Berger, S., Caud, N., Chen, Y., Goldfarb, L., Gomis, M.I., et al., Eds.; Cambridge University Press: Cambridge, UK; New York, NY, USA, 2021; pp. 232–236. [Google Scholar]
- Sachs, J.; Moya, D.; Giarola, S.; Hawkes, A. Clustered spatially and temporally resolved global heat and cooling energy demand in the residential sector. Appl. Energy 2019, 250, 48–62. [Google Scholar] [CrossRef]
- Mutschler, R.; Rüdisüli, M.; Heer, P.; Eggimann, S. Benchmarking cooling and heating energy demands considering climate change, population growth and cooling device uptake. Appl. Energy 2021, 288, 116636. [Google Scholar] [CrossRef]
- Enerdata. Future of Air-Conditioning: Executive Brief—September 2019. 2019. Available online: https://www.enerdata.net/publications/executive-briefing/future-air-conditioning.pdf (accessed on 11 May 2023).
- Isaac, M.; van Vuuren, D.P. Modeling global residential sector energy demand for heating and air conditioning in the context of climate change. Energy Policy 2009, 37, 507–521. [Google Scholar] [CrossRef]
- Andrijevic, M.; Byers, E.; Mastrucci, A.; Smits, J.; Fuss, S. Future cooling gap in shared socioeconomic pathways. Environ. Res. Lett. 2021, 16, 94053. [Google Scholar] [CrossRef]
- Mistry, M.N. A high-Resolution (0.25 Degree) Historical Global Gridded Dataset of Monthly and Annual Cooling and Heating Degree-Days (1970–2018) Based on GLDAS Data. 2019. Available online: https://doi.pangaea.de/10.1594/PANGAEA.903123 (accessed on 13 January 2023).
- Beck, H.E.; Zimmermann, N.E.; McVicar, T.R.; Vergopolan, N.; Berg, A.; Wood, E.F. Present and future Köppen-Geiger climate classification maps at 1-km resolution. Sci. Data 2018, 5, 180214. [Google Scholar] [CrossRef] [Green Version]
- Riahi, K.; Krey, V. Shared Socioeconomic Pathways Scenario Database (SSP): How it Works. Available online: https://iiasa.ac.at/models-tools-data/ssp (accessed on 3 March 2023).
- Organisation for Economic Co-operation and Development. Available online: https://www.oecd.org/sdd/na/statistical-insights-what-does-gdp-per-capita-tell-us-about-households-material-well-being.htm (accessed on 3 March 2023).
- Diacon, P.-E.; Maha, L.-G. The Relationship between Income, Consumption and GDP: A Time Series, Cross-Country Analysis. Procedia Econ. Financ. 2015, 23, 1535–1543. [Google Scholar] [CrossRef] [Green Version]
- Kc, S.; Lutz, W. The human core of the shared socioeconomic pathways: Population scenarios by age, sex and level of education for all countries to 2100. Glob. Environ. Chang. 2017, 42, 181–192. [Google Scholar] [CrossRef] [PubMed] [Green Version]
- Natural Earth. de Facto Country Boundaries. Available online: https://www.naturalearthdata.com/downloads/50m-cultural-vectors/50m-admin-0-countries-2/ (accessed on 6 March 2023).
- International Monetary Fund. GDP per Capita, Current Prices: U.S. Dollars per Capita. Available online: https://www.imf.org/external/datamapper/NGDPDPC@WEO/TWN?zoom=TWN&highlight=TWN (accessed on 6 March 2023).
- Kohlenbach, P.; Besana, F.; Jakob, U.; de Luca, M.; Moser, H.; Podesser, E.; Reinholdt, L.; Henning, H.-M.; Koller, T. Heat driven cooling technologies: Closed cycles. In Solar Cooling Handbook: A Guide to Solar Assisted Cooling and Dehumidification Processes; Ambra V: Wien, Austria, 2013; pp. 87–116. ISBN 978-3-99043-438-3. [Google Scholar]
- Luck, M.; Landis, M.; Gassert, F. Aqueduct Water Stress Projections: Decadal Projections of Water Supply and Demand Using CMIP5 GCMs; Technical Note; World Resources Institute: Washington, DC, USA, 2015. [Google Scholar]
- Global Solar Atlas. Longterm Average of Gloval Horizontal Irradiation—Global Solar Atlas. 2022. Available online: https://globalsolaratlas.info/download/world (accessed on 18 March 2023).
- Asian Development Bank. Aisa 2050: Realizing the Asian Century, Singapore. 2011. Available online: https://www.iopsweb.org/resources/48263622.pdf (accessed on 11 May 2023).
- African Development Bank. Africa in 50 Years’ Time: The Road Towards Inclusive Growth, Tunis, Tunisia. 2011. Available online: https://www.afdb.org/fileadmin/uploads/afdb/Documents/Publications/Africa%20in%2050%20Years%20Time.pdf (accessed on 11 May 2023).
- Searchinger, T.; Brown, M.; Campbell, B.; Carter, R.; Dickson, B. Chapter 2: Food Security and Livelihoods of Small-Scale Producers. In Adapt Now: A Global Call for Leadership on Climate Resilience; The Global Commission on Adaption: Rotterdam, Netherlands, 2019; pp. 23–29. [Google Scholar]
Figure 1.
Historic development and future projection of global installed residential air-conditioning cooling capacity according to the Baseline Scenario of IEA Future of Cooling report. Source: [6] (p. 60).
Figure 1.
Historic development and future projection of global installed residential air-conditioning cooling capacity according to the Baseline Scenario of IEA Future of Cooling report. Source: [6] (p. 60).
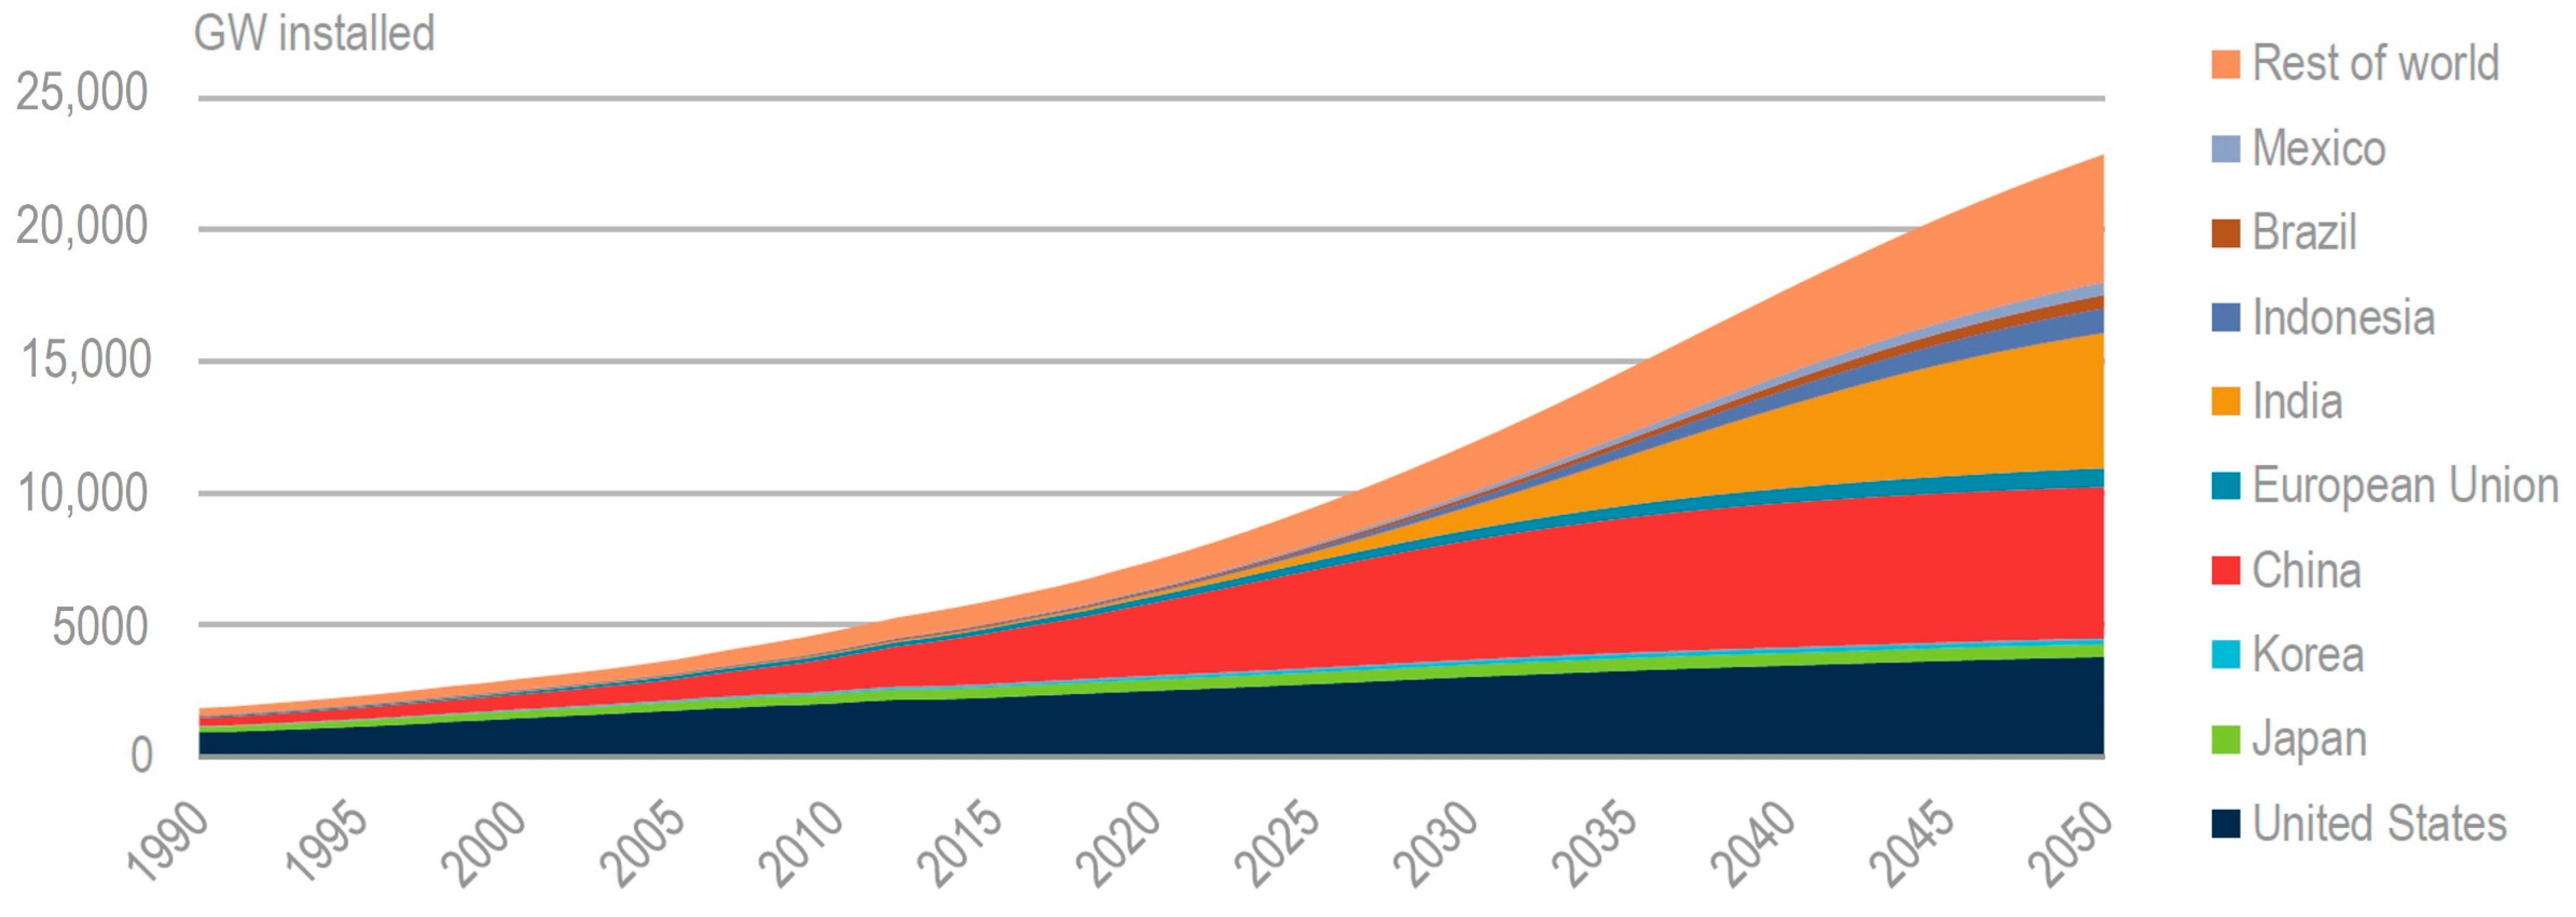
Figure 2.
Annual number of published scientific studies listed in Web of Science covering passive cooling/passive building design. Source: modified from [47].
Figure 2.
Annual number of published scientific studies listed in Web of Science covering passive cooling/passive building design. Source: modified from [47].
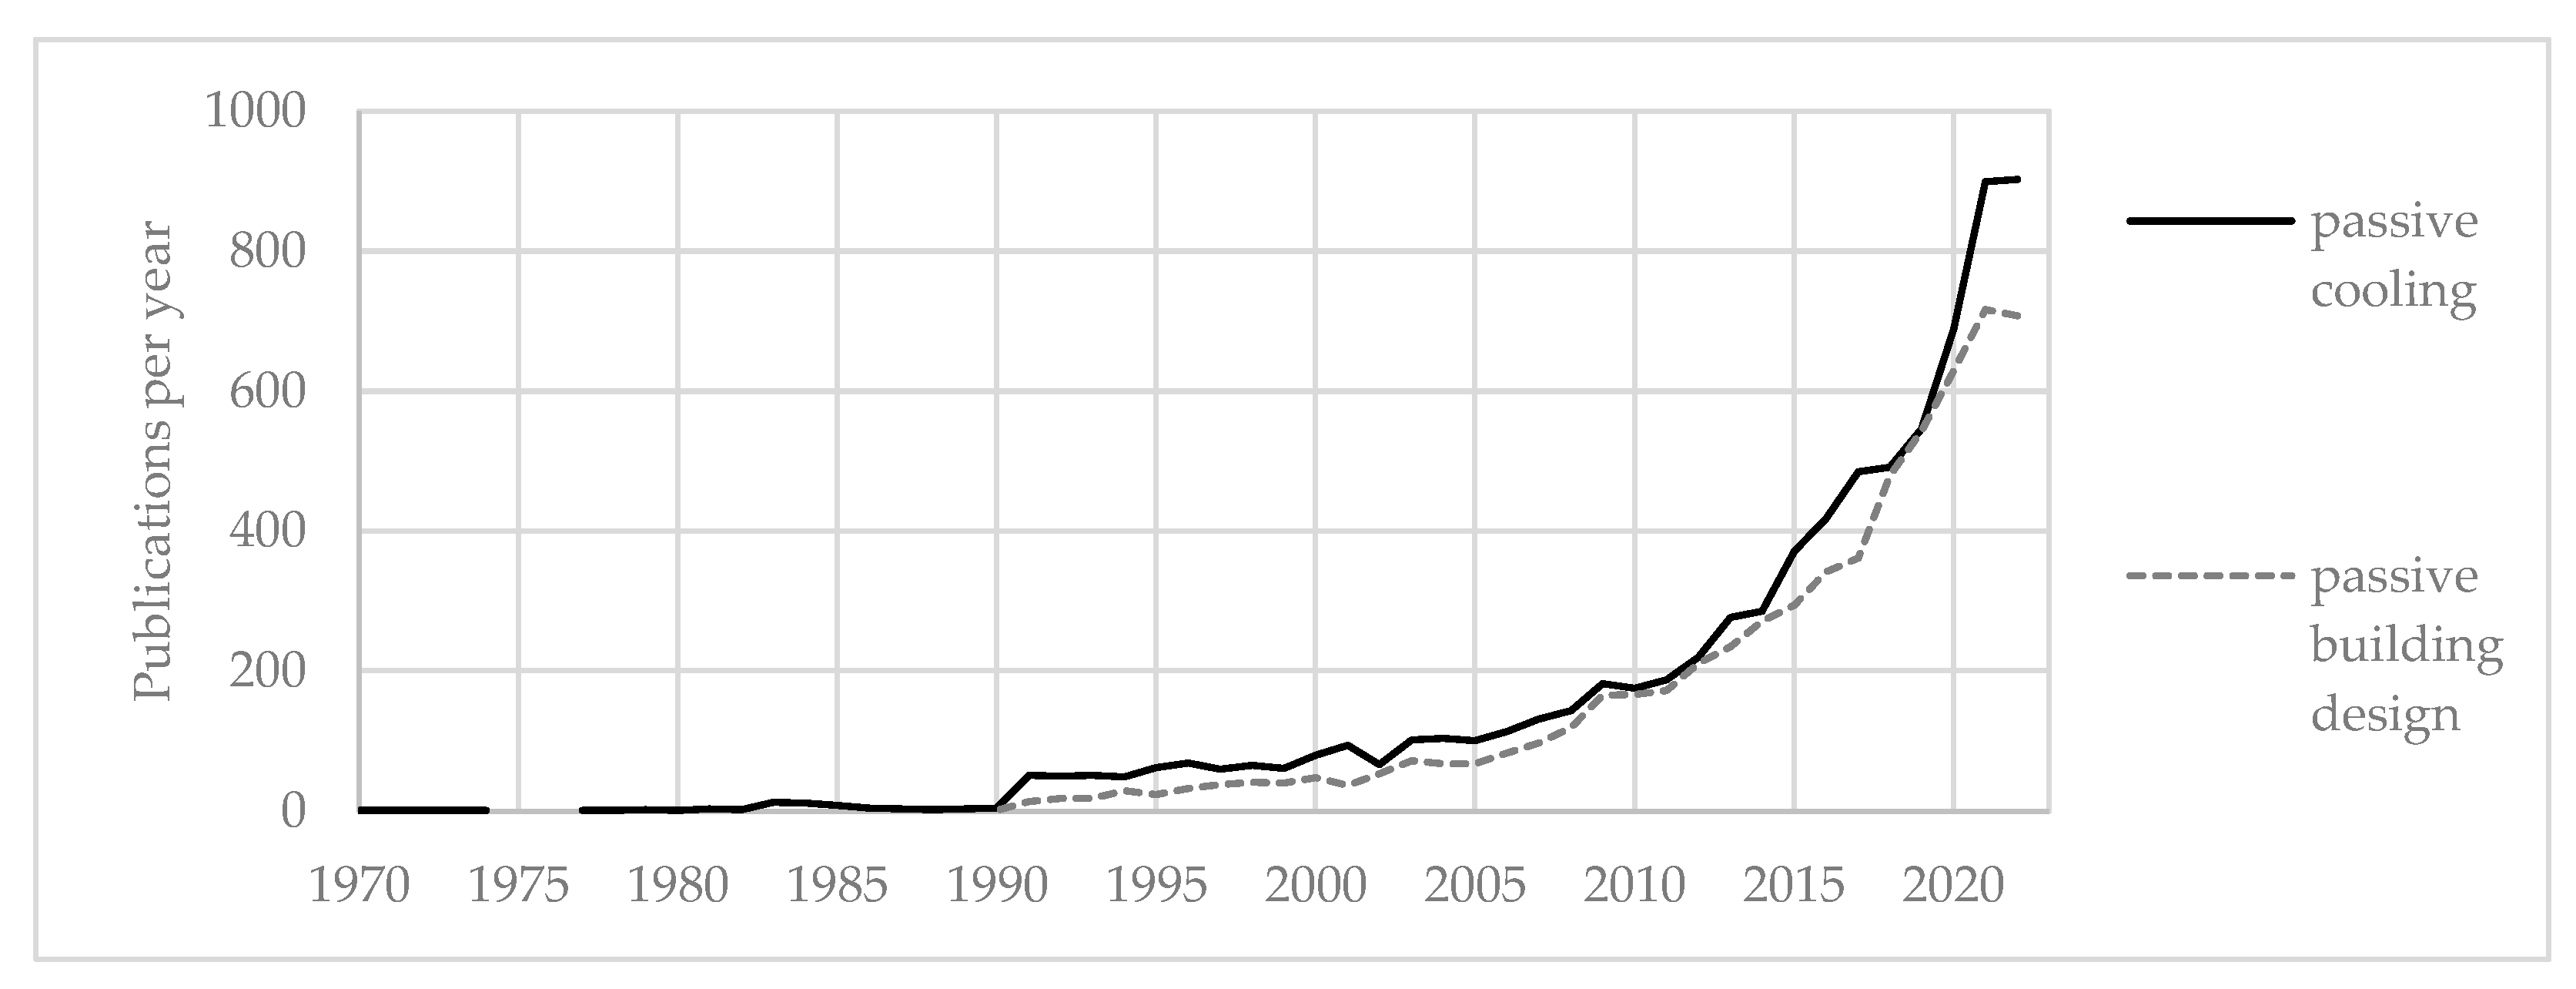
Figure 3.
Socioeconomic statistics on the countries located in the Sunbelt. (a) Sunbelt countries’ HDI in 2020, Source: modified from [92]; (b) Sunbelt countries’ urbanization rate in 2020 and 2050, Source: modified from [22]; (c) Sunbelt countries’ income level in 2020, Source: modified from [93]; (d) Sunbelt countries’ GDP/capita in 2020 in current $, Source: modified from [94].
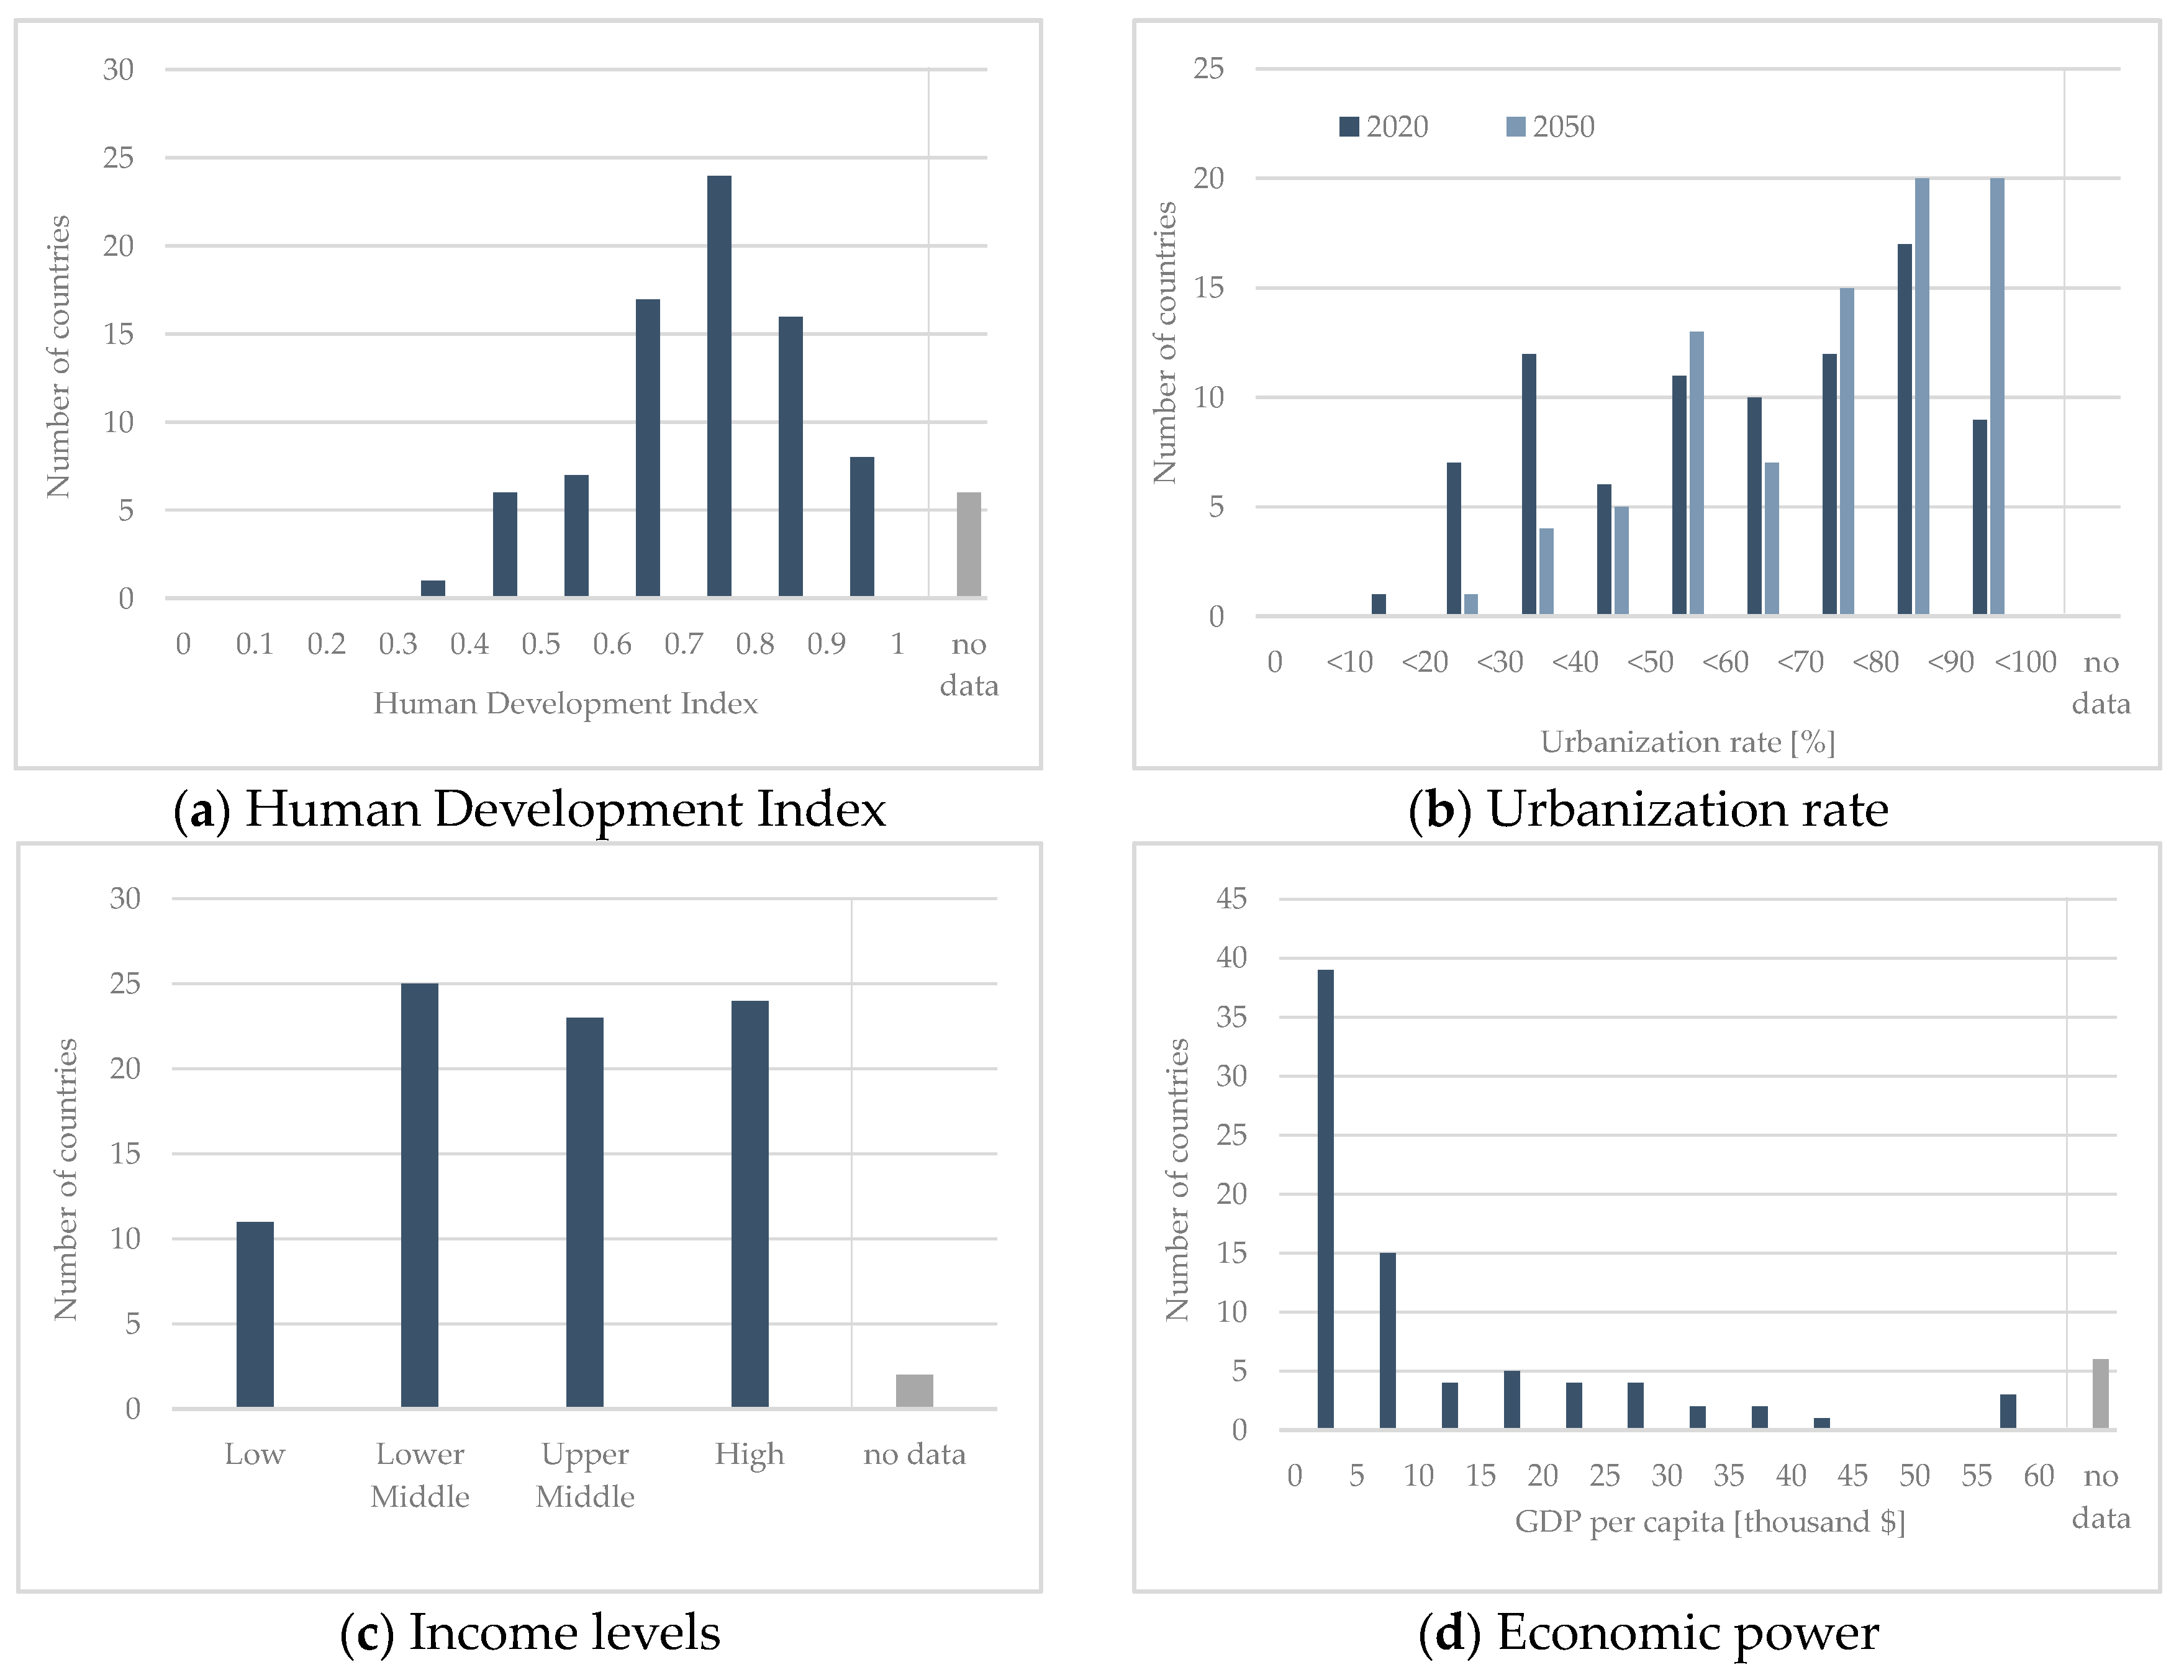
Figure 4.
Relation between climate zones following Köppen–Geiger climate classification to their rating (XClimate) in regard of CDD-based assessment. At the top of the diagram, the five main groups of climate zones are mentioned.
Figure 4.
Relation between climate zones following Köppen–Geiger climate classification to their rating (XClimate) in regard of CDD-based assessment. At the top of the diagram, the five main groups of climate zones are mentioned.
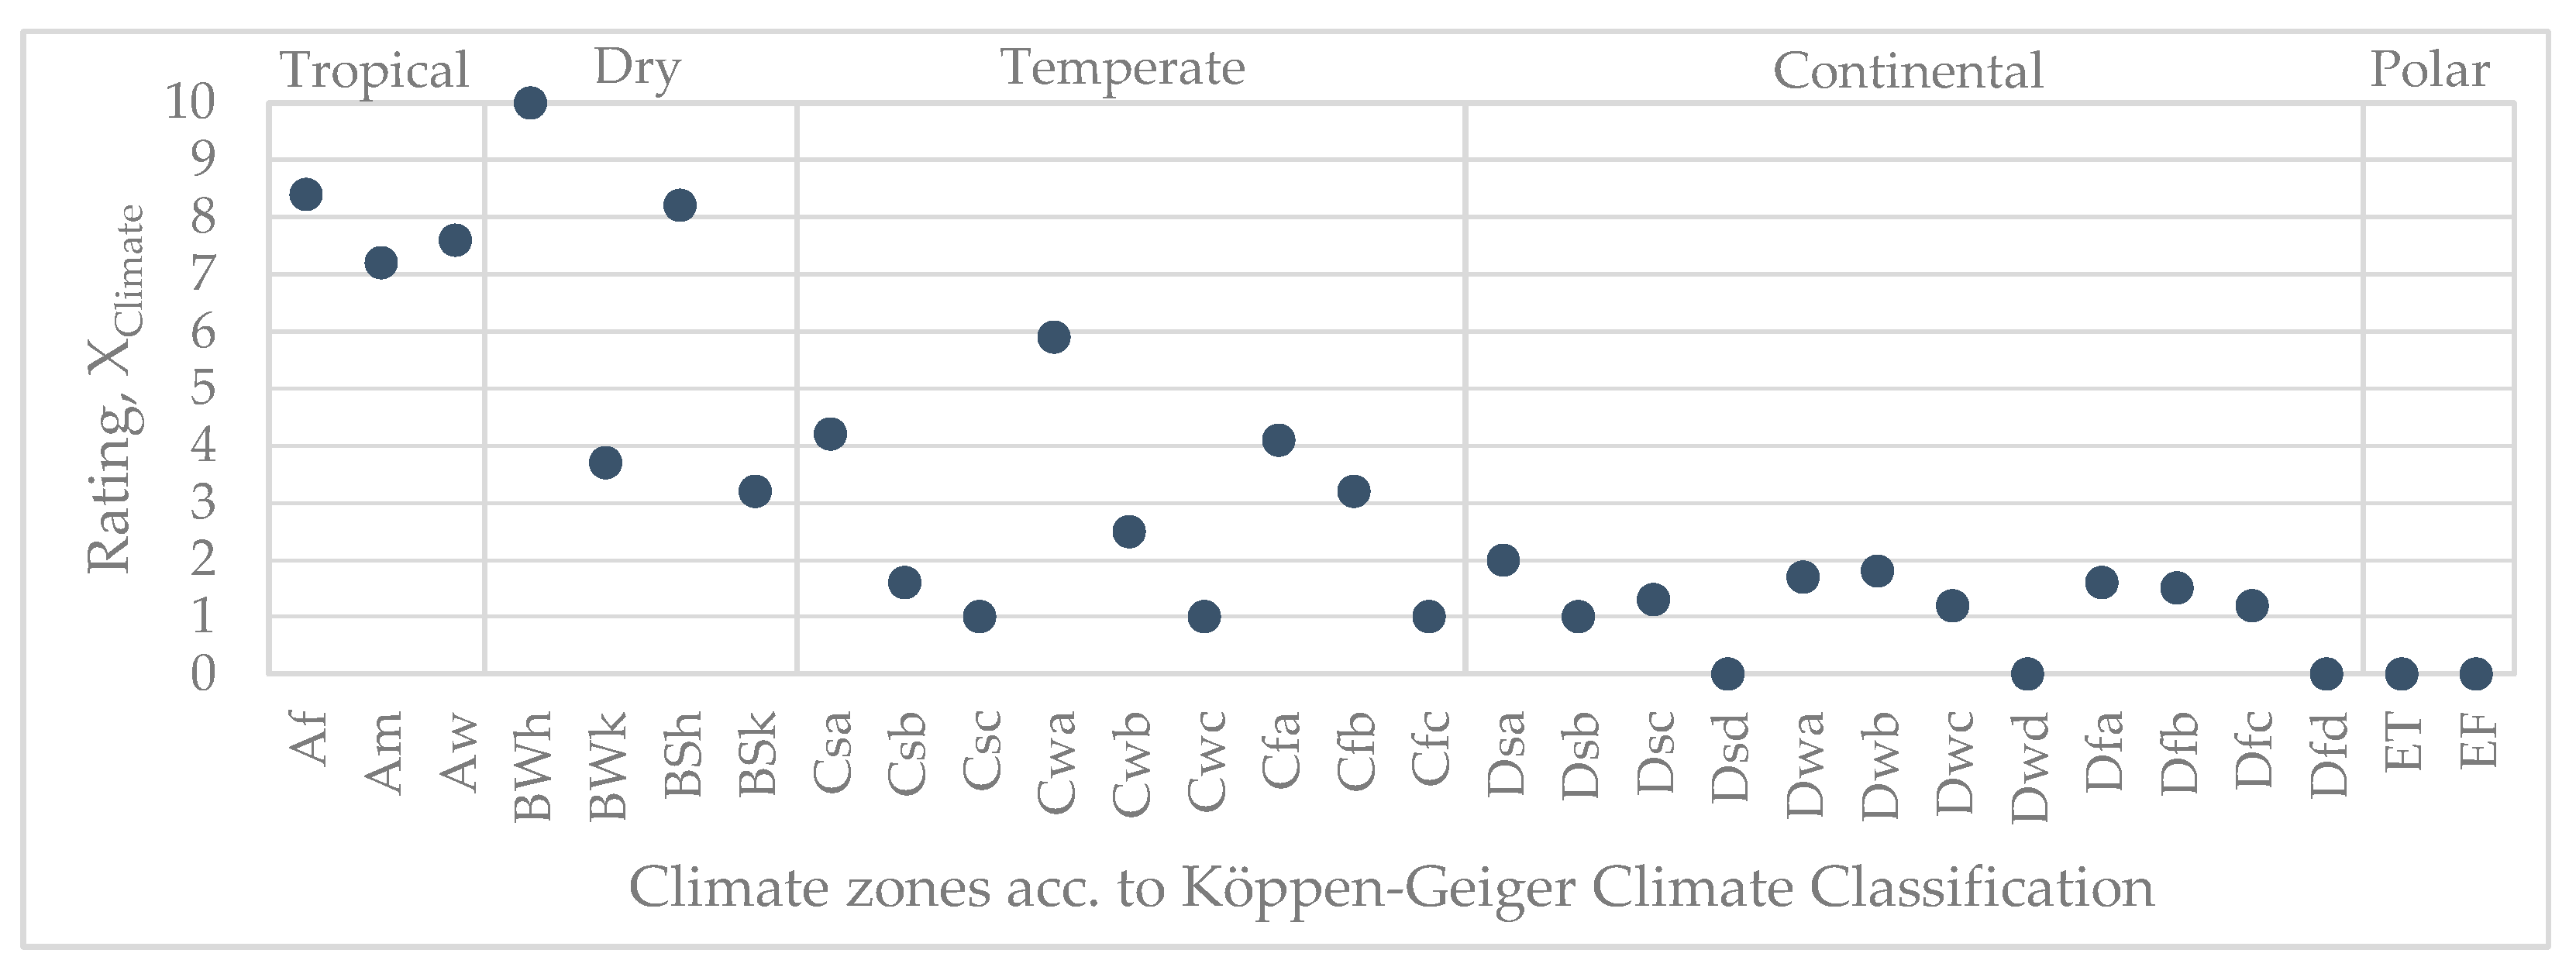
Figure 5.
Relationship between population density and the related rating (Xpopulation).
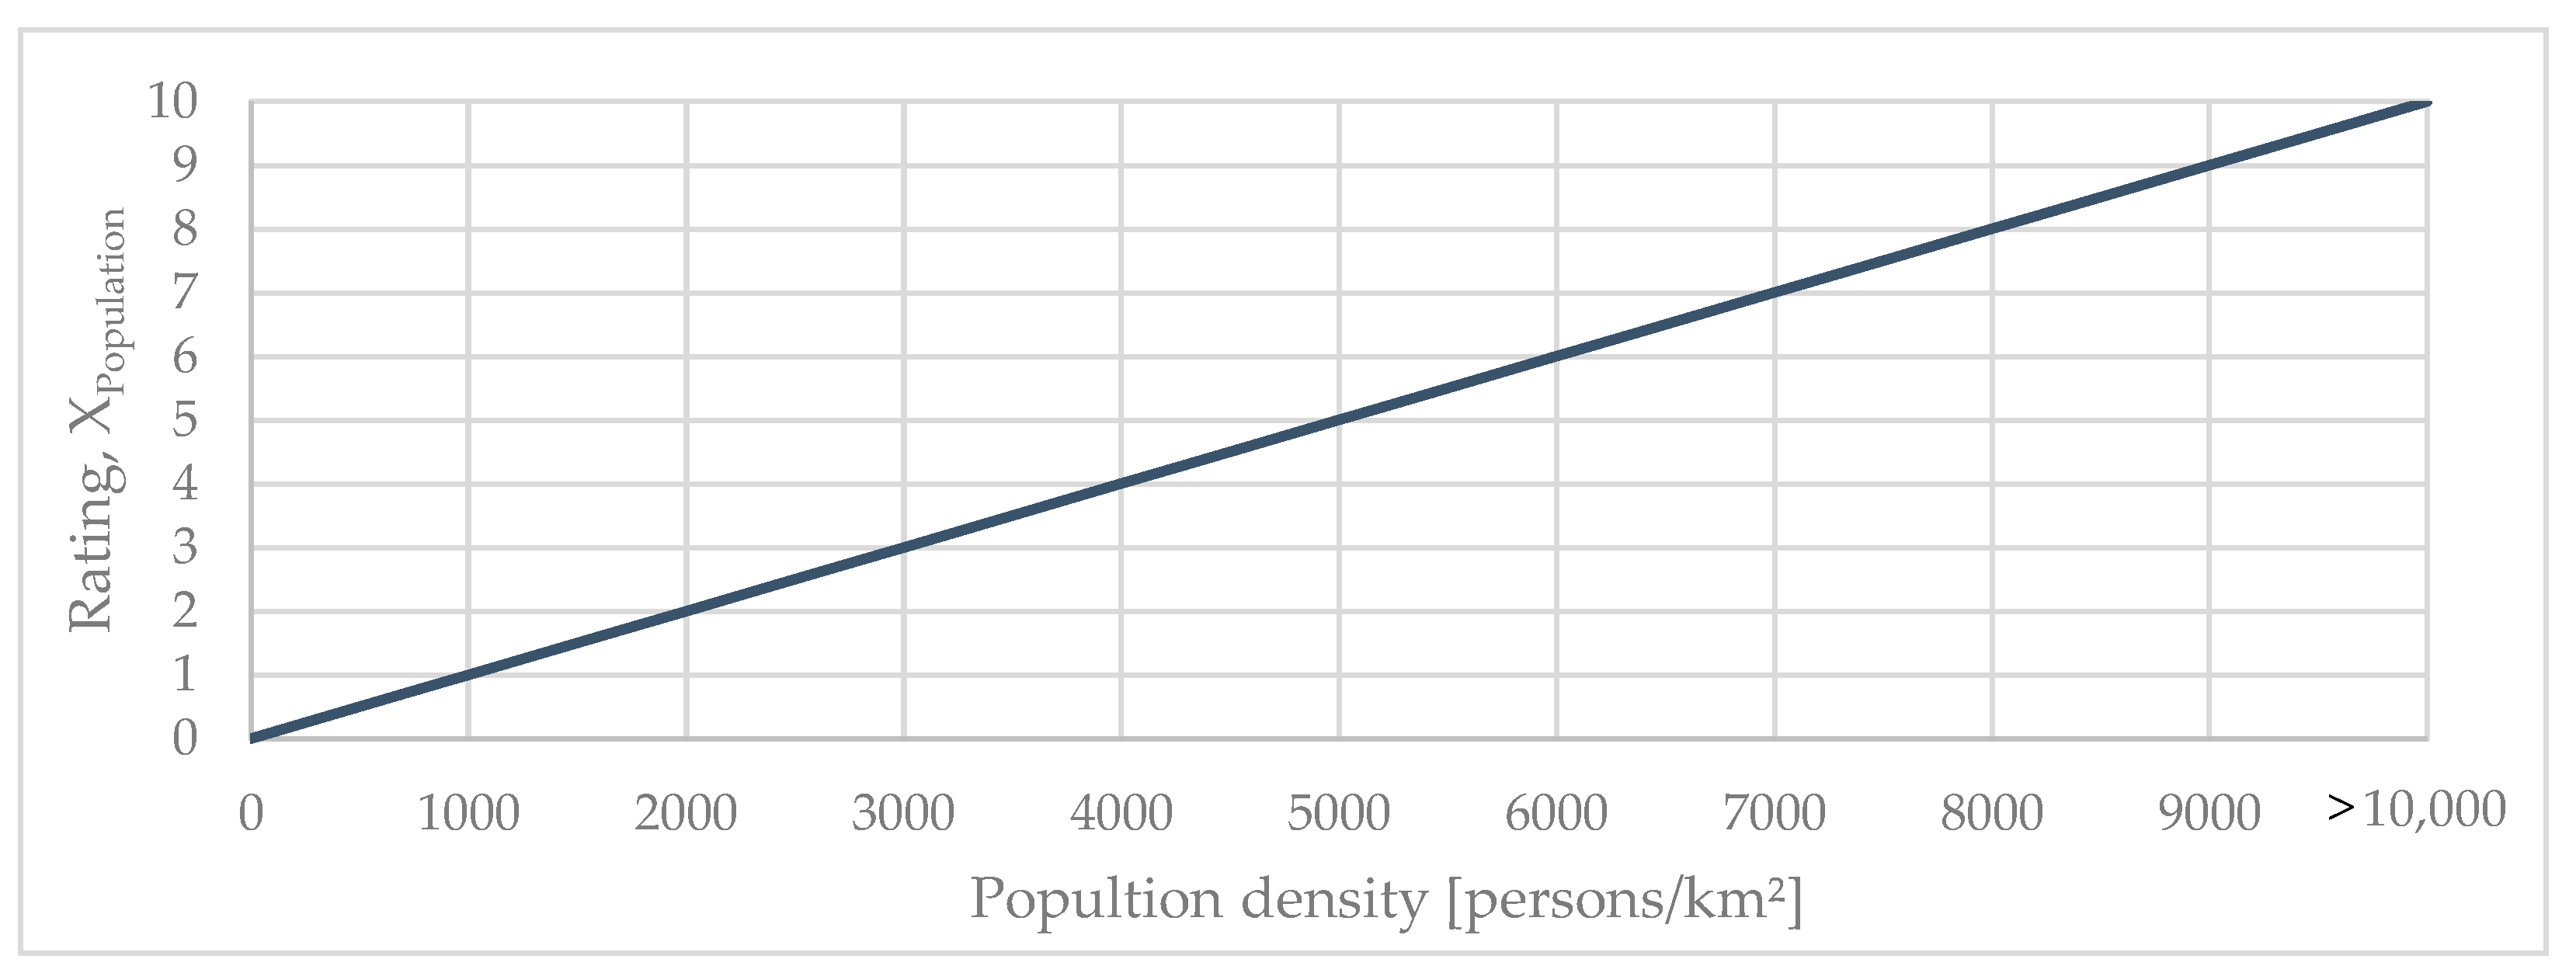
Figure 6.
Relationship between GDP per capita to its rating (XEconomic Power).
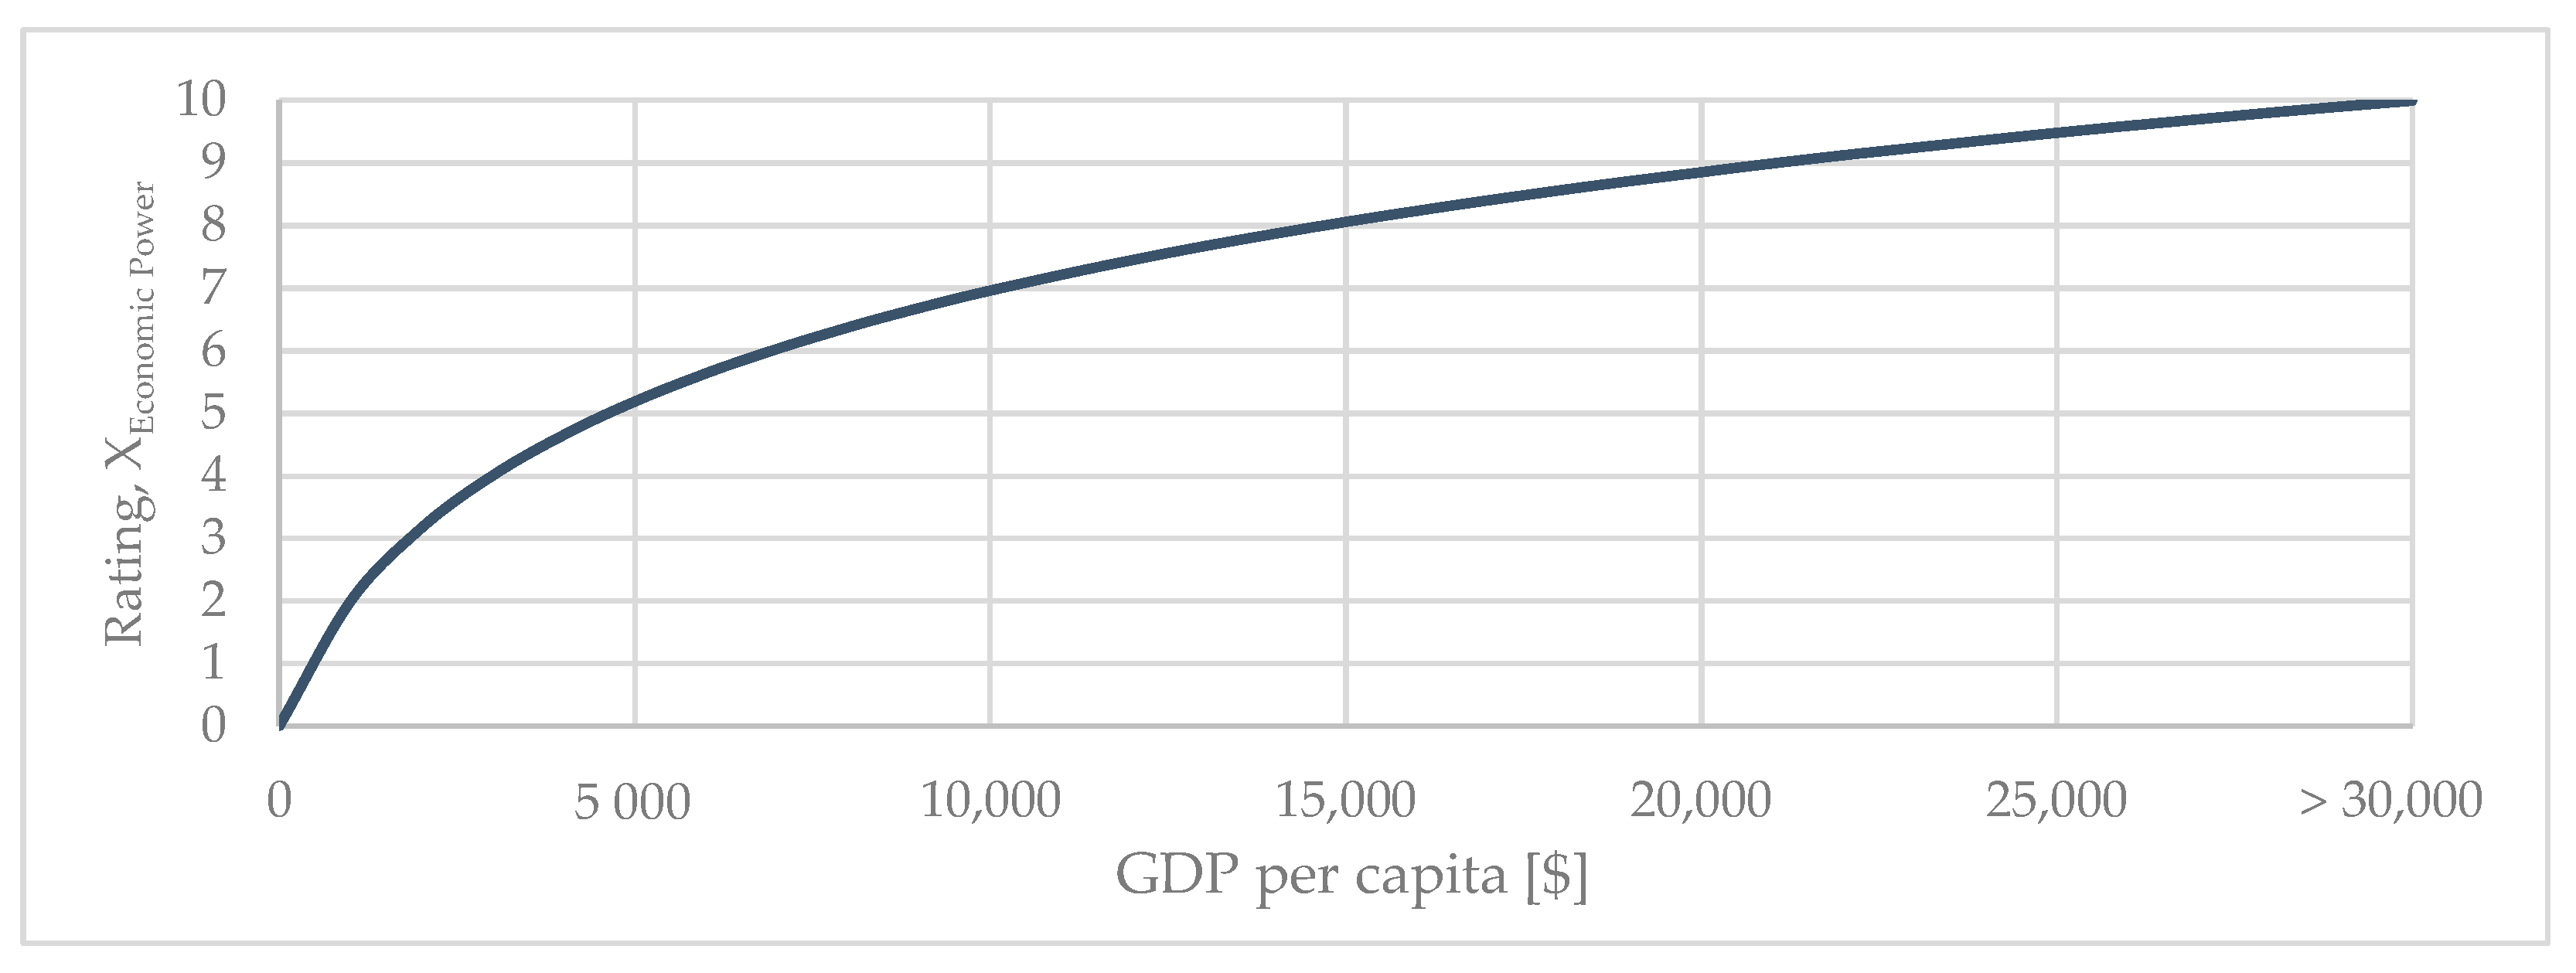
Figure 7.
Graphical presentation of the methodology followed. A combination of the three applied GIS raster grids holding the information of the three parameters are used to calculate the CDMI.
Figure 7.
Graphical presentation of the methodology followed. A combination of the three applied GIS raster grids holding the information of the three parameters are used to calculate the CDMI.

Figure 8.
ETC characteristics in respect of ambient dry bulb temperature and GHI. (a) Efficiency of ETC in respect of temperature. Source: modified from [84] (p. 24); (b) Simplified solar yield of ETC for different heat outlet temperatures at 20 °C Tamb.
Figure 8.
ETC characteristics in respect of ambient dry bulb temperature and GHI. (a) Efficiency of ETC in respect of temperature. Source: modified from [84] (p. 24); (b) Simplified solar yield of ETC for different heat outlet temperatures at 20 °C Tamb.
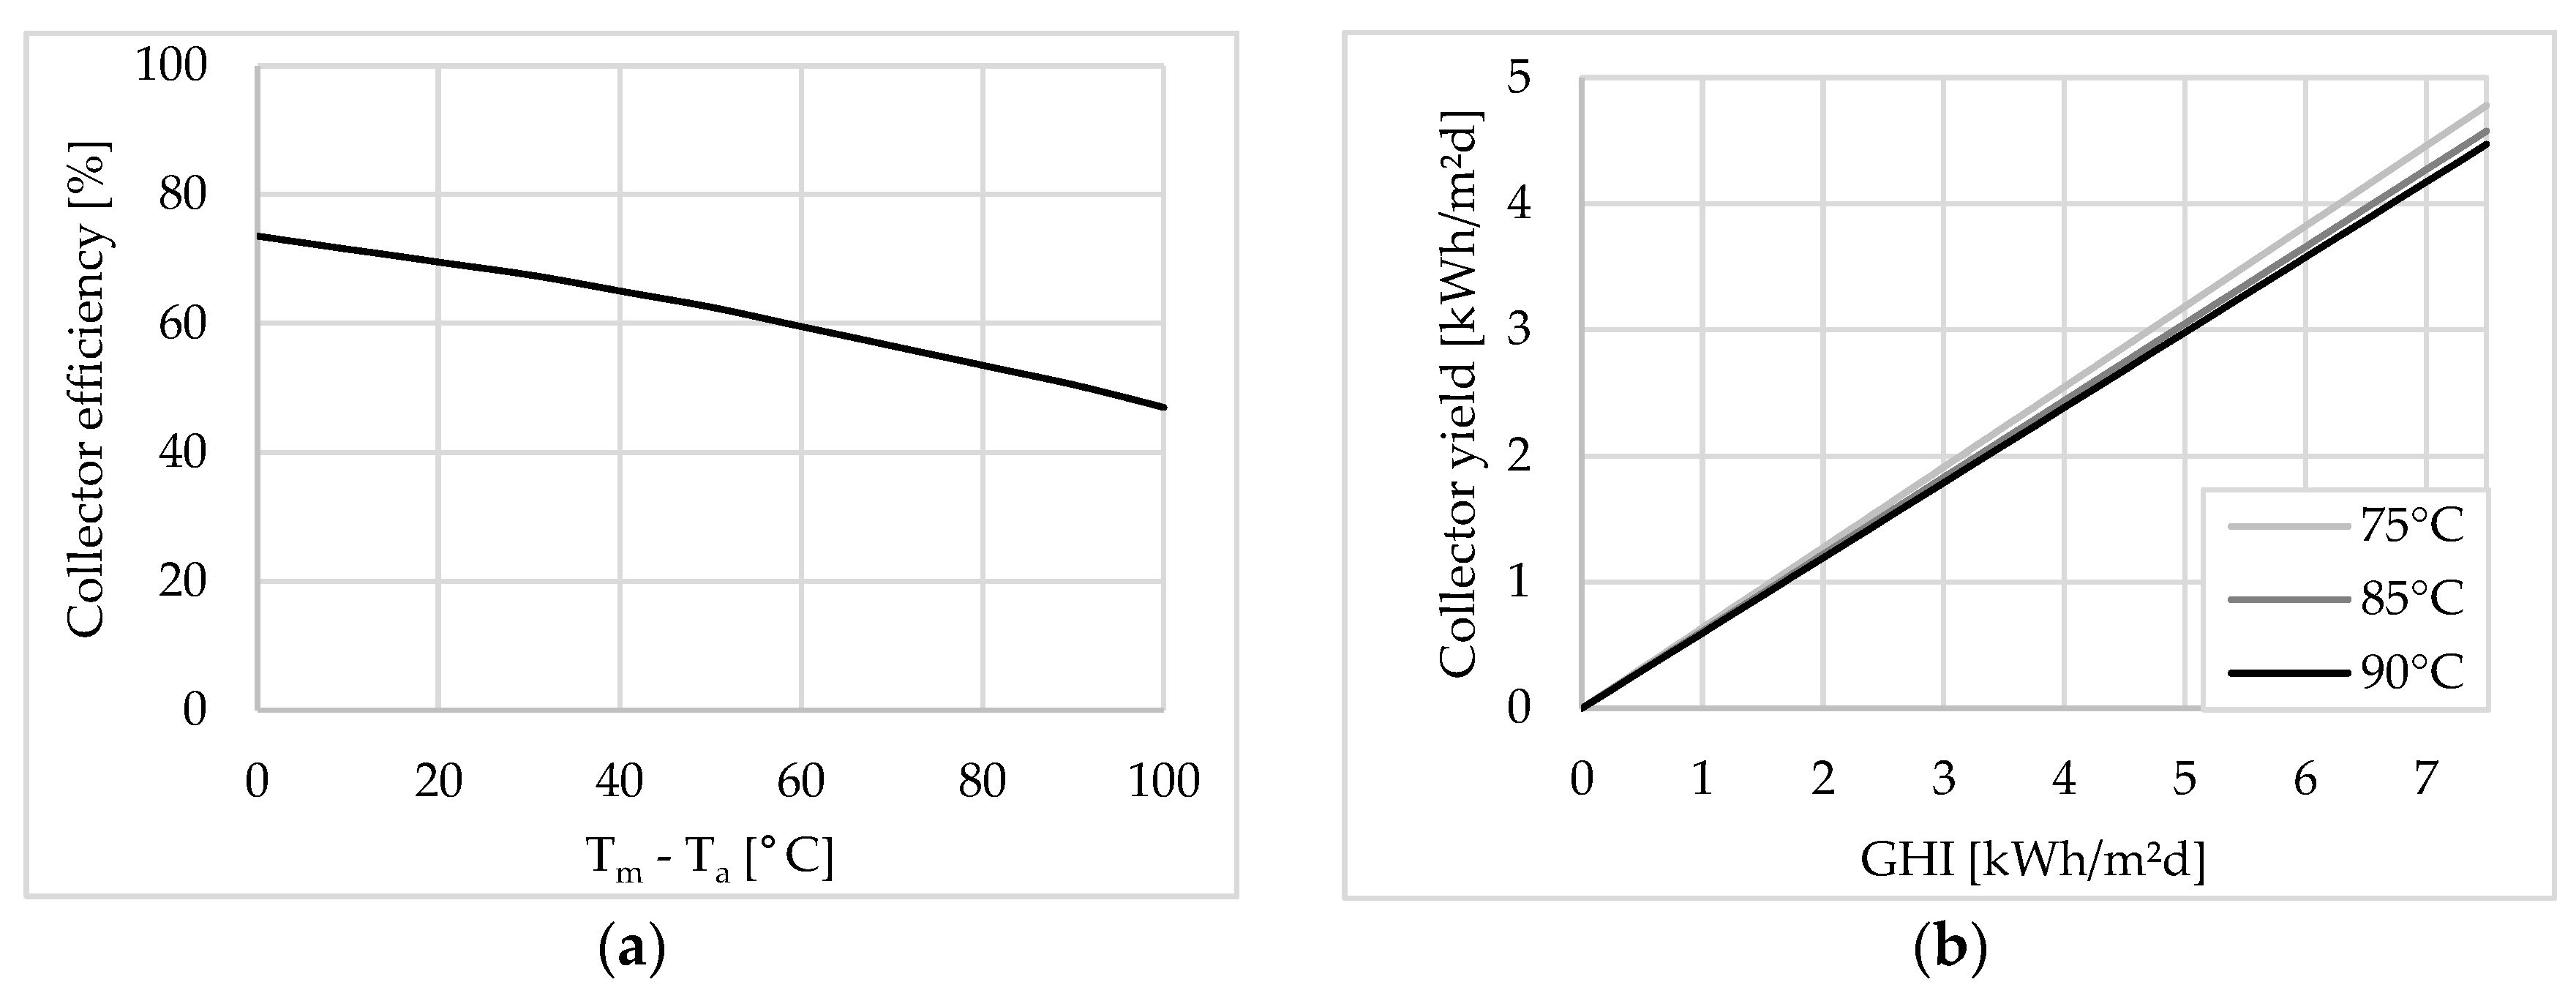
Figure 9.
Relation between cooling temperature Tcool and its rating, parameter YT,cool.
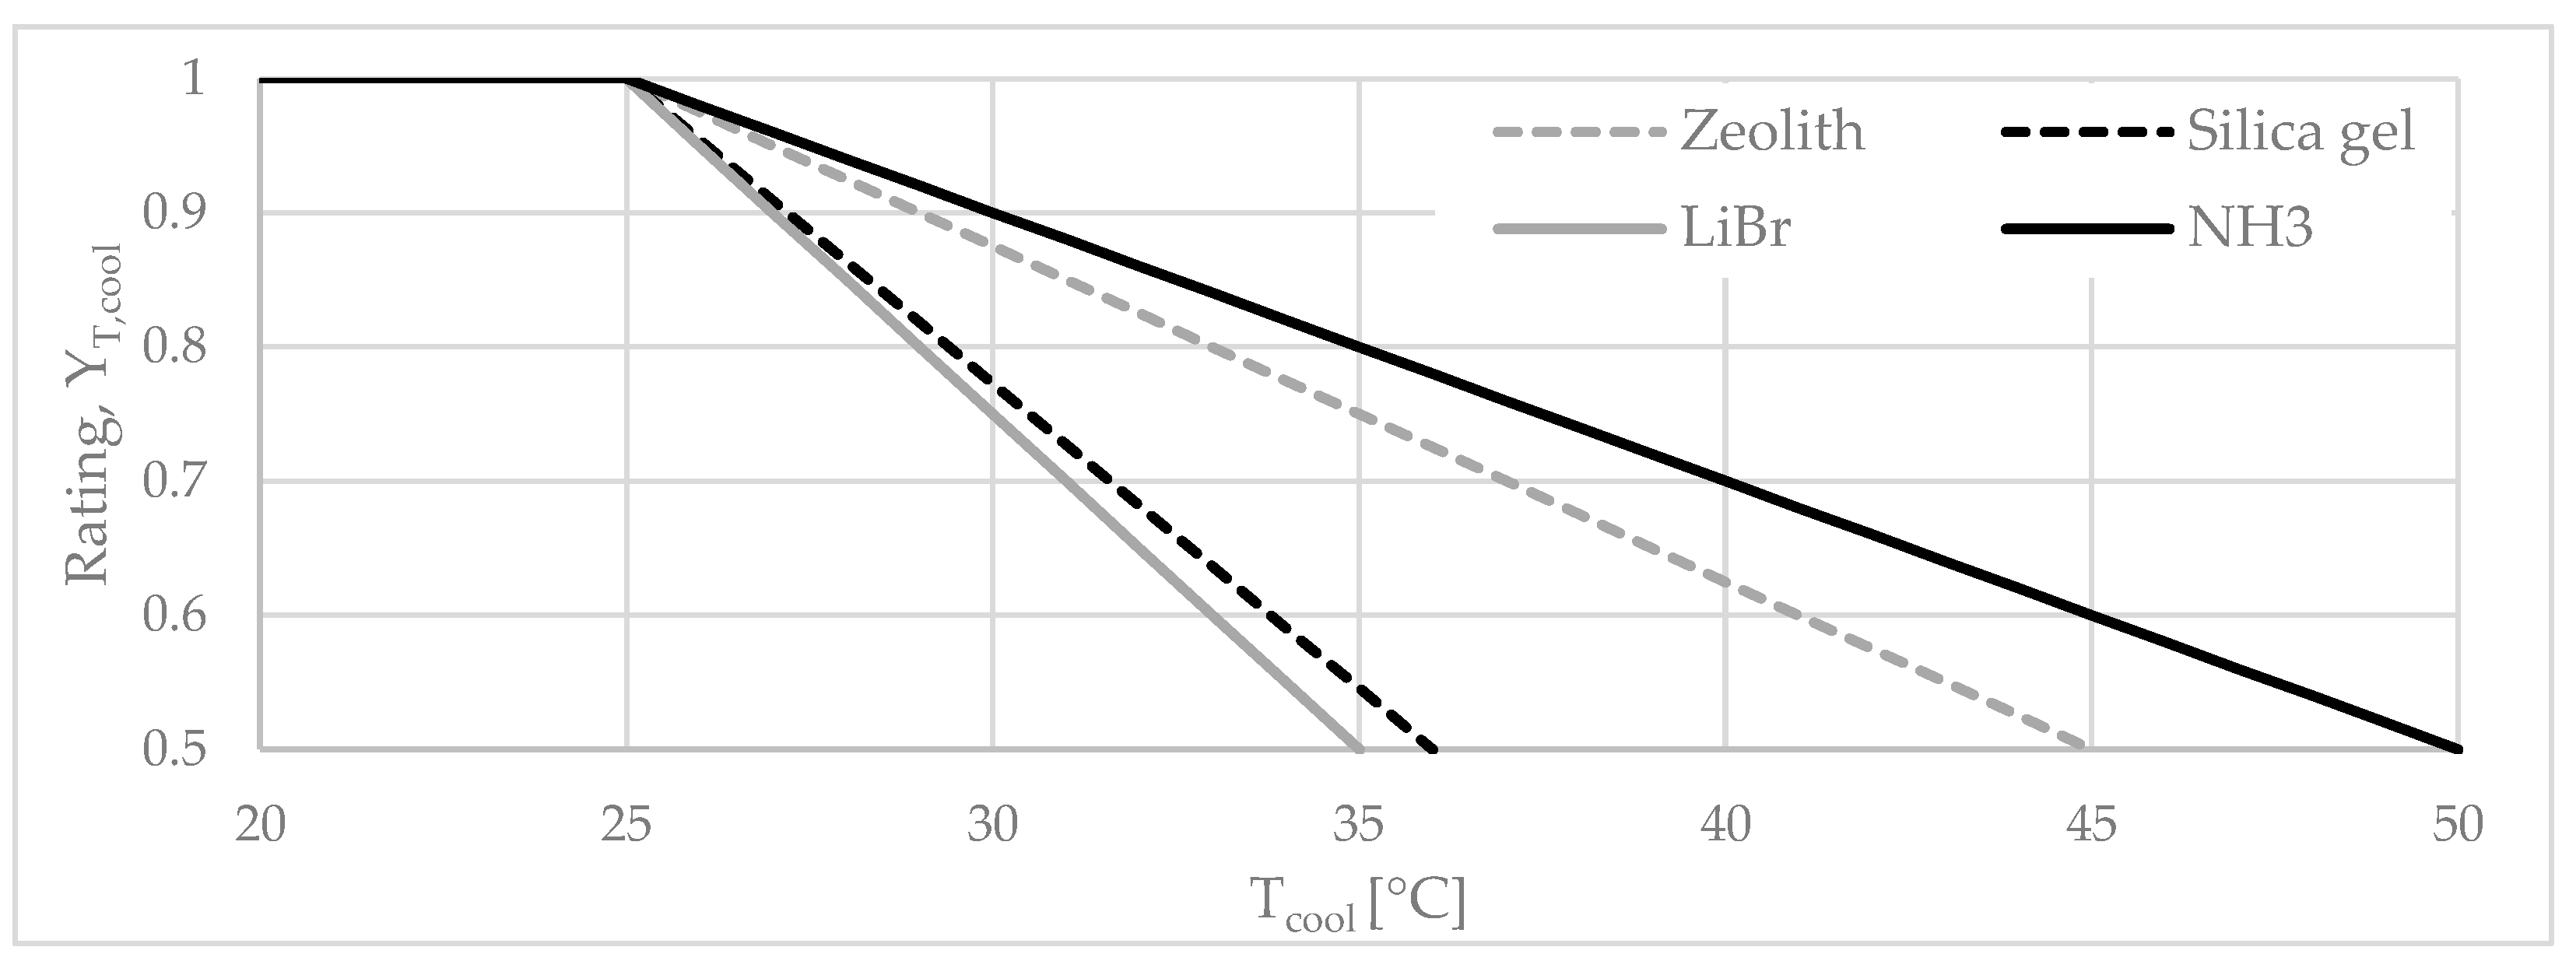
Figure 10.
Graphical presentation of the methodology followed for STCI calculation. The four raster grids were used to calculate the solar yield on the one hand and the factor YT,cool regarding the heat rejection temperature on the other hand.
Figure 10.
Graphical presentation of the methodology followed for STCI calculation. The four raster grids were used to calculate the solar yield on the one hand and the factor YT,cool regarding the heat rejection temperature on the other hand.
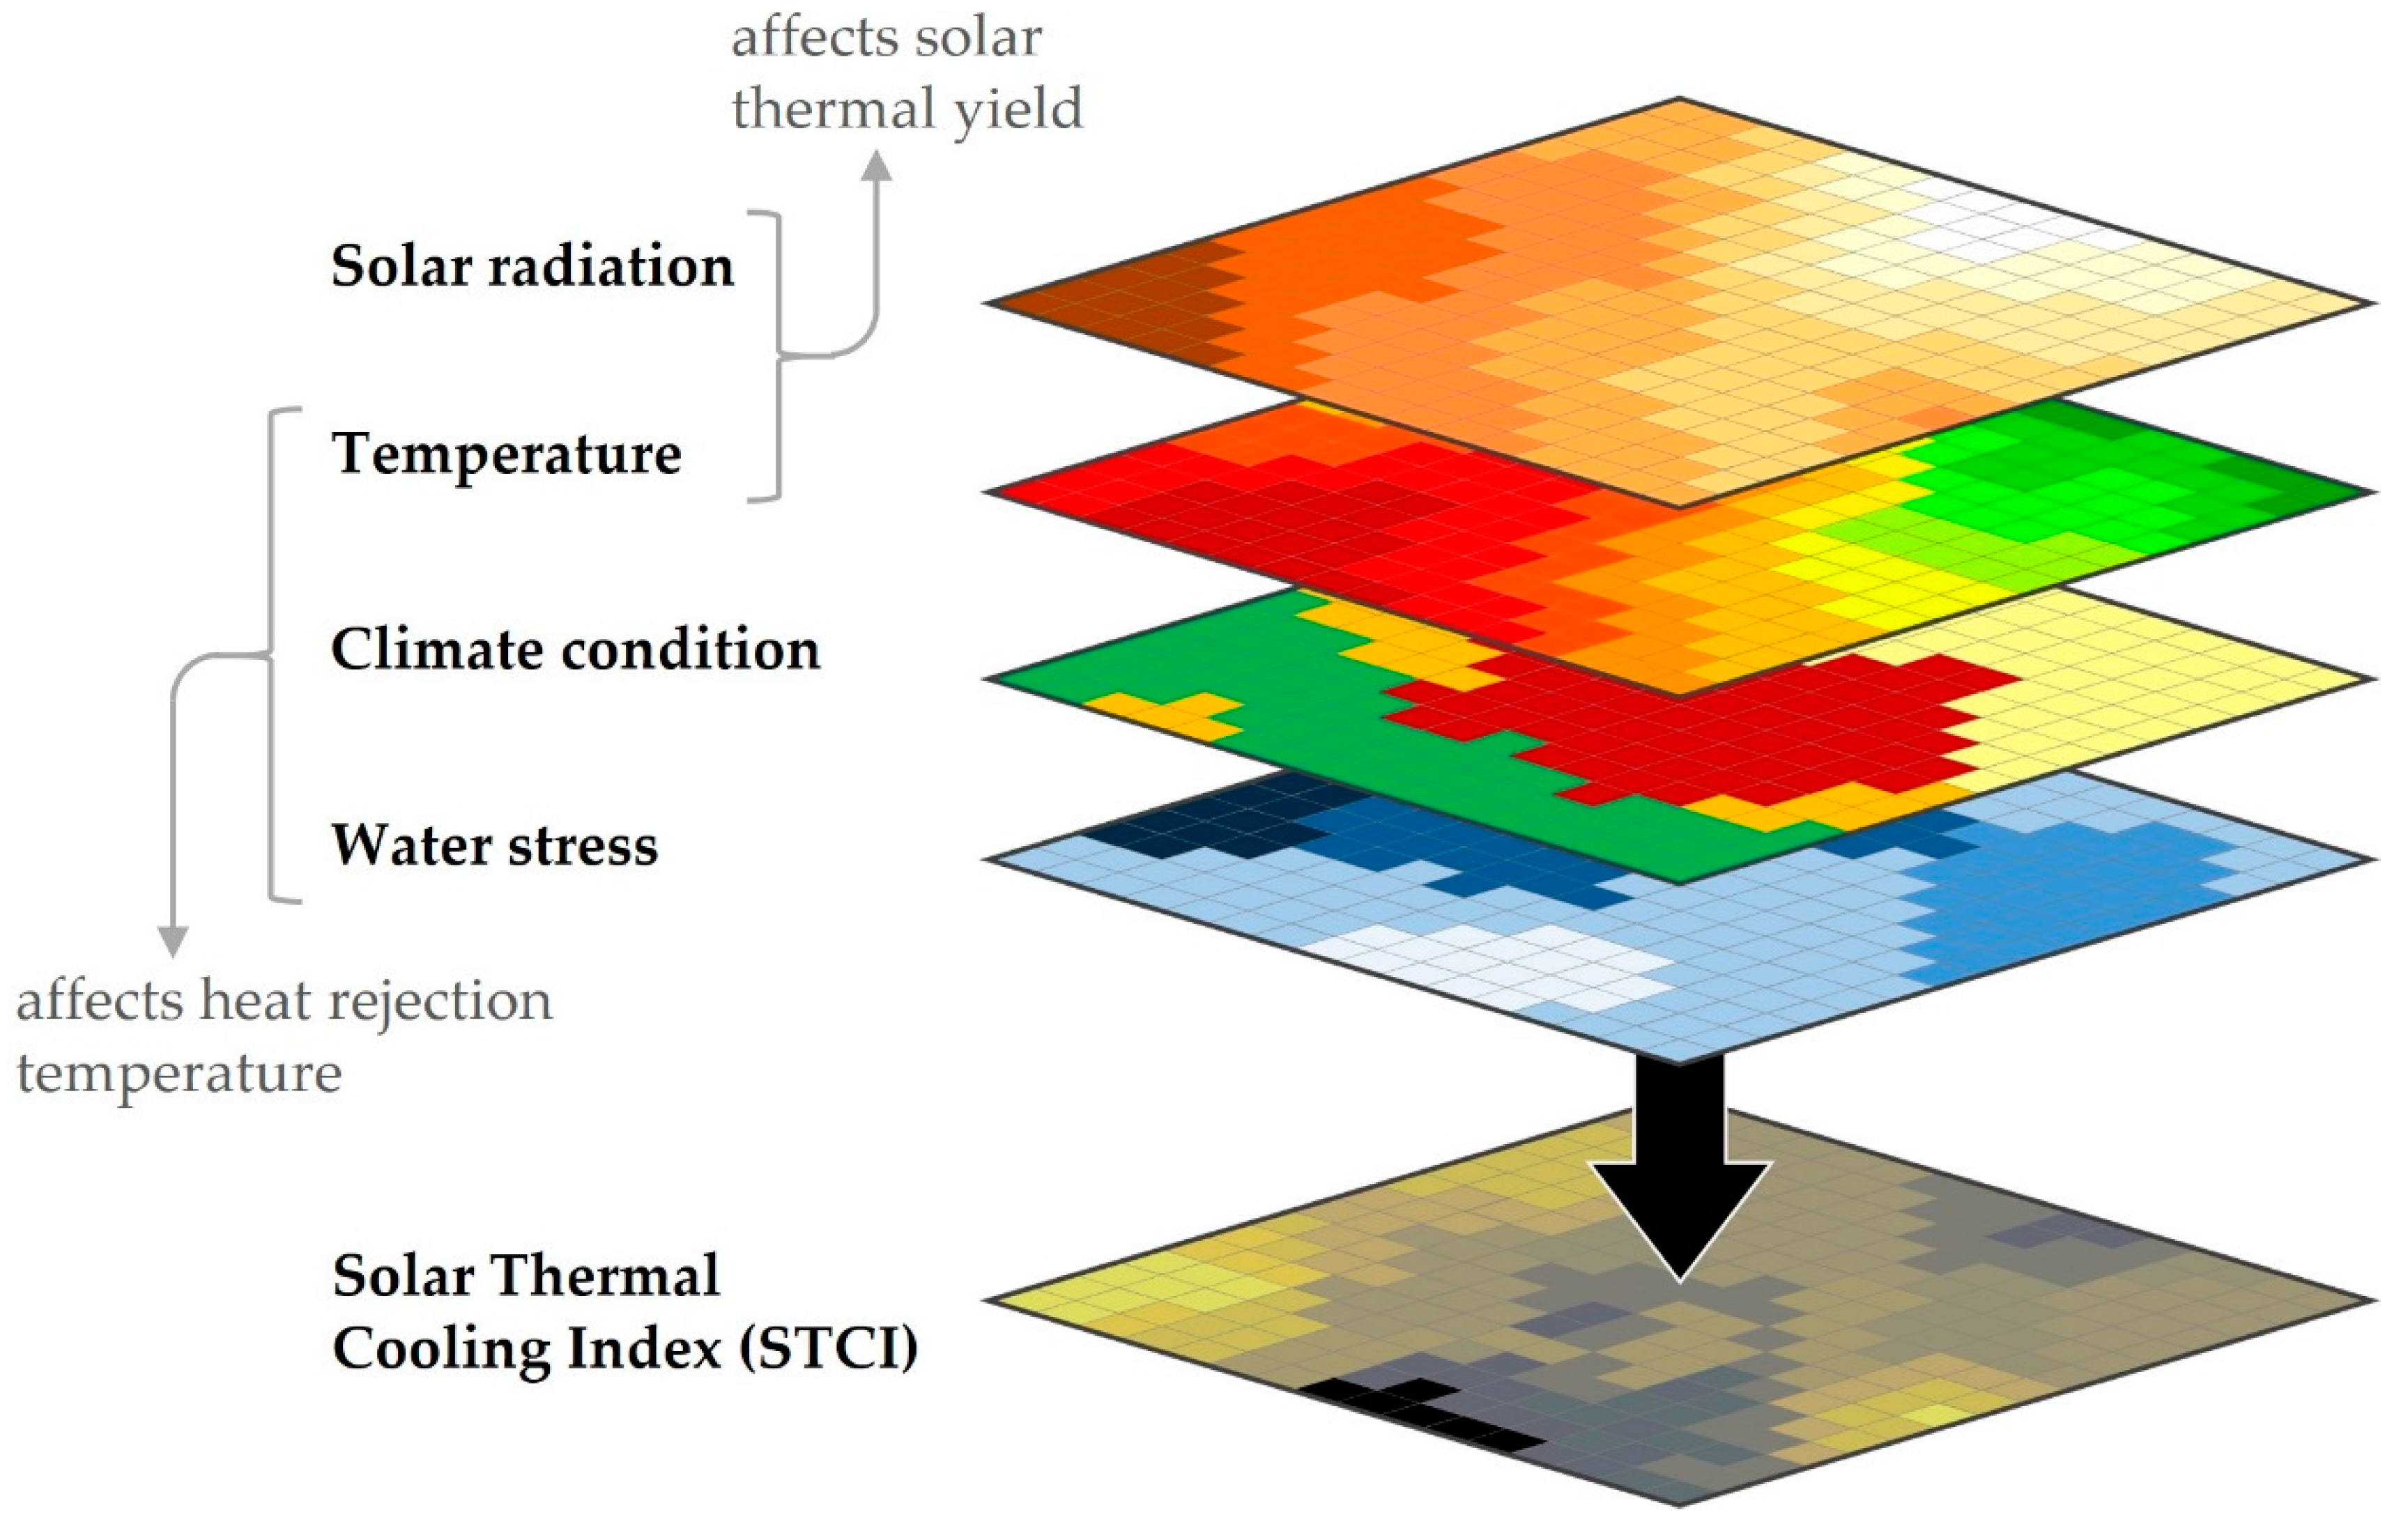
Figure 11.
CDMI results for SSP5-8.5 on a global scale.
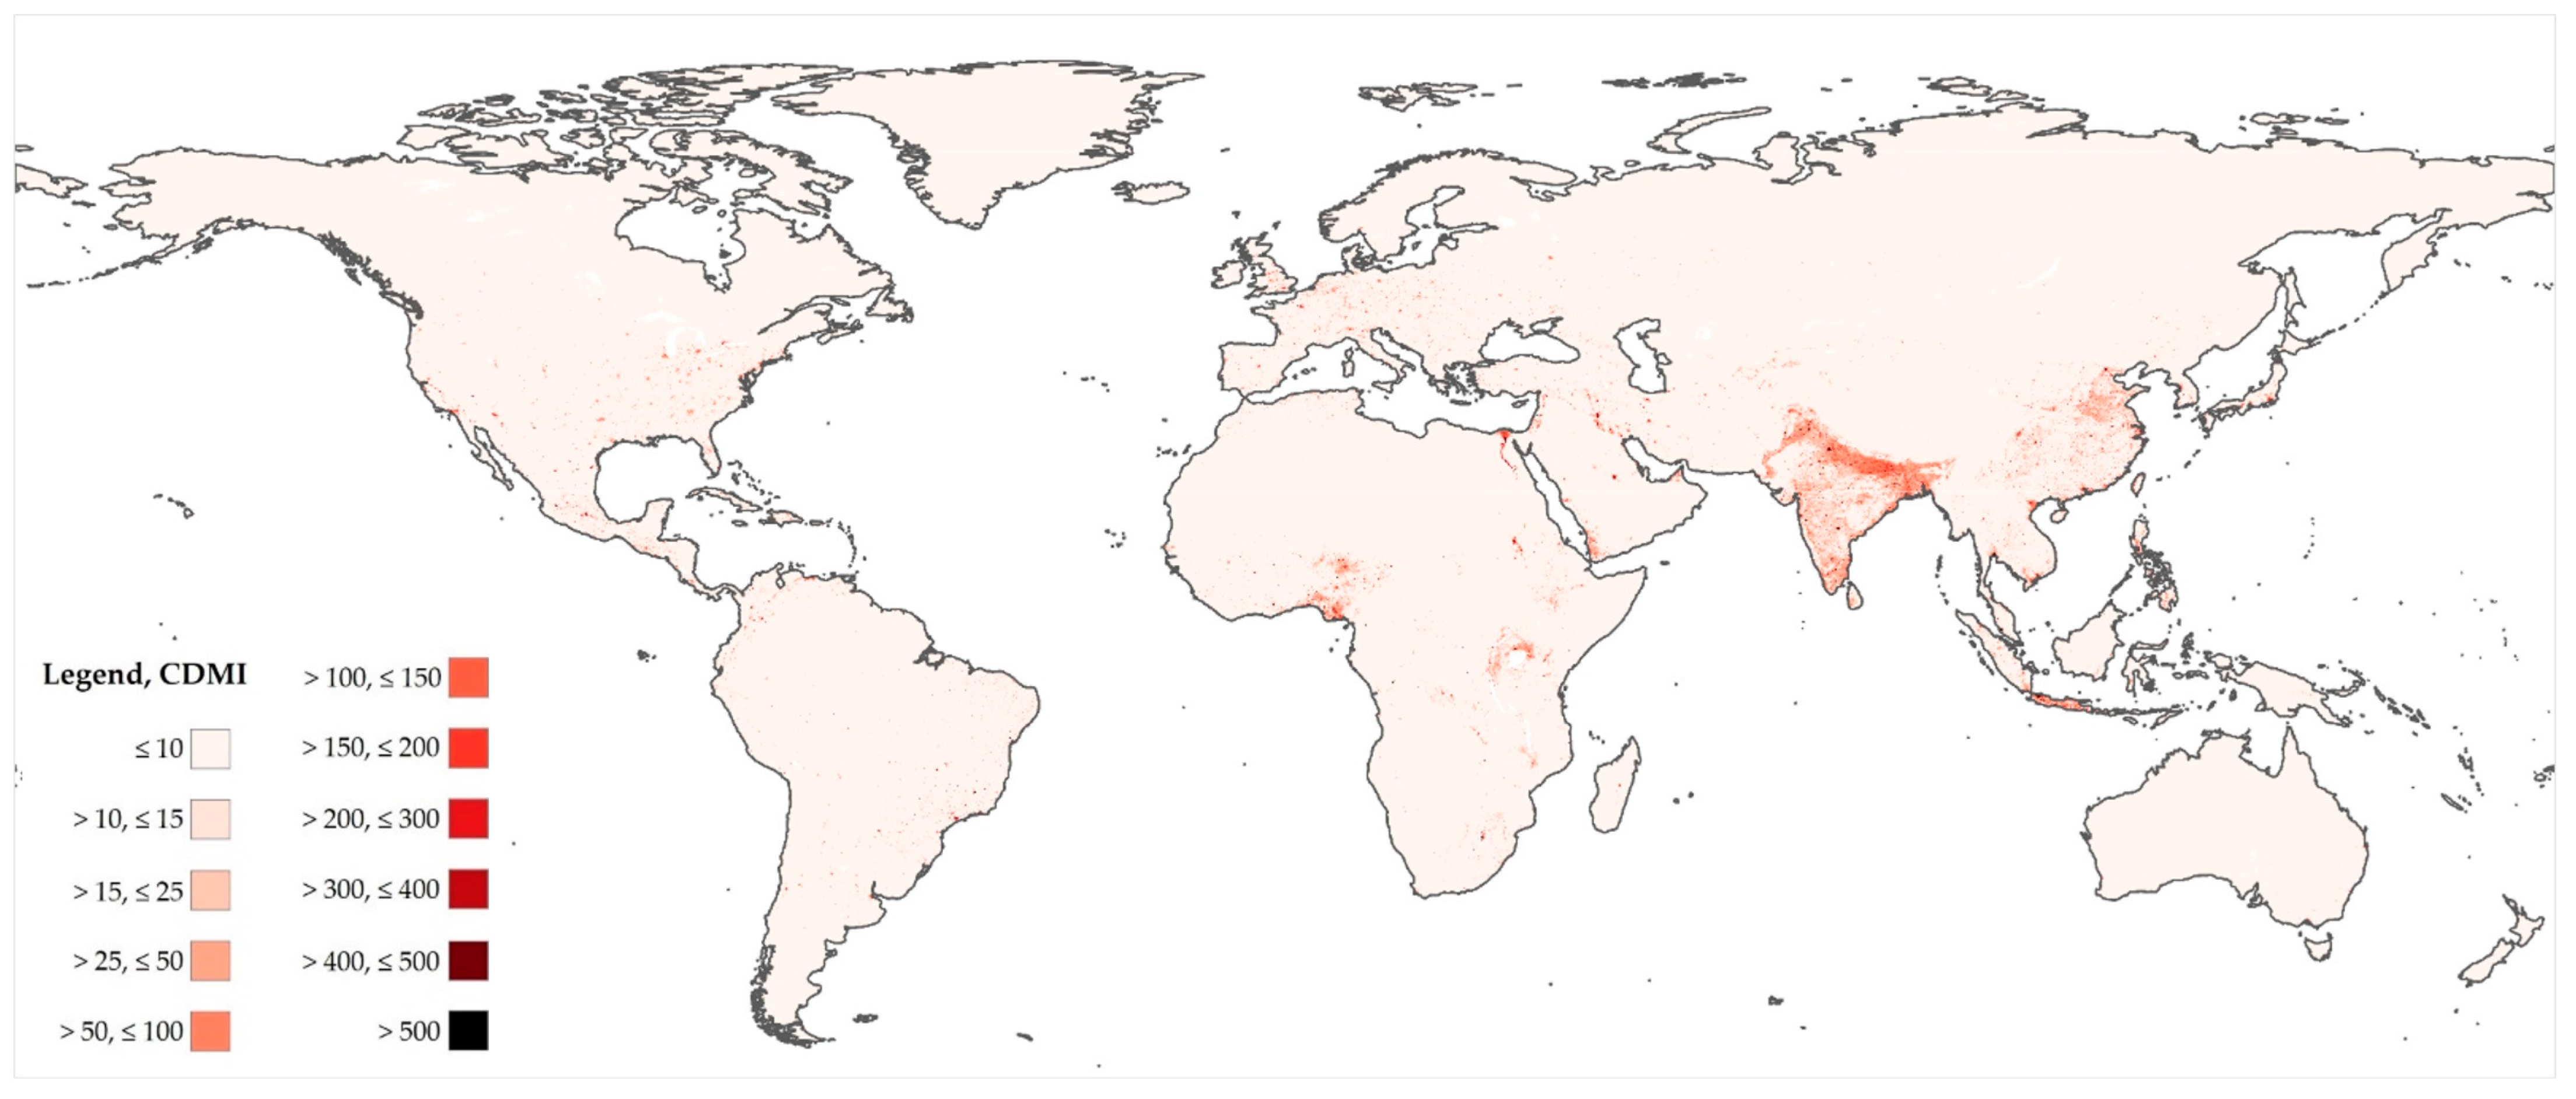
Figure 12.
Comparison of the 20 countries with the number of accumulated CDMI for each 2050 scenario. (a) Top 20 countries with the highest number of accumulated CDMI in 2050, SSP1-2.6. (b) Top 20 countries with the highest number of accumulated CDMI in 2050, SSP2-4.5. (c) Top 20 countries with the highest number of accumulated CDMI in 2050, SSP4-6.0. (d) Top 20 countries with the highest number of accumulated CDMI in 2050, SSP5-8.5.

Figure 13.
Top 20 countries/regions with largest gain in national CDMI from 2020 to SSP5-8.5 scenario.
Figure 13.
Top 20 countries/regions with largest gain in national CDMI from 2020 to SSP5-8.5 scenario.

Figure 14.
CDMI results for SSP5-8.5 on a global scale. (a) CDMI results for Patna agglomeration in Bahir state, India. (b) CDMI for Lagos agglomeration, Nigeria. (c) CDMI for London agglomeration, United Kingdom.
Figure 14.
CDMI results for SSP5-8.5 on a global scale. (a) CDMI results for Patna agglomeration in Bahir state, India. (b) CDMI for Lagos agglomeration, Nigeria. (c) CDMI for London agglomeration, United Kingdom.
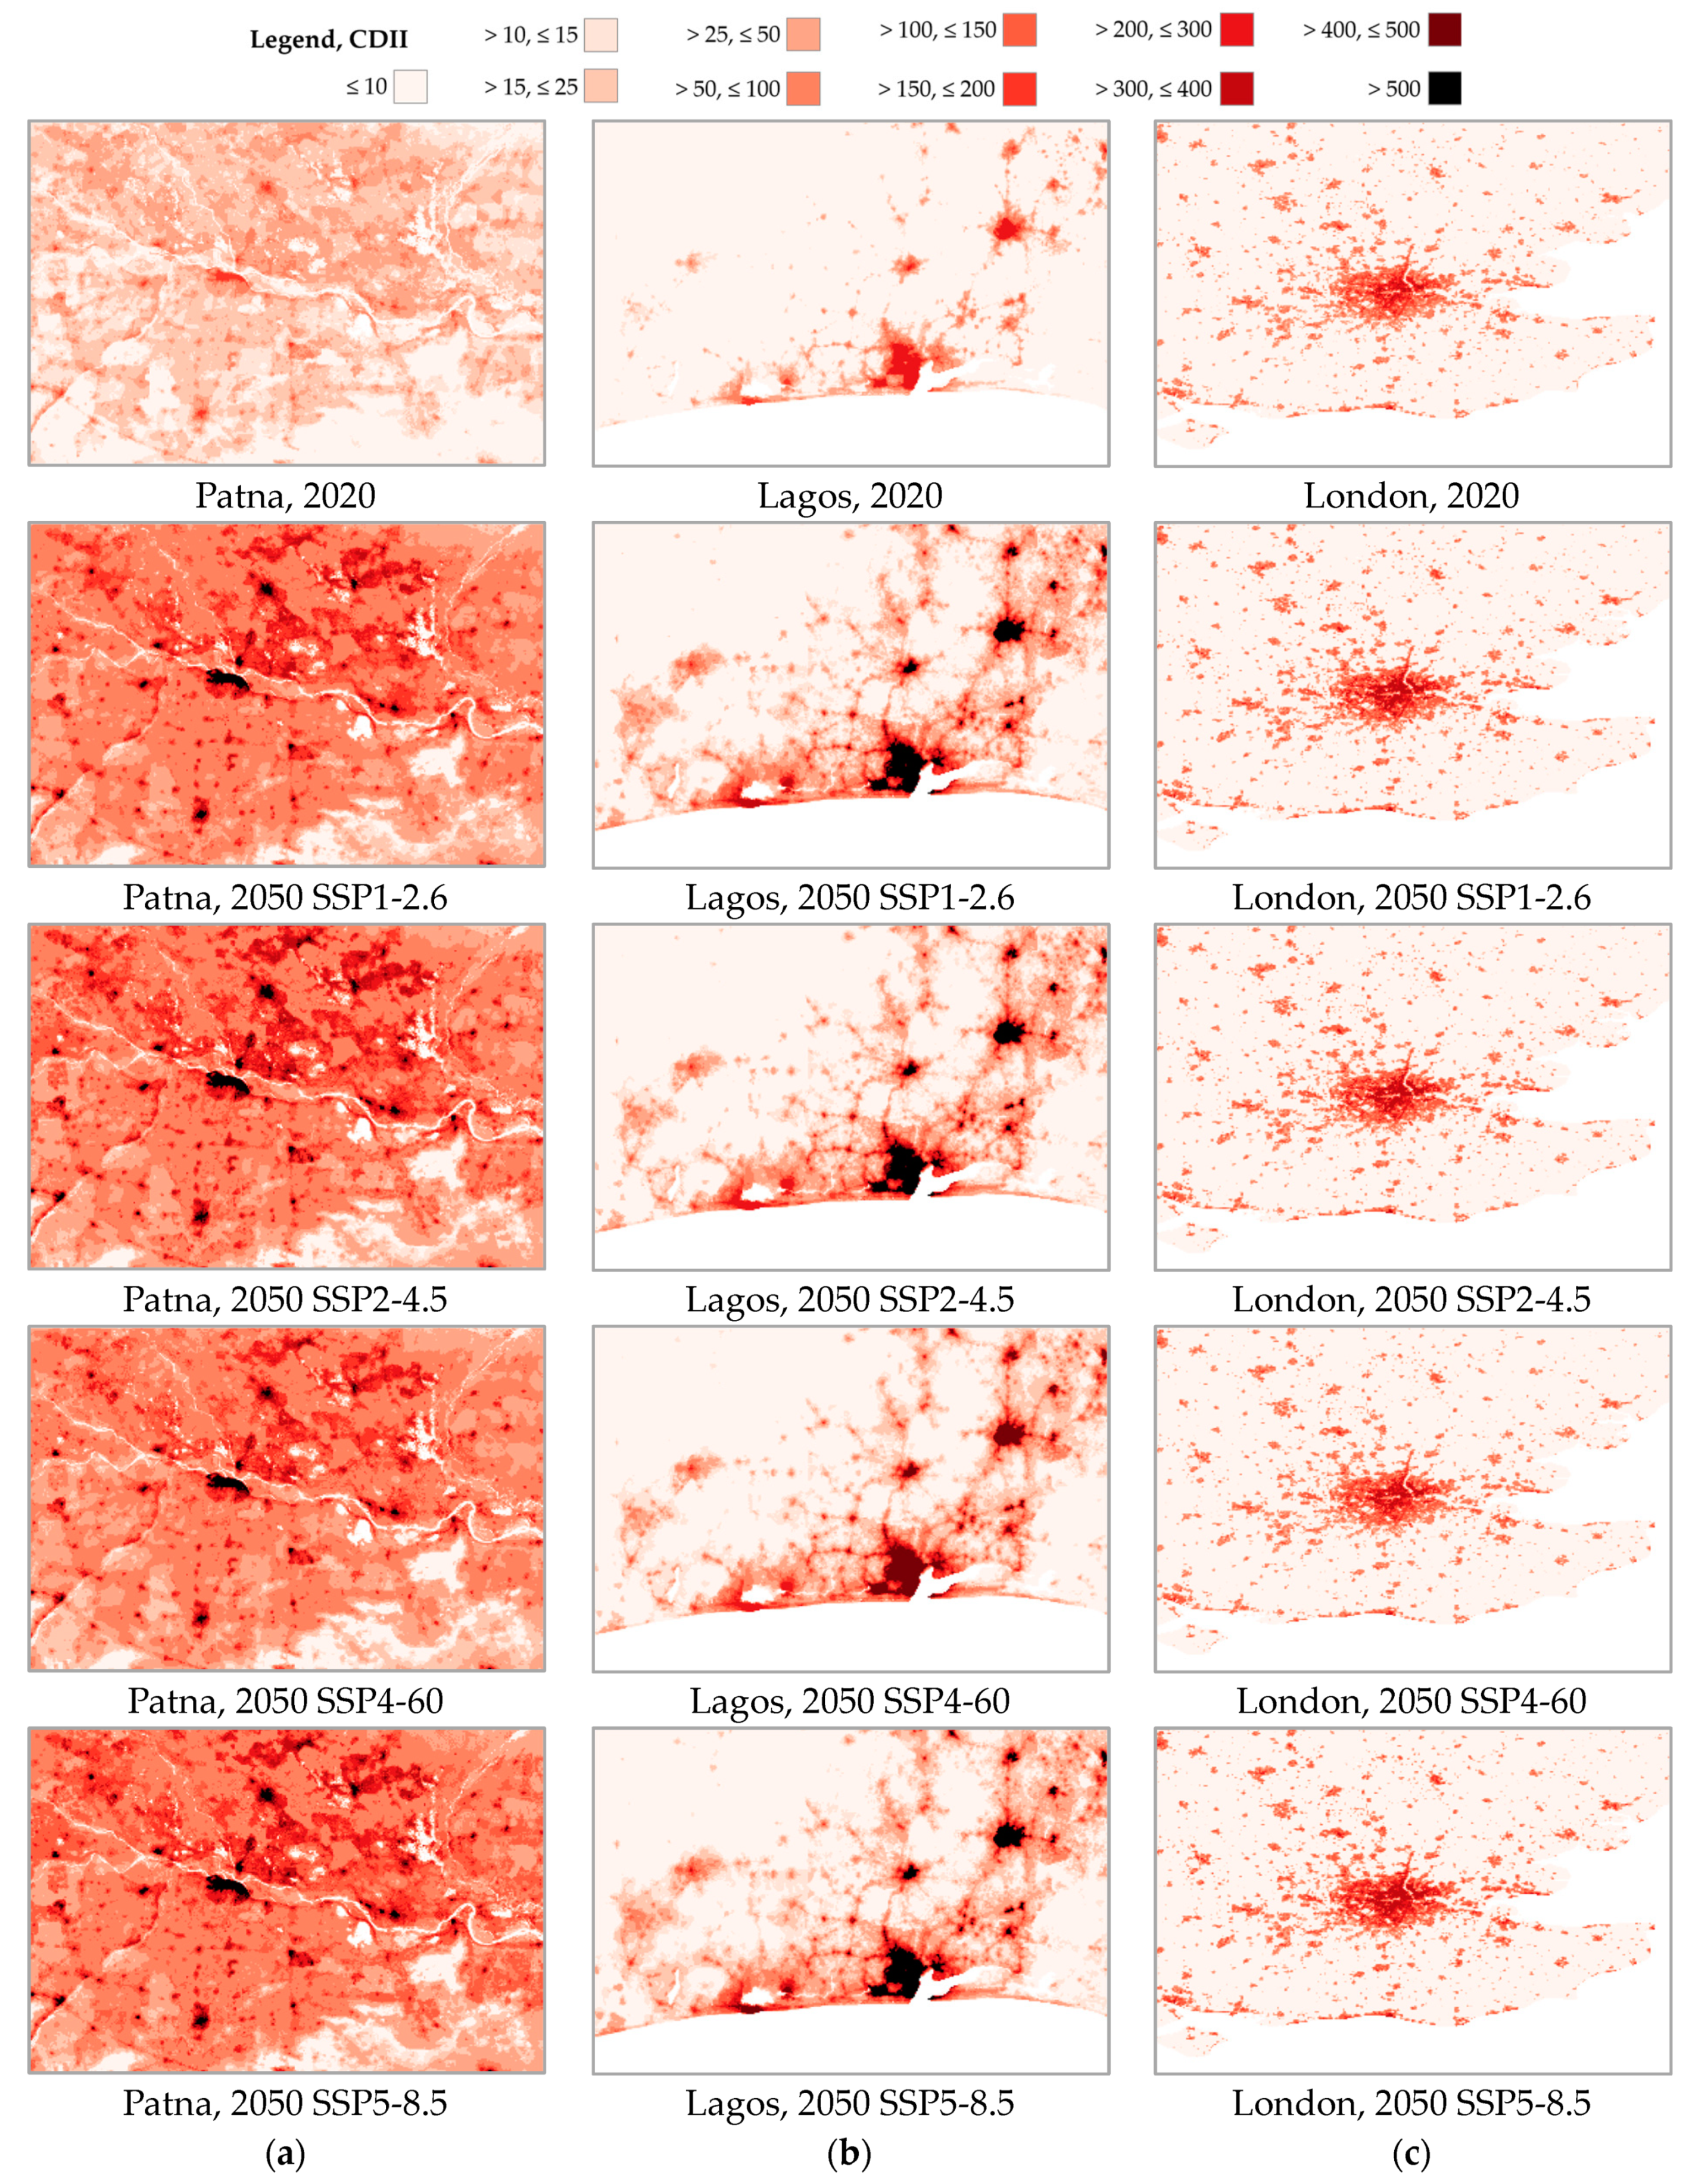
Figure 15.
Comparison of area of CDMI hot spots with a CDMI >500 for 2020 and 2050 SSP5-8.5 for the 20 countries of highest numbers. (a) 20 countries with the highest number of cooling hot spot areas in 2020. (b) 20 countries with the highest number of cooling hot spot areas in 2050 SSP5-8.5 scenario.

Figure 16.
STCI results for 2050 SSP5-8.5 absorption chillers using water/NH3.
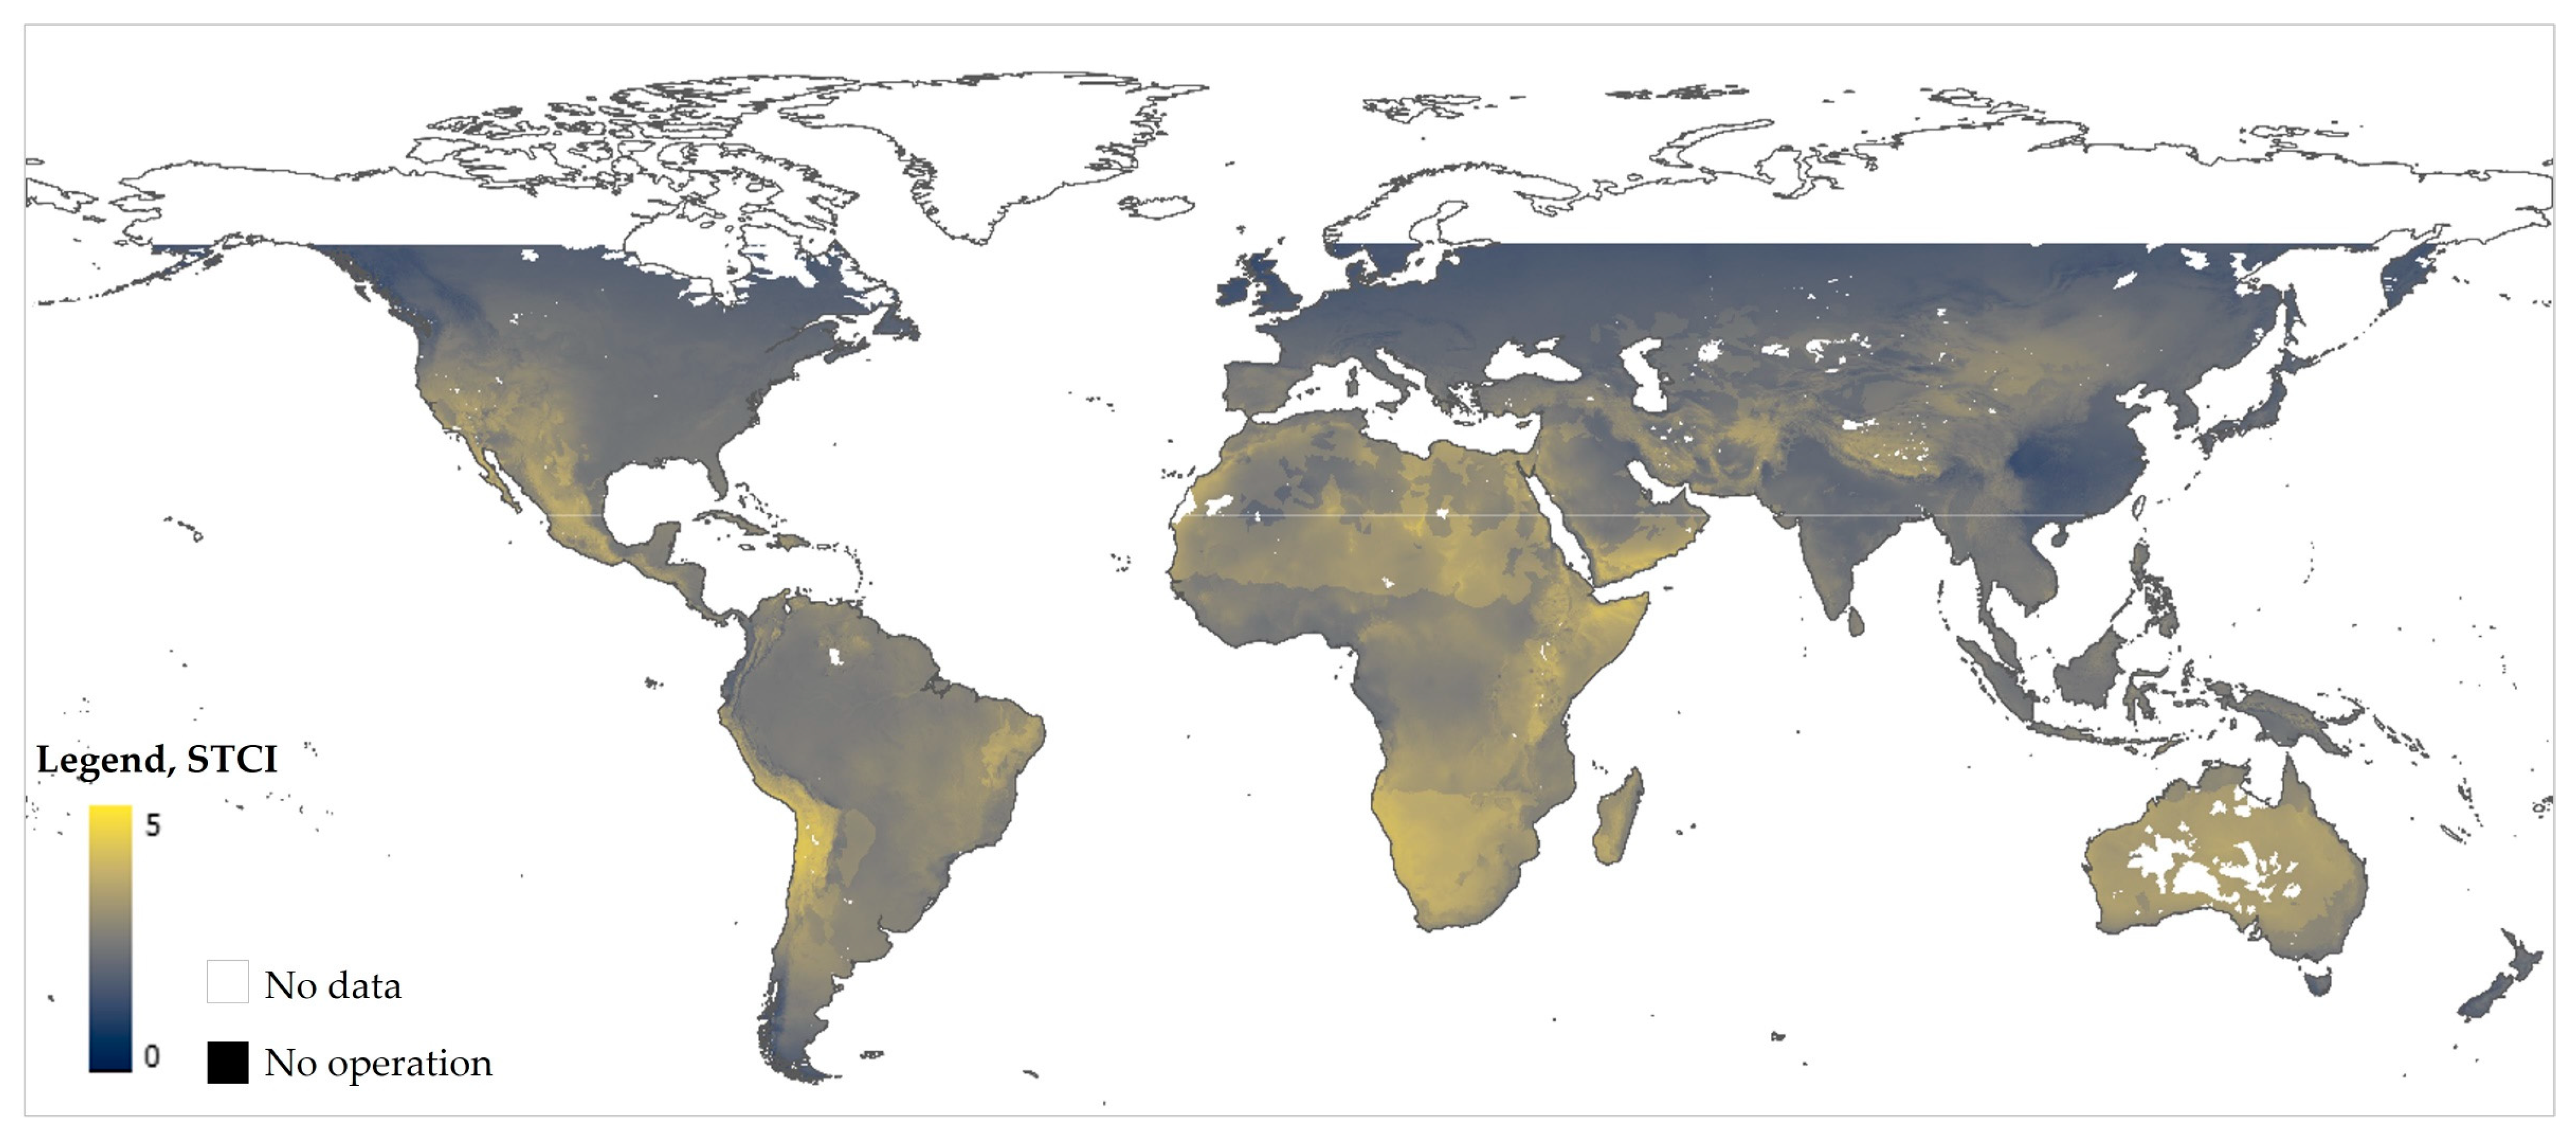
Figure 17.
STCI results for 2050 SSP5-8.5 for absorption chillers using LiBr/water.
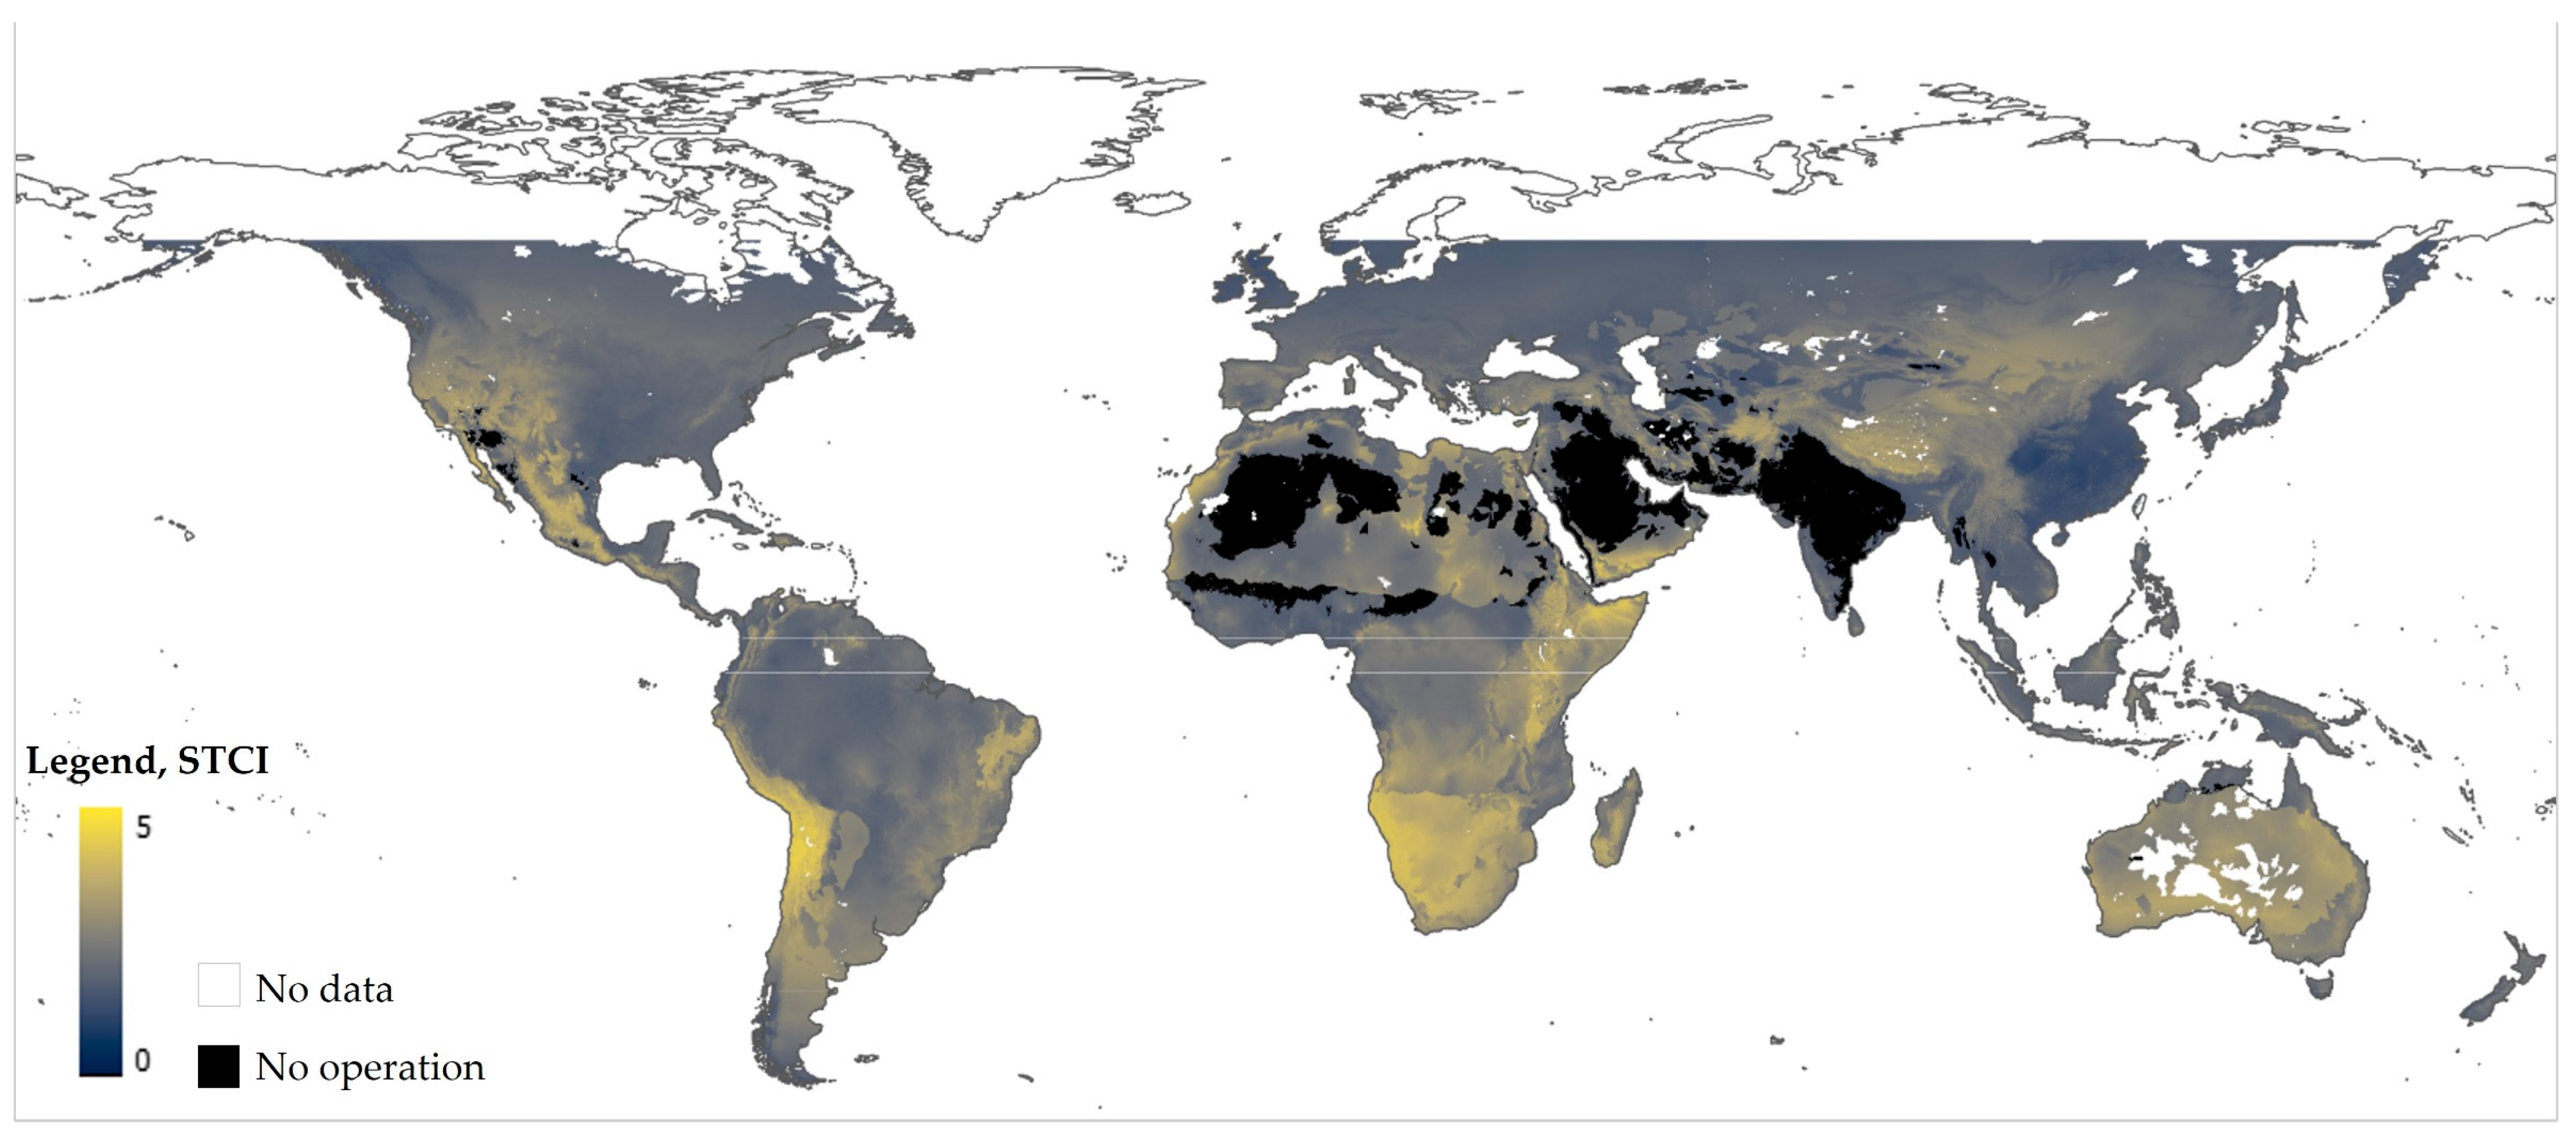
Table 1.
Exemplary calculation of XClimate for two climate zones.
| Climate Zone | CDD Base Temperature | 18 °C | 22 °C | 23 °C | 24 °C | 25 °C | Sum of Weighted Mean CDD | XClimate |
|---|---|---|---|---|---|---|---|---|
| Weighting | 30% | 30% | 20% | 15% | 5% | |||
| BWh | Mean CDD | 5152 | 3691 | 3326 | 2960 | 2596 | 10 | |
| Weighted mean CDD | 1546 | 1107 | 665 | 444 | 130 | 3892 | ||
| Csa | Mean CDD | 2313 | 1516 | 1340 | 1174 | 1018 | 4.2 | |
| Weighted mean CDD | 694 | 455 | 268 | 176 | 51 | 1644 |
Table 2.
List of data applied of cooling demand intensity index GIS analysis.
| Type of Data | Derived from/ Based on | Data Reference |
|---|---|---|
| CDD | [110] | 1970–2018 |
| Climate zone distribution | [111] | 1980–2016 |
| Population density | [91] | 2020 (SSP) |
| GDP per capita | [23,117] | 2020 |
| Climate zone distribution | [19] | 2050 (RCP) |
| Population density | [91] | 2050 (SSP) |
| GDP per capita | [23,115] | 2050 (SSP) |
Table 3.
Comparison of solar thermal cooling system and the nominal values for heat source temperature (Thot), chilled water outlet temperature (Tchill), inlet cooling water temperature (Tcool, in) range considered and the range of nominal thermal coefficient of performance (COPth).
Table 3.
Comparison of solar thermal cooling system and the nominal values for heat source temperature (Thot), chilled water outlet temperature (Tchill), inlet cooling water temperature (Tcool, in) range considered and the range of nominal thermal coefficient of performance (COPth).
| Energy Source | Physical Base | Sorption and Refrigerant Material | Thot [°C] | Tchill [°C] | Tcool, in [°C] | COPth (Nominal) |
|---|---|---|---|---|---|---|
| Thermal (single effect only) | Liquid (Absorption) | water/NH3 | 90 | 6 | 20–50 | 0.5–0.75 [118] |
| LiBr/water | 85 | 10 | 25–35 | 0.65–0.8 [118] | ||
| Sold (Adsorption) | Zeolite/water | 85 | 15 | 25–45 | 0.5–0.75 [118] | |
| Silica gel/water | 75 | 10 | 25–36 | 0.5–0.75 [118] |
Table 4.
List of data and associated information used in STCI calculation.
| Type of Data | Derived from/Based on | Data Reference |
|---|---|---|
| GHI | [120] | 1994/1999/2007–2021 |
| Air Temperature | [19] | 2050 (RCP) |
| Climate Zone | [19] | 2050 (RCP) |
| Water Stress | [119] | 2050 (SSP & RCP) |
Table 5.
Combined results of CMDI and STCI. The table presents the share of CDMI and area covered by each chiller technology.
Table 5.
Combined results of CMDI and STCI. The table presents the share of CDMI and area covered by each chiller technology.
| Scenario 2050 | Type of Data | Absorption Chiller | Adsorption Chiller | ||
|---|---|---|---|---|---|
| LiBr | NH3 | Silica Gel | Zeolite | ||
| SSP2-4.5 | Coverage of world CDMI | 74% | 99% | 78% | 99% |
| Coverage of world area in STCI (in CDMI) | 94% (83%) | 100% (89%) | 95% (84%) | 100% (89%) | |
| SSP5-8.5 | Coverage of world CDMI | 72% | 99% | 76% | 99% |
| Coverage of world area in STCI (in CDMI) | 92% (80%) | 100% (87%) | 94% (82%) | 100% (87%) | |
Disclaimer/Publisher’s Note: The statements, opinions and data contained in all publications are solely those of the individual author(s) and contributor(s) and not of MDPI and/or the editor(s). MDPI and/or the editor(s) disclaim responsibility for any injury to people or property resulting from any ideas, methods, instructions or products referred to in the content. |
© 2023 by the authors. Licensee MDPI, Basel, Switzerland. This article is an open access article distributed under the terms and conditions of the Creative Commons Attribution (CC BY) license (https://creativecommons.org/licenses/by/4.0/).
Share and Cite
MDPI and ACS Style
Strobel, M.; Jakob, U.; Streicher, W.; Neyer, D. Spatial Distribution of Future Demand for Space Cooling Applications and Potential of Solar Thermal Cooling Systems. Sustainability 2023, 15, 9486. https://doi.org/10.3390/su15129486
AMA Style
Strobel M, Jakob U, Streicher W, Neyer D. Spatial Distribution of Future Demand for Space Cooling Applications and Potential of Solar Thermal Cooling Systems. Sustainability. 2023; 15(12):9486. https://doi.org/10.3390/su15129486
Chicago/Turabian StyleStrobel, Michael, Uli Jakob, Wolfgang Streicher, and Daniel Neyer. 2023. "Spatial Distribution of Future Demand for Space Cooling Applications and Potential of Solar Thermal Cooling Systems" Sustainability 15, no. 12: 9486. https://doi.org/10.3390/su15129486
Note that from the first issue of 2016, this journal uses article numbers instead of page numbers. See further details here.