Article

A Spatial Decision Support System for Modeling Urban Resilience to Natural Hazards

by
Hamid Rezaei
1,
Elżbieta Macioszek
2,*,
Parisa Derakhshesh
3,
Hassan Houshyar
4,
Elias Ghabouli
5,
Amir Reza Bakhshi Lomer
6,
Ronak Ghanbari
7 and
Abdulsalam Esmailzadeh
8
1
Department of Civil and Environmental Engineering, Florida International University, Miami, FL 33174, USA
2
Department of Transport Systems, Traffic Engineering and Logistics, Faculty of Transport and Aviation Engineering, Silesian University of Technology, 40-019 Katowice, Poland
3
Department of Urban Design, Faculty of Engineering, North Tehran Branch, Islamic Azad University, Tehran 1651153511, Iran
4
Department of Geography, Faculty of Social Science, Payame Noor University, Tehran 193954697, Iran
5
Department of Urban Planning & Design, Faculty of Arts and Architecture, Tarbiat Modares University, Tehran 14115, Iran
6
Department of Geography, Birkbeck, University of London, London WC1E 7HX, UK
7
Department of Computer Science, Atmospheric and Environmental Research Lab, University of Iowa, Iowa City, IA 52242, USA
8
Department of Social Planning, Faculty of Social Science, Allameh Tabataba’i University, Tehran 1544915113, Iran
*
Author to whom correspondence should be addressed.
Sustainability 2023, 15(11), 8777; https://doi.org/10.3390/su15118777
Submission received: 2 April 2023 / Revised: 24 May 2023 / Accepted: 25 May 2023 / Published: 29 May 2023

Abstract

:
A major component of urban management is studying and evaluating urban resilience in order to minimize the effects of natural hazards. This is because of the increasing number of natural hazards occurring worldwide. A spatial decision support system is presented for modeling urban resilience and selecting resilient zones in response to natural hazards. This system is implemented based on 22 criteria, grouped into three categories: demographics, infrastructure, and environmental. The criteria are then standardized using minimum and maximum methods, and their importance is determined by the analytical hierarchy process (AHP). The resilience maps in various scenarios are prepared using the ordered weighted average (OWA) method. Flow accumulation (distance from fault), vulnerable population density (vulnerable population density), and distance from road network (material type) were regarded as the most important criteria for flood resilience (earthquake resilience) from environmental, demographic, and infrastructure criteria, respectively. There are different areas that are considered to have very low resilience depending on the risk attitude. According a pessimistic scenario, 1% of Tehran’s area has very low resilience, while according to an optimistic scenario, 38% has very low resilience. This system can be used by urban planners and policymakers for the purpose of improving resilience to natural hazards in low-resilience areas.

1. Introduction

Over the past few decades, natural hazards have become increasingly common and their destructive effects (both economic and human) have increased dramatically [1]. Global statistics indicate that 40% of social and economic damage is caused by natural hazards each year [2]. There are several types of natural hazard that occur throughout the world, including earthquakes, landslides, floods, droughts, fires, tornadoes and severe storms [3]. In the period from 2006 to 2021, natural hazards affected approximately 271 million people per year. They caused approximately 70,000 deaths and $135 billion in damage around the world [4]. As a result of inadequate infrastructure, social injustices, physical growth, population density, and inappropriate spatial planning, urban areas are often prone to natural hazard’s risks [5]. Currently over half of the world’s population lives in cities. More than 70% of the world’s population is expected to live in urban areas by 2050 [6]. In light of this, it becomes increasingly necessary to pay particular attention to the reduction of risk and to urban adaptation.
Natural hazards such as earthquakes and floods are the most common. Earthquakes are considered one of the most devastating and unforeseen natural hazards in terms of their effects and risks regarding human life [7]. In comparison to other types of environmental disasters, earthquakes rank second in terms of their effects. In the last 90 years, Iran, which is considered a country prone to earthquakes, has experienced 18 earthquakes with a magnitude greater than 7 Richter, resulting in severe economic and social damage and high deaths. There were an estimated 40,000 to 50,000 deaths from the 1990 northern Iran earthquake, one of the most destructive earthquakes in Iran [8]. Similarly, floods are also a serious natural hazard which are mainly caused by changes in land use, vegetation removal, soil erosion, drainage system limitations, and the occupation of floodplains or flood-prone areas [9]. It is anticipated that the number of people who will be affected by river floods worldwide will increase to 54 million by 2030 as a result of socio-economic development and climate change [10]. Therefore, it is important to take proactive steps to mitigate the risk of floods to protect communities from potential devastation.
Increasing resilience is one of the most appropriate measures for preparing cities for these hazards. Resilience is defined by Knaapen et al. [11] and Dimelli [12] as the ability of a system or group at risk to adapt and recover from the effects of risk through the maintenance and restoration of fundamental functions and structures. Since the majority of resilience studies primarily focus on physical conditions, it has been recognized that a variety of aspects (economic, social, educational and cultural) can contribute to physical damage [13]. Recent developments have led to the emergence of an alternative approach that takes a social perspective. This approach takes into account the vulnerability of individuals and communities, as well as their economic, social, and cultural capabilities [14]. According to Bruno et al. [15], resilience refers to the ability of social units to reduce the risks associated with natural hazards. They identified three aspects of resilience: the ability to reduce the consequences of failure, the ability to reduce the probability of failure, and the ability to reduce recovery time. As cities continue to grow and become denser, as well as facing threats from natural hazards, it is essential to pay attention to and improve resilience within cities. This should be considered an essential component of urban management as a means of reducing disaster risk. In the event of natural disasters or a lack of resources, urban environments with a high level of resilience will not suffer from disruption. In the context of natural hazards, spatial analysis can provide valuable information to managers, municipalities, and urban planners regarding potential risks. As a result of this information, urban environments can reduce the potential negative social and economic impacts of future natural disasters.
The preparation of resilience maps can be improved by integrating multi-criteria decision making (MCDA) with geographic information systems (GIS), as demonstrated in previous studies [16,17,18,19,20]. While GIS is a tool for analyzing, editing, and managing spatial data, multi-criteria decision-making methods involve combining and transforming criteria maps and decision-makers’ priorities to obtain valuable decision-making information [21,22]. To provide useful information for spatial decision-making, the GIS-MCDA method combines map criteria with values obtained by decision-makers’ judgment [23,24,25]. The combination of GIS and MCDA has been used in some studies to prepare resilience maps. Tayyab et al. [26] employed a hierarchical model combined with GIS to assess urban flood resilience in Peshawar, Pakistan. Kaaviya & Devadas [27] used MCDA and GIS to determine water resilience in India in their study. In order to develop a resilience map, they considered a variety of topographic, physiological, environmental, ecological, and infrastructural factors. He et al. [28] evaluated fire resilience in Yuxi city, China, based on the analytic network process (ANP) and the preference ranking organization method for enrichment evaluations (PROMETHEEE II). Doorga et al. [16] described a methodology for flood resilience assessment in Port Louis, Mauritius based on the analytic hierarchy process (AHP). Their strategies included building an underground water storage tank in the Champ de Mars, creating flood refugee camps in Vallee Pitot and Cite La Cure, revising building and urban planning regulations, replacing the Caudan underpass with a flyover, and building a diversion tunnel to connect the Saint Louis River to the Grand River to strengthen flood resilience.
One of the MCDA methods is ordered weighted average (OWA), which is a multivariable hybrid method. In the OWA method, the decision makers’ priorities and subjective evaluations are considered [29]. By changing the parameters and criteria, different maps and scenarios can be predicted [30]. As part of a decision-making problem, risk-averse individuals emphasize the inappropriate features of an option and risk-taking individuals emphasize the appropriate features and use them as a criterion for their selection [31]. As a result of this method, it is possible to calculate the level of risk taking and risk aversion, which can then be used to determine the final option. For the past few decades, OWA-based GIS has been utilized for land use analysis such as health care [32], residential-quantity assessment [33], natural-based tourism [34], parking [35], and urban traffic management [36]. GIS-OWA integration has been used for a variety of socio-economic applications, including environmental monitoring [37], natural hazards [10,38], renewable energy [22,39], water resource management [40], and landfill location [41].
Based on prior studies, it is evident that only one natural hazard was considered in the preparation of each resilience map. Many studies around the world have simultaneously investigated several natural hazards in recent years. For example, landslides, erosion, earthquakes, and floods in Greece [42], earthquakes and landslides in India [43], climate hazards in Chile [44], and floods, avalanches, and rock falls in Iran [45]. Depending on the characteristics of each risk and their interactions, one risk may trigger the occurrence of another risk. Tehran, the capital of Iran, has numerous faults around and within it, worn-out areas, a high population density, non-earthquake resistant buildings, and unbalanced physical expansion, all of which contribute to the selection of Tehran as a study area. On the other hand, the steep slopes in the east and north of Tehran, the reduced permeability of the soil, the extent of the city from 700 to 2200 m and the absence of an efficient sewage system are the primary reasons for which Tehran has been chosen as a study area for reducing and managing flood risks. Thus, the main goal of this study is to evaluate the spatial resilience of Tehran city against flood and earthquake risks separately and in combination with each other. For this purpose, a spatial multi-criteria decision-making system with the ability to evaluate resilience based on different mental attitudes is used. Policy makers and planners can take advantage of combined resilience maps in order to develop effective geo-environmental programs and manage resources in a sustainable approach. In addition, according to the capabilities of the spatial multi-criteria decision-making system used, the results of this research can be practical and useful for different stakeholders in different decision-making situations.

2. Materials and Methods

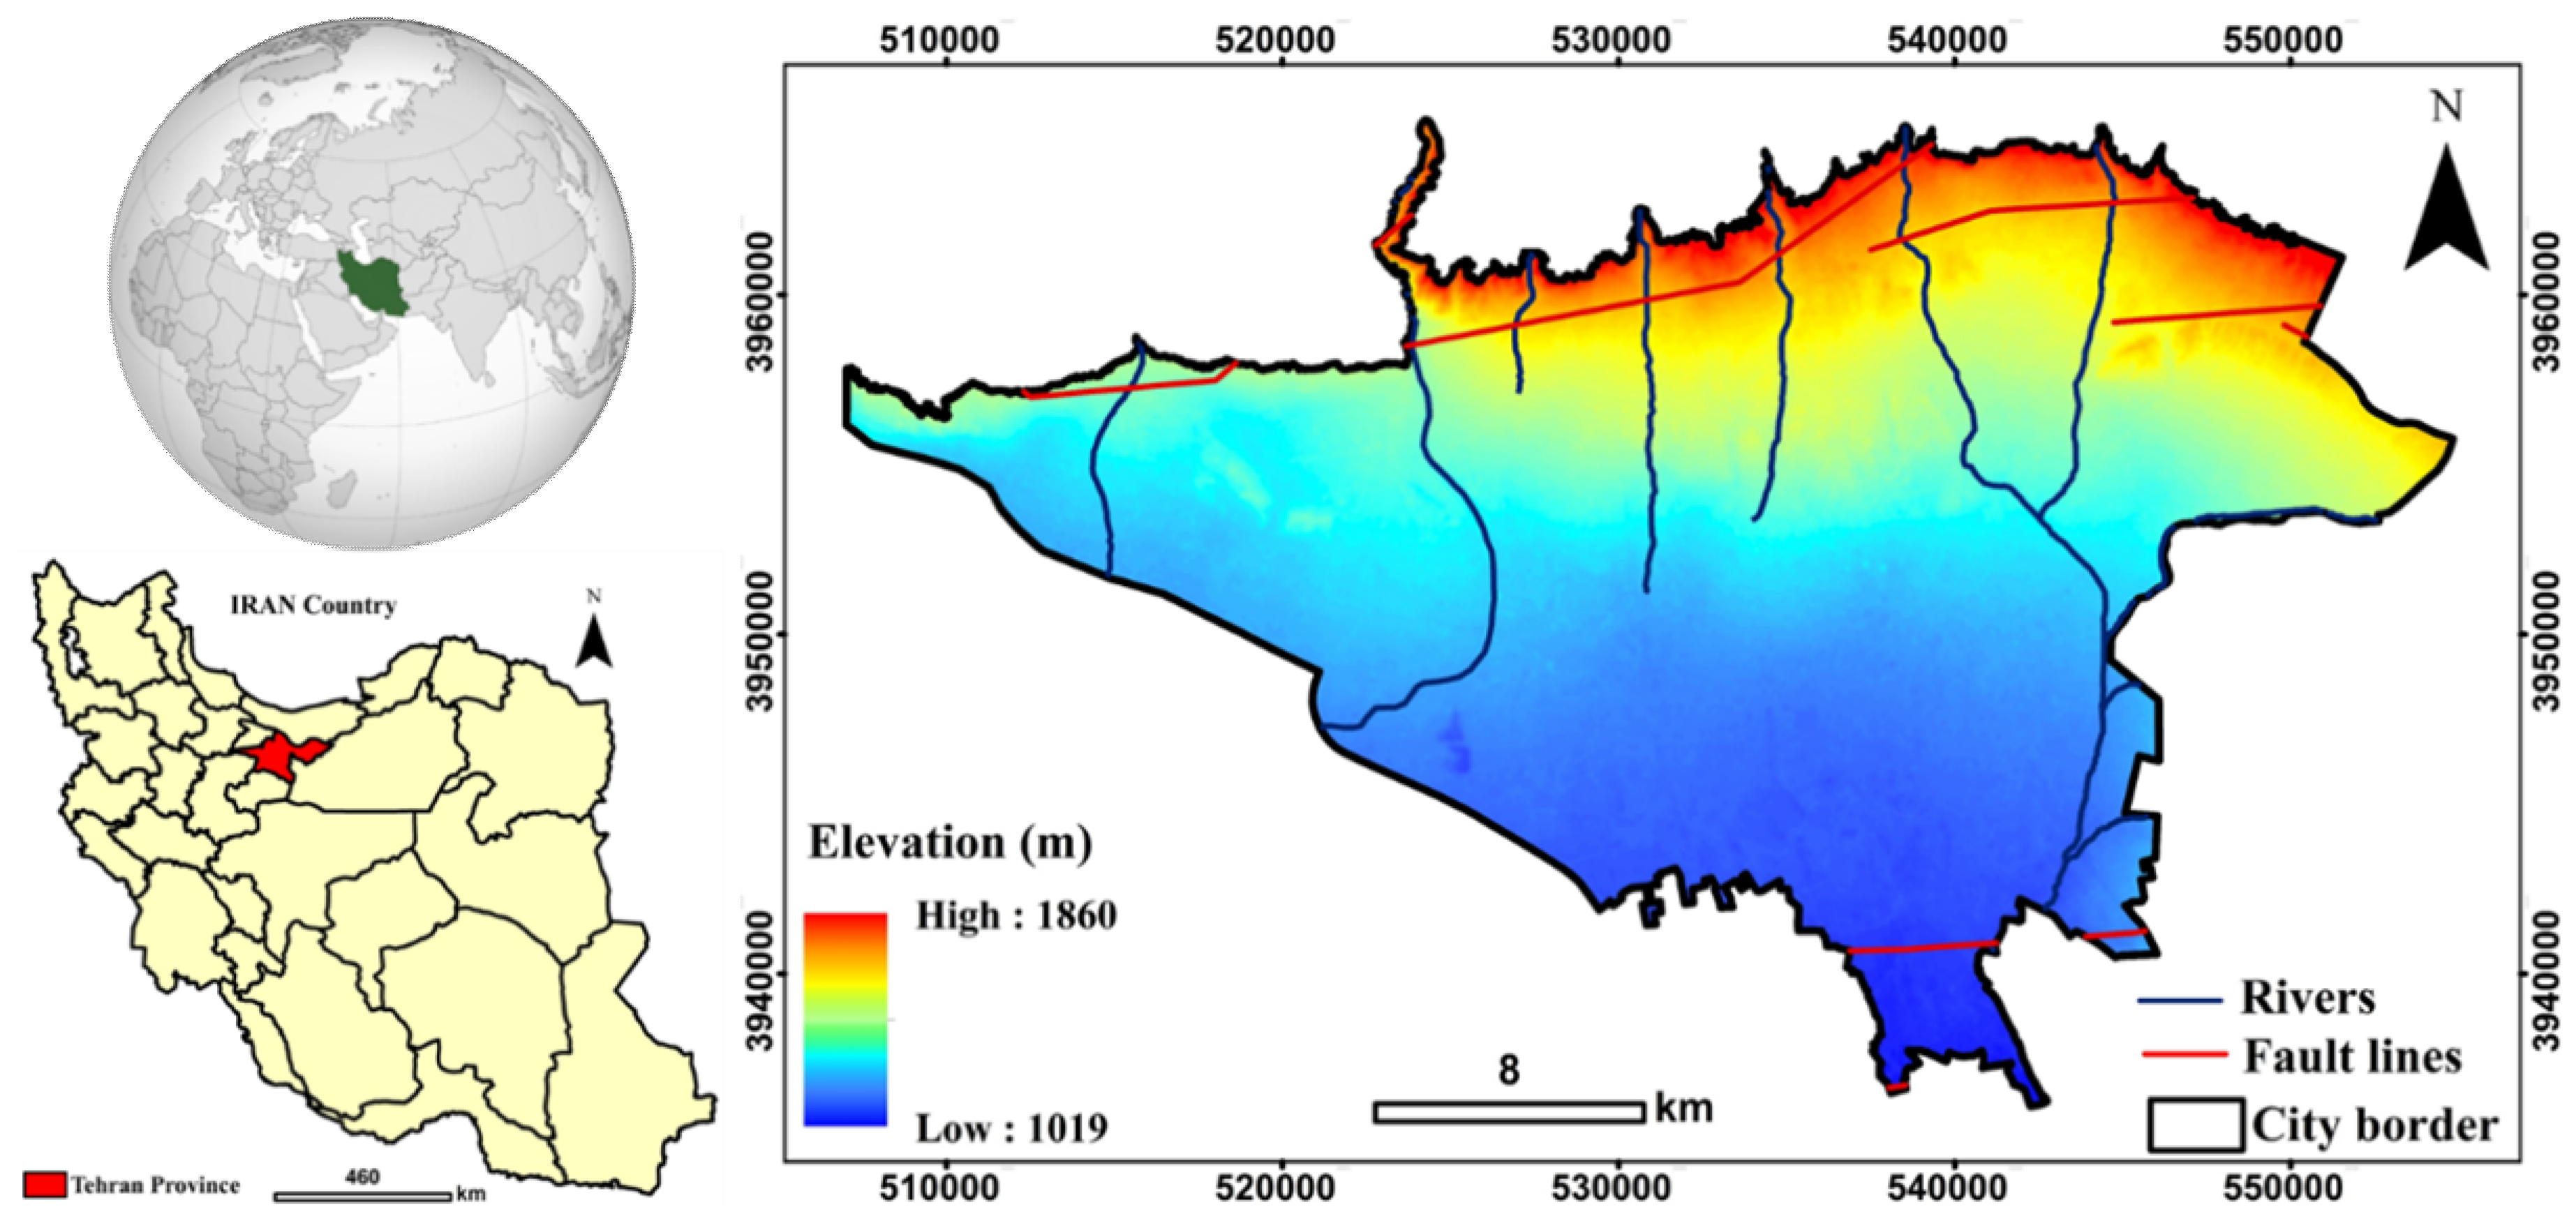
2.1. Study Area and Data Collection

The capital and largest city of Iran, Tehran, is located near the Alborz mountain range in the north of the country (Figure 1). Its area is 730 square kilometers, ranking 27th on the list of the world’s largest cities [46]. In this city, the population fluctuates during the day and at night. Thus, it has a population of over 13 million during the day and over 9 million at night. In other words, it consists of 5.17% of the total population of the country [47]. Compared to the previous decade, Tehran’s population has grown by 1.4%, which indicates an increasing trend. Due to the fact that most of the rivers and canals in Tehran are directed towards the urban area floods may occur in the city of Tehran if heavy rain occurs. Moreover, this city is located on a number of faults, including the North Ray Fault, the North Tehran Fault, and the Mosha Fault [48].
The data used in previous studies differ due to various factors such as availability, geographic location of the study area, and the opinion of relevant experts. This study utilized two spatial databases (remote sensing products and organization-derived data) for the development of flood and earthquake resilience maps. The effective criteria for flood and earthquake resilience are categorized into three main groups: environmental, demographic, and infrastructure. Based on the capabilities of each layer at each stage, ArcGIS 10.3 software was used to produce and analyze information layers and prepare maps. The details of the data used are presented in Table 1.
There were 82 academic and organizational specialists included in the statistical population for this study. For flood resilience, 42 experts have provided their opinions (including experts in flood engineering and natural disasters, urban management, natural resources engineering, and GIS analysts) and for earthquake resilience, 40 experts have provided their opinions (including experts in earthquake engineering and natural disasters, structural engineering, urban management, urban planners, and GIS analysts). Out of 82 experts, 12 experts have bachelor’s education, 30 experts have master’s education, and 40 experts have doctorate education and above. Additionally, their age range is between 28 and 60 years.

2.2. Methodology

As shown in Figure 2, the research method in this study consists of 5 steps. The first step of the analysis is to identify the most relevant factors for each risk based on the literature review and experts’ opinions, and then collect and pre-process the data. In the second step, maps of environmental, demographic, and infrastructure criteria will be prepared using spatial analysis. The third step involves standardizing the criteria and calculating the weights and importance of the criteria by applying the AHP method. In the fourth step, the output of step (3) was entered into the OWA model and resilience maps were prepared for floods and earthquakes in each scenario. As a fifth step, flood and earthquake resilience maps were combined.

2.2.1. Standardization of Criteria
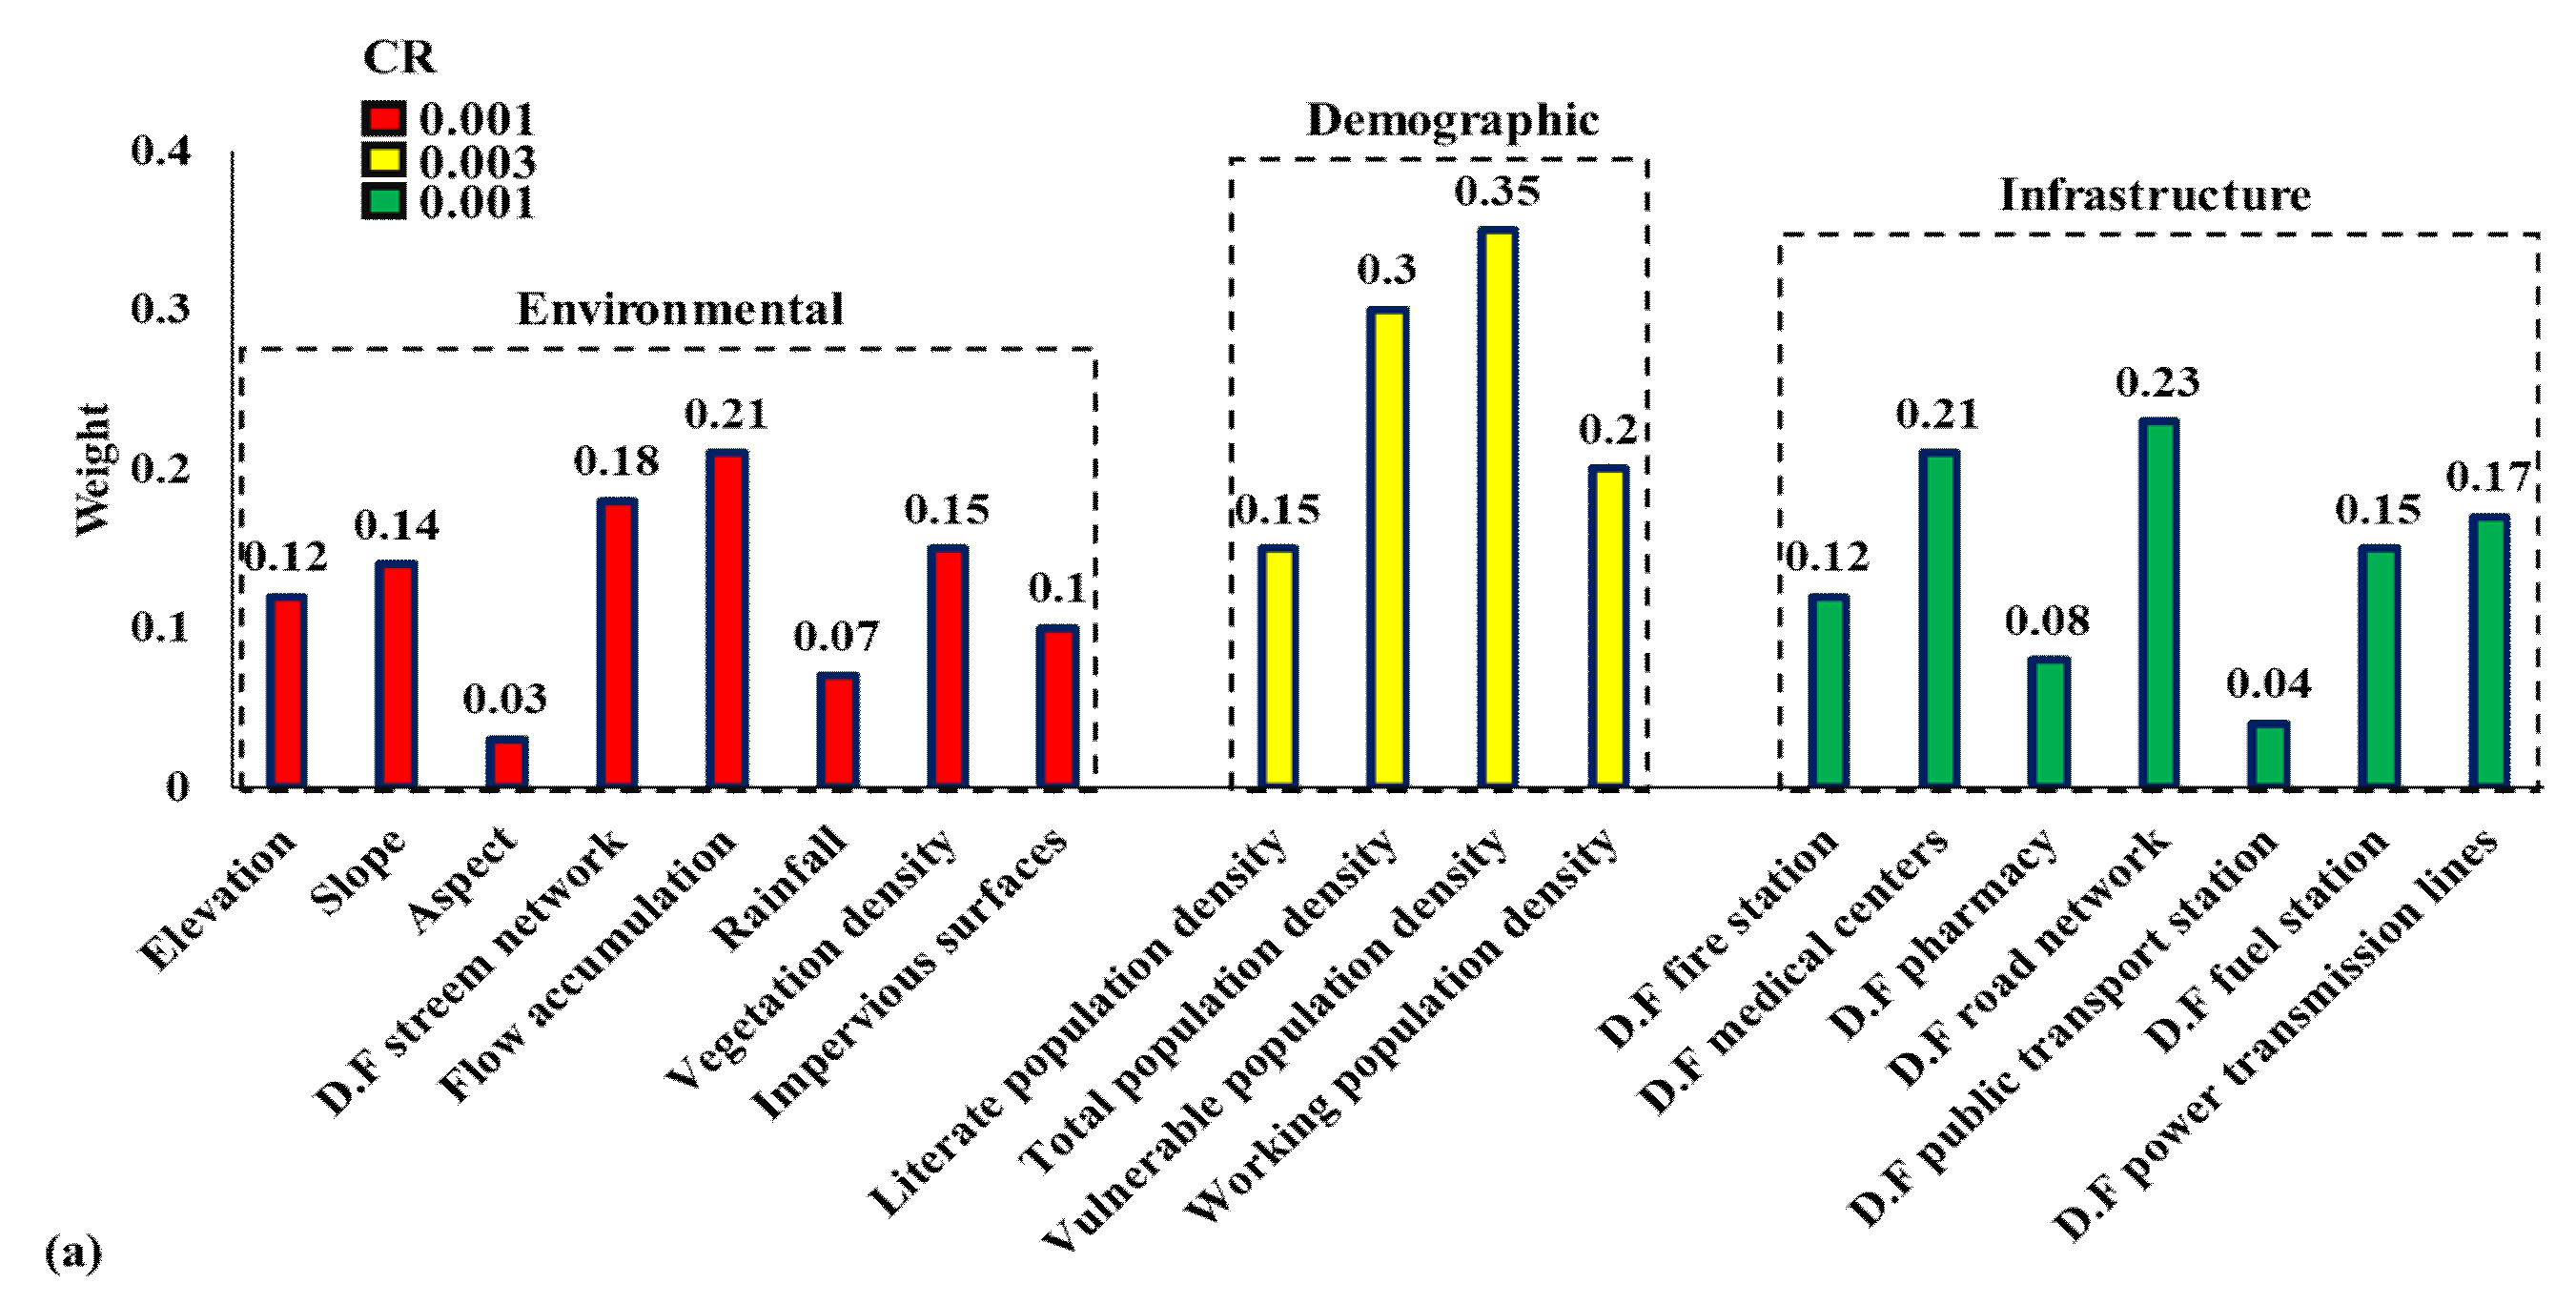
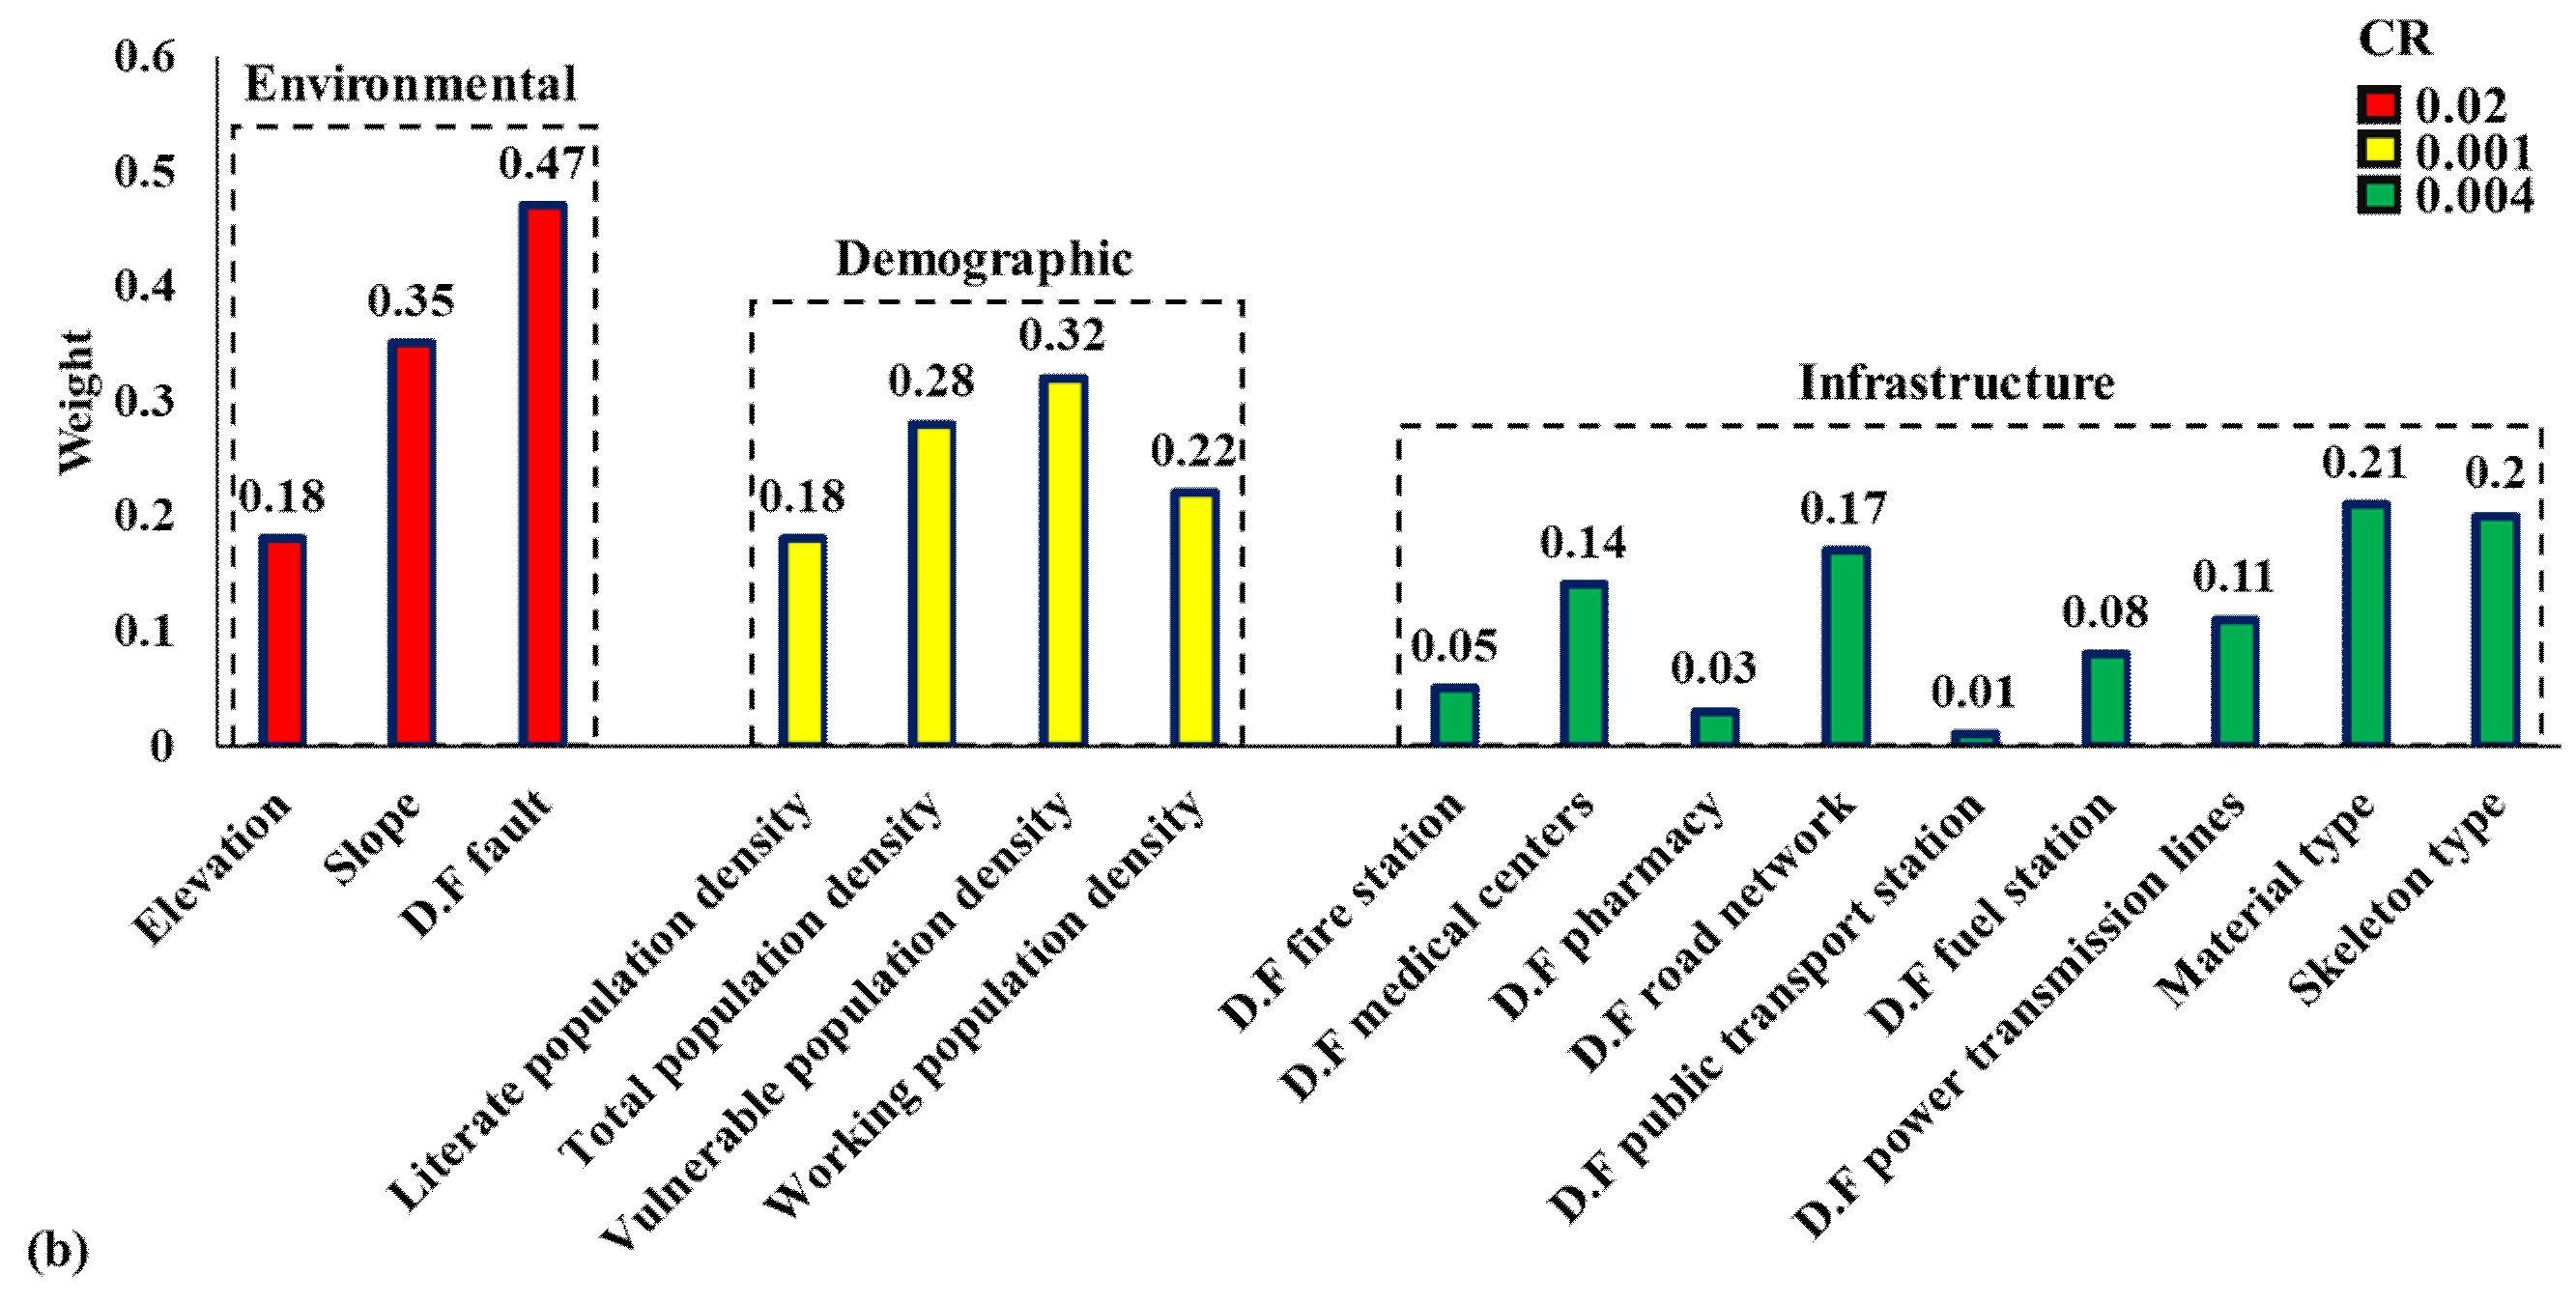
As a result of the different nature of factors as well as the inconsistency of units and dimensions, they cannot be used directly in the modeling process. [49]. The “slope” criterion, for example, is expressed as a percentage and the “distance from road network” criterion is expressed as km. In order to be evaluated in comparison with each other, the layers must be converted into comparable units. Equation (1) is used in the case of criteria whose high values decrease resilience (such as elevation), whereas Equation (2) is used in the case of criteria whose low values decrease resilience (such as distance from fault).
Y i = y i y min y max y min
Y i = y max y i y max y min
where, Yi is the standardized value of criterion i, yi is the initial value of criterion i, ymax is the maximum value of criterion i, and ymin is the minimum value of criterion i [50].

2.2.2. AHP

The AHP method, which was invented by Saaty [51], is one of the most popular methods of MCDA. Using AHP makes it possible to combine qualitative and quantitative criteria when faced with several options and decision-making factors [52]. By comparing alternatives and decision criteria in pairs or pairwise, this method enables us to combine qualitative and quantitative criteria simultaneously [53]. Due to this, decision makers can focus solely on comparing two criteria or options without external interference. Furthermore, the pairwise comparisons provide valuable information for the investigated problems and rationalize the decision-making process since the respondent only compares two factors [54]. The AHP method generally includes the following steps [55]:
  • Define the problem and express its goals in a clear manner (hierarchical tree design).
  • Separate the defined problem into decision elements (criteria and options).
  • Form a decision-making matrix using pairwise comparisons.
  • Use the eigenvalue method to estimate the relative weight of decision-making criteria.
  • Calculate the compatibility rate of matrices to ensure the compatibility of decision-makers’ judgments.
  • Collect the decision weights for the overall ranking of the criteria.
For pairwise comparisons, Saaty and Vargas [56] define a suitable measurement scale. Verbal judgments are expressed as a degree of importance: equal importance = 1, somewhat more importance = 3, much more importance = 5, very much more importance = 7, absolutely more importance = 9, and intermediate values = 2, 4, 6, and 8. The inverse relationship is expressed by the reciprocal of these numbers. The compatibility index (CI) is calculated in Equation (3).
CI = λ max n n 1 .
where, n is the number of pairwise comparison matrix criteria and λ max is the greatest eigenvalue of pairwise comparison matrix. The consistency index of a randomly generated reciprocal matrix is known as the random index (RI). The average RI value for matrices is between 1 and 15. When the consistency ratio (CR) is less than or equal to 0.1, the system is considered to have acceptable consistency; when the CR is greater than 0.1, decision makers should review their judgments. After this, CR is calculated using Equation (4).
CR = CI RI .

2.2.3. OWA

In the OWA method, different operators and sets of ordered weights can be used to apply to a wide range of multi-criteria evaluation strategies [57]. A major objective of the OWA method is to provide decision makers with a quantitative assessment of a range of very optimistic to very pessimistic scenarios. Thus, a variety of risk attitudes among decision makers will be assessed as a factor influencing the final result [58]. Ranking criteria and dealing with the uncertainty resulting from their interaction is the purpose of OWA [59]. As a result of the OWA method, a continuous ranking of scenarios occurs between an intersect operator (risk-averse) and a union operator (risk-taking) [60]. This method is similar to the WLC method but includes two sets of weights. The first set of weights controls the relative contribution of a specific criterion, while the second set of weights controls the aggregation rank of the weighted criteria [61]. The advantage of the OWA method is that the decision-maker is able to produce a wide range of maps and different solutions and scenarios by rearranging and changing criteria [62]. In contrast to Boolean logic overlap, the intersect operator (AND) indicates a low risk of decision making and the union operator (OR) indicates a high risk of decision making [63]. Using this method, a wide range of risk scenarios can be prepared between community and shared operators; this is described using Equation (5).
OWA = j = 1 n w j v j j = 1 n w j v j Z i j
where, vj is the order weight, wj is the criterion weight, and Zij is the attribute value of the j criterion of the i pixel that has been standardized and hierarchically assigned [64].

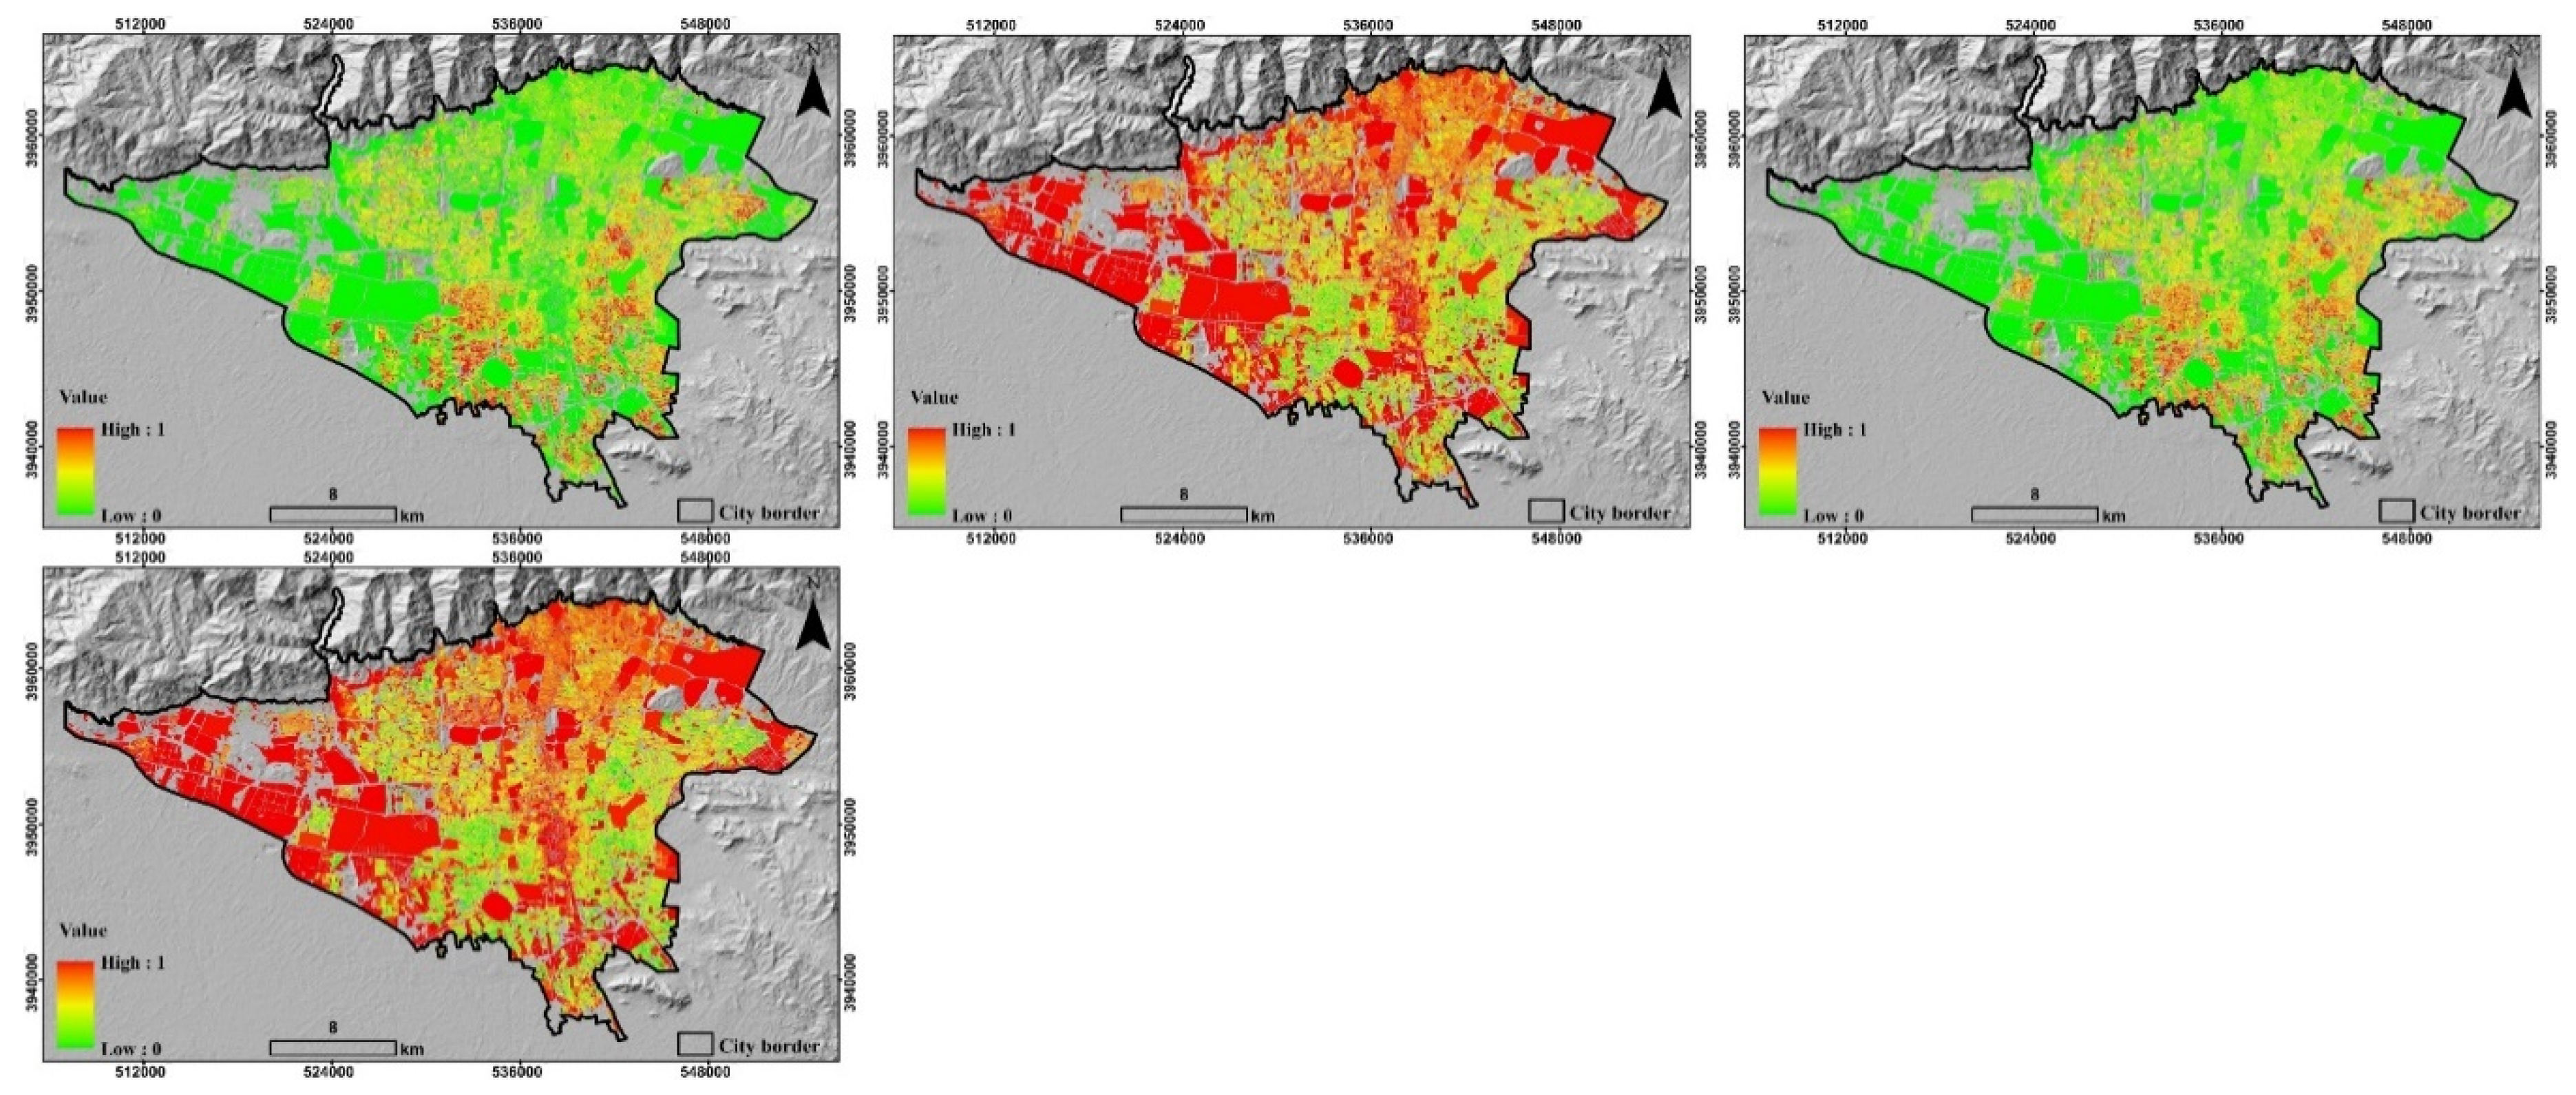
3. Results and Discussion

Based on the matrix of pairwise comparisons, Figure 3a,b illustrates the weight given to each of the effective flood and earthquake resilience criteria, respectively. Among the environmental, demographic, and infrastructure criteria for flood resilience, flow accumulation (0.21), vulnerable population density (0.35), and distance from road network (0.23) have the highest weight and aspect (0.03), literate population density (0.15), and distance from public transportation stations (0.04) have the lowest weight. Furthermore, among the environmental, demographic, and infrastructural criteria for earthquake resilience, the distance from fault (0.47), the density of vulnerable population (0.32), and the material type (0.21) have the highest weight and elevation (0.18) and distance from public transportation stations (0.01) have the lowest weight. The weight of environmental, demographic and infrastructure criteria for preparing flood (earthquake) resilience maps is 0.33 (0.35), 0.45 (0.45), and 0.22 (0.20), respectively. The consistency rate for the pairwise comparison matrix was less than 0.1, indicating consistency and reliability among the experts. To achieve the CR value, the evaluation process of experts’ opinions was repeated three times.
Related spatial analyses have been used to prepare criterion maps. For example, the “Euclidean distance” spatial analysis was used to produce the “distance from fault” map. After preparing the criterion map, the minimum and maximum standardization method was employed to scale the criterion values (Figure 4, Figure 5 and Figure 6).
The minimum standardization method was used for distance from stream network, vegetation density, working population density, literate population density, distance from fuel stations, distance from power transmission lines, and distance from faults. Meanwhile, the maximum standardization method was used for distance from fire station, distance from medical centers, distance from pharmacy, distance from road network, distance from public transport station, aspect, total population density, vulnerable population density, impervious surfaces, precipitation, materials, and skeleton type. All criteria have standardized values between 0 and 1. Therefore, for each criterion, 0 indicates low resilience and 1 indicates high resilience.
The standardized maps, along with the weights extracted using the AHP method and the order weights, were defined as inputs to the OWA model. A flood and earthquake resilience map with environmental, demographic and infrastructure dimensions (Figure 7 and Figure 8), was prepared as a result of this study. Based on standardized values (between 0 and 1), resilience maps were divided into five classes: 0–0.2 (high resilience), 0.2–0.4 (high resilience), 0.4–0.6 (moderate resilience), 0.6–0.8 (low resilience), and 0.8–1 (very low resilience). In multiple dimensions of resilience maps, it was observed that areas with very low resilience increased as the degree of optimism increased, while areas with very high resilience decreased.
Maps of flood resilience in the environmental dimension indicate that the majority of areas with low resilience are found in the north and northeast. The most critical reason is the high elevation and slope of the northern regions as well as the concentration of rivers in the northeast of Tehran. Conversely, areas with high resilience are strategically located in the center and south of Tehran. In the maps of earthquake resilience in the environmental dimension, the northern and southern areas of Tehran were placed in the class of very low resilience. This is due to the fact that these areas are the closest to fault lines. As a result of the demographic dimension, Tehran’s central, southern, and eastern areas display very low resilience to both floods and earthquakes. The most significant reason is the migration of people from other provinces to these areas due to the low price of rent and land. These areas also have a high density of commercial and economic activities. In the infrastructural dimension of resilience maps, it is evident that the suburbs of the city, particularly in the northwest and southeast regions, have low resilience to floods and earthquakes. These areas are far from medical centers and fire stations. They are also characterized by an excessive level of urban decay.
By generating different scenarios, the OWA method allows planners and managers to make decisions based on conditions (financial, time, and environment). Planners and managers typically have three types of attitudes: risk-taking attitude, neutral attitude, and risk-averse attitude. Planners and managers with a risk-taking attitude are more inclined towards an optimistic scenario. In this view, areas with low resilience encompass a significant portion of the study area, and there is no limit to financial resources available. In contrast, when planners and managers are faced with financial and time constraints, they tend to consider a pessimistic scenario where decision making is low risk.
For each dimension (environmental, demographic, and infrastructure) of flood and earthquake resilience, Figure 9 provides the percentage of area of different classes in pessimistic, neutral, and optimistic scenarios. Increasing optimism leads to an increase in the percentage of classes with low resilience and a decrease in the percentage of classes with high resilience. In other words, there is an inverse relationship between the area of the low resilience class and an increase in the optimistic scenario. Generally, under pessimistic decision making, the largest area was for the class with high and very high resilience. In the conditions of neutral decision-making, the largest area was for the class with medium resilience. A class with low and very low resilience occupied the largest area under optimistic decision making. It is estimated that for the flood resilience map in the environmental dimension of the pessimistic scenario, the area of the very low, low, moderate, high, and very high classes is 0.6, 3.7, 7.8, 49.9, and 38.1 percent, respectively. In the neutral scenario, it was 8.1, 20.3, 30.2, 20.5, and 20.9 percent, and in the optimistic scenario, it was 36.4, 35.6, 16, 9.2, and 2.8 percent, respectively.
A pessimistic scenario is more suited to risk-averse planners and managers, since, in this scenario, only a few areas of the study area are selected as being of very low and low resilience. However, these areas have inadequate conditions for all criteria, and managers at these locations are more likely to achieve optimal results. A risk-neutral planner and manager will utilize a balanced decision-making approach in retrofitting and reconstruction projects, finding credit allocation options that are compatible with all effective criteria. There is a 50% probability that the efficiency of these places will reach its expected level in the hazard occurrence. As the standards are average, there should be an increase in quality and safety in these places. In risk-taking planning and management, optimistic scenarios are more common. Under this scenario, even if an area fails to meet optimal conditions for criteria, it is placed very low and very low in the resilient class. As a consequence, a substantial part of the study area with minimal quality is placed in the low and very low resilience class. Therefore, this scenario should only be considered as a last resort.
Individual resilience maps (i.e., floods and earthquakes), created using the OWA method, were used to produce a composite multi-risk resilience map by combining two different risk maps (in environmental, demographic, and infrastructure dimensions). In the end, five resilience classes were identified (Figure 10), ranging from very low resilience to very high resilience. Based on a combination of risk maps, it is apparent that northern regions have a very low level of resilience to flood and earthquake risks when compared to other regions. A considerable area of the central region also falls into this class.
The percentage of the area of different classes of resilience resulting from the combination of risks is shown in Table 2. Based on the results of the multi-hazard map prepared for the city of Tehran, it is evident that under pessimistic, neutral, and optimistic scenarios, 0.73, 0.47, and 0.29 percent of the total area is classified as the high and very high resilience classes, respectively. These classes are considered to be the safest against floods and earthquakes. In addition, the area of classes with low and very low resilience in pessimistic, neutral, and optimistic scenarios is 0.9, 0.29, and 0.45 of the total area of the study area, respectively. As a result of pessimistic, neutral, and optimistic scenarios, the largest area will be for classes with very high resilience, moderate resilience, and very low resilience, respectively.
The areas of very low resilience and population density for 22 districts of Tehran are shown in Table 3. Across all 22 districts of Tehran, the percentage of the class with very low resilience increases as optimism increases. In Tehran, districts 1, 4, 2, 22, 5, and 3 have the highest percentages of area classified as very low resilience out of 22 districts. Districts 7, 11, 12, 18, 9, and 10 have the smallest areas in the class of very low resilience. In districts 4, 5 and 2, which have a high area of very low resilience, flood and earthquake risk planning is more important. This is due to the high population density of these districts as well as the high area of very low resilience.

4. Conclusions

Currently, human settlements, particularly metropolises, face a number of serious and basic issues, including natural hazards. The identification and preparation of a map of the resilience areas of cities may be beneficial. Urban planners and managers must consider a variety of risk management cycles at various stages in the planning and management process. This will minimize the time and amount of recovery after a hazard has occurred. To identify resilience areas to floods and earthquakes, a combination of OWA and AHP was used. The decision support system developed in this study was implemented in the form of three decision scenarios (pessimistic, neutral, and optimistic). As a result, the system generates different scenarios based on levels of optimism and pessimism. In this study, it was shown that the weight of effective criteria determines the level of resilience in different regions. In determining resilience levels, demographic and infrastructure criteria have the highest and lowest weights and importance, respectively. The area of classes with low resilience decreases in the pessimistic scenario, while it increases in the optimistic scenario. Thus, planners and managers may select the appropriate scenario based on their attitude (risk-averse or risk-taking). As a practical guide to determining how a city is going to respond to natural hazards, it is beneficial to examine urban resilience and prepare location maps for its assessment. A number of the results can assist planners in developing spatial planning strategies. Additionally, authorities may use these results to devise disaster risk reduction strategies and policies. For example, they can use the approach introduced in this study to identify vulnerable areas that should be prioritized during resilience-building activities. This study has a limitation as it relies on experts’ opinions when determining the priority of the criteria. The agreement between different experts can pose an uncertainty regarding the priority of the criteria. Furthermore, one of this study’s limitations is the inability to obtain real-world data from areas affected by floods and earthquakes, which may facilitate the evaluation of study results and the improvement of resilience modeling. Using large group decision-making methods in future studies is suggested as a means of reducing the uncertainty associated with weight determination due to a limited number of expert opinions. It is also possible to use the system proposed in this study to assess the resilience of other natural hazards in a flexible manner based on stakeholder attitudes in future studies.

Author Contributions

Conceptualization, E.M., A.R.B.L., H.R. and A.E.; methodology, E.M., R.G., A.R.B.L. and E.G.; software, A.R.B.L., H.H., P.D. and A.E.; data curation, H.H. and H.R.; writing—original draft preparation, E.M., A.R.B.L., H.R., E.G. and P.D.; and writing—review and editing, E.M. and A.E. All authors have read and agreed to the published version of the manuscript.

Funding

This research received no external funding.

Institutional Review Board Statement

Not applicable.

Informed Consent Statement

Not applicable.

Data Availability Statement

The data used to support the findings of this study are available from the corresponding author upon reasonable request.

Conflicts of Interest

The authors declare no conflict of interest.

References

  1. Papathoma-Köhle, M.; Schlögl, M.; Fuchs, S. Vulnerability indicators for natural hazards: An innovative selection and weighting approach. Sci. Rep. 2019, 9, 15026. [Google Scholar] [CrossRef] [PubMed]
  2. Souissi, D.; Zouhri, L.; Hammami, S.; Msaddek, M.H.; Zghibi, A.; Dlala, M. GIS-based MCDM–AHP modeling for flood susceptibility mapping of arid areas, southeastern Tunisia. Geocarto Int. 2020, 35, 991–1017. [Google Scholar] [CrossRef]
  3. Afsari, R.; Nadizadeh Shorabeh, S.; Bakhshi Lomer, A.R.; Homaee, M.; Arsanjani, J.J. Using Artificial Neural Networks to Assess Earthquake Vulnerability in Urban Blocks of Tehran. Remote Sens. 2023, 15, 1248. [Google Scholar] [CrossRef]
  4. Boloorani, A.D.; Shorabeh, S.N.; Samany, N.N.; Mousivand, A.; Kazemi, Y.; Jaafarzadeh, N.; Zahedi, A.; Rabiei, J. Vulnerability mapping and risk analysis of sand and dust storms in Ahvaz, IRAN. Environ. Pollut. 2021, 279, 116859. [Google Scholar] [CrossRef] [PubMed]
  5. Mohamed, S.A.; El-Raey, M.E. Vulnerability assessment for flash floods using GIS spatial modeling and remotely sensed data in El-Arish City, North Sinai, Egypt. Nat. Hazards 2020, 102, 707–728. [Google Scholar] [CrossRef]
  6. Nadizadeh Shorabeh, S.; Hamzeh, S.; Zanganeh Shahraki, S.; Firozjaei, M.K.; Jokar Arsanjani, J. Modelling the intensity of surface urban heat island and predicting the emerging patterns: Landsat multi-temporal images and Tehran as case study. Int. J. Remote Sens. 2020, 41, 7400–7426. [Google Scholar] [CrossRef]
  7. Şalcıoğlu, E.; Başoğlu, M. Psychological effects of earthquakes in children: Prospects for brief behavioral treatment. World J. Pediatr. 2008, 4, 165–172. [Google Scholar] [CrossRef]
  8. Rakhshani, T.; Taravatmanesh, S.; Khorramdel, K.; Ebrahimi, M. Social support for earthquake victims in East Azerbaijan, Iran. Arch. Psychiatry Psychother. 2017, 4, 66–72. [Google Scholar]
  9. Hadidi, A.; Holzbecher, E.; Molenaar, R.E. Flood mapping in face of rapid urbanization: A case study of Wadi Majraf-Manumah, Muscat, Sultanate of Oman. Urban Water J. 2020, 17, 407–415. [Google Scholar] [CrossRef]
  10. Afsari, R.; Nadizadeh Shorabeh, S.; Kouhnavard, M.; Homaee, M.; Arsanjani, J.J. A spatial decision support approach for flood vulnerability analysis in urban areas: A case study of Tehran. ISPRS Int. J. Geo-Inf. 2022, 11, 380. [Google Scholar] [CrossRef]
  11. Knaapen, A.M.; Seiler, F.; Schilderman, P.A.; Nehls, P.; Bruch, J.; Schins, R.P.; Borm, P.J. Neutrophils cause oxidative DNA damage in alveolar epithelial cells. Free Radic. Biol. Med. 1999, 27, 234–240. [Google Scholar] [CrossRef] [PubMed]
  12. Dimelli, D. Planning resilient cities: The case of Chania. UPLanD-J. Urban Plan. Landsc. Environ. Des. 2020, 5, 65–76. [Google Scholar]
  13. Cardona, O.D. The need for rethinking the concepts of vulnerability and risk from a holistic perspective: A necessary review and criticism for effective risk management. In Mapping Vulnerability; Routledge: Abingdon, UK, 2013; pp. 37–51. [Google Scholar]
  14. Chun, H.; Chi, S.; Hwang, B.-G. A spatial disaster assessment model of social resilience based on geographically weighted regression. Sustainability 2017, 9, 2222. [Google Scholar] [CrossRef]
  15. Bruneau, M.; Chang, S.E.; Eguchi, R.T.; Lee, G.C.; O’Rourke, T.D.; Reinhorn, A.M.; Shinozuka, M.; Tierney, K.; Wallace, W.A.; Von Winterfeldt, D. A framework to quantitatively assess and enhance the seismic resilience of communities. Earthq. Spectra 2003, 19, 733–752. [Google Scholar] [CrossRef]
  16. Doorga, J.R.; Magerl, L.; Bunwaree, P.; Zhao, J.; Watkins, S.; Staub, C.G.; Rughooputh, S.D.; Cunden, T.S.; Lollchund, R.; Boojhawon, R. GIS-based multi-criteria modelling of flood risk susceptibility in Port Louis, Mauritius: Towards resilient flood management. Int. J. Disaster Risk Reduct. 2022, 67, 102683. [Google Scholar] [CrossRef]
  17. Mayouf, Z.; Nouibat, B. Spatial Modeling for Urban Resilience Assessment: Using AHP and GUS (Case Study of Bou-Saada City, Algeria). Tech. Soc. Sci. J. 2022, 36, 607. [Google Scholar] [CrossRef]
  18. Duan, C.; Zhang, J.; Chen, Y.; Lang, Q.; Zhang, Y.; Wu, C.; Zhang, Z. Comprehensive Risk Assessment of Urban Waterlogging Disaster Based on MCDA-GIS Integration: The Case Study of Changchun, China. Remote Sens. 2022, 14, 3101. [Google Scholar] [CrossRef]
  19. Giovinazzi, S.; Marchili, C.; Di Pietro, A.; Giordano, L.; Costanzo, A.; La Porta, L.; Pollino, M.; Rosato, V.; Lückerath, D.; Milde, K. Assessing earthquake impacts and monitoring resilience of historic areas: Methods for GIS tools. ISPRS Int. J. Geo-Inf. 2021, 10, 461. [Google Scholar] [CrossRef]
  20. Bosisio, A.; Moncecchi, M.; Morotti, A.; Merlo, M. Machine learning and GIS approach for electrical load assessment to increase distribution networks resilience. Energies 2021, 14, 4133. [Google Scholar] [CrossRef]
  21. Shorabeh, S.N.; Firozjaei, H.K.; Firozjaei, M.K.; Jelokhani-Niaraki, M.; Homaee, M.; Nematollahi, O. The site selection of wind energy power plant using GIS-multi-criteria evaluation from economic perspectives. Renew. Sustain. Energy Rev. 2022, 168, 112778. [Google Scholar] [CrossRef]
  22. Firozjaei, M.K.; Nematollahi, O.; Mijani, N.; Shorabeh, S.N.; Firozjaei, H.K.; Toomanian, A. An integrated GIS-based Ordered Weighted Averaging analysis for solar energy evaluation in Iran: Current conditions and future planning. Renew. Energy 2019, 136, 1130–1146. [Google Scholar] [CrossRef]
  23. Qureshi, S.; Shorabeh, S.N.; Samany, N.N.; Minaei, F.; Homaee, M.; Nickravesh, F.; Firozjaei, M.K.; Arsanjani, J.J. A new integrated approach for municipal landfill siting based on urban physical growth prediction: A case study mashhad metropolis in Iran. Remote Sens. 2021, 13, 949. [Google Scholar] [CrossRef]
  24. Mijani, N.; Alavipanah, S.K.; Hamzeh, S.; Firozjaei, M.K.; Arsanjani, J.J. Modeling thermal comfort in different condition of mind using satellite images: An Ordered Weighted Averaging approach and a case study. Ecol. Indic. 2019, 104, 1–12. [Google Scholar] [CrossRef]
  25. Jelokhani-Niaraki, M.; Malczewski, J. A group multicriteria spatial decision support system for parking site selection problem: A case study. Land Use Policy 2015, 42, 492–508. [Google Scholar] [CrossRef]
  26. Tayyab, M.; Zhang, J.; Hussain, M.; Ullah, S.; Liu, X.; Khan, S.N.; Baig, M.A.; Hassan, W.; Al-Shaibah, B. Gis-based urban flood resilience assessment using urban flood resilience model: A case study of peshawar city, khyber pakhtunkhwa, pakistan. Remote Sens. 2021, 13, 1864. [Google Scholar] [CrossRef]
  27. Kaaviya, R.; Devadas, V. Water resilience mapping of Chennai, India using analytical hierarchy process. Ecol. Process. 2021, 10, 71. [Google Scholar] [CrossRef]
  28. He, Z.; Chen, H.; Yan, H.; Yin, Y.; Qiu, Q.; Wang, T. Scenario-based comprehensive assessment for community resilience adapted to fire following an earthquake, implementing the analytic network process and preference ranking organization method for enriched evaluation II techniques. Buildings 2021, 11, 523. [Google Scholar] [CrossRef]
  29. Xu, Z. An overview of methods for determining OWA weights. Int. J. Intell. Syst. 2005, 20, 843–865. [Google Scholar] [CrossRef]
  30. Nadizadeh Shorabeh, S.; Neysani Samani, N.; Jelokhani-Niaraki, M.R.J.-N. Determination of optimum areas for the landfill with emphasis on the urban expansion trend based on the combination of the Analytical Hierarchy Process and the Ordered Weighted Averaging model. J. Nat. Environ. 2017, 70, 949–969. [Google Scholar]
  31. Shorabeh, S.N.; Firozjaei, M.K.; Nematollahi, O.; Firozjaei, H.K.; Jelokhani-Niaraki, M. A risk-based multi-criteria spatial decision analysis for solar power plant site selection in different climates: A case study in Iran. Renew. Energy 2019, 143, 958–973. [Google Scholar] [CrossRef]
  32. Clements, A.C.; Pfeiffer, D.U.; Martin, V. Application of knowledge-driven spatial modelling approaches and uncertainty management to a study of Rift Valley fever in Africa. Int. J. Health Geogr. 2006, 5, 57. [Google Scholar] [CrossRef] [PubMed]
  33. Boroushaki, S.; Malczewski, J. Implementing an extension of the analytical hierarchy process using ordered weighted averaging operators with fuzzy quantifiers in ArcGIS. Comput. Geosci. 2008, 34, 399–410. [Google Scholar] [CrossRef]
  34. Rezvani, M.; Nickravesh, F.; Astaneh, A.D.; Kazemi, N. A risk-based decision-making approach for identifying natural-based tourism potential areas. J. Outdoor Recreat. Tour. 2022, 37, 100485. [Google Scholar] [CrossRef]
  35. Ozturk, D.; Kılıç-Gul, F. GIS-based multi-criteria decision analysis for parking site selection. Kuwait J. Sci. 2020, 47, 2–15. [Google Scholar]
  36. Aliniai, K.; Yarahmadi, A.; Zarin, J.Z.; Yarahmadi, H.; Lak, S.B. Parking lot site selection: An opening gate towards sustainable GIS-based urban traffic management. J. Indian Soc. Remote Sens. 2015, 43, 801–813. [Google Scholar] [CrossRef]
  37. Chen, H.; Wood, M.D.; Linstead, C.; Maltby, E. Uncertainty analysis in a GIS-based multi-criteria analysis tool for river catchment management. Environ. Model. Softw. 2011, 26, 395–405. [Google Scholar] [CrossRef]
  38. Feizizadeh, B.; Blaschke, T. GIS-multicriteria decision analysis for landslide susceptibility mapping: Comparing three methods for the Urmia lake basin, Iran. Nat. Hazards 2013, 65, 2105–2128. [Google Scholar] [CrossRef]
  39. Mokarram, M.; Pourghasemi, H.R.; Mokarram, M.J. A multi-criteria GIS-based model for wind farm site selection with the least impact on environmental pollution using the OWA-ANP method. Environ. Sci. Pollut. Res. 2022, 29, 43891–43912. [Google Scholar] [CrossRef]
  40. Chen, Y.; Paydar, Z. Evaluation of potential irrigation expansion using a spatial fuzzy multi-criteria decision framework. Environ. Model. Softw. 2012, 38, 147–157. [Google Scholar] [CrossRef]
  41. Gorsevski, P.V.; Donevska, K.R.; Mitrovski, C.D.; Frizado, J.P. Integrating multi-criteria evaluation techniques with geographic information systems for landfill site selection: A case study using ordered weighted average. Waste Manag. 2012, 32, 287–296. [Google Scholar] [CrossRef]
  42. Bathrellos, G.D.; Skilodimou, H.D.; Chousianitis, K.; Youssef, A.M.; Pradhan, B. Suitability estimation for urban development using multi-hazard assessment map. Sci. Total Environ. 2017, 575, 119–134. [Google Scholar] [CrossRef]
  43. Kaur, H.; Gupta, S.; Parkash, S.; Thapa, R. Application of geospatial technologies for multi-hazard mapping and characterization of associated risk at local scale. Ann. GIS 2018, 24, 33–46. [Google Scholar] [CrossRef]
  44. Araya-Muñoz, D.; Metzger, M.J.; Stuart, N.; Wilson, A.M.W.; Carvajal, D. A spatial fuzzy logic approach to urban multi-hazard impact assessment in Concepción, Chile. Sci. Total Environ. 2017, 576, 508–519. [Google Scholar] [CrossRef]
  45. Rahmati, O.; Yousefi, S.; Kalantari, Z.; Uuemaa, E.; Teimurian, T.; Keesstra, S.; Pham, T.D.; Tien Bui, D. Multi-hazard exposure mapping using machine learning techniques: A case study from Iran. Remote Sens. 2019, 11, 1943. [Google Scholar] [CrossRef]
  46. Mamdoohi, A.R.; Rezaei, H.; Irannezhad, E.; Saffarzadeh, A.; Abbasi, M. Hour and Period Based Congestion Pricing, Case of Tehran Mode Choice. Q. J. Transp. Eng. 2022, 14, 2233–2247. [Google Scholar] [CrossRef]
  47. Saffarzadeh, M.; Rezaei, H.; Majidi, M.Z. A Pricing Model for Freeway Tolls Based on the Share of Mode Shift, Route Shift, Travel Time Change and Users’ Willingness to Pay (Case study: Tehran_Saveh Freeway). J. Transp. Res. 2022, 19, 359–370. [Google Scholar]
  48. Rezaei, H.; Irannezhad, E.; Mamdoohi, A.R. Heterogeneous Analysis of Mode Choice Behavior Using Latent Class Model. J. Transp. Res. 2021, 18, 61–74. [Google Scholar] [CrossRef]
  49. Boloorani, A.D.; Kazemi, Y.; Sadeghi, A.; Shorabeh, S.N.; Argany, M. Identification of dust sources using long term satellite and climatic data: A case study of Tigris and Euphrates basin. Atmos. Environ. 2020, 224, 117299. [Google Scholar] [CrossRef]
  50. Wang, Y.; Li, Z.; Tang, Z.; Zeng, G. A GIS-based spatial multi-criteria approach for flood risk assessment in the Dongting Lake Region, Hunan, Central China. Water Resour. Manag. 2011, 25, 3465–3484. [Google Scholar] [CrossRef]
  51. Saaty, T. The Analytic Hierarchy Process (AHP) for Decision Making; Kobe, Japan, 1980; p. 69. [Google Scholar]
  52. Saaty, T.L.; Vargas, L.G. Hierarchical analysis of behavior in competition: Prediction in chess. Behav. Sci. 1980, 25, 180–191. [Google Scholar] [CrossRef]
  53. Tripathi, A.K.; Agrawal, S.; Gupta, R.D. Comparison of GIS-based AHP and fuzzy AHP methods for hospital site selection: A case study for Prayagraj City, India. GeoJournal 2022, 87, 3507–3528. [Google Scholar] [CrossRef] [PubMed]
  54. Mallick, J. Municipal solid waste landfill site selection based on fuzzy-AHP and geoinformation techniques in Asir Region Saudi Arabia. Sustainability 2021, 13, 1538. [Google Scholar] [CrossRef]
  55. Saaty, T.L. An exposition of the AHP in reply to the paper “remarks on the analytic hierarchy process”. Manag. Sci. 1990, 36, 259–268. [Google Scholar] [CrossRef]
  56. Saaty, T.L.; Vargas, L.G. Inconsistency and rank preservation. J. Math. Psychol. 1984, 28, 205–214. [Google Scholar] [CrossRef]
  57. Bakhshi Lomer, A.R.; Rezaeian, M.; Rezaei, H.; Lorestani, A.; Mijani, N.; Mahdad, M.; Raeisi, A.; Arsanjani, J.J. Optimizing Emergency Shelter Selection in Earthquakes Using a Risk-Driven Large Group Decision-Making Support System. Sustainability 2023, 15, 4019. [Google Scholar] [CrossRef]
  58. Malczewski, J.; Chapman, T.; Flegel, C.; Walters, D.; Shrubsole, D.; Healy, M.A. GIS–multicriteria evaluation with ordered weighted averaging (OWA): Case study of developing watershed management strategies. Environ. Plan. A 2003, 35, 1769–1784. [Google Scholar] [CrossRef]
  59. Mokarram, M.; Hojati, M. Using ordered weight averaging (OWA) aggregation for multi-criteria soil fertility evaluation by GIS (case study: Southeast Iran). Comput. Electron. Agric. 2017, 132, 1–13. [Google Scholar] [CrossRef]
  60. Zabihi, H.; Alizadeh, M.; Kibet Langat, P.; Karami, M.; Shahabi, H.; Ahmad, A.; Nor Said, M.; Lee, S. GIS Multi-Criteria Analysis by Ordered Weighted Averaging (OWA): Toward an integrated citrus management strategy. Sustainability 2019, 11, 1009. [Google Scholar] [CrossRef]
  61. Kazemi-Beydokhti, M.; Abbaspour, R.A.; Kheradmandi, M.; Bozorgi-Amiri, A. Determination of the physical domain for air quality monitoring stations using the ANP-OWA method in GIS. Environ. Monit. Assess. 2019, 191, 299. [Google Scholar] [CrossRef]
  62. Asadi, H.; Soffianian, A.; Hemami, M.-R.; Fakheran, S.; Akbari Feizabadi, H.; Corcoran, F. A hybrid GIS-OWA and DANP method for the identification and evaluation of ecotourism attractions: The case study of Abbas Abad Wildlife Refuge, Iran. GeoJournal 2022, 87, 5179–5196. [Google Scholar] [CrossRef]
  63. Yager, R.R. On ordered weighted averaging aggregation operators in multicriteria decisionmaking. IEEE Trans. Syst. Man Cybern. 1988, 18, 183–190. [Google Scholar] [CrossRef]
  64. Malczewski, J. Integrating multicriteria analysis and geographic information systems: The ordered weighted averaging (OWA) approach. Int. J. Environ. Technol. Manag. 2006, 6, 7–19. [Google Scholar] [CrossRef]
Figure 1. Geographical location of the studied area.
Sustainability 15 08777 g001
Figure 2. Flowchart of the research method for urban resilience modeling.
Sustainability 15 08777 g002
Figure 3. (a) The weight of the effective criteria on flood resilience; (b) the weight of the effective criteria on earthquake resilience (D.F means distance from).
Sustainability 15 08777 g003aSustainability 15 08777 g003b
Figure 4. Standardized map of environmental criteria (from left to right): aspect (flood), rainfall (flood), elevation (flood and earthquake), flow accumulation (flood), impervious surfaces (flood), vegetation density (flood), D.F stream network (flood), slope (flood and earthquake), and D.F Fault (earthquake).
Sustainability 15 08777 g004
Figure 5. Standardized map of demographic criteria (from left to right): vulnerable population density (flood and earthquake), literate population density (flood and earthquake), total population density (flood and earthquake), and working population density (flood and earthquake).
Sustainability 15 08777 g005
Figure 6. Standardized map of infrastructure criteria (from left to right): D.F fire station (flood and earthquake), D.F fuel station (flood and earthquake), D.F medical centers (flood and earthquake), D.F pharmacy (flood and earthquake), D.F power transmission lines (flood and earthquake), D.F road network (flood and earthquake), D.F public transport station (flood and earthquake), skeleton type (earthquake), and material type (earthquake).
Sustainability 15 08777 g006
Figure 7. Flood resilience maps in environmental, demographic and infrastructure dimensions in pessimistic, natural, and optimistic scenarios.
Sustainability 15 08777 g007
Figure 8. Earthquake resilience maps in environmental, demographic, and infrastructure dimensions in pessimistic, natural, and optimistic scenarios.
Sustainability 15 08777 g008
Figure 9. Percentage of different classes in optimistic, natural, and pessimistic scenarios for (a) environmental resilience (flood), (b) demographic resilience (flood), (c) infrastructure resilience (flood), (d) environmental resilience (earthquake), (e) demographic resilience (earthquake), and (f) infrastructure resilience (earthquake).
Sustainability 15 08777 g009
Figure 10. The final resilience map (combined flood and earthquake).
Sustainability 15 08777 g010
Table 1. General characteristics of the data used in this study.
CriterionSub-CriterionHazard TypeFormatSource
EnvironmentalElevationFlood/EarthquakeRasterhttps://earthexplorer.usgs.gov/ (accessed on 25 December 2022)
SlopeFlood/EarthquakeRasterExtracted from the Digital Elevation Model (DEM)
AspectFloodRasterExtracted from the DEM
Stream networkFloodVectorhttps://frw.ir/ (accessed on 18 November 2022)
Flow accumulationFloodRasterExtracted from the DEM
RainfallFloodRasterhttps://wapor.apps.fao.org/ (accessed on 25 November 2022)
Vegetation densityFloodRasterhttps://earthexplorer.usgs.gov/ (accessed on 25 November 2022)
Impervious surfacesFloodRasterhttps://earthexplorer.usgs.gov/ (accessed on 25 November 2022)
FaultEarthquakeVectorhttps://gsi.ir/ (accessed on 18 November 2022)
DemographicTotal population densityFlood/EarthquakeVectorhttps://www.tehran.ir/ (accessed on 18 December 2022)
Vulnerable population densityFlood/EarthquakeVectorhttps://www.tehran.ir/ (accessed on 18 December 2022)
Working population densityFlood/EarthquakeVectorhttps://www.tehran.ir/ (accessed on 18 December 2022)
Literate population densityFlood/EarthquakeVectorhttps://www.tehran.ir/ (accessed on 18 December 2022)
InfrastructurePower transmission linesFlood/EarthquakeVectorhttps://fa.ncc.gov.ir/ (accessed on 18 November 2022)
Fuel stationFlood/EarthquakeVectorhttps://www.tehran.ir/ (accessed on 18 November 2022)
Fire stationFlood/EarthquakeVectorhttps://www.tehran.ir/ (accessed on 18 November 2022)
PharmacyFlood/EarthquakeVectorhttps://www.tehran.ir/ (accessed on 18 November 2022)
Medical centersFlood/EarthquakeVectorhttps://www.tehran.ir/ (accessed on 05 November 2022)
Road networkFlood/EarthquakeVectorhttps://fa.ncc.gov.ir/ (accessed on 05 November 2022)
Material typeEarthquakeVectorhttps://www.tehran.ir/ (accessed on 05 November 2022)
Skeleton typeEarthquakeVectorhttps://www.tehran.ir/ (accessed on 05 November 2022)
Public transport stationFlood/EarthquakeVectorhttps://www.tehran.ir/ (accessed on 05 November 2022)
Table 2. The percentage of the area that belongs to different resilience classes.
ScenariosVery LowLowModerateHighVery High
Pessimistic18183142
Neutral1217242423
Optimistic382617127
Table 3. Percentage of very low resilience area in different scenarios and population density for 22 districts of Tehran.
DistrictsPopulation DensityPessimisticNeutralOptimistic
110,2702.71648.29899.235
214,9990.97521.39755.791
311,9860.01010.53147.347
415,7100.09022.50768.240
515,3371.53119.75352.506
612,6430.0060.0183.310
720,3740.0000.0000.000
835,8060.0000.0000.137
997570.0000.0000.004
1041,9210.0000.0000.032
1125,9870.0000.0000.000
1214,9540.0000.0000.001
1318,7120.0000.0075.333
1428,9120.0000.0000.112
1523,3720.0180.82851.840
1615,4660.0160.16114.883
1739,5680.0000.0170.148
1811,9010.0010.0010.001
1913,3660.0000.1057.477
2018,9900.0090.78446.601
2138870.0000.68816.370
2236100.18920.26368.891
Disclaimer/Publisher’s Note: The statements, opinions and data contained in all publications are solely those of the individual author(s) and contributor(s) and not of MDPI and/or the editor(s). MDPI and/or the editor(s) disclaim responsibility for any injury to people or property resulting from any ideas, methods, instructions or products referred to in the content.

