

Evaluation of Spatial-Temporal Variation of Soil Loss and Best Conservation Measures in an East Africa Catchment
1
Water Resource Development and Management, IITR, Roorkee 247667, India
2
Water Resource, River Development, and Ganga Rejuvenation, NIH, Roorkee 247667, India
*
Author to whom correspondence should be addressed.
Sustainability 2023, 15(10), 7778; https://doi.org/10.3390/su15107778
Submission received: 23 March 2023
/
Revised: 28 April 2023
/
Accepted: 4 May 2023
/
Published: 9 May 2023
(This article belongs to the Special Issue Sustainable Development of Water Resources and Environmental Systems in Changing Climate Scenarios)
Abstract
:Soil conservation (SC) is essential to maintain the reservoir service life and increase the yield since soil erosion is a major global concern that adversely affects not only the storage capacity but also the land fertility. This study evaluates the spatio-temporal variation of soil erosion using the popular SWAT model and identifies the best SC practice for Tekeze watershed located in the Northern part of Ethiopia. To accomplish this, four soil conservation management scenarios involving baseline, terracing, contouring, and grassed waterway scenarios are selected for soil loss evaluation. The SWAT model was calibrated and validated with R2 values of 0.7 and 0.9 and NSE values of 0.8 and 0.7, respectively, indicating satisfactory model performance. Five sub-basins of the catchment were found to be more susceptible to erosion with an average annual soil loss of 25.15 tons/ha/yr. Employment of the proposed SC measures in the sub-watershed erosion was reduced by 35.18%, 27.11%, and 18.76%, respectively, which is significant when compared with the baseline scenario. Since the investment cost of execution of an SC measure in a large watershed is very high, priority areas are also identified for cost savings as well as improved work efficiency.
1. Introduction
Soil erosion is a severe problem globally [1,2] since it reduces soil productivity, reservoir capacity, and water quality [3,4]. Erosion mostly affects the top part of the soil, which carries high levels of organic matter and nutrients [5,6]. Consequentially, when the top layer of the soil erodes, productivity declines, which has significant economic ramifications for the country’s economic growth. According to previous studies, more than two-thirds of the degradation of agricultural land in sub-Saharan Africa is caused by soil erosion resulting from land use changes and agricultural land expansion [7,8]. In addition, in Ethiopia, 80% of the population is dependent on agriculture [9], while land management techniques are still relatively poor in most watersheds. For instance, soil erosion is a major issue in the Tekeze watershed located in northern Ethiopia due to its topographic complexity, insufficient land cover, inappropriate land uses, poor land management techniques, and high rainfall variability [10,11]. The bulk of the area in this watershed is covered with clay loam soil [12] and is often found in strip grazing regions with poor vegetation cover exposing the regions to gully erosion [13].
Effective land use and adoption of best management practices are essential for erosion mitigation [14,15]. Conducting a thorough assessment of the watershed is the first step in selecting the best management approach [16]. However, adaptation of conventional methods for investigation of soil erosion at large catchment levels is tedious and time-consuming and therefore demands alternative cost-effective techniques. Currently, the SWAT model is widely used for identifying erosion-prone areas in the watershed and evaluating best management practices.
SWAT [17] is a hydrological model developed by the United States Agriculture Department in 1998. The literature finds the model to be very effective in estimating the rate of erosion under a wide range of soil conditions, land uses, and conservation regimes [18]. Before performing a hydrological simulation, it is necessary to carry out an uncertainty analysis because there exists a lot of uncertainty arising from a variety of sources [19,20]. The proportion of observed data and level of uncertainty is indicated by 95 PPU (95% prediction uncertainty) [21].
Effective natural resource management is vital for boosting productivity of agricultural land and prevention of soil erosion [22]. Nowadays, there are many management options available [23], but in order to make the best selections, it is necessary to evaluate each option’s operational success. The SWAT model can help evaluate various SC practices, such as terraces, filter strips, contouring, and grassed waterways [23].
A literature survey revealed that the issue of soil erosion in the Tekeze watershed, Ethiopia, East African region, had never been addressed before, which invoked the need for such a study. Therefore, this study investigated the spatial and temporal variation of erosion and identified the best SC practices for erosion-prone regions. To economize and enhance the field applicability, priority areas were also identified for the implementation of SC measures.
2. Data and Method
2.1. Location of the Study Area
Tekeze watershed (area = 56,898 km2 approximately) lies between two regional states of Ethiopia [24], Amhara and Tigray, between longitudes of 36°47′18.27″ E and 39°52′13.22″ E and latitudes of 12°15′21.32″ N and 14°47′41.16″ N (Figure 1). The elevation of catchment varies from 695 to 4523.77 m. The Nile River receives 13% of the annual total flow during dry periods and 22% during the flood season from Tekeze River [11,25].
The basin experiences comparatively long dry seasons and a highly variable rainy season in the months of July to September [25]. The basin’s minimum and maximum temperatures are approximately 12.5 °C and 24.8 °C, respectively, and average annual rainfall varies from 600 mm to 1200 mm [26].
This watershed is characterized by deforestation and overgrazing practices in some steeper areas [27], and the major topography is sloping terrain with a slope range of 8–15% that covers approximately 39.02% of the total area [28]. The steep terrain is mostly located in the catchment’s middle and upper reaches, which are often exploited as grazing grounds [29]. This type of topographical feature accounts for 24.40% of the total area. The moderately steep topographies present in the middle and lower ends of the watershed account for 17.35% of the total area. The terrain covers about 15.95% of the total area and is located in the watershed’s middle and lower reaches.
2.2. Methodology
The SWAT model [17] was employed in this study to evaluate soil erosion and soil conservation measures. The model is interfaced with ArcGIS [17], which was used to delineate the watershed and extract river streams. The model was then used to simulate stream flow in the watershed, which is essential for understanding the movement of water and sediment within the system [30]. The model requires several input data [31], including land use/land cover, soil, elevation, slope, and meteorological data of the watershed, to simulate the hydrological processes of the watershed.
To evaluate the effectiveness of soil conservation measures in reducing soil erosion, different scenarios were simulated using the SWAT model. For each scenario, different soil conservation practices were applied, and the results were compared to determine the most effective measures. The methodology used in this study is presented in Figure 2, which outlines the general steps involved in utilizing the SWAT model to assess soil erosion and evaluate the effectiveness of soil conservation measures in reducing it. The use of the SWAT model allows for a detailed and comprehensive evaluation of soil conservation measures in a watershed, which can aid in the development of effective soil conservation strategies.
2.3. Criteria for Model Evaluation
Hydrological models have been applied to assist in the planning of soil and water conservation practices [32]. The models are capable of simulating hydrological processes as well as tracking sediment and flow transport in the drainage network. The SWAT model was developed by the U.S. Agricultural department of (USAD) in 1993 [33]. The model currently is popularly used in the United States and worldwide due to its efficacy in assessment of water quality and sediment yield in the watershed [34]. However, there exists some uncertainty with the model application [35]. This uncertainty mostly comes from the measured data, model structure, or input data. As a result, it is necessary to perform an uncertainty analysis before a hydrological simulation for a watershed. The SWAT model calibration, sensitivity analysis, and prediction of uncertainty are conducted with algorithms such as SUFI-2, ParaSol, GLUE, and PSO, which are integrated with SWAT-CUP 2012 [36]. Several statistical criteria such as NSE, R2, PBIAS, and RMSE are broadly used for proper model calibration and validation [37]. These statistical criteria reflect the connection between observed and simulated results. R2 varied from 0 to 1; a value close to 0 implies no relationship between the observed and simulated results, whereas a value close to 1 shows a perfect relationship between them. Mathematically, these are expressed as:
where Mo and Ms are observed and simulated data and and are the mean of observed and simulated values, respectively, and n indicates the number of data points.
2.4. Universal Soil Loss Equation (USLE)
The quantity of soil erosion that happens in upland areas as a result of sheet and rill erosion is predicted using the mathematical formula Universal Soil Loss Equation (USLE) [38,39]. This formula takes into account several factors that contribute to soil loss, such as the slope of the land, the type of soil, the amount of vegetation cover, and the intensity and duration of rainfall. The USLE formula is expressed as:
where:
A = R K LS C P
A = the potential soil loss in tons per acre per year;
R = the rainfall erosivity factor, which takes into account the amount and intensity of rainfall;
K = the soil erodibility factor, which measures the susceptibility of the soil to erosion based on its texture, structure, and organic content;
LS = the slope length and steepness factor, which reflects the effect of the slope on the amount of soil loss;
C = the cover and management factor, which considers the amount and type of vegetation cover and the farming practices used on the land;
P = the support practice factor, which represents the effectiveness of conservation practices in reducing soil loss.
2.5. Required Data for Simulation of the Model
SWAT models [40], as explained in the introduction, are used to predict or analyze a hydrological system or process, such as river flow or sediment transport. To accomplish this, the model employs several inputs from various sources [31], which are described in the following statement:
Meteorological data: This refers to weather-related data, specifically maximum and minimum temperatures and precipitation [41]. These variables can influence the amount of water flowing through a system (e.g., through snowmelt or rain) and thus are important for modeling hydrological processes.
Spatial data: This refers to information about the physical characteristics of the landscape surrounding the hydrological system [42], which can also affect how water moves through it. The specific types of spatial data used in the model include digital elevation model (DEM) data Figure 3, which describes the elevation of the land surface, as well as soil and land use data. Soil data can help to predict how water will be absorbed or drained by the ground [43], while land use data can indicate how much water is being diverted for human uses such as agriculture or urbanization.
Hydrological data: Finally, the model also uses data directly related to the hydrological system being studied, including discharge (the amount of water flowing through the system) and sediment data (the amount and type of sediment being carried by the water). These variables can be used to calibrate the model [44], as well as to test its accuracy by comparing predicted values to observed ones. These data were collected from various sources, and the detailed information about the data and sources is presented in Table 1.
This table provides a summary of the different types of data used in the model, along with the specific variables measured and the sources of the data. For example, the meteorological data includes information about maximum and minimum temperatures, as well as precipitation, which were obtained from the Ethiopian National Meteorology Service Agency. The spatial data includes a digital elevation model (DEM) from the earth explorer.usgs.gov, as well as soil, discharge, sediment and land use data from the Ethiopia Ministry of Water, Irrigation, and Electricity.
2.6. Soil and Land Use
2.6.1. Soil
According to [51], vertic cambisols, cambisols, and leptosols are the three main soil groups in this watershed, while the predominant soil textures are clay, sandy loam, clay loam, and loam (Figure 4). Clay-loam (Table 2) texture covers the majority of the watershed, which is 71.3% of the total area. In addition, other soil types such as sandy loam, clay, and loam cover 12.2%, 8.28%, and 8.14% of the watershed, respectively. The soil texture such as sandy loam and clay are typically found in strip grazing areas and area closures in the watershed. In addition, these regions in the watershed have scarce vegetation cover and are frequently exposed to gully erosion, which negatively affects the soil fertility.
2.6.2. Land Use Land Cover
The watershed has good vegetation cover, particularly in the lower and middle regions, especially near the natural drainage (Figure 5). Furthermore, the area under church control has a greater natural vegetation cover [52,53] with predominating woody acacia species and shrubs.
The ground vegetation cover in the watershed has been rapidly reducing recently. Currently, the vegetation covering the watershed is 17% closed shrub, 21.16% open shrub, 7.8% dense forest, and 16.57% annual crop [54].
3. Results and Discussion
3.1. SWAT Sensitivity Analysis
SWAT [55] uncertainty and sensitivity analysis is performed using the SUFI-2, ParaSol, GLUE, and PSO methods, which are available in the SWAT-CUP tool, and the SUFI-2 algorithm is chosen since it provides the best simulation results for this investigation. There are 27 predictor parameters in the model [56], and the sensitive parameters are chosen based on the p-value and t-stat. More sensitive parameters are recognized by their values [57], which have the biggest absolute values of the t-stat and a p-value approaching zero, as shown in Table 3. The sensitivity parameter means the parameters which have a meaningful impact on the outcome of predicted or simulated results.
3.2. Calibration and Validation of the Model
The effectiveness of the SWAT model largely depends on the careful selection of sensitive parameters [58,59] as well as on the extent of its calibration and validation. Calibration is the process of revising parameters in the model until the simulation is close to the observed or meets the needed (i.e., optimal) requirements, whereas validation is carried out on the data not used in calibration employing the calibrated model parameters [60,61]. Calibration and validation are performed in this study using SWAT-CUP 2012, which employs several algorithms [55,62] (SUFI-2, ParaSol, GLUE, and PSO) for uncertainty analysis, calibration, and validation, but this study employs the SUFI-2 algorithm because it produces a better relationship between observed and simulated outputs. A minimum of 400 simulation trials were carried out for each run. The resulting R2-value in calibration is 0.7 (Figure 6), and it is 0.9 in validation (Figure 7). Similarly, the corresponding Nash–Sutcliffe (NS) coefficients are 0.8 and 0.7 in calibration (Figure 6) and validation (Figure 7), respectively. These indicate satisfactory model calibration and validation.
3.3. Identification of Erosion-Prone Area
Nowadays, the topic of soil conservation [63] is gaining a lot of attention for reducing soil erosion as it is quite detrimental to the global economy, by lowering production and reservoir capacity [64]. There are many different management approaches that can be used to conserve soil [65]. This study uses the SWAT model to examine the erosion-prone locations and prioritize them for proper management strategies. The primary benefit of identifying erosion-prone areas is to increase the effectiveness of the management practice, as soil conservation requires significant investment and time, particularly in large watersheds. According to [66], erosion rates are classified into five classes useful in the identification of areas most prone to erosion. For more in-depth research, the Tekeze watershed is subdivided into 34 sub-basins, of which 5 have very serious erosion problems and 2 have medium concerns. Figure 8 shows the degree of erosion in each sub-basin.
3.4. Best Management Practices
In the SWAT model, there are many management practices that can be used to reduce erosion [67], such as grassed waterways, terracing, filter strips, contour farming, and stone/soil bunds. However, the selection and employment of these practices must be based on specific criteria that take into account various factors such as soil, land use, geography, climate conditions, and national policy requirements [68].
Soil type is an important factor to consider when selecting erosion control practices [69]. Different types of soil have different levels of erodibility [69], which can affect the effectiveness of certain practices. For example, practices such as terracing and contour farming may be more effective on steep, sloping soils, while filter strips are more effective on flat, loamy soils.
Land use is another important factor to consider. Different land uses require different management practices to control erosion [70]. For example, practices such as grassed waterways and filter strips are more effective in agricultural areas, while stone/soil bunds are more effective in urban areas.
Geography also plays a role in selecting erosion control practices. The topography of the land can affect the effectiveness of certain practices [71]. For example, terracing may be more effective in mountainous areas with steep slopes, while filter strips may be more effective in low-lying areas with gentle slopes.
Climate conditions are another important factor to consider [72]. Different climates can affect the effectiveness of erosion control practices. For example, practices such as grassed waterways and filter strips are more effective in areas with high rainfall, while stone/soil bunds are more effective in areas with low rainfall.
National policy requirements are also important to consider when selecting erosion control practices [69,73]. Different countries may have different policies and regulations regarding land use and erosion control. For example, some countries may require the use of certain practices such as filter strips or grassed waterways in agricultural areas.
In summary, the selection and employment of erosion control practices must be based on specific criteria that take into account various factors such as soil, land use, geography, climate conditions, and national policy requirements [69]. By considering these factors, in this study, most effective erosion control practices are identified and employed to reduce soil erosion and protect watersheds. Based on these criteria and national guidelines [74], the grassed waterways, terracing, and contour are chosen for this study. The selected four scenarios are listed as follows:
- Scenario 1. Base line scenario
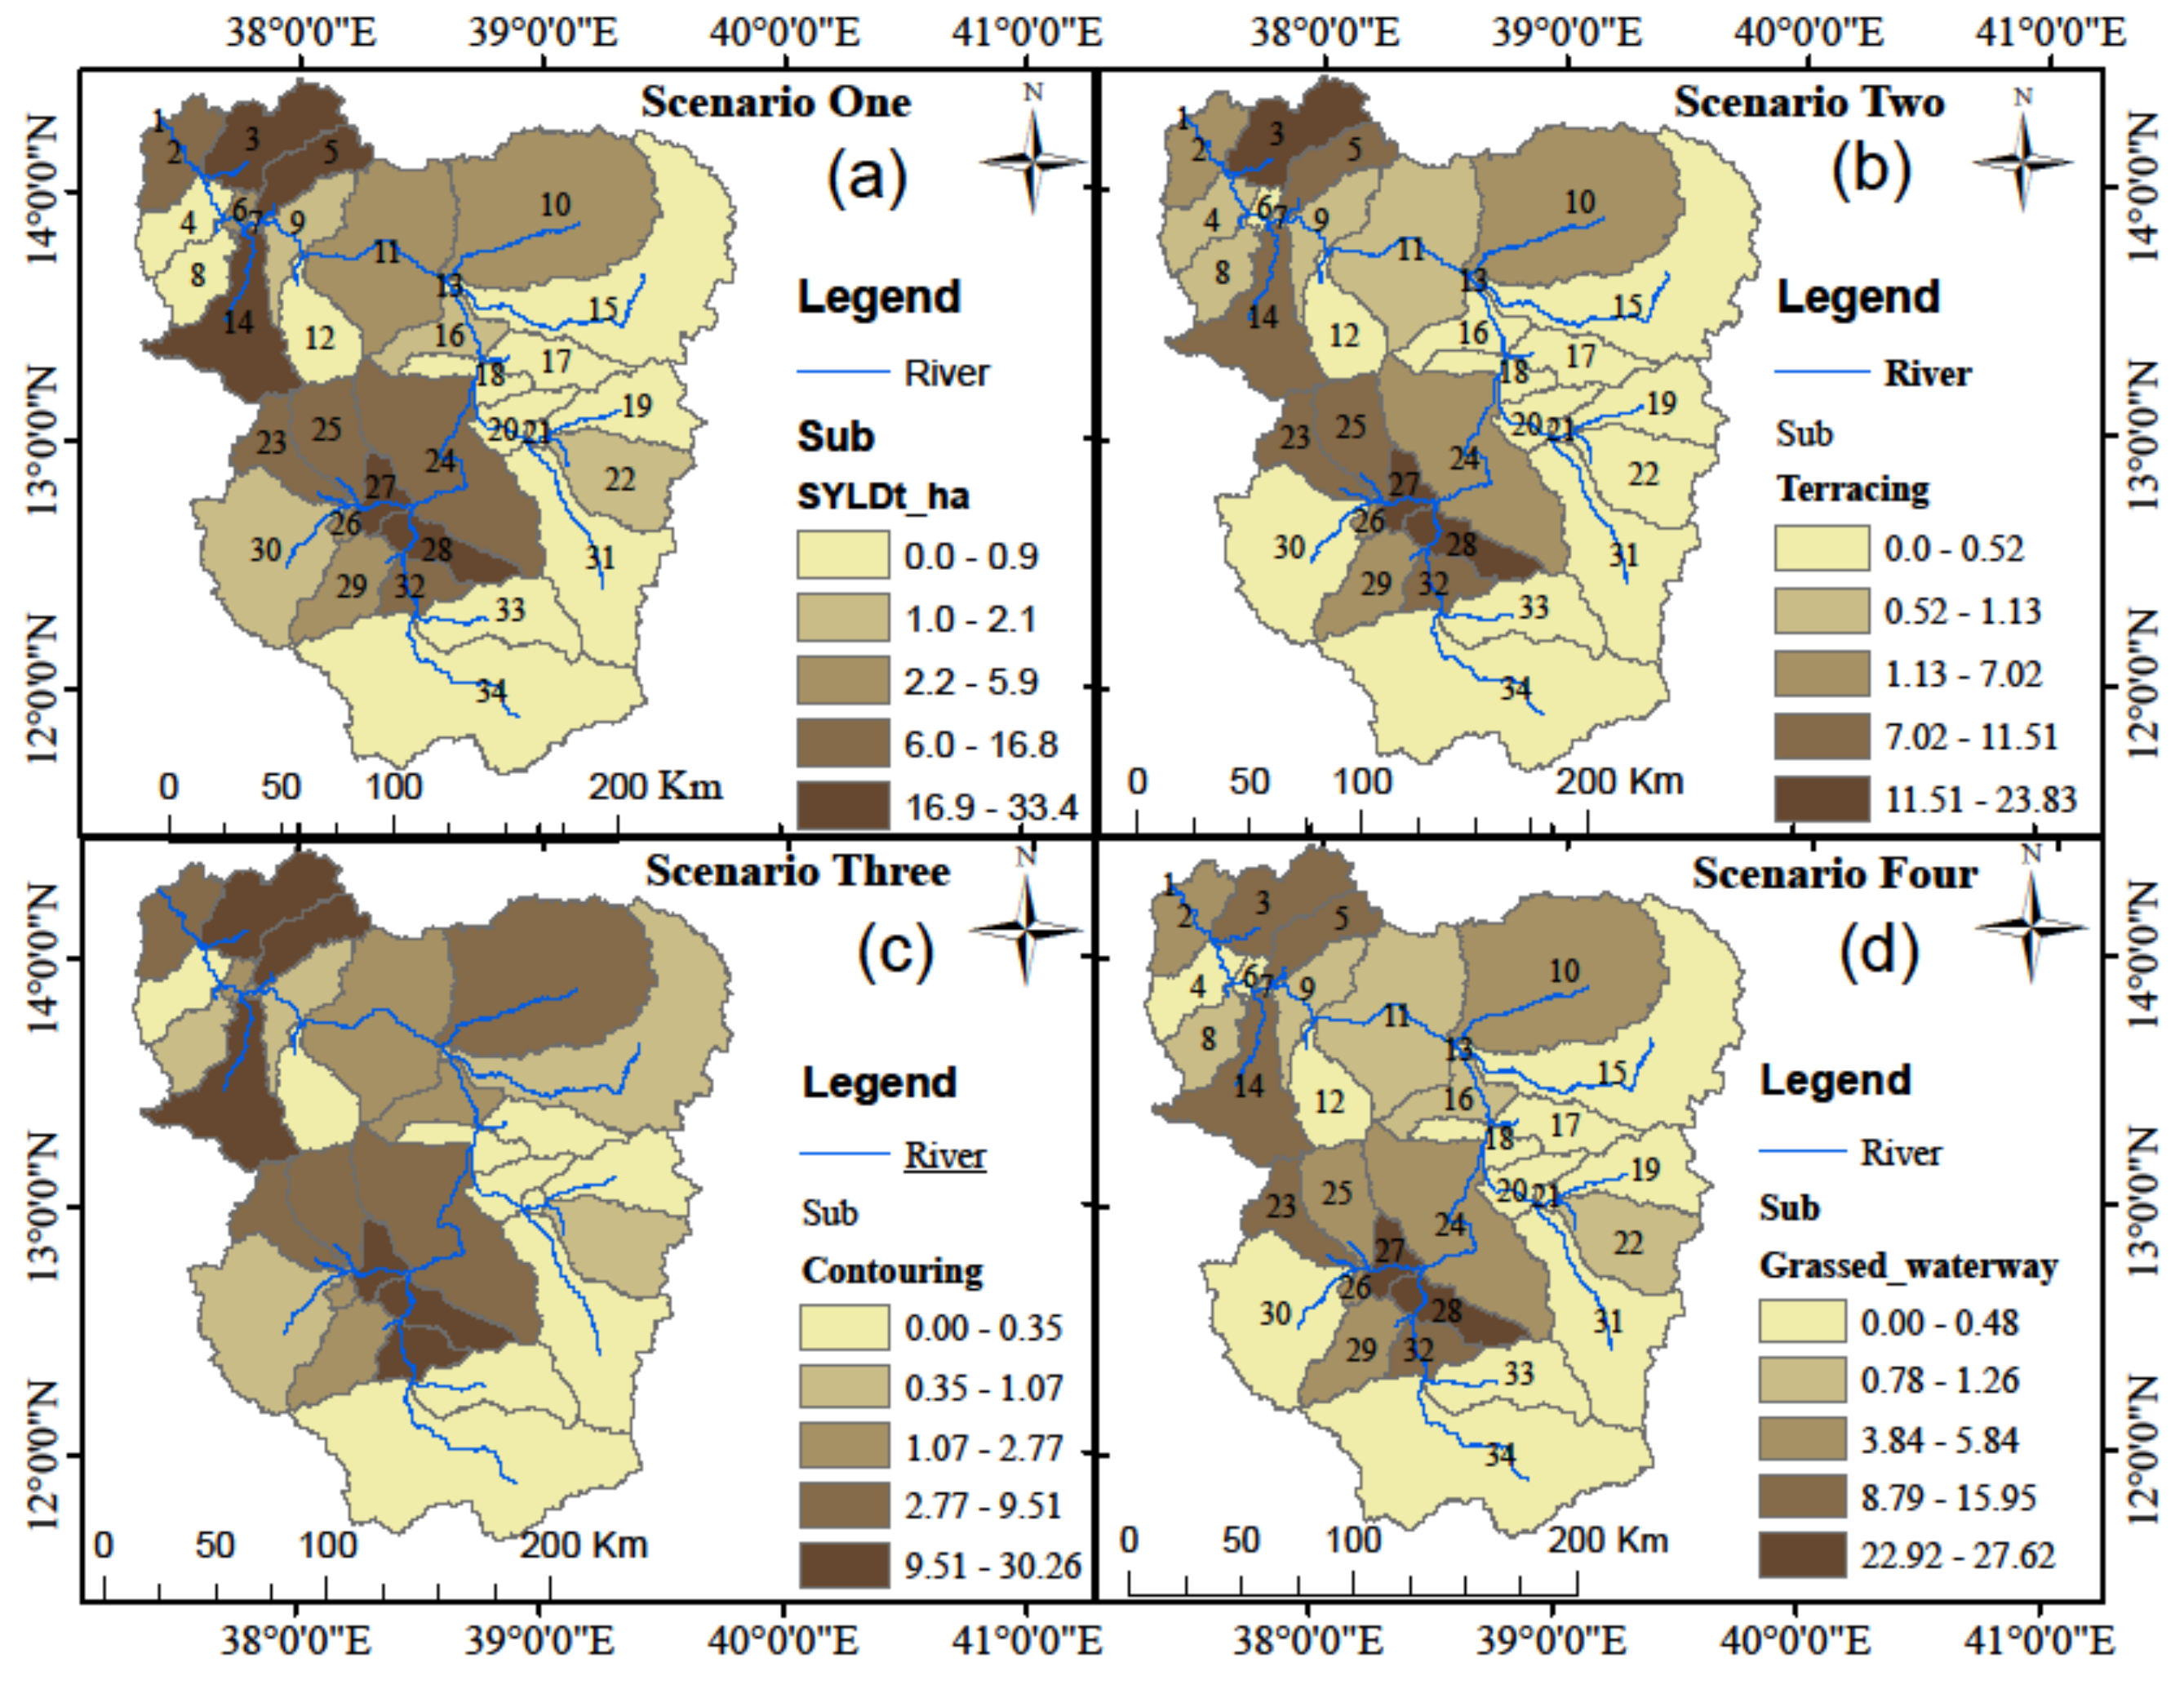
In this scenario, no management practice is used to reduce erosion and no model parameters are varied for erosion control. Instead, the amount of erosion in watersheds is determined by considering the existing conditions such as, land use, soil, and topography of the watershed. This scenario is primarily used to determine the effect of implemented management options on erosion reduction by serving as a reference point. The model simulation results show that five sub-basins (viz., 3, 5, 14, 27, and 28) have high erosion problems with erosion magnitudes ranging from 16.9 to 33.4 tonnes per hectare per year, while the other five sub basins (viz., 2, 22, 23, 24, and 25) have medium problems with erosion magnitudes ranging from 6 to 16.8 tonnes per hectare per year (Figure 9).
- Scenario 2. Terracing
Terracing is commonly used on steep agricultural fields. It is built across the contour with multiple regular spacings, and it works better when paired/coupled with contour farming and other management methods. In this model, the curve number (CN2), slope length (SLSUBBSN), and management support practice (USLE P) were utilized to evaluate the effect of this SC practice. Three model parameters were adjusted in the model run. These are SLSUBBSN reduced by 50%, CN2 reduced by three units, and USLE_P replaced by 0.16. According to the results (Figure 10), the average reduction in erosion across the watershed is 35.11%.
- Scenario 3. Contour farming
This mechanism is most successful for land with a slope of 3 to 8% and it is implemented by planting along a slope’s contour lines, which increase infiltration and minimize runoff by trapping water in small depressions leading to a reduction in sheet and rill erosion. Two model parameters, the management support practice (USLE P) and curve number (CN2), had a greater impact than others. For this analysis, USLE P was modified to 0.56 and CN2 was reduced by three units, resulting in an 18.76% reduction in average erosion (Figure 11).
- Scenario 4. Grassed waterway
This scenario is a method of covering the land surface with grass, usually on the banks of channels, in order to safely remove flow. The correcting parameters in the model for a grassed waterway are Manning’s roughness coefficient (N), CN2, and USLE_P; for this study based on the manual, USLE P was modified to 0.05, n to 0.18, and CN2 was reduced by 2. As shown in Figure 12, the mean erosion is reduced by 27.12% as a result of the utilization of this mitigation.
3.5. Comparison of Best Management Options
In the Tekeze watershed, the amount of erosion varies significantly across its sub-basins, ranging from 0.7 ton/ha/yr to 33.36 ton/ha/yr, with an annual average of 7.08 tonnes per hectare per year (Figure 13). As discussed in Section 3.4, the selection of the best conservation practices depends on several factors, including soil type, slope, and land cover. In the case of the Tekeze watershed, it is characterized by a mountainous region with an elevation that ranges from 695 m to 4524 m. Therefore, terracing is considered to be the most effective conservation method as it is suitable for the steep slopes of the area, while filter strips are more effective in low-lying areas with gentle slopes.
The selection of terracing as the preferred method is also supported by the analysis results presented in Figure 13. Terracing has shown the highest percentage of reduction in erosion (35.18%), followed by grassed waterways (27.11%), and contouring (18.76%). It is also observed that the effectiveness of each conservation method varies across different sub-basins. Sub-basins 6, 20, and 30 have shown high levels of erosion reduction when using grassed waterways; sub-basins 9, 20, and 31 have shown high levels of reduction when using contour methods; and sub-basins 6, 16, and 20 have shown high levels of reduction when using terracing methods. The details of the erosion reduction for each sub-basin can be found in Table 4 and Figure 13.
4. Conclusions and Recommendations
4.1. Conclusions
This statement discusses the importance of assessing different land management options to identify the best approach for soil and water conservation in hydrological systems. The study mentioned in the statement uses the Soil and Water Assessment Tool (SWAT) model to evaluate four different approaches based on factors such as topography, soil type, climate, and previous management practices.
The four approaches evaluated in the study are terracing, contouring, grassed waterways, and baseline scenario. The study reveals that terracing is the most effective approach for soil and water conservation in the Tekeze watershed. Terracing is a land management technique that involves building small, level platforms on steep slopes to reduce soil erosion and water runoff.
The findings of the study show that the terracing approach is capable of reducing soil erosion by 16.42% and 8.07% more than the contouring and grassed waterway approaches, respectively. This indicates that terracing is a highly effective approach for soil and water conservation in the Tekeze watershed.
Overall, the study highlights the importance of evaluating different land management approaches to identify the most effective strategy for soil and water conservation in Tekeze catchments. The use of models such as SWAT can help researchers and land managers make informed decisions about the best land management practices to adopt in their area, taking into account factors such as topography, soil type, and climate. In this case, the study’s findings suggest that terracing is the most effective approach for soil and water conservation in the Tekeze watershed.
The main challenge in developing countries is that there is a lack of funding for soil conservation despite the high demand for SC. Therefore, erosion-prone regions were identified in the study area, and areas prioritized for conservation, which can help reduce the investment costs and improve the efficiency of work.
4.2. Recommendations
Depending on the finding of the paper, we propose the following recommendations:
Implementation of the proposed soil conservation measures: The study recommends the implementation of the proposed soil conservation measures, including terracing, contouring, and grassed waterway scenarios, in the Tekeze watershed. These practices have been shown to significantly reduce soil erosion and improve soil fertility. Implementing these measures in other watersheds facing similar challenges can also help to mitigate the adverse effects of soil erosion and ensure sustainable agricultural production.
Prioritization of cost-effective conservation measures: The study identifies priority areas for cost savings and improved work efficiency in implementing soil conservation measures in large watersheds. This can help to reduce the investment costs of implementing these measures and improve their efficiency. We recommend that policymakers and practitioners prioritize these cost-effective conservation measures to ensure the effective implementation of soil conservation practices.
Integration of innovative technologies: The use of innovative technologies, such as the Soil and Water Assessment Tool (SWAT) model used in this study, can help to improve the accuracy and effectiveness of soil conservation measures. We recommend that future research explores the integration of innovative technologies in soil conservation practices to enhance their effectiveness and sustainability.
5. Innovative Contributions of the Paper
The paper presents several innovative contributions. Firstly, it evaluates the spatio-temporal variation of soil erosion in the Tekeze watershed located in Northern Ethiopia, which is critical for maintaining the reservoir service life and increasing the yield of the land. Secondly, it identifies and evaluates the best soil conservation practices for the watershed, including baseline, terracing, contouring, and grassed waterway scenarios, using the popular SWAT model. Thirdly, the paper proposes priority areas for cost savings and improved work efficiency in implementing soil conservation measures in large watersheds. Finally, the paper highlights the significant impact of these practices in reducing soil erosion and improving soil fertility, which are crucial for sustainable agriculture and environmental conservation. Overall, these innovative contributions offer important insights into soil conservation and watershed management that can help inform future research and policy decisions.
Author Contributions
Conceptualization, M.B.H.; Writing—original draft, M.B.H.; Writing—review & editing, S.K.M. and S.K.J.; Supervision, S.K.M. and S.K.J. All authors have read and agreed to the published version of the manuscript.
Funding
This research did not receive any external funding.
Institutional Review Board Statement
Not applicable.
Informed Consent Statement
Not applicable.
Data Availability Statement
Data and material will be given when a request has been made.
Conflicts of Interest
The authors declare no conflict of interest.
References
- Braimoh, A.K.; Vlek, P.L.G. Land Use and Soil Resources; Springer: Dordrecht, The Netherlands, 2008. [Google Scholar] [CrossRef]
- Lal, R. Soil degradation by erosion. Land Degrad. Dev. 2001, 12, 519–539. [Google Scholar] [CrossRef]
- Lal, R. Restoring soil quality to mitigate soil degradation. Sustainability 2015, 7, 5875–5895. [Google Scholar] [CrossRef]
- Narasimhan, B.; Srinivasan, R.; Bednarz, S.T.; Ernst, M.R.; Allen, P.M. A comprehensive modeling approach for reservoir water quality assessment and management due to point and nonpoint source pollution. Trans. ASABE 2010, 53, 1605–1617. [Google Scholar] [CrossRef]
- Liu, X.B.; Zhang, X.Y.; Wang, Y.X.; Sui, Y.Y.; Zhang, S.L.; Herbert, S.J.; Ding, G. Soil degradation: A problem threatening the sustainable development of agriculture in Northeast China. Plant Soil Environ. 2010, 56, 87–97. [Google Scholar] [CrossRef]
- Mann, L.; Tolbert, V.; Cushman, J. Potential environmental effects of corn (Zea mays L.) stover removal with emphasis on soil organic matter and erosion. Agric. Ecosyst. Environ. 2002, 89, 149–166. [Google Scholar] [CrossRef]
- Ehui, S.; Pender, J. Resource degradation, low agricultural productivity, and poverty in sub-Saharan Africa: Pathways out of the spiral. Agric. Econ. 2005, 32 (Suppl. S1), 225–242. [Google Scholar] [CrossRef]
- Pimentel, D.; Burgess, M. Soil erosion threatens food production. Agriculture 2013, 3, 443–463. [Google Scholar] [CrossRef]
- Matouš, P.; Todo, Y.; Mojo, D. Roles of extension and ethno-religious networks in acceptance of resource-conserving agriculture among Ethiopian farmers. Int. J. Agric. Sustain. 2013, 11, 301–316. [Google Scholar] [CrossRef]
- Fenta, A.A.; Yasuda, H.; Shimizu, K.; Haregeweyn, N.; Negussie, A. Dynamics of Soil Erosion as Influenced by Watershed Management Practices: A Case Study of the Agula Watershed in the Semi-Arid Highlands of Northern Ethiopia. Environ. Manag. 2016, 58, 889–905. [Google Scholar] [CrossRef]
- Haregeweyn, N.; Tesfaye, S.; Tsunekawa, A.; Tsubo, M.; Meshesha, D.T.; Adgo, E.; Elias, A. Dynamics of land use and land cover and its effects on hydrologic responses: Case study of the Gilgel Tekeze catchment in the highlands of Northern Ethiopia. Environ. Monit. Assess. 2015, 187, 1–4. [Google Scholar] [CrossRef]
- Gebremicael, T.G.; Mohamed, Y.A.; van der Zaag, P.; Hagos, E.Y. Quantifying longitudinal land use change from land degradation to rehabilitation in the headwaters of Tekeze-Atbara Basin, Ethiopia. Sci. Total Environ. 2018, 622–623, 1581–1589. [Google Scholar] [CrossRef] [PubMed]
- Nyssen, J.; Poesen, J.; Veyret-Picot, M.; Moeyersons, J.; Haile, M.; Deckers, J.; Dewit, J.; Naudts, J.; Teka, K.; Govers, G. Assessment of gully erosion rates through interviews and measurements: A case study from northern Ethiopia. Earth Surf. Process. Landf. 2006, 31, 167–185. [Google Scholar] [CrossRef]
- Jang, T.; Vellidis, G.; Hyman, J.B.; Brooks, E.; Kurkalova, L.A.; Boll, J.; Cho, J. Model for prioritizing best management practice implementation: Sediment load reduction. Environ. Manag. 2013, 51, 209–224. [Google Scholar] [CrossRef]
- Wauters, E.; Bielders, C.; Poesen, J.; Govers, G.; Mathijs, E. Adoption of soil conservation practices in Belgium: An examination of the theory of planned behaviour in the agri-environmental domain. Land Use Policy 2010, 27, 86–94. [Google Scholar] [CrossRef]
- Engel, B.; Storm, D.; White, M.; Arnold, J.; Arabi, M. A hydrologic/water quality model Applicati1 1. JAWRA J. Am. Water Resour. Assoc. 2007, 43, 1223–1236. [Google Scholar] [CrossRef]
- Neitsch, S.; Arnold, J.; Kiniry, J.; Williams, J. Soil Water Assessment Tool Theoretical Documentation Version 2009. Tex. Water Resour. Inst. 2011, 543, 591–600. [Google Scholar] [CrossRef]
- Gessesse, B.; Bewket, W.; Bräuning, A. Model-Based Characterization and Monitoring of Runoff and Soil Erosion in Response to Land Use/land Cover Changes in the Modjo Watershed, Ethiopia. Land Degrad. Dev. 2015, 26, 711–724. [Google Scholar] [CrossRef]
- Abbaspour, K.C.; Vaghefi, S.A.; Srinivasan, R. A guideline for successful calibration and uncertainty analysis for soil and water assessment: A review of papers from the 2016 international SWAT conference. Water 2017, 10, 6. [Google Scholar] [CrossRef]
- Yang, J.; Reichert, P.; Abbaspour, K.C.; Xia, J.; Yang, H. Comparing uncertainty analysis techniques for a SWAT application to the Chaohe Basin in China. J. Hydrol. 2008, 358, 1–23. [Google Scholar] [CrossRef]
- Zhou, J.; Liu, Y.; Guo, H.; He, D. Combining the SWAT model with sequential uncertainty fitting algorithm for streamflow prediction and uncertainty analysis for the Lake Dianchi Basin, China. Hydrol. Process. 2014, 28, 521–533. [Google Scholar] [CrossRef]
- Lichtenberg, E.; Shortle, J.; Wilen, J.; Zilberman, D. Natural resource economics and conservation: Contributions of agricultural economics and agricultural economists. Am. J. Agric. Econ. 2010, 92, 469–486. [Google Scholar] [CrossRef]
- Jilo, N.B.; Gurara, M.A.; Tolche, A.D.; Harka, A.E. Impacts of Management Scenarios on Sediment Yield Simulation in Upper and Middle Awash River Basin, Ethiopia. Ecohydrol. Hydrobiol. 2022, 22, 269–282. [Google Scholar] [CrossRef]
- Desalegn, G.; Tadesse, W. Resource potential of bamboo, challenges and future directions towards sustainable management and utilization in Ethiopia. For. Syst. 2014, 23, 294–299. [Google Scholar] [CrossRef]
- Welde, K.; Gebremariam, B. Effect of land use land cover dynamics on hydrological response of watershed: Case study of Tekeze Dam watershed, northern Ethiopia. Int. Soil Water Conserv. Res. 2017, 5, 1–16. [Google Scholar] [CrossRef]
- Kahsay, K.D.; Pingale, S.M.; Hatiye, S.D. Impact of climate change on groundwater recharge and base flow in the sub-catchment of Tekeze basin, Ethiopia. Groundw. Sustain. Dev. 2018, 6, 121–133. [Google Scholar] [CrossRef]
- Mekuria, W.; Veldkamp, E.; Haile, M.; Nyssen, J.; Muys, B.; Gebrehiwot, K. Effectiveness of exclosures to restore degraded soils as a result of overgrazing in Tigray, Ethiopia. J. Arid Environ. 2007, 69, 270–284. [Google Scholar] [CrossRef]
- Fenta, A.A.; Tsunekawa, A.; Haregeweyn, N.; Tsubo, M.; Yasuda, H.; Kawai, T.; Ebabu, K.; Berihun, M.L.; Belay, A.S.; Sultan, D. Agroecology-based soil erosion assessment for better conservation planning in Ethiopian river basins. Environ. Res. 2021, 195, 110786. [Google Scholar] [CrossRef]
- Sahle, M.; Saito, O.; Fürst, C.; Yeshitela, K. Quantifying and mapping of water-related ecosystem services for enhancing the security of the food-water-energy nexus in tropical data–sparse catchment. Sci. Total Environ. 2019, 646, 573–586. [Google Scholar] [CrossRef]
- Bosch, N.S. The influence of impoundments on riverine nutrient transport: An evaluation using the Soil and Water Assessment Tool. J. Hydrol. 2008, 355, 131–147. [Google Scholar] [CrossRef]
- Easton, Z.M.; Fuka, D.R.; Walter, M.T.; Cowan, D.M.; Schneiderman, E.M.; Steenhuis, T.S. Re-conceptualizing the soil and water assessment tool (SWAT) model to predict runoff from variable source areas. J. Hydrol. 2008, 348, 279–291. [Google Scholar] [CrossRef]
- Srinivasan, R.; Arnold, J.G.; Jones, C.A. Hydrologic modelling of the United States with the Soil and Water Assessment Tool. Int. J. Water Resour. Dev. 1998, 14, 315–325. [Google Scholar] [CrossRef]
- Jayakrishnan, R.; Srinivasan, R.; Santhi, C.; Arnold, J.G. Advances in the application of the SWAT model for water resources management. Hydrol. Process. 2005, 19, 749–762. [Google Scholar] [CrossRef]
- Singh, A.; Imtiyaz, M.; Isaac, R.K.; Denis, D.M. Comparison of soil and water assessment tool (SWAT) and multilayer perceptron (MLP) artificial neural network for predicting sediment yield in the Nagwa agricultural watershed in Jharkhand, India. Agric. Water Manag. 2012, 104, 113–120. [Google Scholar] [CrossRef]
- Tang, X.; Zhang, J.; Gao, C.; Ruben, G.B.; Wang, G. Assessing the uncertainties of four precipitation products for SWAT modeling in Mekong River Basin. Remote Sens. 2019, 11, 304. [Google Scholar] [CrossRef]
- Malik, M.A.; Dar, A.Q.; Jain, M.K. Modelling streamflow using the SWAT model and multi-site calibration utilizing SUFI-2 of SWAT-CUP model for high altitude catchments, NW Himalaya’s. Model. Earth Syst. Environ. 2022, 8, 1203–1213. [Google Scholar] [CrossRef]
- Halefom, A.; Sisay, E.; Khare, D.; Singh, L.; Worku, T. Hydrological modeling of urban catchment using semi-distributed model. Model. Earth Syst. Environ. 2017, 3, 683–692. [Google Scholar] [CrossRef]
- Benavidez, R.; Jackson, B.; Maxwell, D.; Norton, K. A review of the (Revised) Universal Soil Loss Equation ((R)USLE): With a view to increasing its global applicability and improving soil loss estimates. Hydrol. Earth Syst. Sci. 2018, 22, 6059–6086. [Google Scholar] [CrossRef]
- Gwapedza, D.; Nyamela, N.; Hughes, D.A.; Slaughter, A.R.; Mantel, S.K.; van der Waal, B. Prediction of sediment yield of the Inxu River catchment (South Africa) using the MUSLE. Int. Soil Water Conserv. Res. 2021, 9, 37–48. [Google Scholar] [CrossRef]
- Luo, Y.; Zhang, M. Management-oriented sensitivity analysis for pesticide transport in watershed-scale water quality modeling using SWAT. Environ. Pollut. 2009, 157, 3370–3378. [Google Scholar] [CrossRef]
- Unganai, L.S.; Kogan, F.N. Drought monitoring and corn yield estimation in southern Africa from AVHRR data. Remote Sens. Environ. 1998, 63, 219–232. [Google Scholar] [CrossRef]
- Aragaw, H.M.; Goel, M.K.; Mishra, S.K. Hydrological responses to human-induced land use/land cover changes in the Gidabo River basin, Ethiopia. Hydrol. Sci. J. 2021, 66, 640–655. [Google Scholar] [CrossRef]
- Galagedara, L.W.; Parkin, G.W.; Redman, J.D.; Von Bertoldi, P.; Endres, A.L. Field studies of the GPR ground wave method for estimating soil water content during irrigation and drainage. J. Hydrol. 2005, 301, 182–197. [Google Scholar] [CrossRef]
- Setegn, S.G.; Dargahi, B.; Srinivasan, R.; Melesse, A.M. Modeling of sediment yield from anjeni-gauged watershed, Ethiopia using swat model1. J. Am. Water Resour. Assoc. 2010, 46, 514–526. [Google Scholar] [CrossRef]
- Dile, Y.T.; Srinivasan, R. Evaluation of CFSR climate data for hydrologic prediction in data-scarce watersheds: An application in the blue nile river basin. J. Am. Water Resour. Assoc. 2014, 50, 1226–1241. [Google Scholar] [CrossRef]
- Gebrehiwot, T.; van der Veen, A.; Maathuis, B. Spatial and temporal assessment of drought in the Northern highlands of Ethiopia. Int. J. Appl. Earth Obs. Geoinf. 2011, 13, 309–321. [Google Scholar] [CrossRef]
- Endalamaw, N.T.; Moges, M.A.; Kebede, Y.S.; Alehegn, B.M.; Sinshaw, B.G. Potential soil loss estimation for conservation planning, upper Blue Nile Basin, Ethiopia. Environ. Chall. 2021, 5, 100224. [Google Scholar] [CrossRef]
- Mariye, M.; Mariyo, M.; Changming, Y.; Teffera, Z.L.; Weldegebrial, B. Effects of land use and land cover change on soil erosion potential in Berhe district: A case study of Legedadi watershed, Ethiopia. Int. J. River Basin Manag. 2022, 20, 79–91. [Google Scholar] [CrossRef]
- Kenea, U.; Adeba, D.; Regasa, M.S.; Nones, M. Hydrological responses to land use land cover changes in the fincha’a watershed, Ethiopia. Land 2021, 10, 916. [Google Scholar] [CrossRef]
- Negese, A.; Fekadu, E.; Getnet, H. Potential Soil Loss Estimation and Erosion-Prone Area Prioritization Using RUSLE, GIS, and Remote Sensing in Chereti Watershed, Northeastern Ethiopia. Air Soil Water Res. 2021, 14, 1178622120985814. [Google Scholar] [CrossRef]
- Van de Wauw, J.; Baert, G.; Moeyersons, J.; Nyssen, J.; De Geyndt, K.; Taha, N.; Zenebe, A.; Poesen, J.; Deckers, J. Soil-landscape relationships in the basalt-dominated highlands of Tigray, Ethiopia. Catena 2008, 75, 117–127. [Google Scholar] [CrossRef]
- Aredehey, G.; Mezgebu, A.; Girma, A. Land-use land-cover classification analysis of Giba catchment using hyper temporal MODIS NDVI satellite images. Int. J. Remote Sens. 2018, 39, 810–821. [Google Scholar] [CrossRef]
- Tesfaye, S.; Guyassa, E.; Joseph Raj, A.; Birhane, E.; Wondim, G.T. Land Use and Land Cover Change, and Woody Vegetation Diversity in Human Driven Landscape of Gilgel Tekeze Catchment, Northern Ethiopia. Int. J. For. Res. 2014, 2014, 614249. [Google Scholar] [CrossRef]
- Tesfaye, S.; Taye, G.; Birhane, E.; van der Zee, S.E. Observed and model simulated twenty-first century hydro-climatic change of Northern Ethiopia. J. Hydrol. Reg. Stud. 2019, 22, 100595. [Google Scholar] [CrossRef]
- Khoi, D.N.; Thom, V.T. Parameter uncertainty analysis for simulating streamflow in a river catchment of Vietnam. Glob. Ecol. Conserv. 2015, 4, 538–548. [Google Scholar] [CrossRef]
- Cho, K.H.; Pachepsky, Y.A.; Kim, J.H.; Kim, J.W.; Park, M.H. The modified SWAT model for predicting fecal coliforms in the Wachusett Reservoir Watershed, USA. Water Res. 2012, 46, 4750–4760. [Google Scholar] [CrossRef]
- Mehan, S.; Neupane, R.P.; Kumar, S. Coupling of SUFI 2 and SWAT for Improving the Simulation of Streamflow in an Agricultural Watershed of South Dakota. Hydrol. Curr. Res. 2017, 8, 3. [Google Scholar] [CrossRef]
- Ma, J.; Zhang, J.; Li, R.; Zheng, H.; Li, W. Using Bayesian optimization to automate the calibration of complex hydrological models: Framework and application. Environ. Model. Softw. 2022, 147, 105235. [Google Scholar] [CrossRef]
- Muleta, M.K.; Nicklow, J.W. Sensitivity and uncertainty analysis coupled with automatic calibration for a distributed watershed model. J. Hydrol. 2005, 306, 127–145. [Google Scholar] [CrossRef]
- Pisinaras, V.; Petalas, C.; Gikas, G.D.; Gemitzi, A.; Tsihrintzis, V.A. Hydrological and water quality modeling in a medium-sized basin using the Soil and Water Assessment Tool (SWAT). Desalination 2010, 250, 274–286. [Google Scholar] [CrossRef]
- Sharpley, A.N.; Kleinmanm, P.J.; McDowell, R.W.; Gitau, M.; Bryant, R.B. Modeling phosphorus transport in agricultural watersheds: Processes and possibilities. J. Soil Water Conserv. 2002, 57, 425–439. [Google Scholar]
- Samadi, S.; Tufford, D.L.; Carbone, G.J. Assessing Parameter Uncertainty of a Semi-Distributed Hydrology Model for a Shallow Aquifer Dominated Environmental System. J. Am. Water Resour. Assoc. 2017, 53, 1368–1389. [Google Scholar] [CrossRef]
- Dumanski, J. Evolving concepts and opportunities in soil conservation. Int. Soil Water Conserv. Res. 2015, 3, 1–14. [Google Scholar] [CrossRef]
- Ritchie, J.C.; McHenry, J.R. Application of Radioactive Fallout Cesium-137 for Measuring Soil Erosion and Sediment Accumulation Rates and Patterns: A Review. J. Environ. Qual. 1990, 19, 215–233. [Google Scholar] [CrossRef]
- Sarangi, A.; Madramootoo, C.A.; Cox, C. A decision support system for soil and water conservation measures on agricultural watersheds. Land Degrad. Dev. 2004, 15, 49–63. [Google Scholar] [CrossRef]
- Hailu, M.B.; Mishra, S.K.; Jain, S.K.; Singh, V.P. Identifying and prioritizing Sediment-prone areas at the subbasin level of Tekeze watershed, Ethiopia. Int. J. Environ. Sci. Technol. 2023, 24, 1–2. [Google Scholar] [CrossRef]
- Gashaw, T.; Dile, Y.T.; Worqlul, A.W.; Bantider, A.; Zeleke, G.; Bewket, W.; Alamirew, T. Evaluating the Effectiveness of Best Management Practices On Soil Erosion Reduction Using the SWAT Model: For the Case of Gumara Watershed, Abbay (Upper Blue Nile) Basin. Environ. Manag. 2021, 68, 240–261. [Google Scholar] [CrossRef]
- Shrimali, S.S.; Mandal, U.; Mitra, S.; Kar, G. Applying Analytic Hierarchy Process for Identifying Best Management Practices in Erosion Risk Areas of Northwestern Himalayas. Land 2022, 543, 591–600. [Google Scholar]
- Didoné, E.J.; Gomes Minella, J.P.; Allasia Piccilli, D.G. How to model the effect of mechanical erosion control practices at a catchment scale? Int. Soil Water Conserv. Res. 2021, 9, 370–380. [Google Scholar] [CrossRef]
- Ripa, M.N.; Leone, A.; Garnier, M.; Porto, A.L. Agricultural land use and best management practices to control nonpoint water pollution. Environ. Manag. 2006, 38, 253–266. [Google Scholar] [CrossRef]
- Chen, D.; Wei, W.; Chen, L. Effects of terracing practices on water erosion control in China: A meta-analysis. Earth-Sci. Rev. 2017, 173, 109–121. [Google Scholar] [CrossRef]
- Cook, T.L.; Yellen, B.C.; Woodruff, J.D.; Miller, D. Contrasting human versus climatic impacts on erosion. Geophys. Res. Lett. 2015, 42, 6680–6687. [Google Scholar] [CrossRef]
- Liu, X.; Zhang, S.; Zhang, X.; Ding, G.; Cruse, R.M. Soil erosion control practices in Northeast China: A mini-review. Soil Tillage Res. 2011, 117, 44–48. [Google Scholar] [CrossRef]
- Cooper, M. Advanced Bash-Scripting Guide An in-depth exploration of the art of shell scripting Table of Contents. Okt 2005, 2274, 2267–2274. [Google Scholar] [CrossRef]
Figure 1.
Location of the research area (a) Africa map; (b) Ethiopia map; (c) Tekeze watershed.

Figure 2.
Methodology.
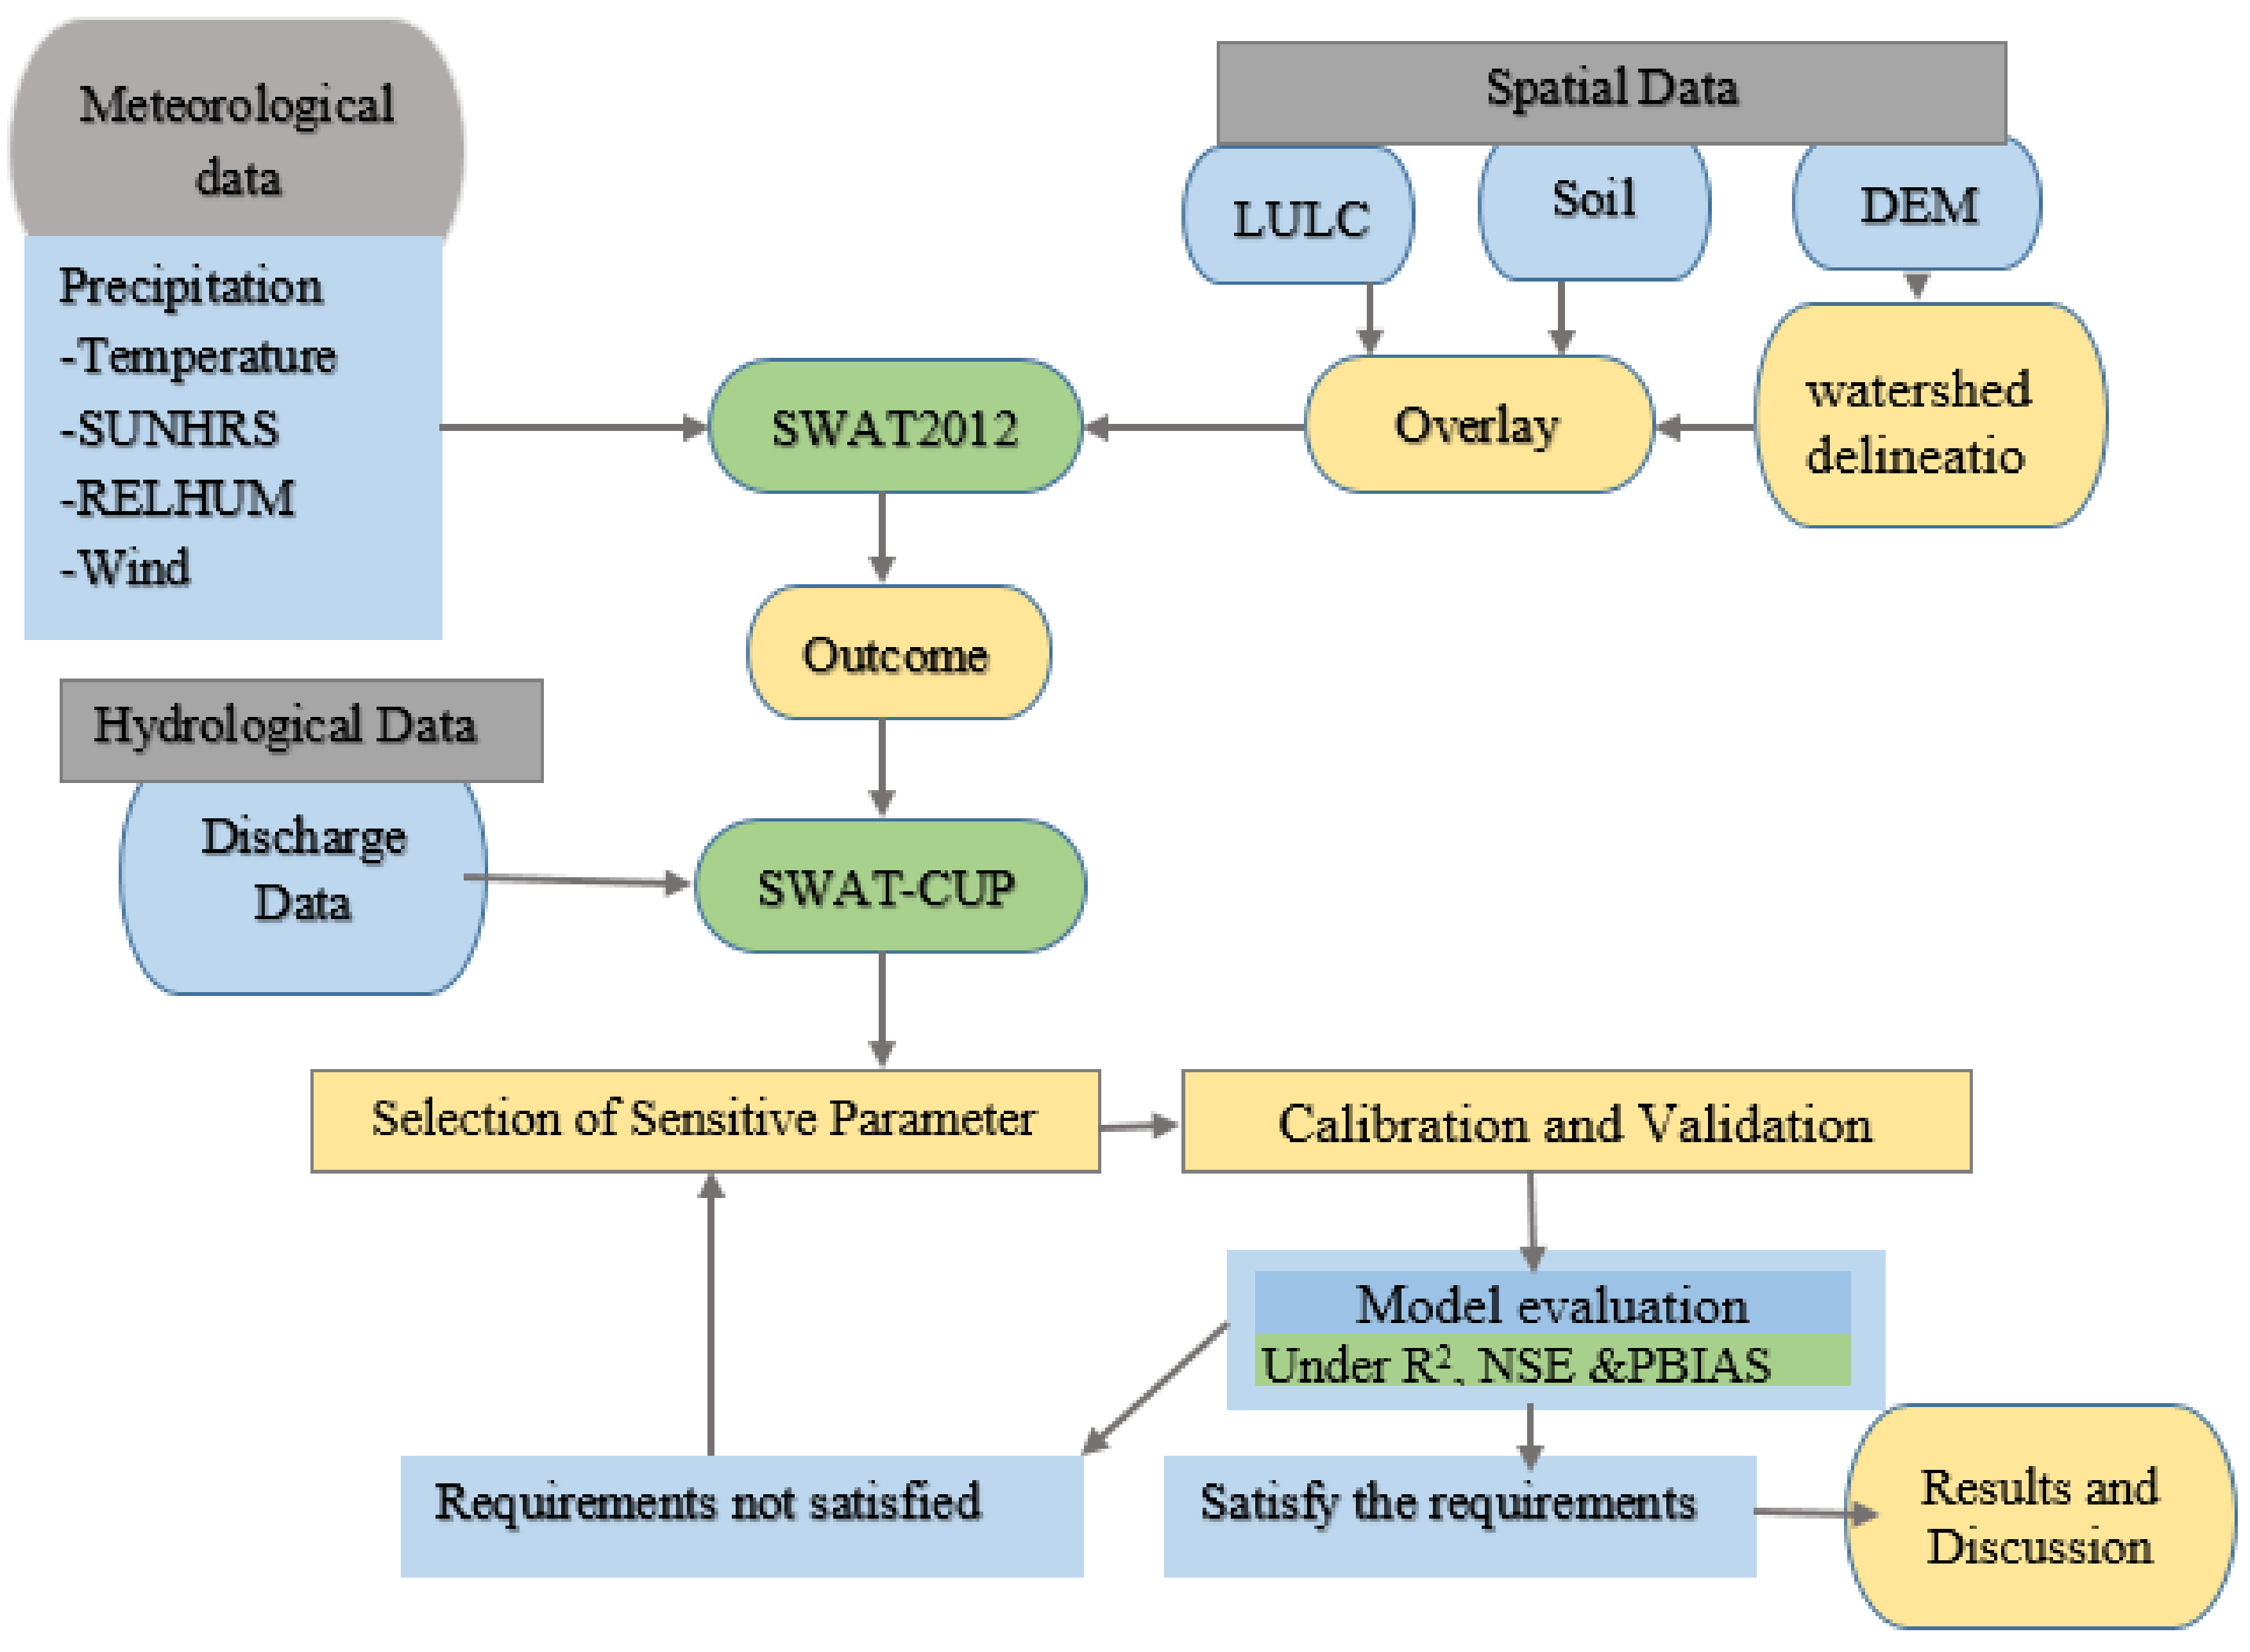
Figure 3.
DEM of Ethiopia map (A); DEM of Tekeze watershed (B).
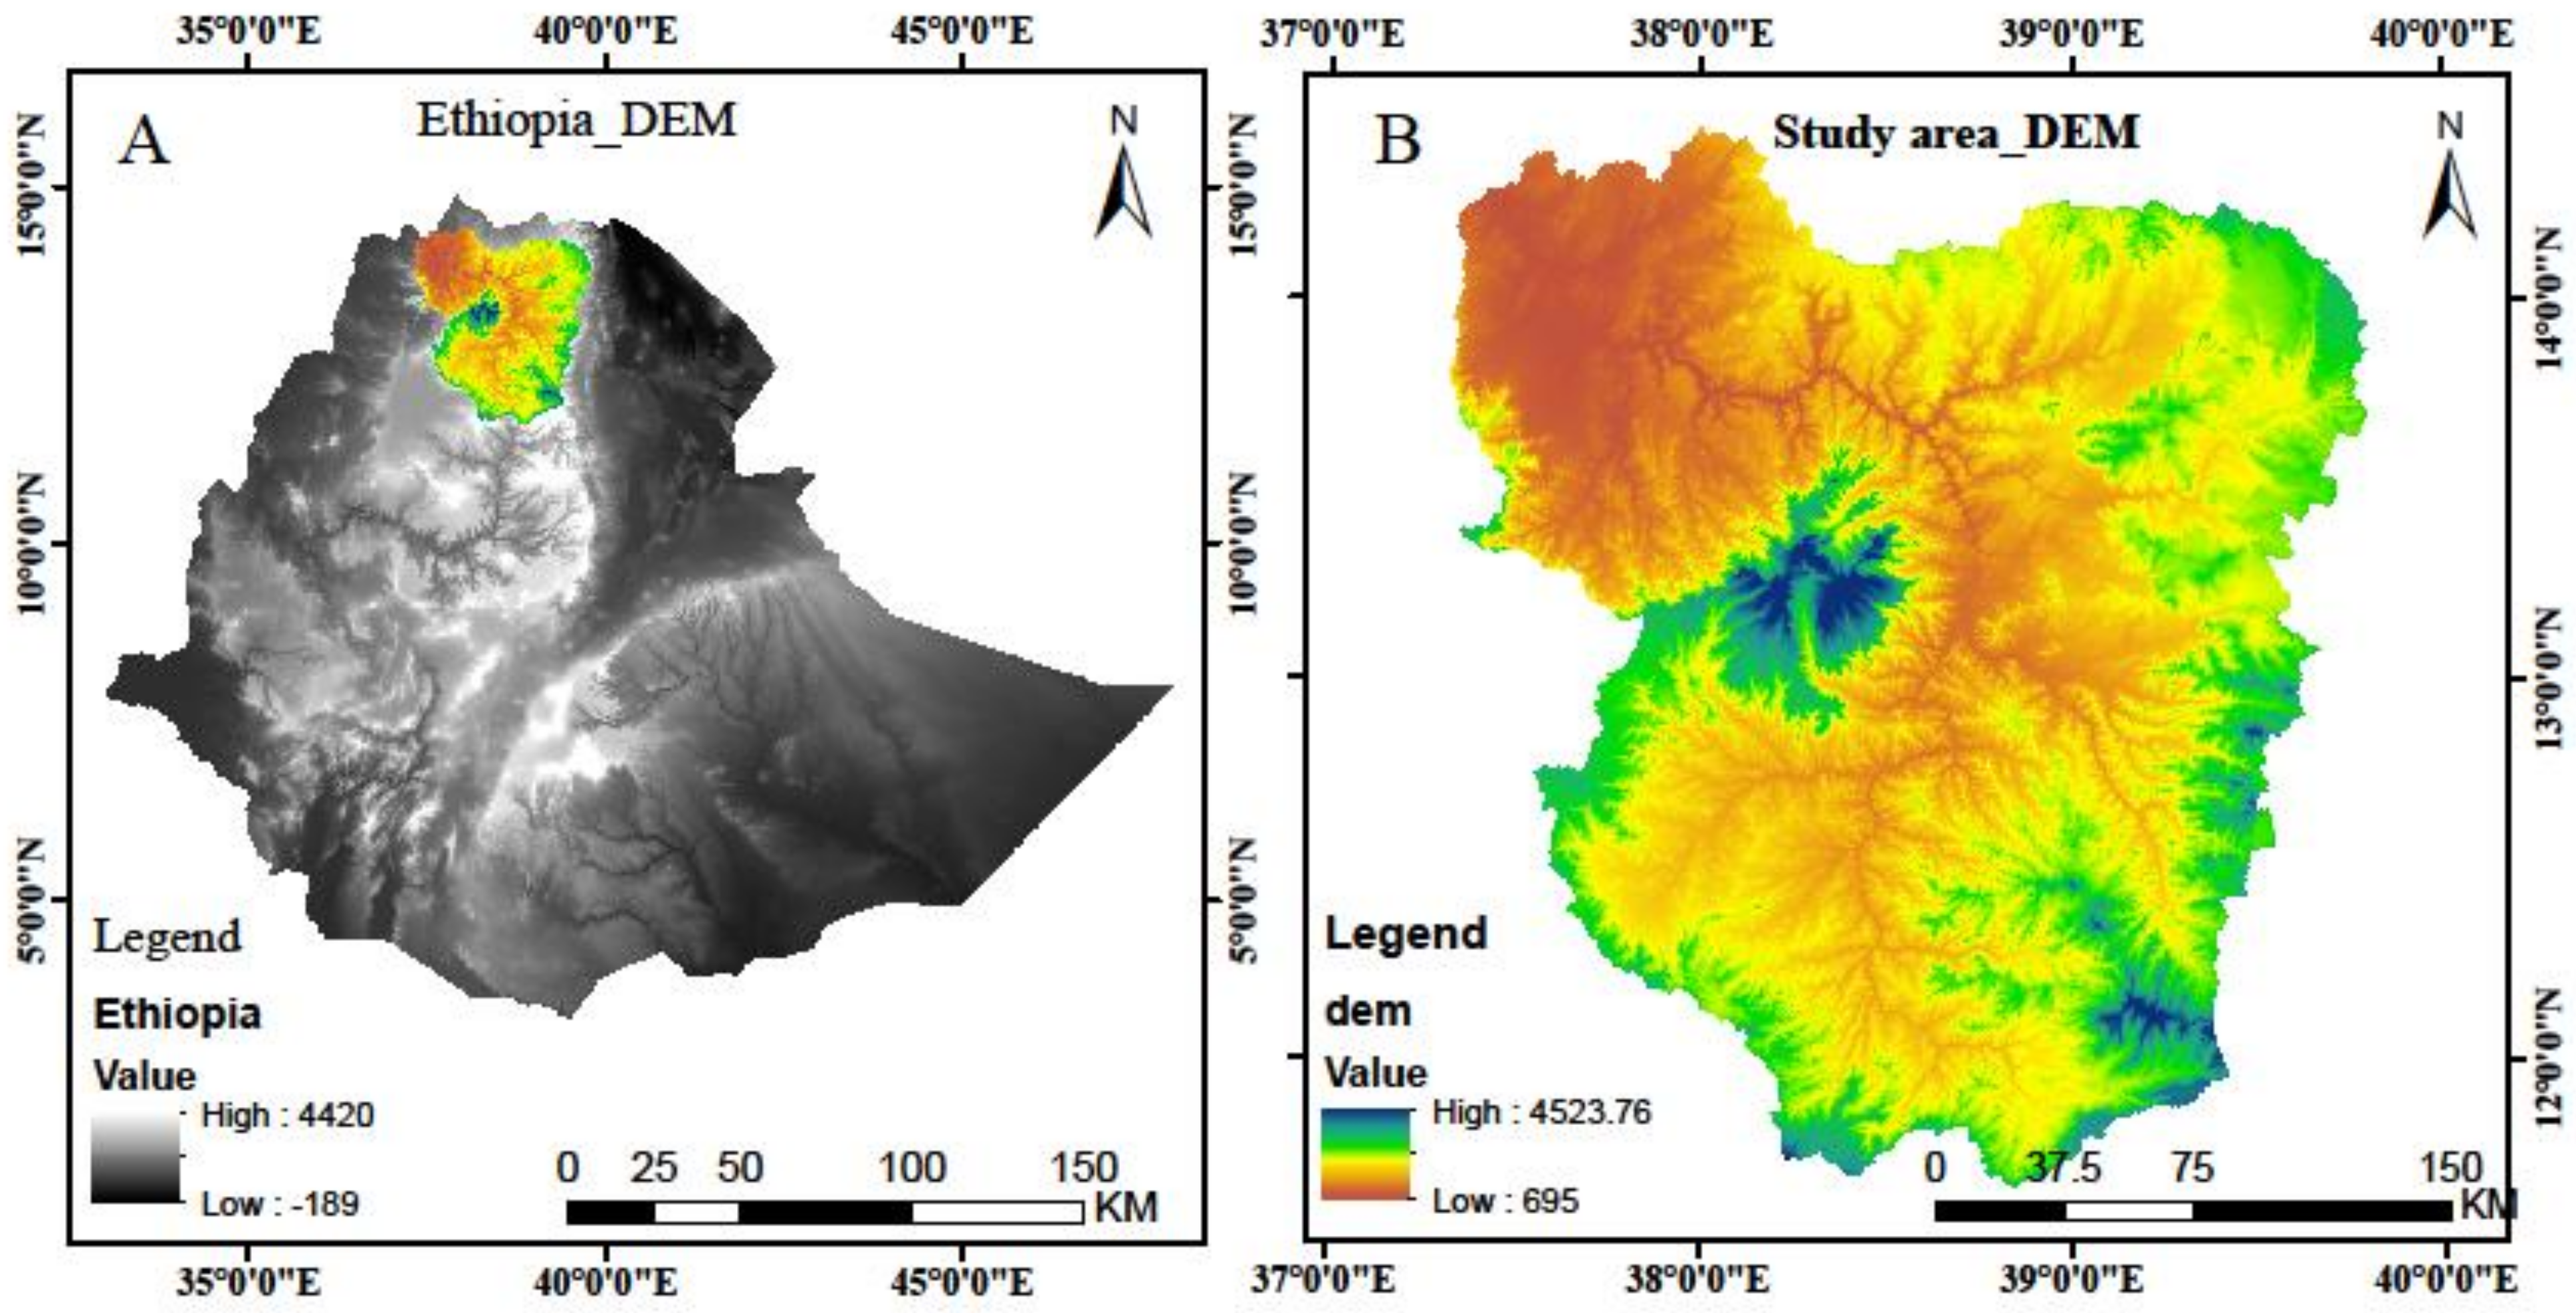
Figure 4.
Soil classifications code.
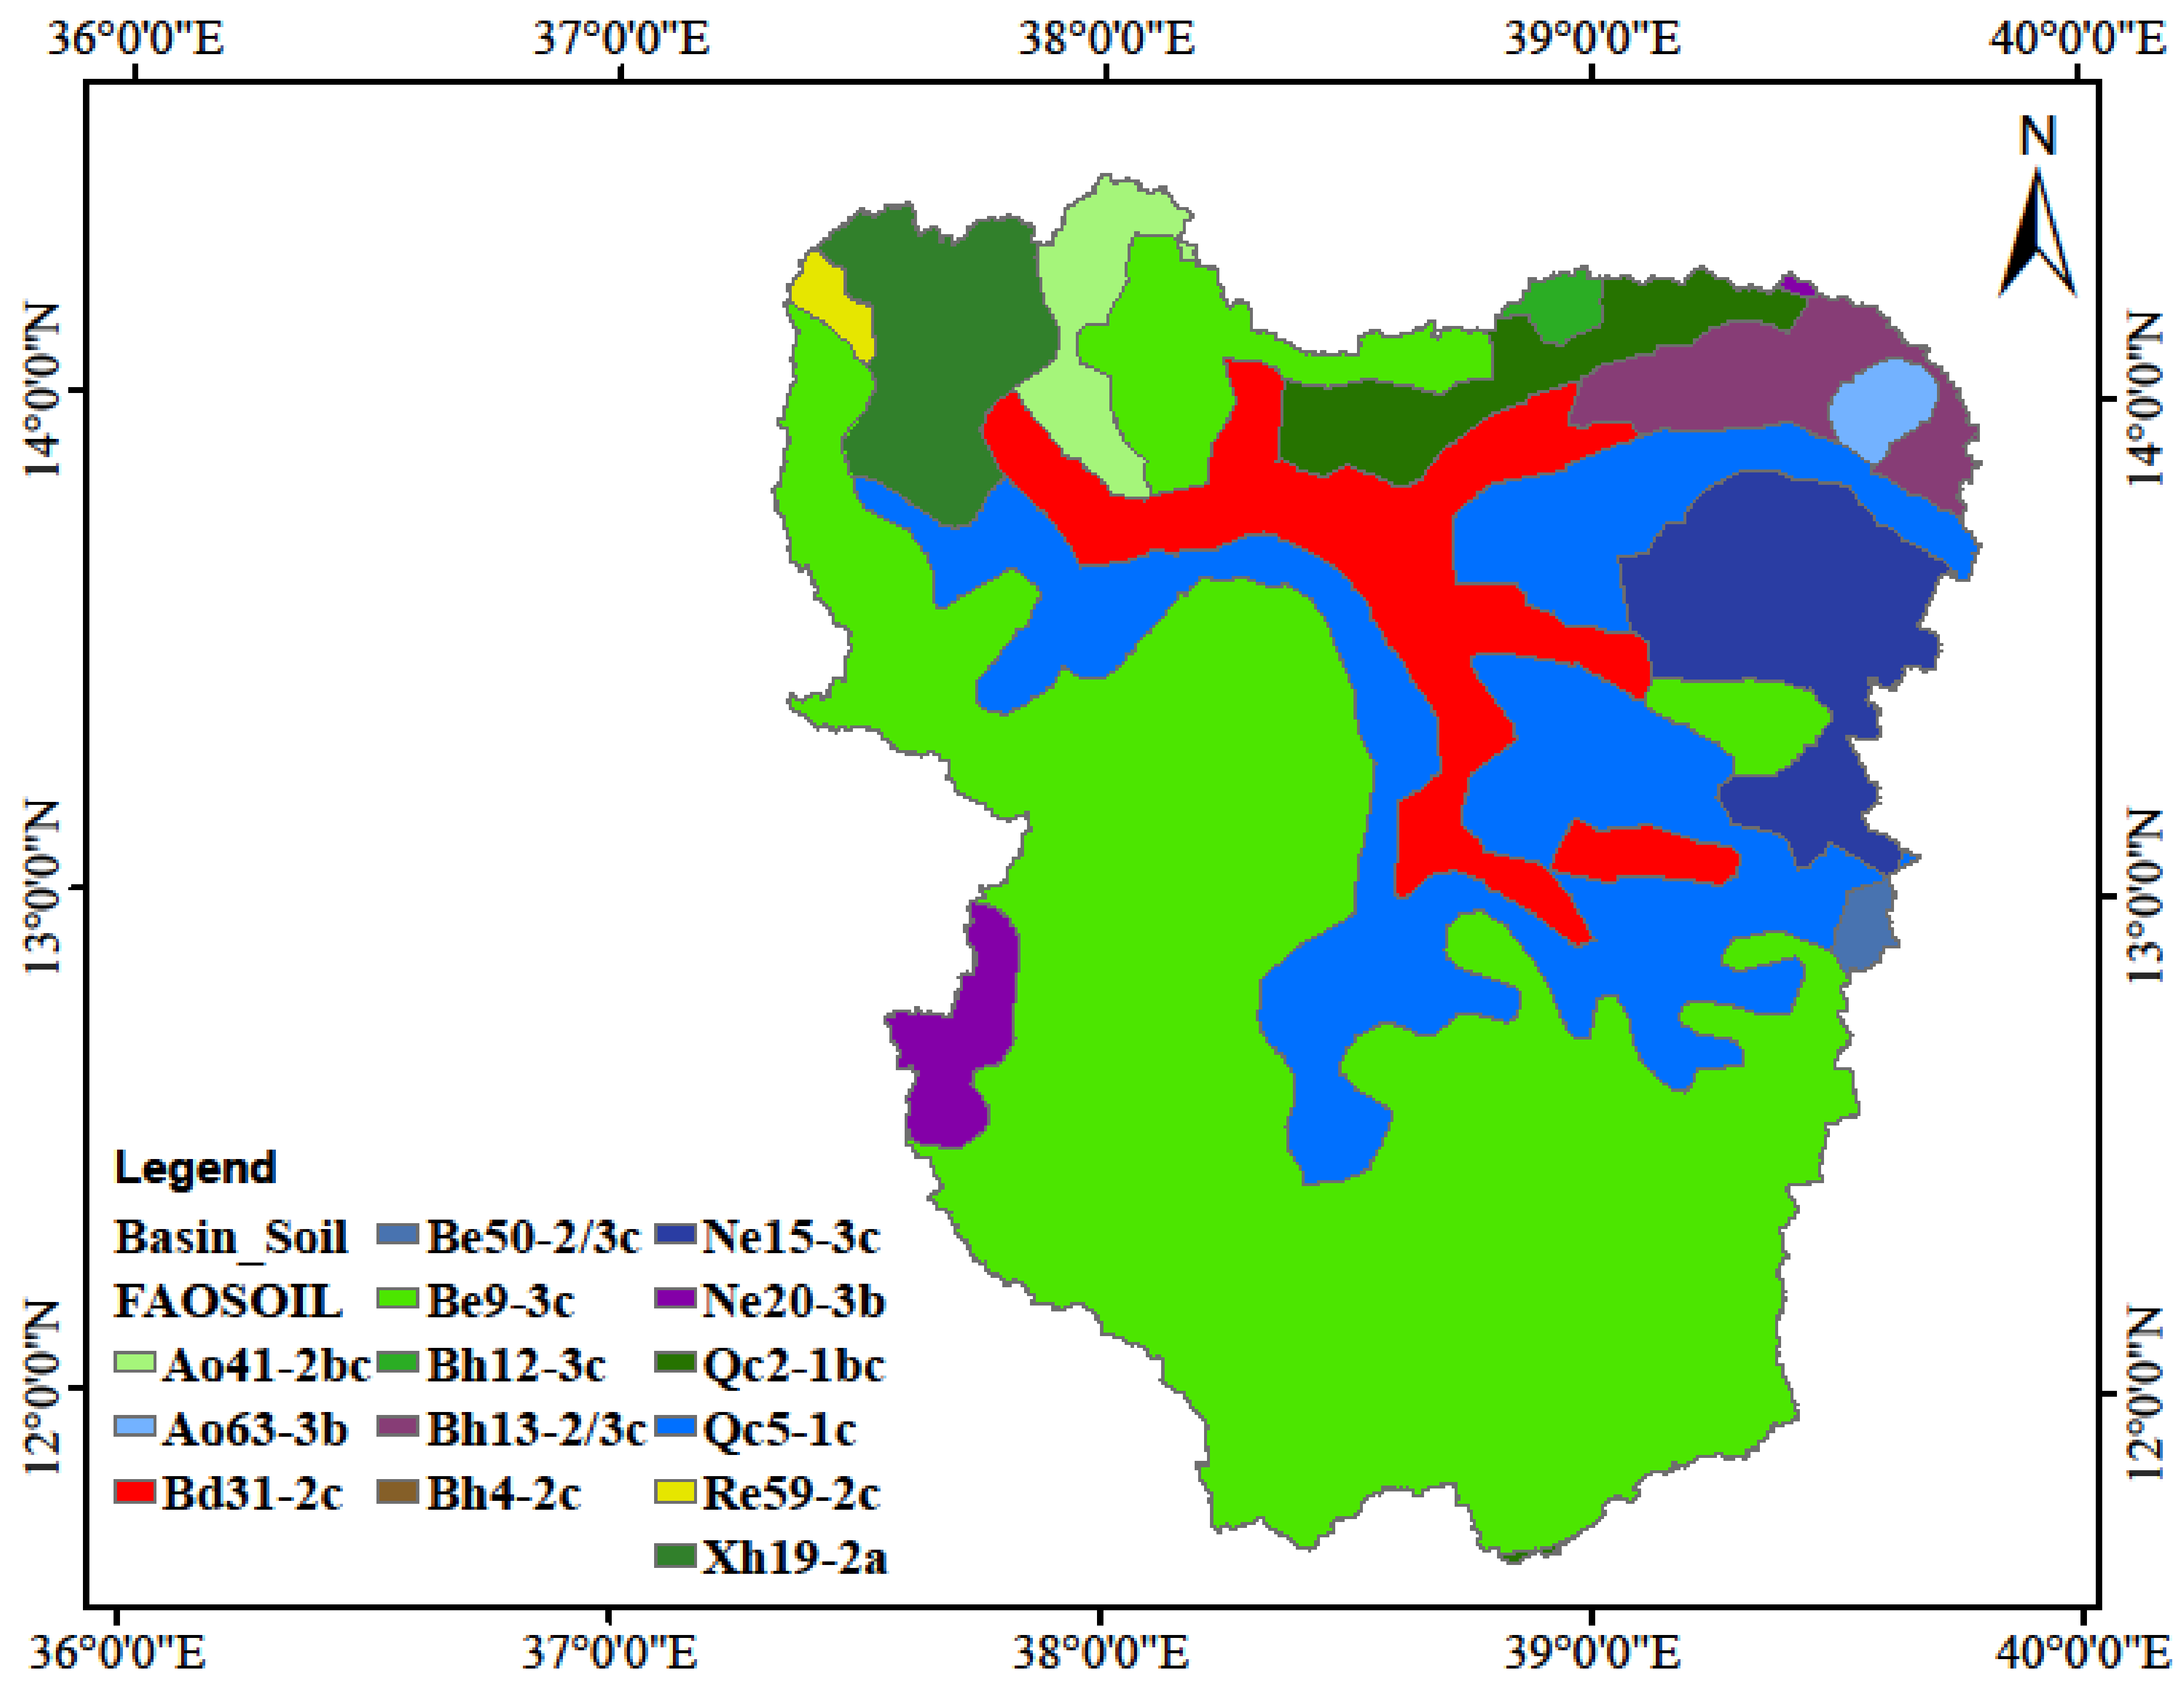
Figure 5.
Land use land cover of the watershed.
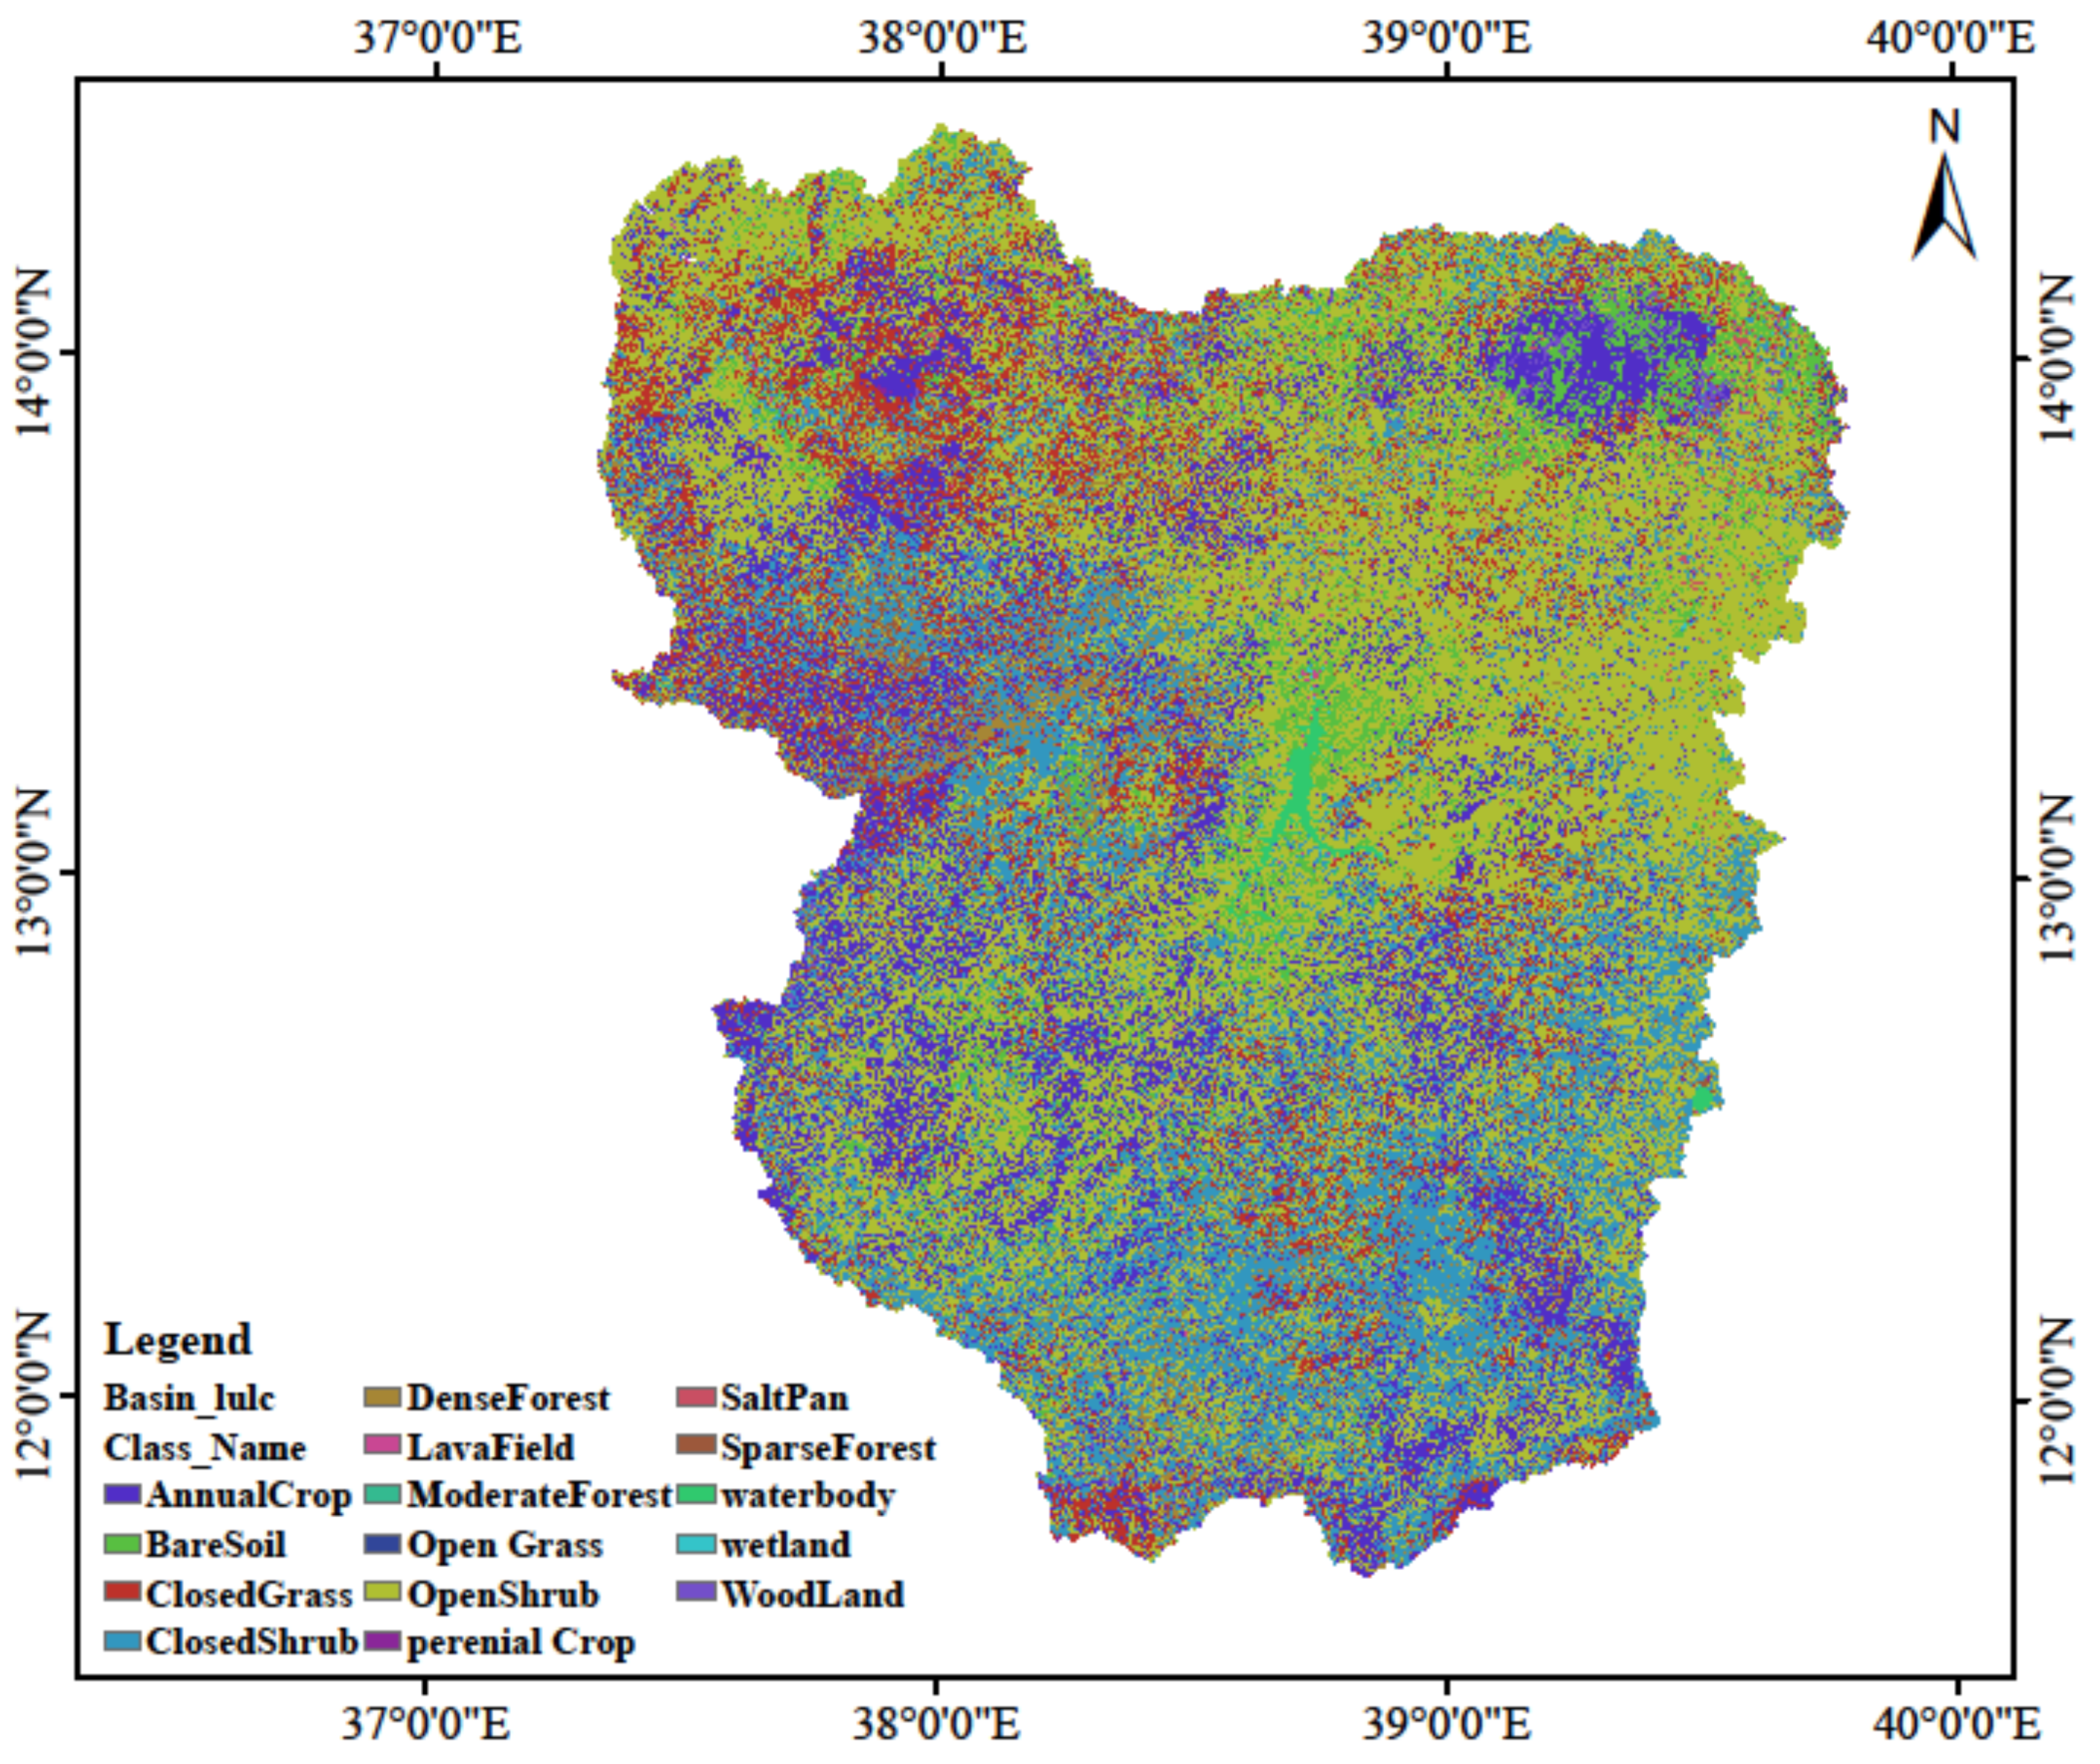
Figure 6.
Observed and simulated data during calibration.
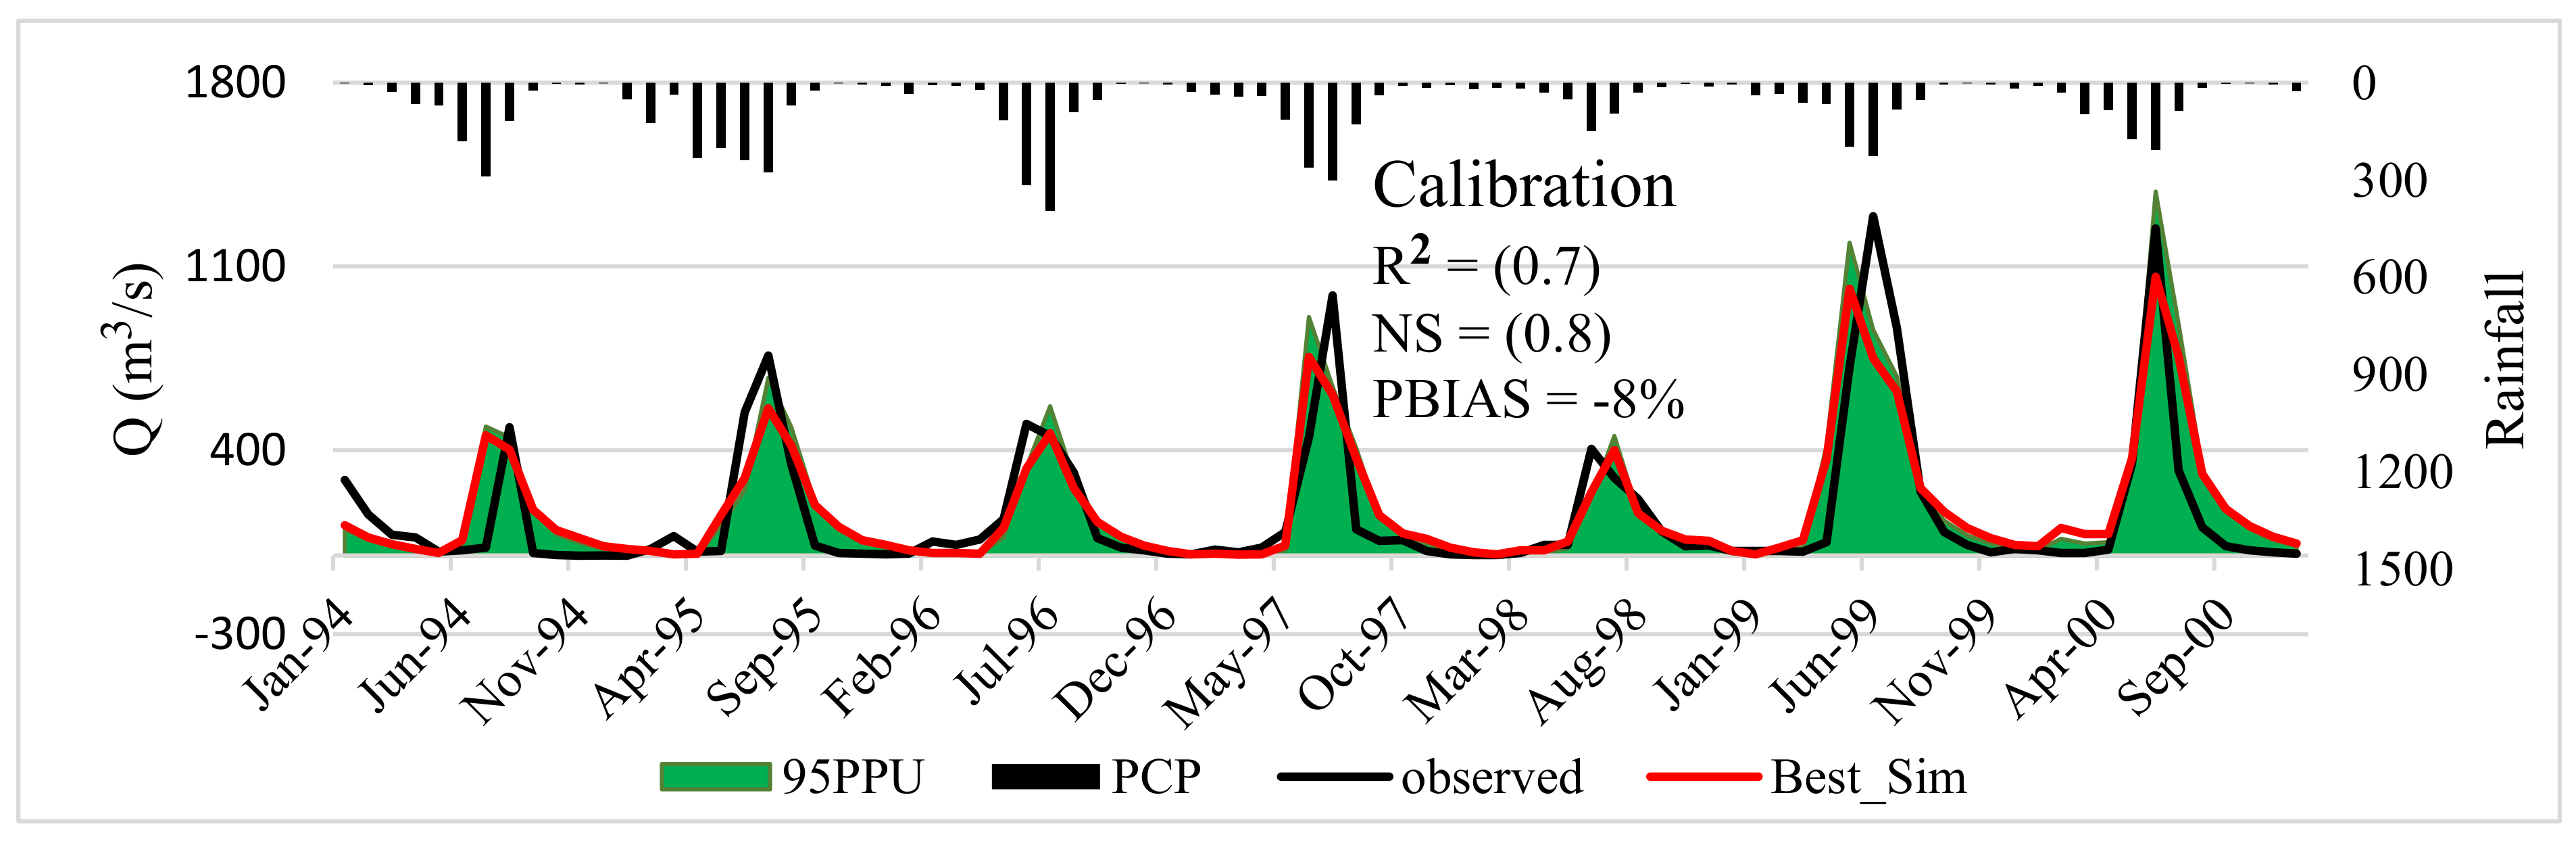
Figure 7.
Observed and simulated data during validation.
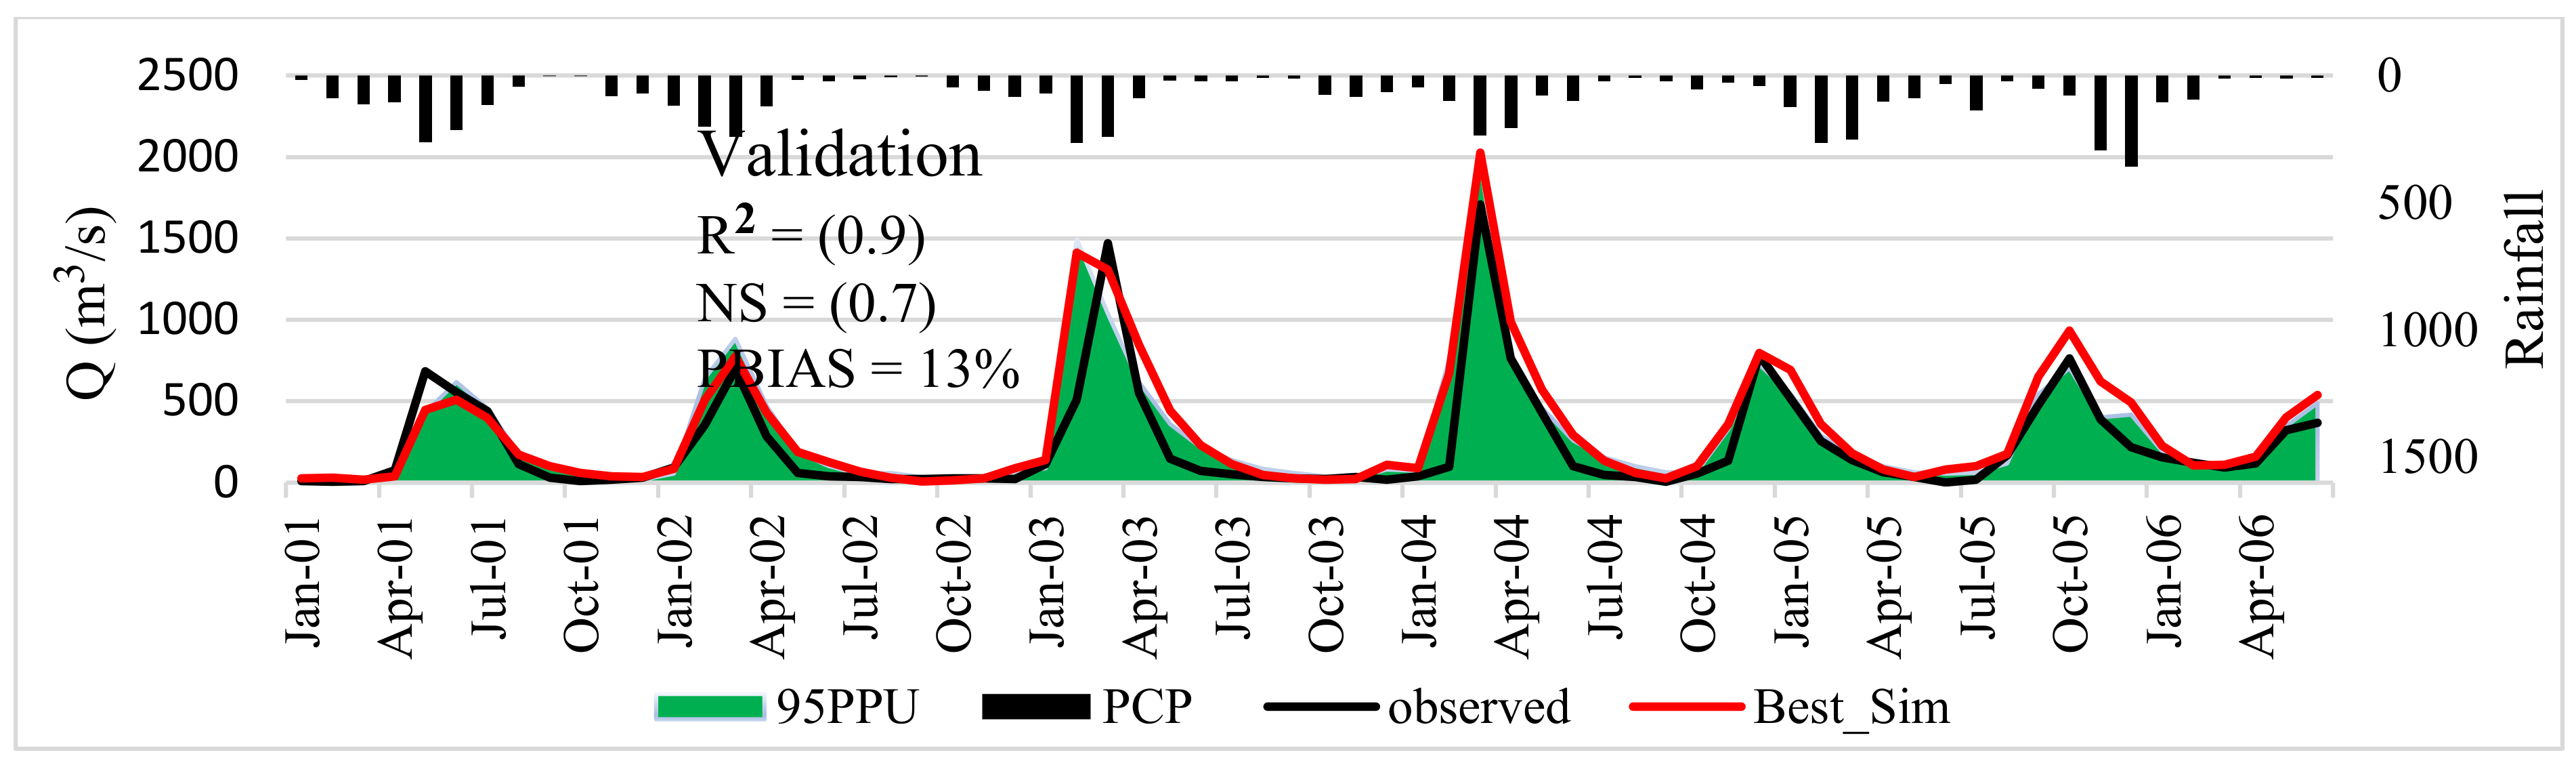
Figure 8.
Sediment yield at each subbasin.

Figure 9.
Rate of erosion in the basin without any conservation measure.

Figure 10.
Erosion rate after implementation of terracing conservation measure.

Figure 11.
Erosion rate in the basin after implementation of contour conservation measure.

Figure 12.
Erosion rate in the basin after implementation of grassed waterway conservation measure.
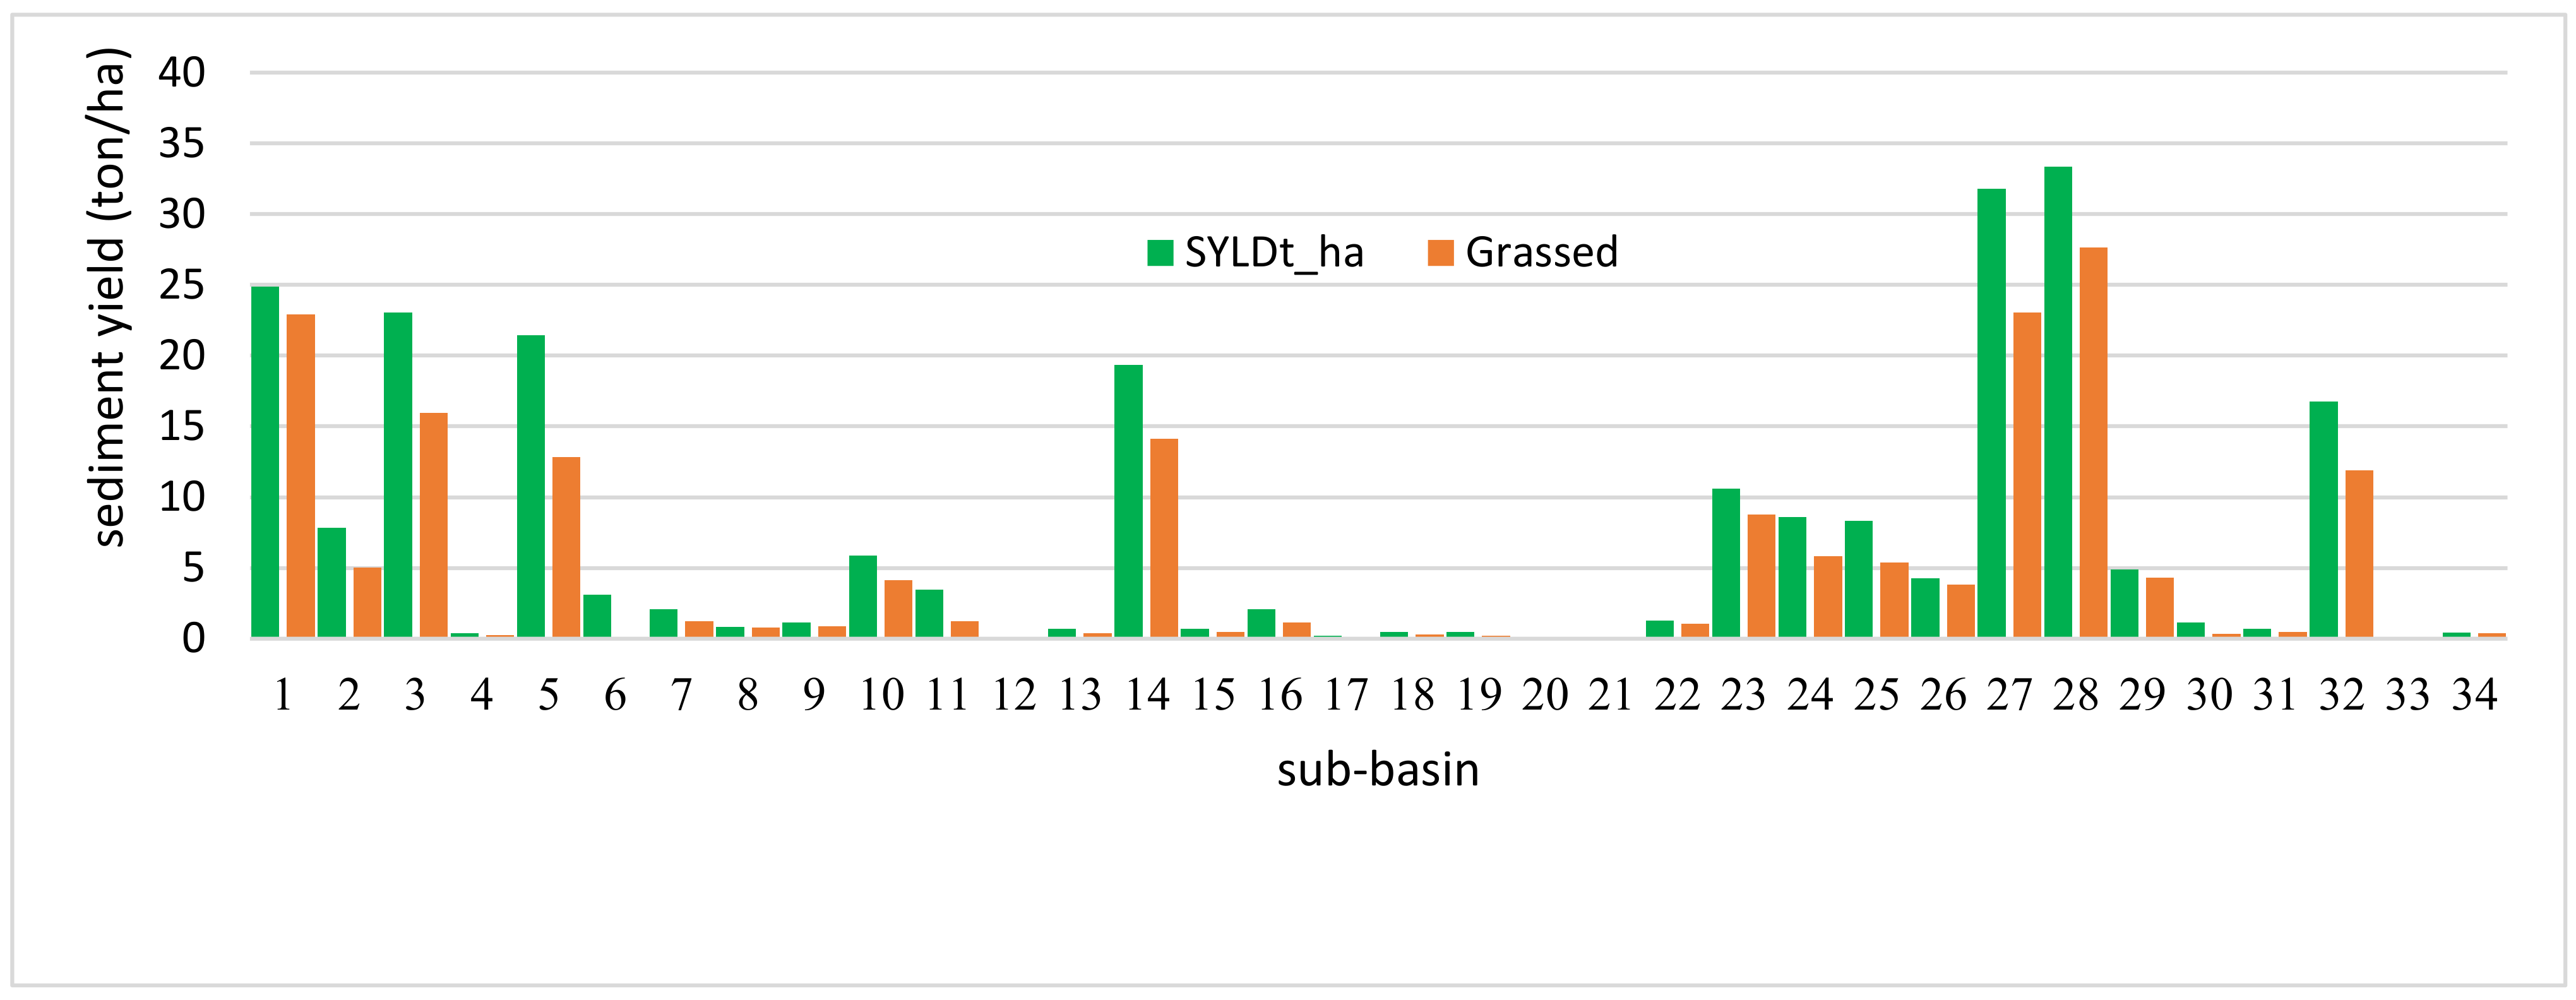
Figure 13.
Comparison of conservation methods: (a) baseline scenario; (b) terracing; (c) contouring; (d) grassed waterway.
Figure 13.
Comparison of conservation methods: (a) baseline scenario; (b) terracing; (c) contouring; (d) grassed waterway.

Table 1.
Input data and source.
| Input Data | Description | Source | References |
|---|---|---|---|
| Meteorological data | Max and Min temperatures, solar radiation, wind speed, and relative humidity | Ethiopian National Meteorology Agency (ENMA) | [45,46] |
| Spatial data | DEM | https://earthexplorer.usgs.gov/ | [47,48] |
| LULC and Soil data | Ethiopia Ministry of Water, Irrigation, and Electricity (EMWIE), and additional image classification is performed using Erdas 2018. | [49,50] | |
| Hydrological data | Discharge and sediment data | Ethiopia Ministry of Water, Irrigation, and Electricity (EMWIE). | [49,50] |
Table 2.
Description soil-code.
| No. | Soil-Code | Soil-Texture Name | No. | Soil-Code | Soil-Texture Name |
|---|---|---|---|---|---|
| 1 | Ao41-2bc | Loam | 8 | Bh4-2c | Loam |
| 2 | Ao63-3b | Loam | 9 | Ne15-3c | Clay |
| 3 | Bd31-2c | Loam | 10 | Ne20-3b | Clay |
| 4 | Be50-2/3c | Clay-loam | 11 | Qc2-1bc | Sandy-loam |
| 5 | Be9-3c | Clay | 12 | Qc5-1c | Sandy-loam |
| 6 | Bh12-3c | Clay-loam | 13 | Re59-2c | Loam |
| 7 | Bh13-2/3c | Clay-loam | 14 | Xh19-2a | Clay-loam |
Table 3.
Selected sensitive parameters.
| Parameter | Description | p-Value | t-Stat | Fitted Values | Rank of Sensitivity |
|---|---|---|---|---|---|
| SOL-AWC | Soil water allowable capacity | 0.0 | −4.96 | 0.16 | 1 |
| ESCO.hru | Soil factor | 0.0 | 4.08 | 0.05 | 2 |
| SLSUBBSN.hru | Average slope length | 0.05 | 3.49 | 44.3 | 3 |
| SOL-BD | Soil bulk density | 0.55 | −3.47 | −0.02 | 4 |
| CN2.mgt | Curve number | 0.85 | 2.56 | 0.04 | 5 |
| GWQMN.gw | Groundwater level is needed for return flow to proceed | 0.56 | 0.56 | 2410 | 6 |
| SOL-K | Soil Hydraulic conductivity (mm/h) | 0.63 | 0.48 | −0.09 | 7 |
| GW-DELAY | Groundwater delay (day) | 0.78 | −0.29 | 88.7 | 8 |
| ALPHA-BF | Base-flow factor (day) | 0.81 | −0.25 | 0.38 | 9 |
Table 4.
Rate of erosion after using various conservation practices.
| SUB | Grassed | Contour | Terracing | SUB | Grassed | Contour | Terracing |
|---|---|---|---|---|---|---|---|
| 1 | 1.97 | 7.66 | 8.32 | 18 | 0.166 | 0.166 | 0.28 |
| 2 | 2.81 | 1.61 | 3.09 | 19 | 0.265 | 0.118 | 0.29 |
| 3 | 7.08 | 5.95 | 8.26 | 20 | 0.051 | 0.057 | 0.06 |
| 4 | 0.135 | 0.03 | −0.53 | 21 | 0.048 | 0.02 | −0.21 |
| 5 | 8.62 | 6.33 | 9.94 | 22 | 0.223 | 0.39 | 0.87 |
| 6 | 2.96 | 0.76 | 2.98 | 23 | 1.82 | 1.1 | 2.74 |
| 7 | 0.88 | 0.09 | 1 | 24 | 2.769 | 2.37 | 3.39 |
| 8 | 0.064 | 0.193 | 0.15 | 25 | 2.97 | 0.23 | −0.06 |
| 9 | 0.28 | 0.67 | 0.12 | 26 | 0.42 | 1.488 | −2.76 |
| 10 | 1.71 | 0.63 | 0.3 | 27 | 8.755 | 3.28 | 14.61 |
| 11 | 2.19 | 1.22 | 2.32 | 28 | 5.734 | 3.1 | 9.53 |
| 12 | 0 | −0.04 | 0 | 29 | 0.604 | 2.57 | 1.06 |
| 13 | 0.322 | 0.14 | 0.1 | 30 | 0.811 | 0.07 | 0.85 |
| 14 | 5.224 | 1.3 | 9.24 | 31 | 0.212 | 0.41 | 0.17 |
| 15 | 0.226 | 0.18 | 0.28 | 32 | 4.86 | 2.5 | 5.93 |
| 16 | 0.925 | 0.26 | 1.95 | 33 | 0 | 0 | 0 |
| 17 | 0.0855 | 0.05 | 0.12 | 34 | 0.038 | 0.22 | 0.23 |
Disclaimer/Publisher’s Note: The statements, opinions and data contained in all publications are solely those of the individual author(s) and contributor(s) and not of MDPI and/or the editor(s). MDPI and/or the editor(s) disclaim responsibility for any injury to people or property resulting from any ideas, methods, instructions or products referred to in the content. |
© 2023 by the authors. Licensee MDPI, Basel, Switzerland. This article is an open access article distributed under the terms and conditions of the Creative Commons Attribution (CC BY) license (https://creativecommons.org/licenses/by/4.0/).
Share and Cite
MDPI and ACS Style
Hailu, M.B.; Mishra, S.K.; Jain, S.K. Evaluation of Spatial-Temporal Variation of Soil Loss and Best Conservation Measures in an East Africa Catchment. Sustainability 2023, 15, 7778. https://doi.org/10.3390/su15107778
AMA Style
Hailu MB, Mishra SK, Jain SK. Evaluation of Spatial-Temporal Variation of Soil Loss and Best Conservation Measures in an East Africa Catchment. Sustainability. 2023; 15(10):7778. https://doi.org/10.3390/su15107778
Chicago/Turabian StyleHailu, Melese Baye, Surendra Kumar Mishra, and Sanjay K. Jain. 2023. "Evaluation of Spatial-Temporal Variation of Soil Loss and Best Conservation Measures in an East Africa Catchment" Sustainability 15, no. 10: 7778. https://doi.org/10.3390/su15107778
Note that from the first issue of 2016, this journal uses article numbers instead of page numbers. See further details here.