1. Introduction
Traditional bus transit ridership demand forecasting models are usually developed based on data collected through empirical research and questionnaire surveys, and they primarily consider the passenger flows measured at terminals and bus stations along observed public bus routes and the number of passenger kilometers traveled on each bus route segment, as well as historical data on relevant demographic, socioeconomic, and land use characteristics and the modal distribution of passengers in the area of influence of the observed bus route terminals and bus stations. In this regard, the historical statistical data necessary for the development of forecasting models are generally obtained from conventional data sources, which primarily include the periodic publications and databases of relevant government organizations and the schedules, annual reports, and databases of public and private bus service providers.
Because traditional bus passenger demand forecasting models are primarily based on historical data and data collected from field measurements and questionnaire surveys, they are unreliable because they often use outdated transit demand data that are no longer significant for estimating the future number of passengers and determining expected transit service on existing and newly planned public transit lines. Traditional forecasting models are also very inflexible because they require data that are typically collected over an extended period of time to determine future travel demand. Another disadvantage of these types of models is the high cost of the empirical research that must be conducted for their development. For this reason, conventional forecasting models cannot be used effectively for short-term and real-time predictions of travel demand characteristics.
Due to numerous shortcomings of the traditional transport demand forecasting approach, it is important to consider the possibility of improving the accuracy, confidence and flexibility of traditional forecasting models by using relevant statistical data available in various big data systems, including automated fare collection systems, automated passenger counting systems, mobile phone call records, border surveillance system records, tourist and visitor registration systems, accommodation reservation systems, bank record systems, student record systems, medical tourism records, and meteorological data systems.
Considering the research problems mentioned above, the main research gaps can be defined as follows: (1) to the best of the authors’ knowledge, there is a lack of big data-based forecasting models in the Republic of Croatia and the Republic of Kosovo that use additional statistical data stored in existing big data systems to improve the accuracy and quality of passenger demand forecasts on existing and planned international bus routes; (2) the forecasting models developed to date in the Republic of Croatia and the Republic of Kosovo for forecasting future passenger demand on international bus routes are based on a traditional reactive passenger demand modelling approach that primarily takes into account the historical data contained in conventional data sources, which include periodic publications and conventional databases of relevant governmental organizations (e.g., Croatian Bureau of Statistics, Ministry of Interior); (3) notwithstanding the fact that there are numerous big data sources both in the Republic of Croatia and the Republic of Kosovo that could potentially be used for the development of big data-based bus passenger demand forecasting models, these data sources cannot be effectively integrated and used due to existing privacy concerns and political, institutional and legal barriers. A large number of the big data systems that contain the most valuable statistical data are owned by various corporations, businesses and institutions that are unwilling to share their data.
Therefore, the object of this research was to explore the possibilities for developing a conceptual methodological procedural framework that could serve as the basis for the following: (1) identifying a set of relevant transportation, geographic, socioeconomic, and demographic statistical indicators contained in available big data systems that could potentially be used to predict future passenger demand on selected international bus routes; (2) testing the statistical significance of the identified statistical indicators to determine whether they could be included as predictor variables in the multiple linear regression equation of the new big data-based predictive models; (3) defining the optimal mathematical formulation of the bus passenger demand prediction models as a function of the statistical significance of the considered statistical indicators extracted from big data systems; and (4) defining the alternative formulations of big data-based prediction models that could be used in cases where input data for primary predictor variables included in the optimal model formulation are missing or incomplete.
The main objective of this research was not to find a single, optimal mathematical formulation of a multiple linear regression model that can be effectively and efficiently used to accurately predict future passenger demand on the observed Prizren–Zagreb international bus route, but rather only to propose a conceptual procedural framework that makes it possible to extract relevant statistical indicators from available big data systems and determine their statistical significance in terms of their potential to be used as predictor variables in the formulation of multiple linear regression prediction models. Therefore, the multiple linear regression model presented in this paper should be considered only as an example solution obtained based on the proposed conceptual procedural framework, i.e., not as a final, definitive formulation of a model that can be used to predict future passenger demand on an observed bus route.
The main goal of this research was not to find a single, optimal mathematical formulation of a multiple linear regression model that could effectively and efficiently be used to precisely predict the future passenger demand on the observed international bus transit line Prizren–Zagreb, but rather only to propose a conceptual procedural framework by which it is possible to extract relevant statistical indicators from available big data systems and determine their statistical significance in terms of their potential to be used as predictor variables in the formulation of multiple linear regression prediction models. Therefore, the multiple linear regression model presented in the scope of this paper should be seen only as one example of a solution obtained based on the proposed conceptual procedural framework, i.e., not as a final, definite formulation of model that can be used for predicting future passenger demand on observed bus line.
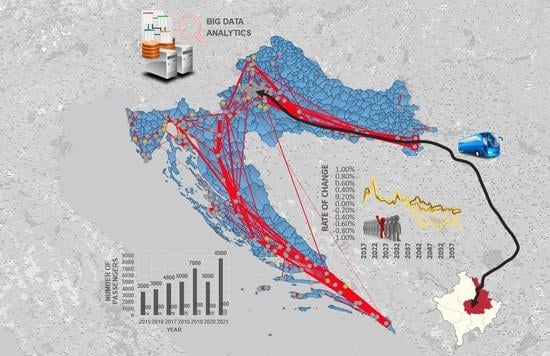
In order to develop a conceptual procedural framework for testing the statistical significance of potential predictor variables (statistical indicators) in big data systems and for the mathematical formulation of big data-based passenger demand prediction models, in this research, we investigated the mathematical relationships between the characteristics of passenger demand on the Prizren–Zagreb international bus route and the values of relevant statistical indicators in publicly available big data systems. The Prizren–Zagreb international bus route was chosen as a subject of this research primarily due to the availability of the input data necessary for: (1) performing correlation and regression analyses between various statistical indicators (potential predictor variables) included in available big data systems and measured passenger demand along the observed bus route, and (2) performing all relevant statistical tests (multilinearity, homoscedasticity, autocorrelation and multivariate normality test), through which the statistical significance of all considered statistical indicators can be determined.
The 869 km long Prizren–Zagreb international bus line connects the two most important and populous cities of the Republic of Kosovo, Prizren in the south and Priština as the capital in the north of the country with the city of Slavonski Brod in the eastern part of the Republic of Croatia and the Croatian capital Zagreb. A bus line includes six stations, whereby four main bus stations (terminals) are located in the cities of Prizren, Priština, Slavonski Brod and Zagreb, and the remaining two bus stations are located at the Merdare border crossing between Kosovo and Serbia and at the Batrovci/Bajakovo border crossing between Serbia and Croatia. Passenger demand data on the observed bus route was obtained from the existing bus operators, including the following companies: N.T. SH Vec-tor, Čazmatrans-Nova Ltd., Čazmatrans-Promet Ltd. and Autotransport Karlovac Ltd. Data on the relevant statistical indicators were taken from publicly available big data systems, including the ASKdata platform of the Kosovo Agency of Statistics [
1], the World Bank database [
2] and the International Monetary Fund World Economic Outlook database [
3], as well as official big data systems, including the database of the Border Police Directorate of the Croatian Ministry of Interior and the database of Raiffeisenbank Croatia.
The remainder of this article is organized as follows.
Section 2 provides a brief overview of the results and conclusions drawn from the selected international research related to big data systems and the potential of their application for the purpose of modelling pedestrian demand.
Section 3 presents the main methodological steps to the development of a conceptual procedural framework intended for testing the statistical significance of the statistical indicators included in big data systems and formulating big data-based models to predict bus passenger demand. In
Section 4, the authors discuss the results of the partial linear correlation and regression analyses performed, the statistical tests for multicollinearity, homoscedasticity, autocorrelation and multivariate normality, and the mathematical formulation of the multiple regression prediction models obtained based on the stepwise forward regression procedure.
Section 5 presents the conclusions from the conducted research and provides recommendations for future research.
2. Literature Review
This chapter briefly reviews the results and conclusions of recent studies and research on ways to improve existing conventional transport demand forecasting models and develop new forecasting models based on data obtained from available big data systems. The results of numerous recent researches show that data from various big data systems can be efficiently used to improve the accuracy and reliability of passenger demand forecasts on urban, intercity, interregional and international bus routes.
Lyu, Xu, Zhang et al. developed a multiple enter linear regression (MELR) prediction model to predict passenger demand during the expansion of the original subway network in Xi’an city, China. The prediction performance of the proposed multiple regression model was compared with that of autoregressive integrated moving average (ARIMA) models. The results of the conducted research showed that the MELR model is better for short-term passenger demand forecasting compared to ARIMA models [
4]. Toole, Colak, Sturt et al. investigated the possibility of integrating ubiquitous mobile computing data into existing urban and transportation planning systems to estimate travel demand and transportation infrastructure usage [
5]. Bernardin, Ferdous, Sadrsadat et al. recognized the importance of using commercial big data from cell phones for long-distance travel analysis [
6]. Molloy and Moeckl used data from the independent location data platform Foursquare to develop a long-distance destination choice model for Ontario, Canada [
7]. Llorca, Ji, Molloy et al. have described the development of a microscopic long-distance travel demand model based on the usage of location-based big data [
8].
Xiang, Xu, Yu et al. studied the prevailing travel distance for intercity passenger travel by using large-scale location-based big data sources [
9]. To determine the prevailing distances for different urban modes, they used a network crawler to extract the mode shares for more than 360 cities in China from the big data of intercity passenger travel. Based on the statistical analysis of the data extracted from the big data system, separate mode share curves were developed for each mode. Ye, Chen, and Xue used ARIMA models based on big data extracted from AFC system bus payment devices to predict passenger flow in the Jiaozuo city bus transit system [
10]. Cyril, Mulangi, and Varghese studied the application of the time-series method for predicting passenger demand in public bus transport in the Indian city of Trivandrum by using the big data generated by the electronic ticket machines (ETMs) for issuing tickets and collecting fares [
11]. Zhao, Zhang, Li et al. have analyzed the theories and methods for using big data in traffic demand forecasting. They also proposed new models and algorithms, including the full sampling distribution demand model, the traffic integration model and the MoPeD model, which respond to the limitations of traditional disaggregated traffic modelling approaches [
12]. Khunsri and Sooksan quantitatively studied the system-level efficiency and agent-level efficiency of the Bangkok cab system based on big data collected from real cab lanes containing more than 114 million GPS records of cab locations [
13]. In the study by Xiong, Li, Wu et al. proposed a dynamic public transportation network based on a cyber-physical-social system as a universal framework for advanced public transportation systems, which can optimize public transportation based on big data sources and AI methods [
14].
3. Methodology of Research
The development of a conceptual procedural framework for (1) testing the statistical significance of statistical indicators included in big data systems in terms of their potential to be used as predictor variables in big data-based passenger demand forecasting models; (2) formulation of primary (optimal) and alternative functional forms of new bus passenger demand forecasting models based on multiple linear regression; and (3) validation and adjustment of the regression equation of existing bus passenger demand forecasting models, was conducted according to the following methodological steps:
Structural analysis of available big data systems: In order to identify relevant statistical indicators that can potentially be used for passenger demand modelling on the Prizren–Zagreb international bus route, a structural analysis of three big data systems was conducted, including the World Bank database [
2], the International Monetary Fund’s World Economic Outlook database [
3], and the Kosovo Agency of Statistics’ ASKdata platform [
1].
Extraction of relevant statistical indicators from available data sources: Based on the conducted structural analysis of the considered big data systems, 51 relevant statistical indicators and 1 output variable (annual number of passengers transported on the Prizren–Zagreb international bus line) were identified. The data for these statistical indicators were extracted from the big data systems and stored in the MS Excel data file.
Creation and preparation of the database with relevant statistical indicators for import into the Rstudio programming environment [
15]: The data exported from the big data systems were structured into the following five data columns: (1) Predictor ID; (2) Name of predictor; (3) Year; (4) Absolute value of predictor variable; and (5) Relative rate of change of predictor variable. The extracted database (
Table S1 in Supplementary Material) contained a total of 928 records with absolute values and annual relative rates of change of observed/predicted statistical indicators for the period between 1953 and 2061.
Procedure for filtering and aggregating data: The created database was filtered to include only the values of statistical indicators for the period between the years 2015 and 2021, for which the data on the annual number of passengers transported on the Prizren–Zagreb international bus line were available. Based on the first iteration of the data filtering procedure, an output dataset (
Table S2 in Supplementary Material) with 34 data column vectors for potentially independent variables and 1 column vector for the dependent variable was extracted from the original database, containing a total of 201 numerical value. The filtered data columns were then aggregated into 11 statistical groups according to the type (transportation, geospatial, demographic or socioeconomic) of considered statistical indicators.
Partial linear regression and correlation analysis between each independent and dependent variable: In order to determine whether each of the statistical indicators considered has a linear correlation with the demand for bus transport, a total of 33 partial linear models were first created in the RStudio programming environment using the lm() function. The relevant results of the partial correlation and regression analysis, including the values of Pearson’s correlation coefficient (r), coefficient of determination (r2) indicating the strength of the partial correlation and p-value indicating the statistical significance of the created linear models, were then extracted separately for each group of models using the summary() function and stored in separate data vectors. Finally, based on the defined logical rules and the min() and max() functions, the partial regression models with the lowest p-values and the highest correlation coefficients were determined. The statistical indicators with a significantly high determination coefficient (r2) and linear regression p-value used in the regression models were selected for the further steps of statistical analysis. All other statistical indicators with non-significant or weak linear correlation were removed from the input database at this stage.
Multicollinearity test: All statistical indicators found to be potentially significant were tested for multicollinearity to check whether any of the independent predictor variables considered were not highly correlated with each other. To test all potential predictor variables for multicollinearity, the intercorrelation and variance inflation factor matrices (VIS) were created by calling the functions cor() and vif(), respectively. To identify predictor variables that were highly correlated with each other, threshold values of 0.90 for the intercorrelation matrix and 5 for the variance inflation matrix were used. The multicollinear predictors with the highest correlation strength and statistical significance with respect to the dependent variable (bus travel demand) were selected for the further steps of the statistical analysis.
Homoscedasticity test: The remaining potential predictor variables were tested for homoscedasticity using the Studentized Breush–Pagan statistic, which performs an auxiliary regression analysis between each predictor considered and its squared residuals. Predictor variables can be considered homoscedastic if their variance is equal or similar over the entire range of their possible values. The homoscedasticity test was performed in the Rstudio [
15] programming environment using the lmtest::bptest() function. The predictor values, for which the
p-value of the Breush–Pagan test was greater than 0.05, were selected for the further steps of the statistical analysis.
Autocorrelation test: Based on the autocorrelation test, the correlation strength between the individual values of the predictor variables measured at different points in time was determined to identify their degree of periodicity, i.e., the patterns or trends across the time series of considered statistical indicators. The predictor variables that can be used efficiently in the multiple correlation model should not be highly correlated with their historical values. The autocorrelation test for each of the considered statistical indicators was performed based on the Durbin–Watson statistic by calling the durbin-WatsonTest() function in the Rstudio programming environment [
15]. Based on the performed Durbin–Watson test, only those potential predictor variables, for which the test yielded a
p-value greater than 0.05, were considered statistically significant and included in the further steps of analysis.
Multivariate normality test: Multivariate normality exists when the residuals determined for linear regression models developed based on individual predictor variables are normally distributed. To test the considered statistical indicators for multivariate normality, the Shapiro–Wilk normality test was performed using the shapiro.test() function. After this test, all potential predictor variables for which the p-value was above the threshold of 0.05 were considered statistically significant and included in the final stage of analysis.
Stepwise regression procedure: To determine the optimal mathematical formulation of the multiple regression model, a stepwise forward regression procedure was used. This procedure starts with the empty multiple regression model with no predictor variables and then iteratively adds the predictor variables that were found to be the most important in terms of contributing to the overall precision and confidence of the predictive model. The iterative addition procedure was terminated when the performance of the multiple regression model could not be improved significantly by adding new predictor variables to the regression equation. The stepwise forward regression was initiated with the ols_step_forward_p() function, with specified starting parameters of the blank model and the p threshold of 0.05.
Establish a prioritized list of statistically significant predictor variables and determine primary (optimal) and alternative mathematical formulations of passenger demand prediction models based on multiple linear regression: All predictor variables found to be statistically significant in the conducted statistical tests were prioritized based on their level of significance and stored in a separate table in the R programming environment. The primary (optimal) and alternative mathematical formulations of the multiple regression model obtained based on the stepwise forward regression were also stored in a separate data table and prioritized according to the relevant performance parameters of the model, including coefficients of determination, adjusted determination coefficients, Akaike information criterion (AIC) values, root mean square error (RMSE) values, and p values.
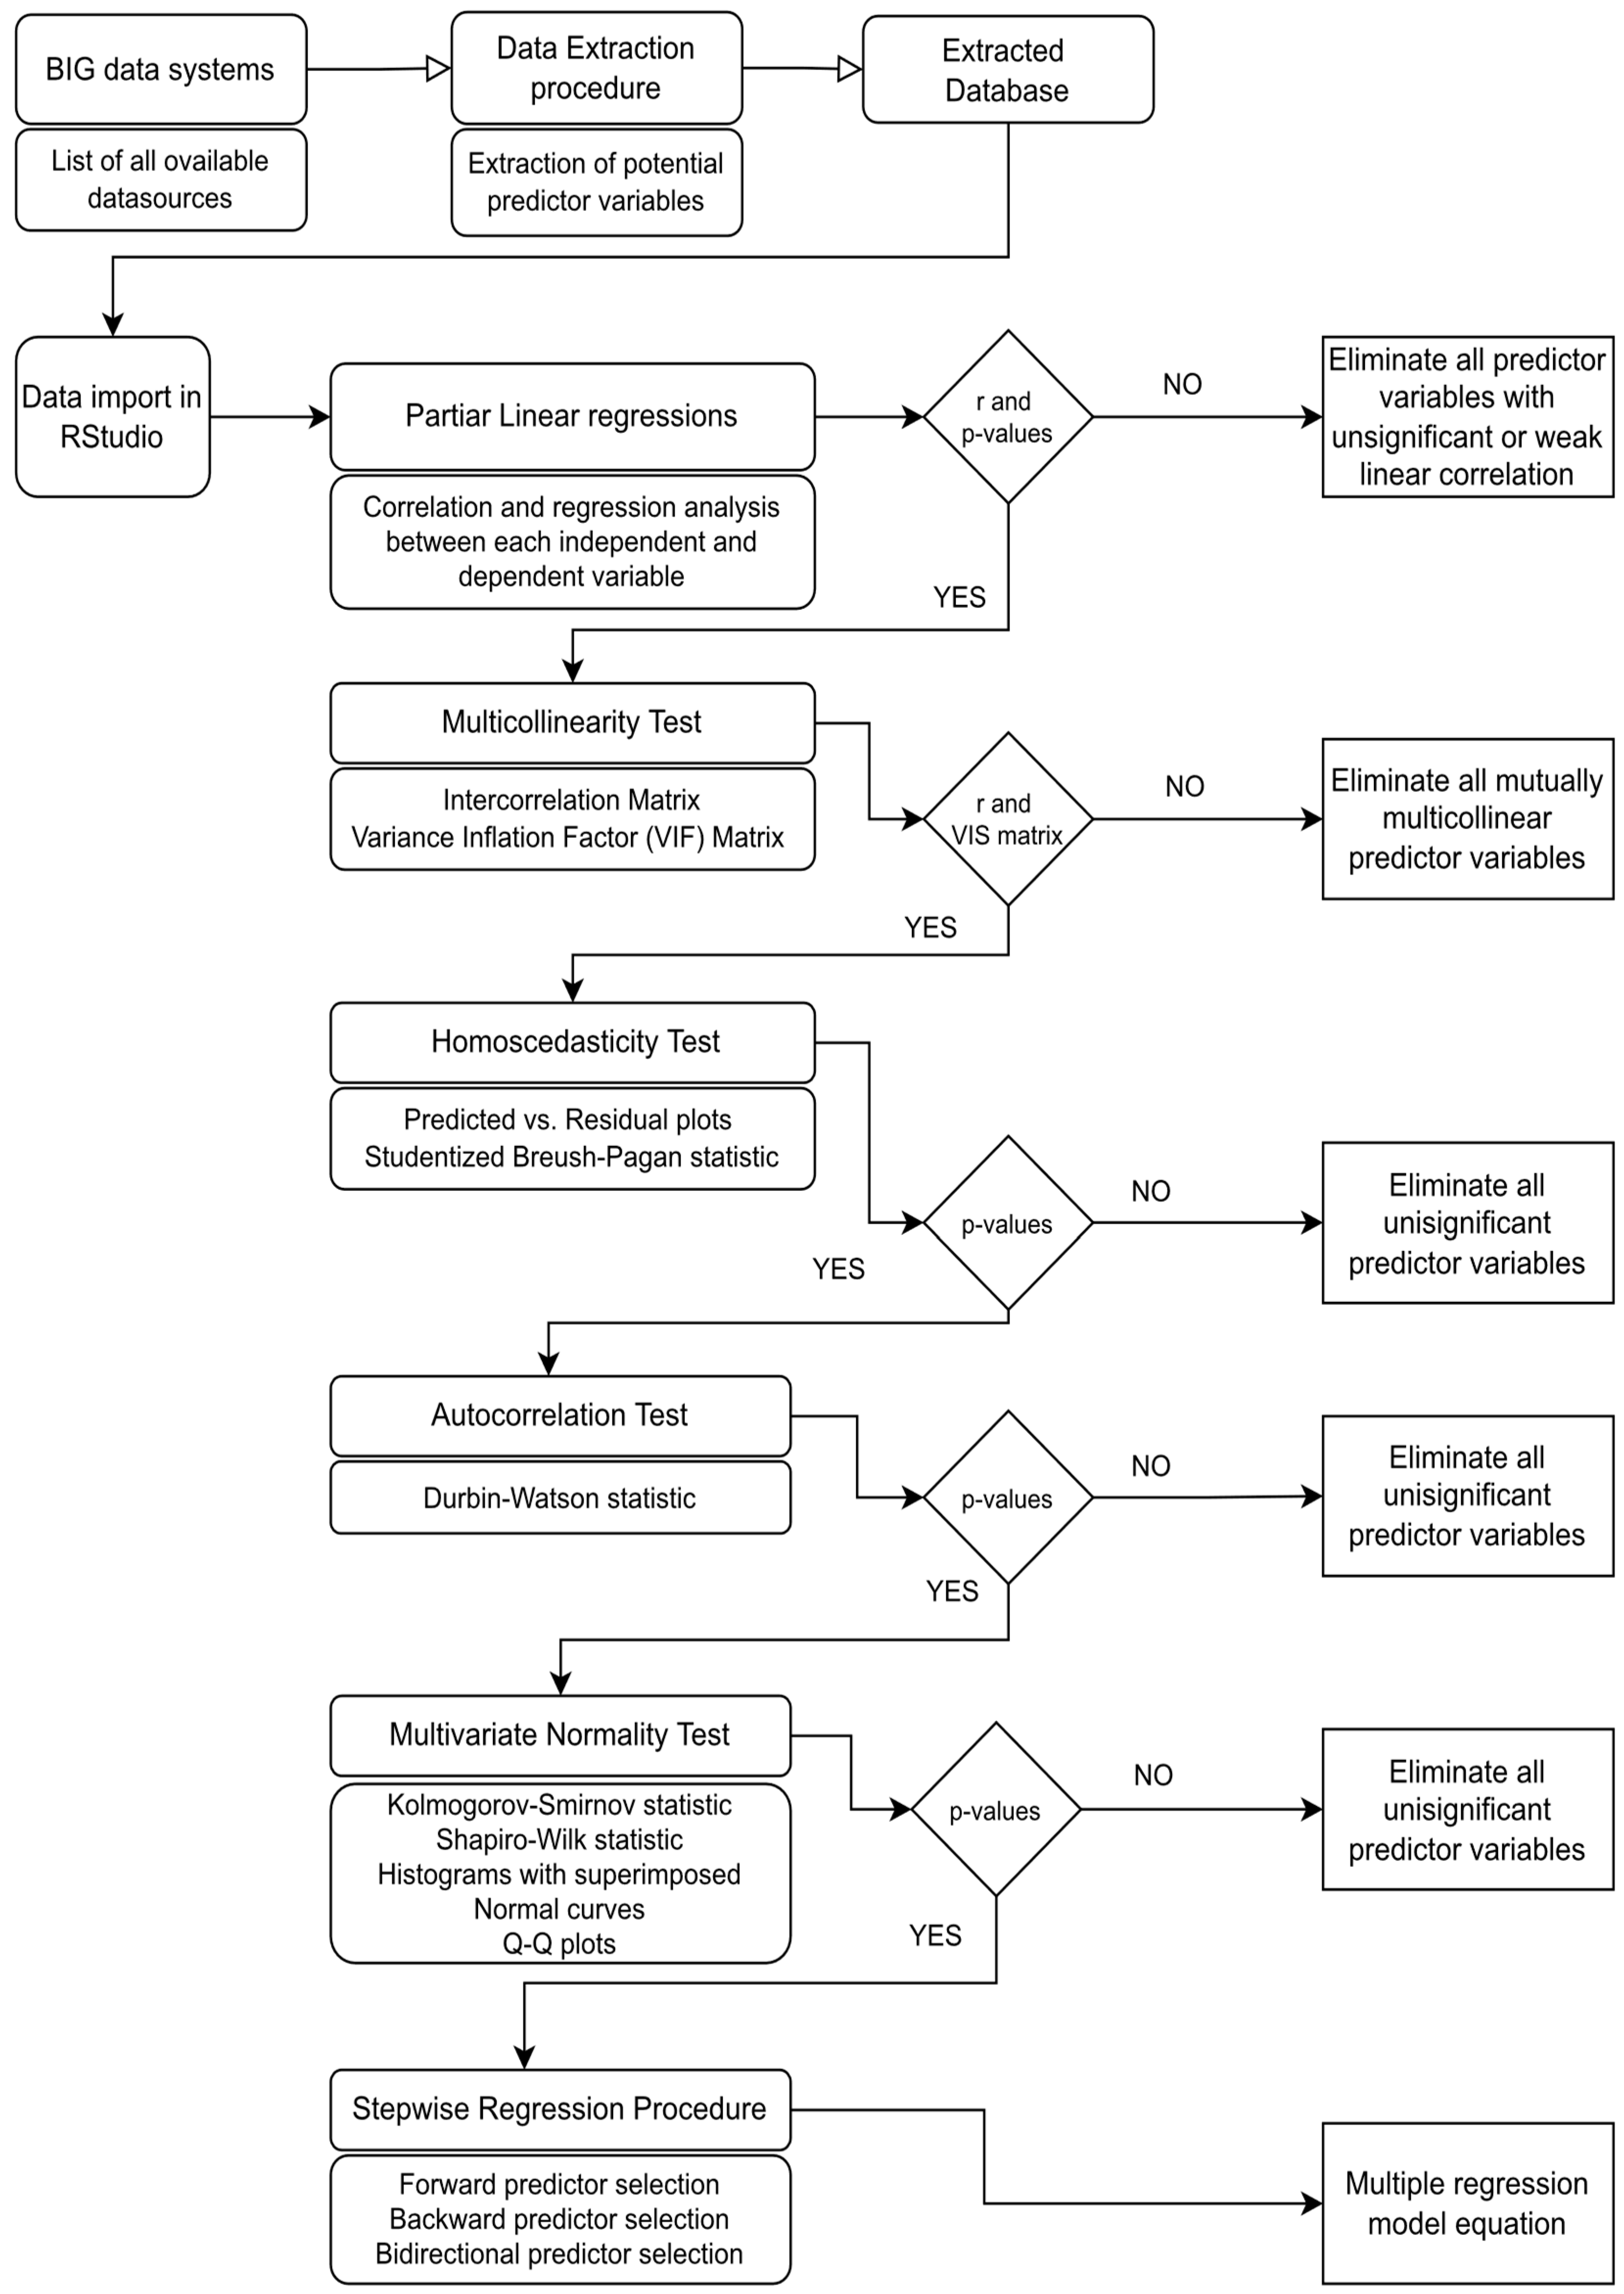
The flowchart of the developed conceptual procedural framework (
Scheme 1) can be used for the following: (1) testing the statistical significance of potential predictor variables in big data systems, (2) formulating primary (optimal) and alternative mathematical formulations of new passenger demand prediction models and (3) validating and/or adapting mathematical formulations of existing passenger demand prediction models. Here, it is important to emphasize that alternative model formulations obtained through the presented methodological steps can be used to predict future bus passenger demand in cases when the input data for the primary predictor variables included in the optimal model regression equations are unreliable or no longer available.
4. Discussion of the Results
Based on the results of the performed partial linear correlation and regression analysis between 33 potential statistical indicators extracted from available big data systems and the dependent variable representing passenger demand on the Prizren–Zagreb bus route, 20 (60.6%) potential predictor variables were eliminated from the input dataset, either due to weak linear correlation strength, i.e., a low Pearson coefficient (r) and/or due to the low level of statistical significance of the obtained linear regression functions (
p-values). The thresholds used to decide whether to retain or eliminate each of the statistical variables considered from the input data set were 0.60 and 0.05 for the coefficient of determination (r
2) and the
p-value, respectively. All predictor variables that did not meet these conditions were considered nonlinearly correlated and unsuitable for the development of a linear multiple regression model and were therefore removed from the input data set. The results of the partial correlation and regression analysis are presented both in tabular form and in the form of comparative scatter plots. The coefficient of determination values and
p-values obtained for each potential predictor variable were grouped into 11 statistical groups according to the type of statistical indicators (transportation, spatial, demographic and socioeconomic indicators) and stored in separate data vectors. Finally, in order to select the most significant predictor within each of the defined statistical groups, the created data vectors containing r
2 and
p values were analysed to identify statistical indicators with the highest coefficient of determination and the lowest
p-value. Based on this procedure, the five most significant potential predictors were selected for further steps of statistical analysis. Examples of comparative scatter plots with fitted linear regression functions between selected predictor variables and dependent variables are shown in
Figure 1.
Table 1 provides a comparative overview of the coefficient of determination values, residual standard errors, and
p-values obtained for the partial linear correlation models between the considered potential predictor variables (statistical indicators) and the dependent variable, which represents the passenger demand on the observed bus route. The Status column indicates whether each of the observed potential predictor variables was eliminated from the input data set.
Potential predictor variables that were found to be strongly linearly correlated with the dependent variable were then tested for multicollinearity to identify any independent variables that were linearly correlated with each other. Multicollinear predictor variables were identified from intercorrelation and variance inflation factor (VIF) matrices constructed based on partial linear correlations conducted between five considered potential predictor variables. All pairs of predictor variables with a Pearson correlation coefficient (r) greater than 0.90 and/or a variance inflation factor greater than 5 were considered multicollinear. From each identified multicollinear pair of variables, a predictor with a stronger correlation with passenger demand on the observed bus route was selected for further statistical analysis. The intercorrelation and variance inflation factor matrices constructed based on the results of the correlation analysis performed between the five considered statistical indicators are presented in
Table 2 and
Table 3.
Based on the conducted multicollinearity test, it was found that GDP per capita and net income in the Republic of Kosovo are highly correlated. Since GDP per capita has a comparatively stronger linear correlation with passenger demand on the observed bus route, the net income variable was removed from the input database.
The remaining four potential predictor variables were then tested for homoscedasticity using the Studentized Breush–Pagan statistic. The results of the conducted homoscedasticity test are shown in
Table 4. From the presented results, it can be seen that the
p-value obtained for all considered potential predictor variables is above 0.05 threshold. This means that we were not able to reject the null hypothesis and thus do not have sufficient evidence for the presence of heteroskedasticity in any of the considered potential predictor variables.
After the homoscedasticity test, all remaining predictor variables were tested for autocorrelation using the Durbin–Watson statistic. The autocorrelation test (
Table 5) showed that none of the four tested predictor variables had a
p-value less than 0.05, so they can all be considered non-autocorrelated.
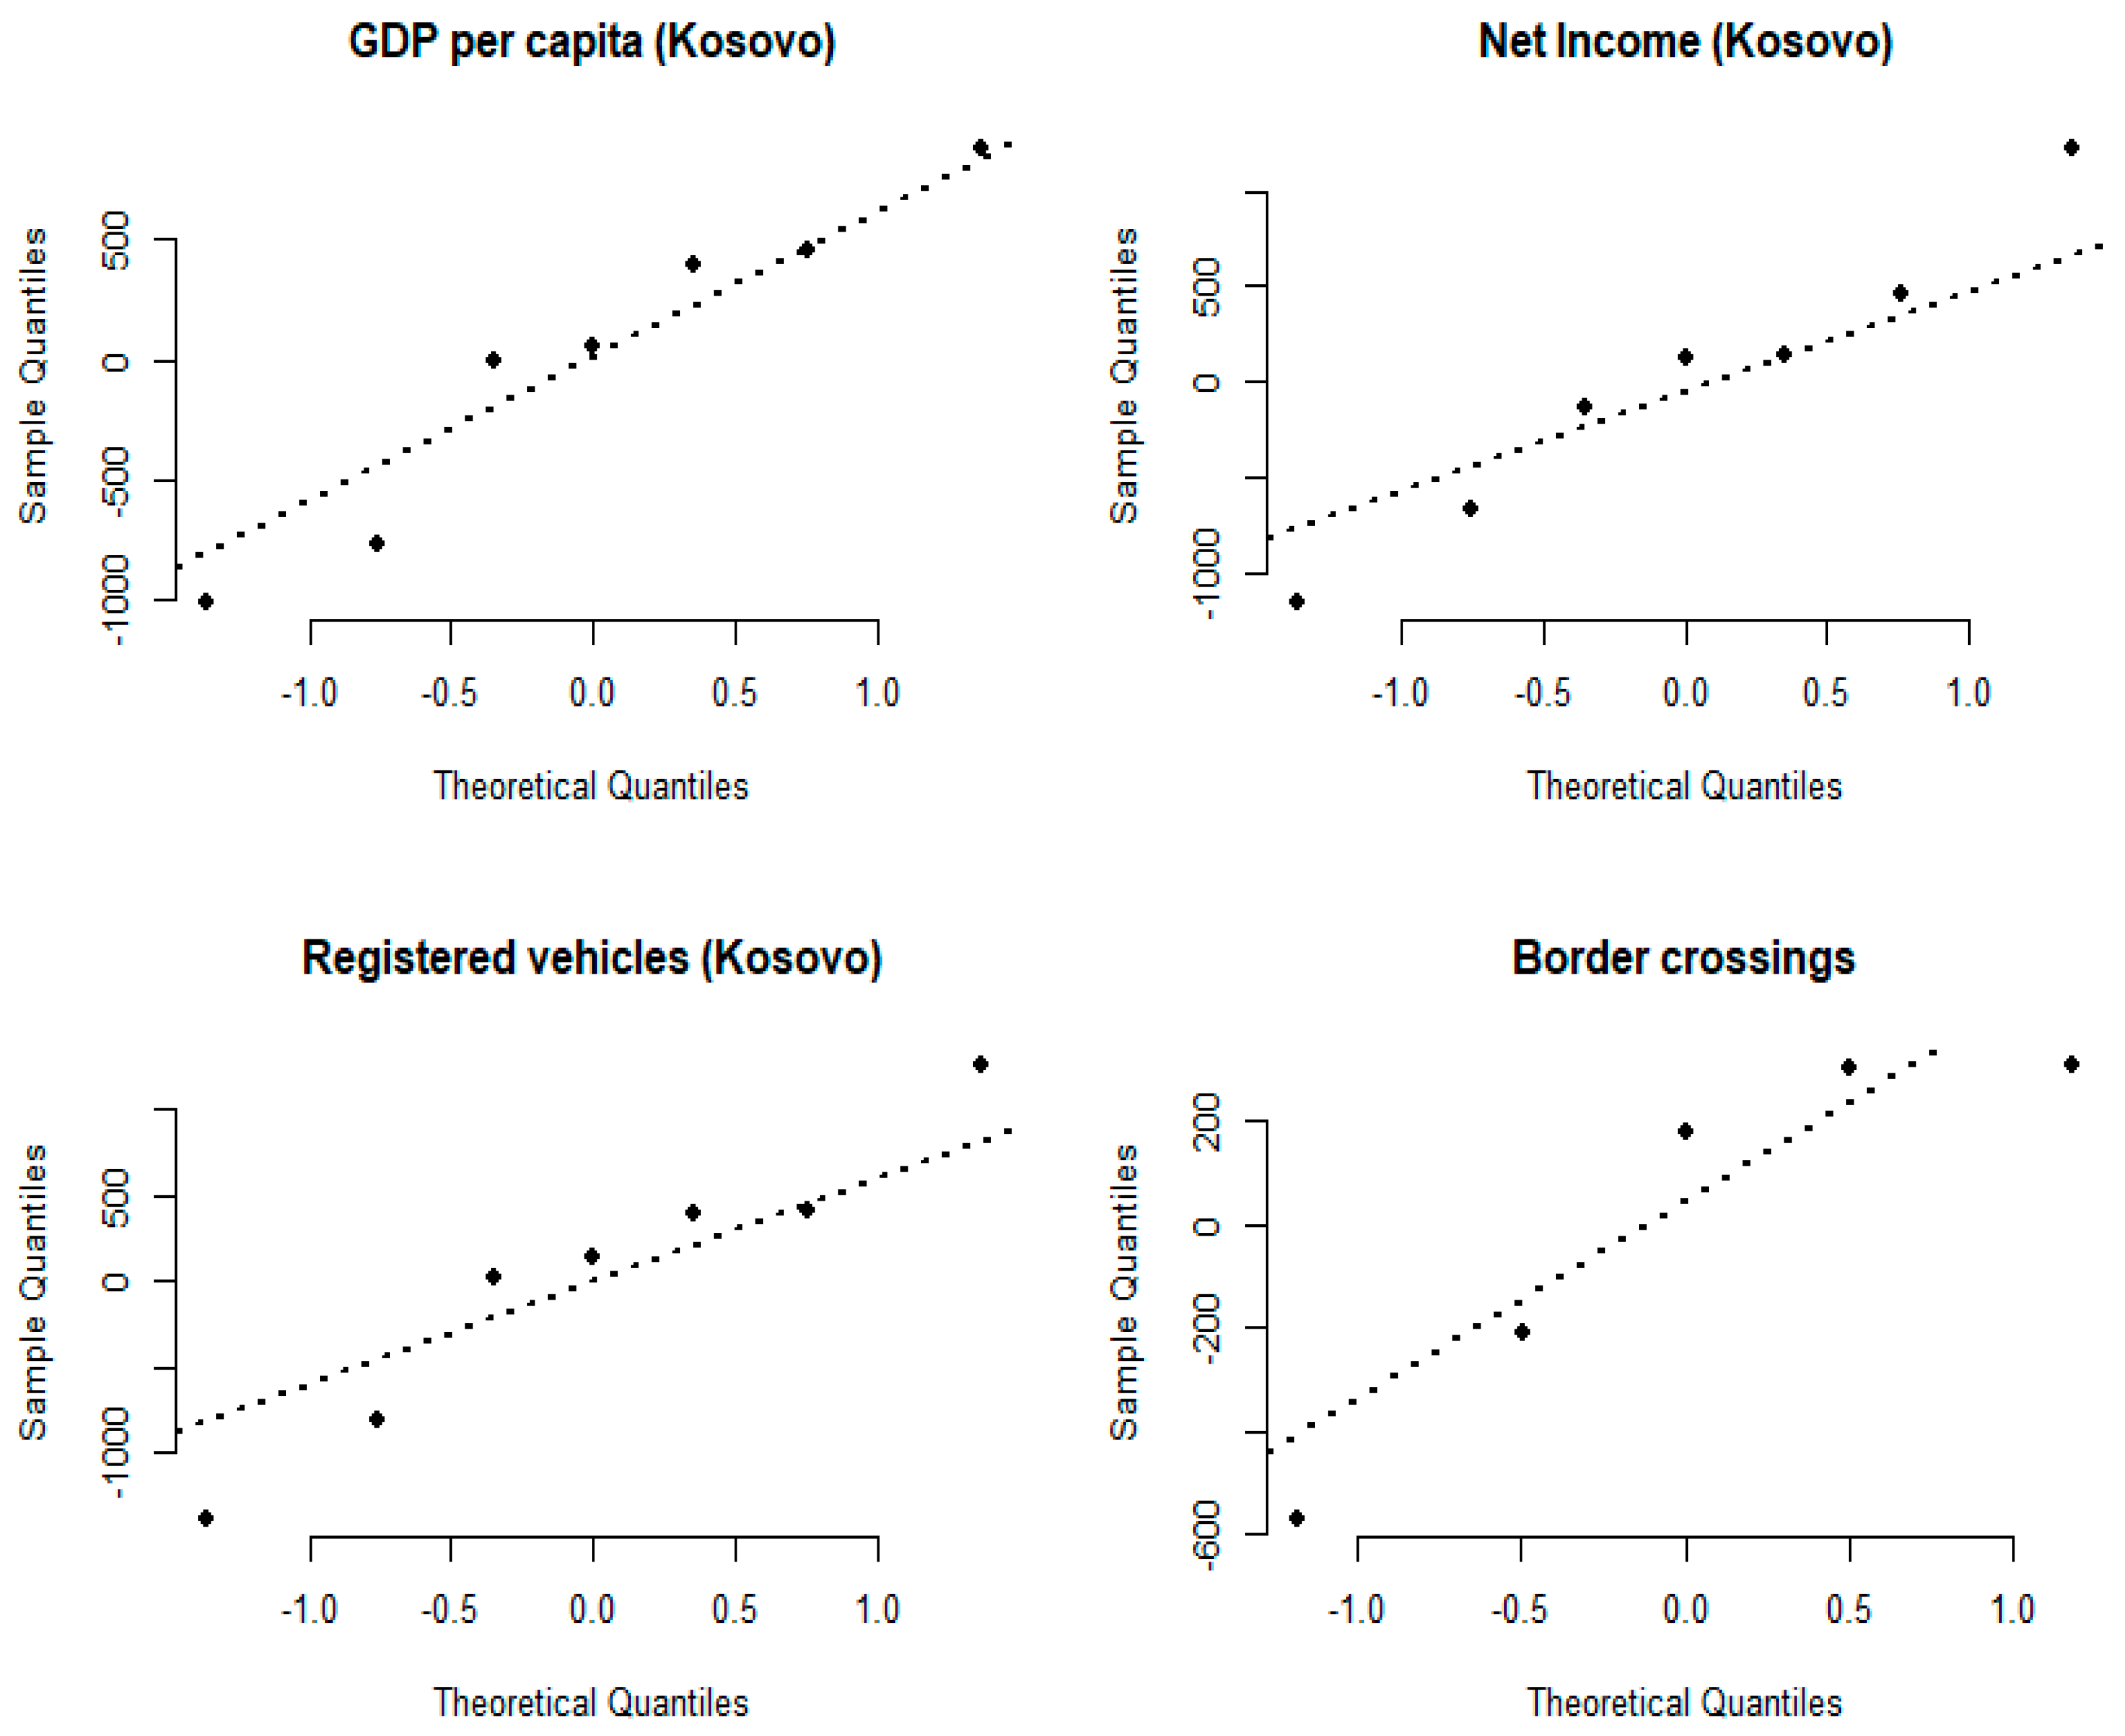
The residuals of the remaining four potential predictor variables were also tested for multivariate normality by performing the Shapiro–Wilk normality test. The results of the Shapiro–Wilk statistics show that all tested variables can be considered normally distributed (
Table 6). The results of the normality test, visualized in the form of comparative quantile–quantile plots are shown on
Figure 2.
Finally, a stepwise forward regression procedure was used to find the optimal formulation of the linear multiple regression model that can be most efficiently used to predict future passenger demand on the observed bus route. In the stepwise forward regression procedure, the last four potential predictor variables that have remained in the input data set were iteratively added to the model equation, starting with those predictors that were judged to be most statistically significant. The threshold p-value for including new variables in the model equation was set at 0.05. At each iteration step, the relevant parameters of model performance were recalculated, including coefficients of determination, adjusted coefficients of determination, Akaike information criterion (AIC) values, root mean square error (RMSE) values, and p-values separately for each included predictor variable and cumulatively for the multiple regression model. The forward regression procedure was stopped at the moment when it was determined that the inclusion of any of the remaining potential predictor variables in the equation of the multiple regression model equation would result in an overly complex or overfitted model.
Based on the stepwise forward regression procedure (
Table 7), it was found that the optimal formulation of the multiple linear regression model includes the population of the Republic of Kosovo and the annual number of Kosovar citizens crossing the Croatian border by bus as the two most statistically significant predictor variables for estimating future passenger demand on the observed bus route.
However, from the summary of results obtained for the proposed multiple regression model presented in
Table 8, it is evident that the coefficient of the second predictor variable (population of the Republic of Kosovo) has a negative value, which means that an increase in population would lead to a lower passenger demand on the observed bus route. Since such a mathematical formulation is obviously not logical, it was necessary to investigate the possible causes of this anomaly.
To gain deeper insight into the possible causes of this anomaly, a detailed trend analysis for the population parameter was conducted. Based on the conducted trend analysis, it was found that there was an occurrence of an irregular disturbance in the population parameter in the period between the years 2019 and 2021, which thus led to a sudden population decline in the Republic of Kosovo.
Therefore, it can be assumed that the most probable cause of this anomaly is that the COVID pandemic that occurred in the same period. Based on this reasoning, we concluded that a logically correct formulation of the multiple regression model can be obtained by replacing the actual values of the two considered predictor variables and of the bus passenger demand output variable, recorded during the COVID pandemic, with corresponding simulated values that would be expected for these variables without the occurrence of COVID pandemic in this period. The corresponding simulated values in the critical period were obtained by using the representative annual growth rates for the considered predictors and the output variable, which were determined based on the trend analysis of historical values of predictors and the output variable, recorded in the period between the years 2015 and 2018.
The comparative plots between the actual (with COVID-19 pandemic) and simulated values (without COVID-19 pandemic) for the two selected predictors and output variable are shown in
Figure 3.
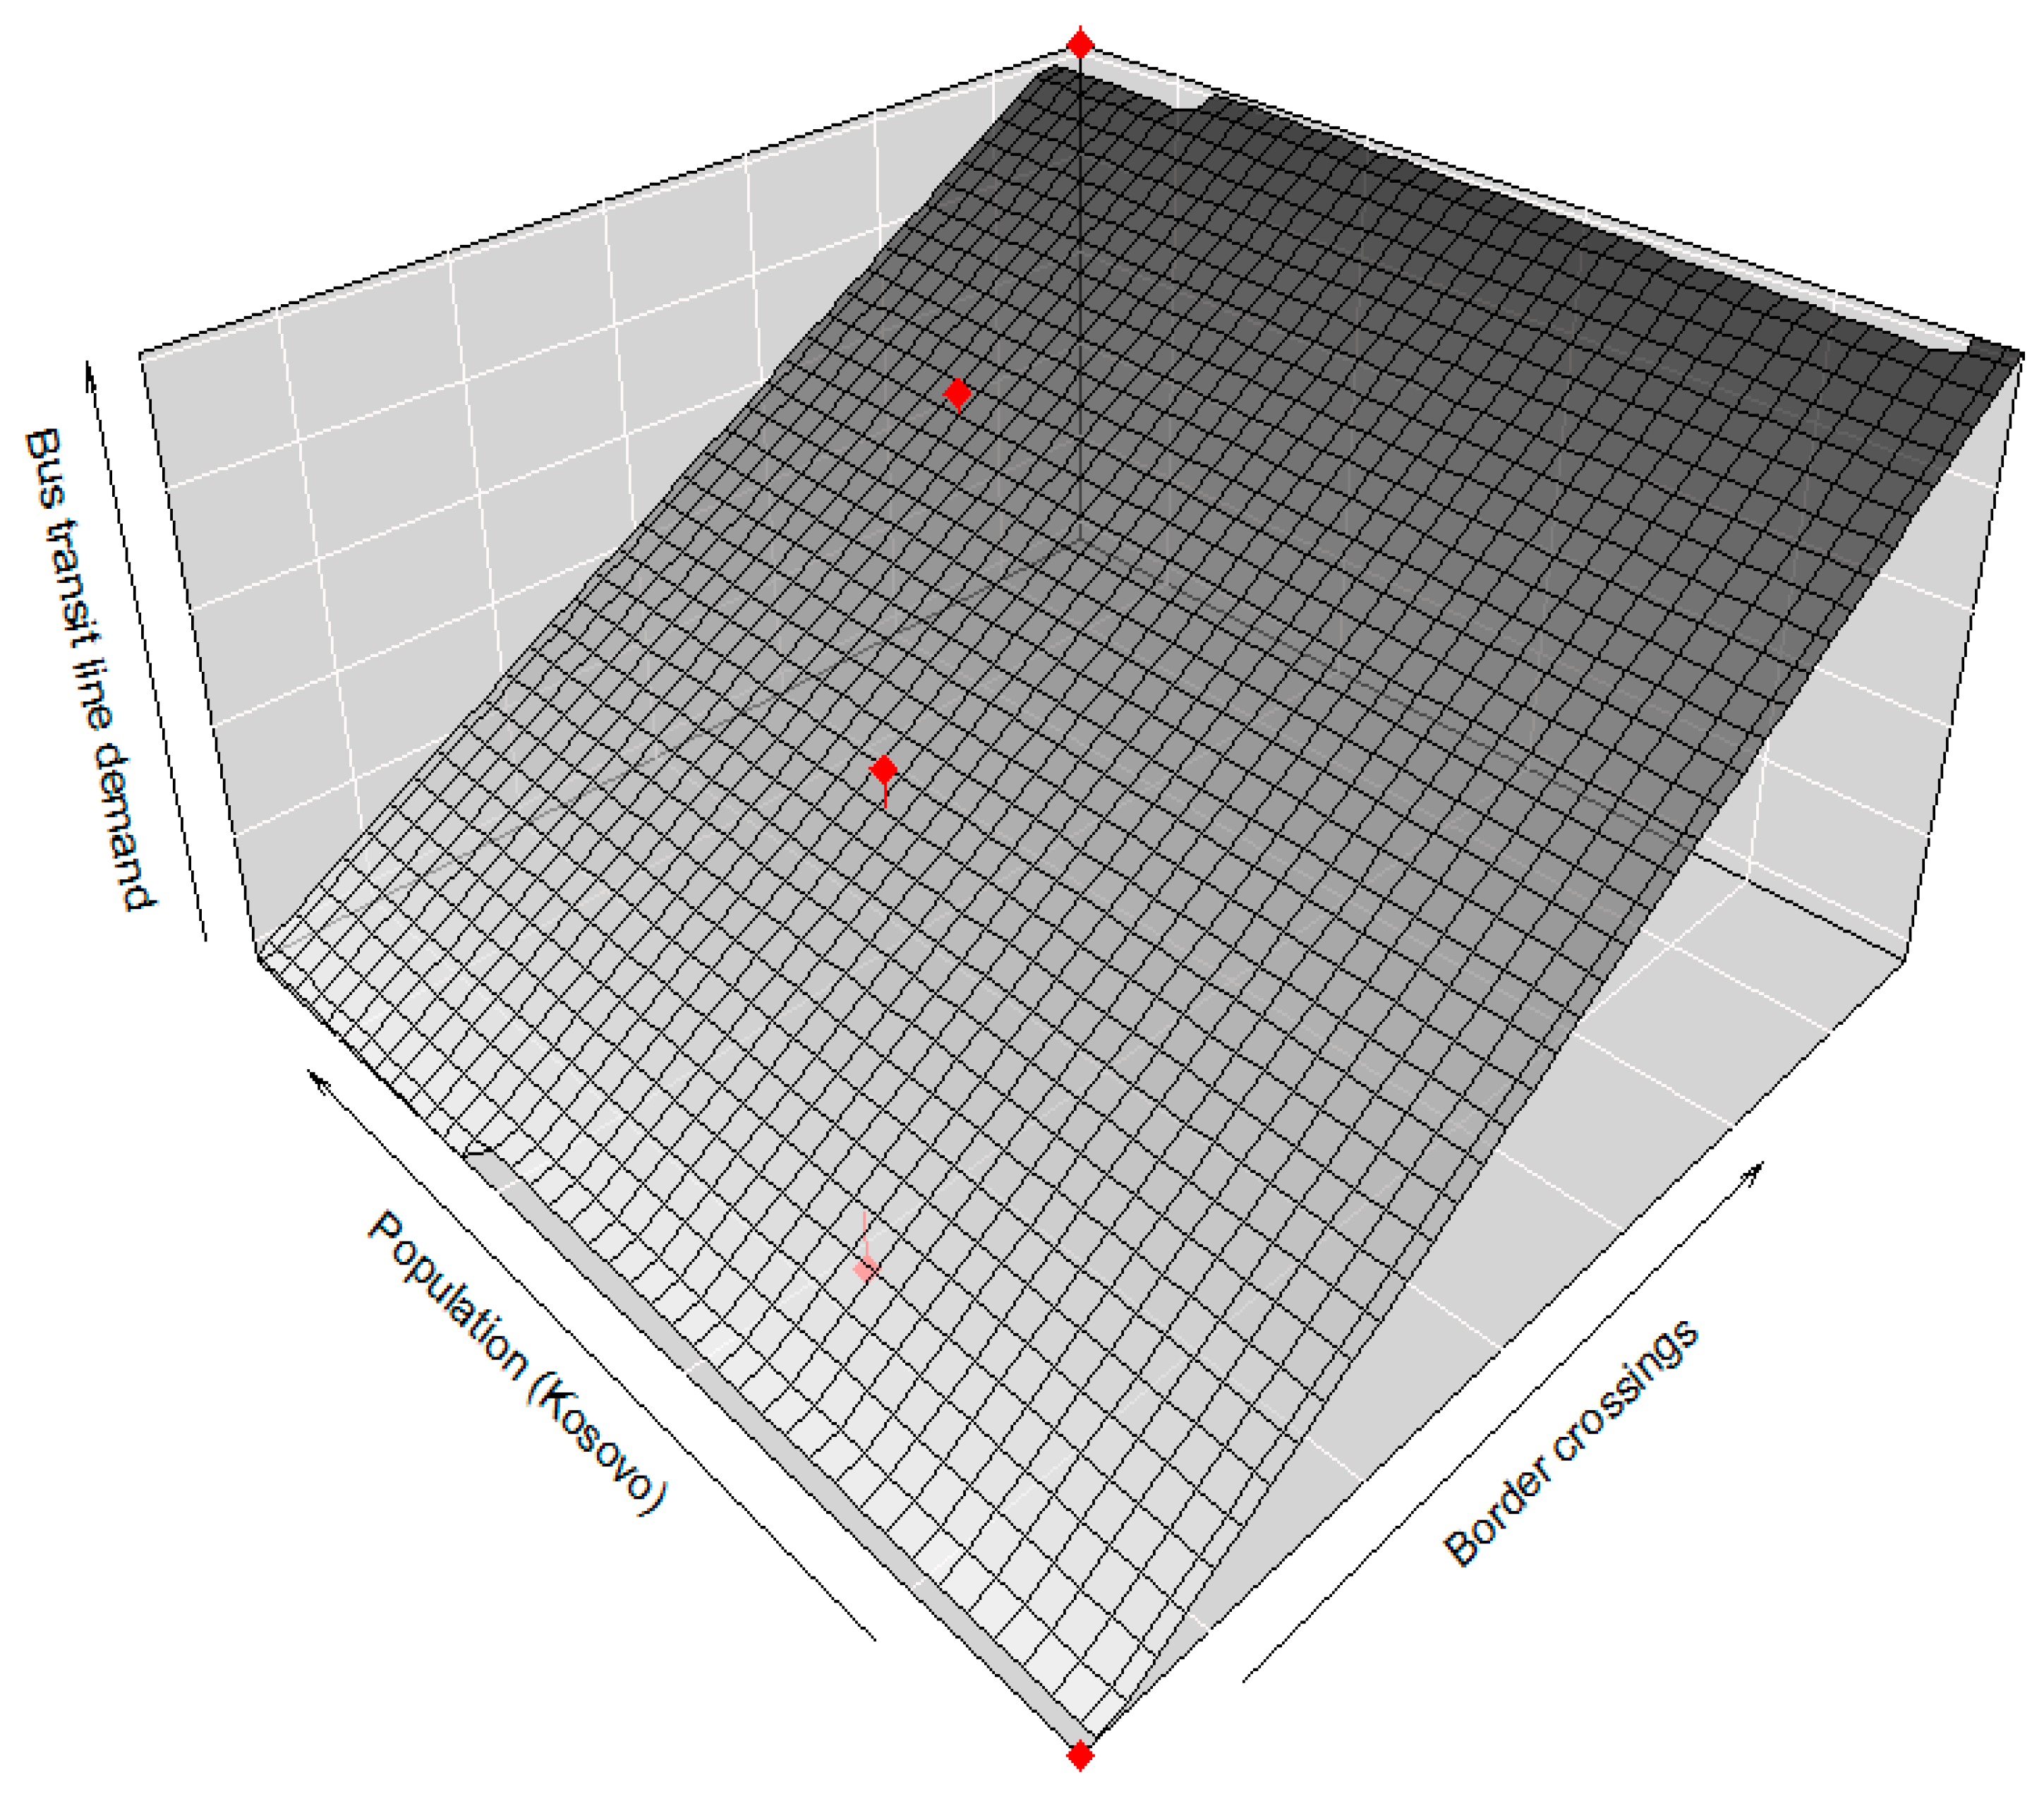
To obtain a new mathematical formulation of the multiple regression model, the simulated values of the observed predictors and output variable were first imported into the Rstudio environment and stored in three data vectors named “PopKosovoSimulated”, “Border-BusSimulated” and “PassengerDemandSimulated”. Finally, the new forecasting model was created by calling the lm() function with a new set of input and output parameters. The detailed output performances of the multiple linear regression model obtained based on the simulated values of the considered predictors and the output variables are shown in
Table 9. The two-parameter regression function of the obtained multiple linear regression prediction model, visualized in the form of a three-dimensional regression plane is presented on
Figure 4.
The future values of two selected predictor variables (population in the Republic of Kosovo and the annual number of Kosovar citizens crossing the Croatian border by bus) required for forecasting the passenger demand on the observed international bus route can be predicted based on the trend analysis. However, more detailed research needs to be conducted in the future to select the optimal types of trend models that can be used to predict the values of these two predictors, as well as any other potential predictor variables that are found to be statistically significant according to the proposed conceptual procedural framework.
5. Conclusions
In the scope of this paper, we have proposed a conceptual procedural framework that can be used in the following two ways: (1) As a guideline for extraction of new statistical indicators from available big data sources and conducting a series of statistical tests necessary for checking the multicollinearity, homoscedasticity, autocorrelation and multivariate normality of each predictor variable that could be potentially be included in the bus passenger demand prediction models, with a goal of identifying the primary (optimal) and alternative mathematical formulations of new bus passenger demand prediction models based on the stepwise multiple regression procedure; (2) as a guideline for the calibration, evaluation and validation of existing bus passenger demand prediction models, in which case statistical tests are conducted for existing predictor variables in order to determine whether the mathematical formulations of these models can be modified to improve their predictive performances.
The proposed conceptual procedural framework was developed based on the data collected from existing public bus service providers on the Prizren–Zagreb international bus route in the period between 2015 and 2021, as well as data on relevant statistical indicators extracted from publicly available big data systems, including the ASKdata platform of the Kosovo Statistical Authority [
1], the World Bank database [
2], the International Monetary Fund World Economic Outlook database [
3] and official big data systems, including the database of the Border Police Directorate of the Croatian Ministry of Interior and the database of Raiffeisenbank Croatia.
The main advantage of using the proposed conceptual procedural framework stems from the ability to identify all statistically significant indicators contained in big data systems, relevant for predicting future passenger demand on international bus routes, as well as the ability to use these indicators to develop numerous different (alternative) mathematical formulations of bus passenger demand prediction models. Other advantages of the proposed conceptual procedural framework include (1) the ability to use additional, more up-to-date statistical data that are not available in traditional data sources; (2) the increased flexibility of the predictive model structure, i.e., the ability to use the proposed procedural framework to dynamically change the structure of big data-based predictive models by adding, removing or replacing individual predictor variables, depending on the quantity and quality of data contained in the available big data systems; (3) the potential to automate all phases of the proposed procedural framework, including the extraction of relevant statistical indicators from available big data systems, the determination of the statistical significance of each considered potential predictor variable and the development of alternative prediction model formulations, which means that new big data-based prediction models could be developed, calibrated and validated in much shorter time intervals than traditional prediction models; (4) reducing the time and costs needed for development of prediction models, since the need for manual input data collection, field and questionnaire surveys that are typically conducted in the process of developing and validating conventional bus passenger demand prediction models would be minimised or eliminated.
Based on the analysis of the original mathematical formulation of the predictive model developed by the proposed conceptual procedural framework, it was found that the coefficient of the second predictor variable (population in the Republic of Kosovo) has a negative value. In order to determine the probable causes of this anomaly, we performed a detailed trend analysis for this variable. From the results of the performed trend analysis, we can conclude that the negative value of the coefficient of the population variable is most likely related to the COVID pandemic between 2019 and 2021, which led to a sudden decrease in the population in the Republic of Kosovo. Therefore, to develop a logically sound multiple regression prediction model, we simulated the expected values of the observed predictors and outcome variables in a hypothetical scenario without the COVID pandemic. The calibrated mathematical formulation of the multiple linear regression prediction model obtained based on the simulated values of the observed predictors and output variables shows positive coefficients for both observed predictor variables and is therefore consistent with the assumption that the negative coefficient of the population variable obtained in the original mathematical formulation of the prediction model is related to the COVID pandemic. However, more detailed studies need to be conducted in the future to gain a better understanding of this anomaly.
Here, it is also important to emphasize that the linear multiple regression model presented in this paper is based on the analysis of a limited sample of statistical indicators that could be extracted from the big data systems that, to the best of the author’s knowledge, were available at the time of the research, and due to this fact, it can only be used for approximate prediction of future passenger demand on observed bus route. Therefore, the mathematical formulation of the multiple linear regression model presented in this paper should be considered only as an example solution obtained based on the proposed conceptual procedural framework, i.e., not as a final, definitive formulation of the model that can be used to predict future passenger demand on an observed bus route.
In order to develop a more general form of predictive models that could be used to forecast passenger demand on various bus routes, future research needs to include a more detailed analysis of potential big data sources that could be used to expand the sample of statistical indicators considered for modelling bus passenger demand. Future research should also focus on the development of an algorithm based on the defined conceptual procedural framework that would automate data extraction, partial regression analysis and stepwise regression, as well as all procedural steps related to statistical tests used for checking the multicollinearity, homoscedasticity, autocorrelation and multivariate normality of predictor variables. This algorithm should be integrated into the software with a user-friendly interface that could be used by various stakeholders for the simple and rapid development and testing of new bus passenger demand prediction models and/or for the calibration, evaluation and validation of existing prediction models.


