Article

Blue Carbon: Comparison of Chronosequences from Avicennia marina Plantation and Proteresia coarctata Dominated Mudflat, at the World’s Largest Mangrove Wetland

1
Jindal School of Environment and Sustainability, O.P. Jindal Global University, Sonipat 131001, Haryana, India
2
Ecological Restoration Laboratory, Department of Environmental Science & Engineering, Indian Institute of Technology (ISM), Dhanbad 826004, Jharkhand, India
3
Jindal School of Liberal Arts and Humanities, O.P. Jindal Global University, Sonipat 131001, Haryana, India
4
School of Public Policy, Indian Institute of Technology, Hauz Khas, New Delhi 11066, Delhi, India
5
Integrated Sustainability Centre, Institute for Global Environmental Strategies, 2108-11, Kamiyamaguchi, Hayama, Kanagawa 240-0115, Japan
*
Author to whom correspondence should be addressed.
Sustainability 2023, 15(1), 368; https://doi.org/10.3390/su15010368
Submission received: 11 October 2022 / Revised: 20 December 2022 / Accepted: 20 December 2022 / Published: 26 December 2022

Abstract

:
Sundarban is the world’s largest contiguous mangrove forest but is under threat from anthropogenic interventions. Plantations are the favored method to restore degraded mudflats. In this study, ecological functional soil indicators (available N, soil organic C, available P, salinity) and service (Blue carbon pool) of the iteroparous tree Avicennia marina (Forssk.) Vierh. (Acanthaceae family), plantation has been compared with a natural mudflat dominated by mangrove semelparous grass Proteresia coarctata (Roxb.) Tateoka (Poacease family). Both sites were under anthropogenic pressure. It was observed that the P. coarctata dominated natural site has gone through fluctuations in species population between 2012 and 2016 with higher Simpson’s dominance, and lower value of the Shannon–Weiner Index. A one-way Analysis of Variance (ANOVA), Principal Component Analysis (PCA), indicated that soil indicators have significantly varied and linearly increased across the years at the A. marina plantation site. Blue carbon pool increased by four times (10 cm soil depth) at the plantation site since 2012 compared to only one time in the mangrove grass dominated community within the study period (2012–2016). This study concludes that plantation with iteroparous mangrove species can improve ecosystem function and services at degraded mudflats dominated by semelparous grass and aid in achieving the Sustainable Development Goal 13 (Climate action).

1. Introduction

Mangroves are specialized plant groups capable of growing and proliferating in tidal impacted coastal, deltaic, estuarine or island habitats with morphological, anatomical and physiological adaptations to survive in saline, anoxic soil (physiologically dry soil). These plants use to dominate the sub-tropical/tropical mudflats across 123 nations. Coastal regions, the favored habitat of mangroves, are under serious threat of over-exploitation, land conversion and deforestation due to ever-increasing population pressure [1,2]. UN Sustainable Development Goal (SDG) 13 focuses on sequestration of carbon to direct the work towards a green future. Blue carbon is a ‘miracle cure’ for the global disease of climate change, due to its immeasurable capacity to sequester CO2 from the atmosphere and ‘lock’ it indefinitely in the saline coastal wetlands. Hence, globally mangrove restoration is gaining popularity as a major tool to achieve SDG-13 goal.
Mangroves are almost the miracle pill in our war against climate change. Conference of Parties Glasgow (COP 26) has highlighted the concerns surrounding global climate change and resulted in treaties between countries to curb emission deforestation. As per past research, mangroves and sea grass ecological communities are highlighted as major carbon sinks [3,4,5]. As the plants can sequester disproportionally high concentrations of carbon in their rhizosphere in comparison to their biomass, the soil-sequestered carbon in a mangrove or seagrass ecosystem is popularly referred to as ‘blue carbon’ [3]. Mangrove plantation and restoration of degraded mudflats are less investigated yet effective ways to fight against climate change [5]. Mangroves render several ecosystem services such as ecosystem-based disaster risk reduction and acting as a shield against natural disasters, which is vital for the cyclone/storm surge vulnerable tropical/sub-tropical coastlines [6,7].
Sundarban is the world’s largest contiguous mangrove forest shared by India and Bangladesh. The Indian part of Sundarbans also houses an approximate human population of 4.6 million as per last census (2010-11). A total of 54 out of 102 islands in Indian Sundarbans are under human habitation, where mangroves had been cut down and replaced by agricultural lands or aquaculture farms. The rest of the islands are under mangrove cover, conserved and home to the enigmatic mangrove-dwelling tigers. Recent studies indicate that salinity rise due to climate change has been impacting the community ecology across Sundarbans [8]. Salinity has been impacting the local extinction of key mangrove pioneer species such as Heritiera fomes Banks (Malvaceae) [8]. In the Bangladesh Sundarbans, salinity is also driving species such as white mangrove, Avicennia marina (Acanthaceae), to dominate over the mangrove metapopulations across Sundarbans. Community involvement and participation are vital in managing mangrove plantations as is evident from recent studies [9]. Mangrove species grow in zonations respective to the environmental stress drivers but a succession pattern is not visible in these forests [10]. Proteresia coarctata (Poaceae), grows more in areas under inundation stress, where the entire mudflats along with the plants get inundated completely during high tide while A. marina grows in levels that show partial inundation of the plant during high tide [10]. Sundarban has been under severe anthropogenic as well as climate change-related stresses which have been reported to be influencing the ‘blue carbon’ sink of the mangroves [4]. Recent research indicated that an approximate 6,313,944 mg/6.31Tg loss of Carbon has been recorded at Sundarbans between 1975 and 2020 [4]. Thus, restoration of the degraded ecosystem is required to manage this pressing ecological issue. In recent years, restoring the degraded mudflat has been popular across the region as an effort to conserve the mudflats, protect the embankments from disaster hazards and maximize blue carbon sequestration [5].
Mangrove areas have been under serious threat across the globe. Research by Cano-Ortiz et al. indicated that mangrove degradation caused impairment of key ecological service at the Mesocaribea biogeographic region in Central America [11]. Basáñez-Muñoz et al., projected the impact of industrialization on reduction of mangrove tree cover and density at the Southwestern Gulf of Mexico [12]. Blue carbon ecosystems have a global distribution of around 36-185 million hectares and conserve around 33 billion tonnes of carbon along with providing a multitude of ecosystem services [13]. Research by Macreadie et al. also opined that protecting existing blue carbon ecosystems will effectively reduce global emissions by 304 Tg CO2 equivalent per annum and advocated restoration, as it can remove an additional 841 Tg CO2 equivalent per annum by 2030 [13]. Hence, restoration initiatives are being promoted across the globe, particularly in the mangrove areas along with conservation interventions. Indonesia has the highest area under mangrove cover and 22% of this region has been conserved; that is responsible for 0.82–1.09 PgC hectare−1 of carbon capture [14]. Research by Gulliver et al., indicates that if mangrove wetlands are converted to any other land use, it reduces the overall blue carbon sequestration. Whereas a recovered mangrove patch at southeastern Australia has sustained a high C-sequestration rate of 0.54 tons C ha–1 year–1 [15]. Study by Jimenez et al., elucidates that organic matter and soil carbon is found to be more in mature mangrove plantations at restoration sites at northeast Brazil [16].
Ecosystem functions in a mangrove wetland can be monitored through basic soil indicator parameters such as Available N (Av N), Available P (Av P), Soil organic carbon (OC), salinity/electrical conductivity (EC) and Bulk density (BD). A healthy ecosystem will improve upon its key ecosystem service, which is the blue carbon pool, in the case of mangrove wetlands. Stress facilitates the proliferation of stress-sensitive semelparous species that maximize their reproduction and proliferation instead of changing the microenvironment of their habitat to restore ecological functional indicators. These species are eighter annual or seasonal and are more sensitive to environmental fluctuations than iteroparous species such as trees.
There has been an initiative to restore the degraded mudflat with salinity tolerant and fast-growing A. marina in the year 2012. The focal hypothesis being tested through this research is, ‘restoration with mangrove tree species can increase the ecological functions and services in comparison with a mudflat naturally dominated by mangrove grass’. This study investigates the changes in ecological service (blue carbon sequestration) in this restored mudflat, conserved by the local community, in comparison with the mudflat dominated by mangrove associate grass P. coarctata between 2012 and 2017.

2. Material and Method
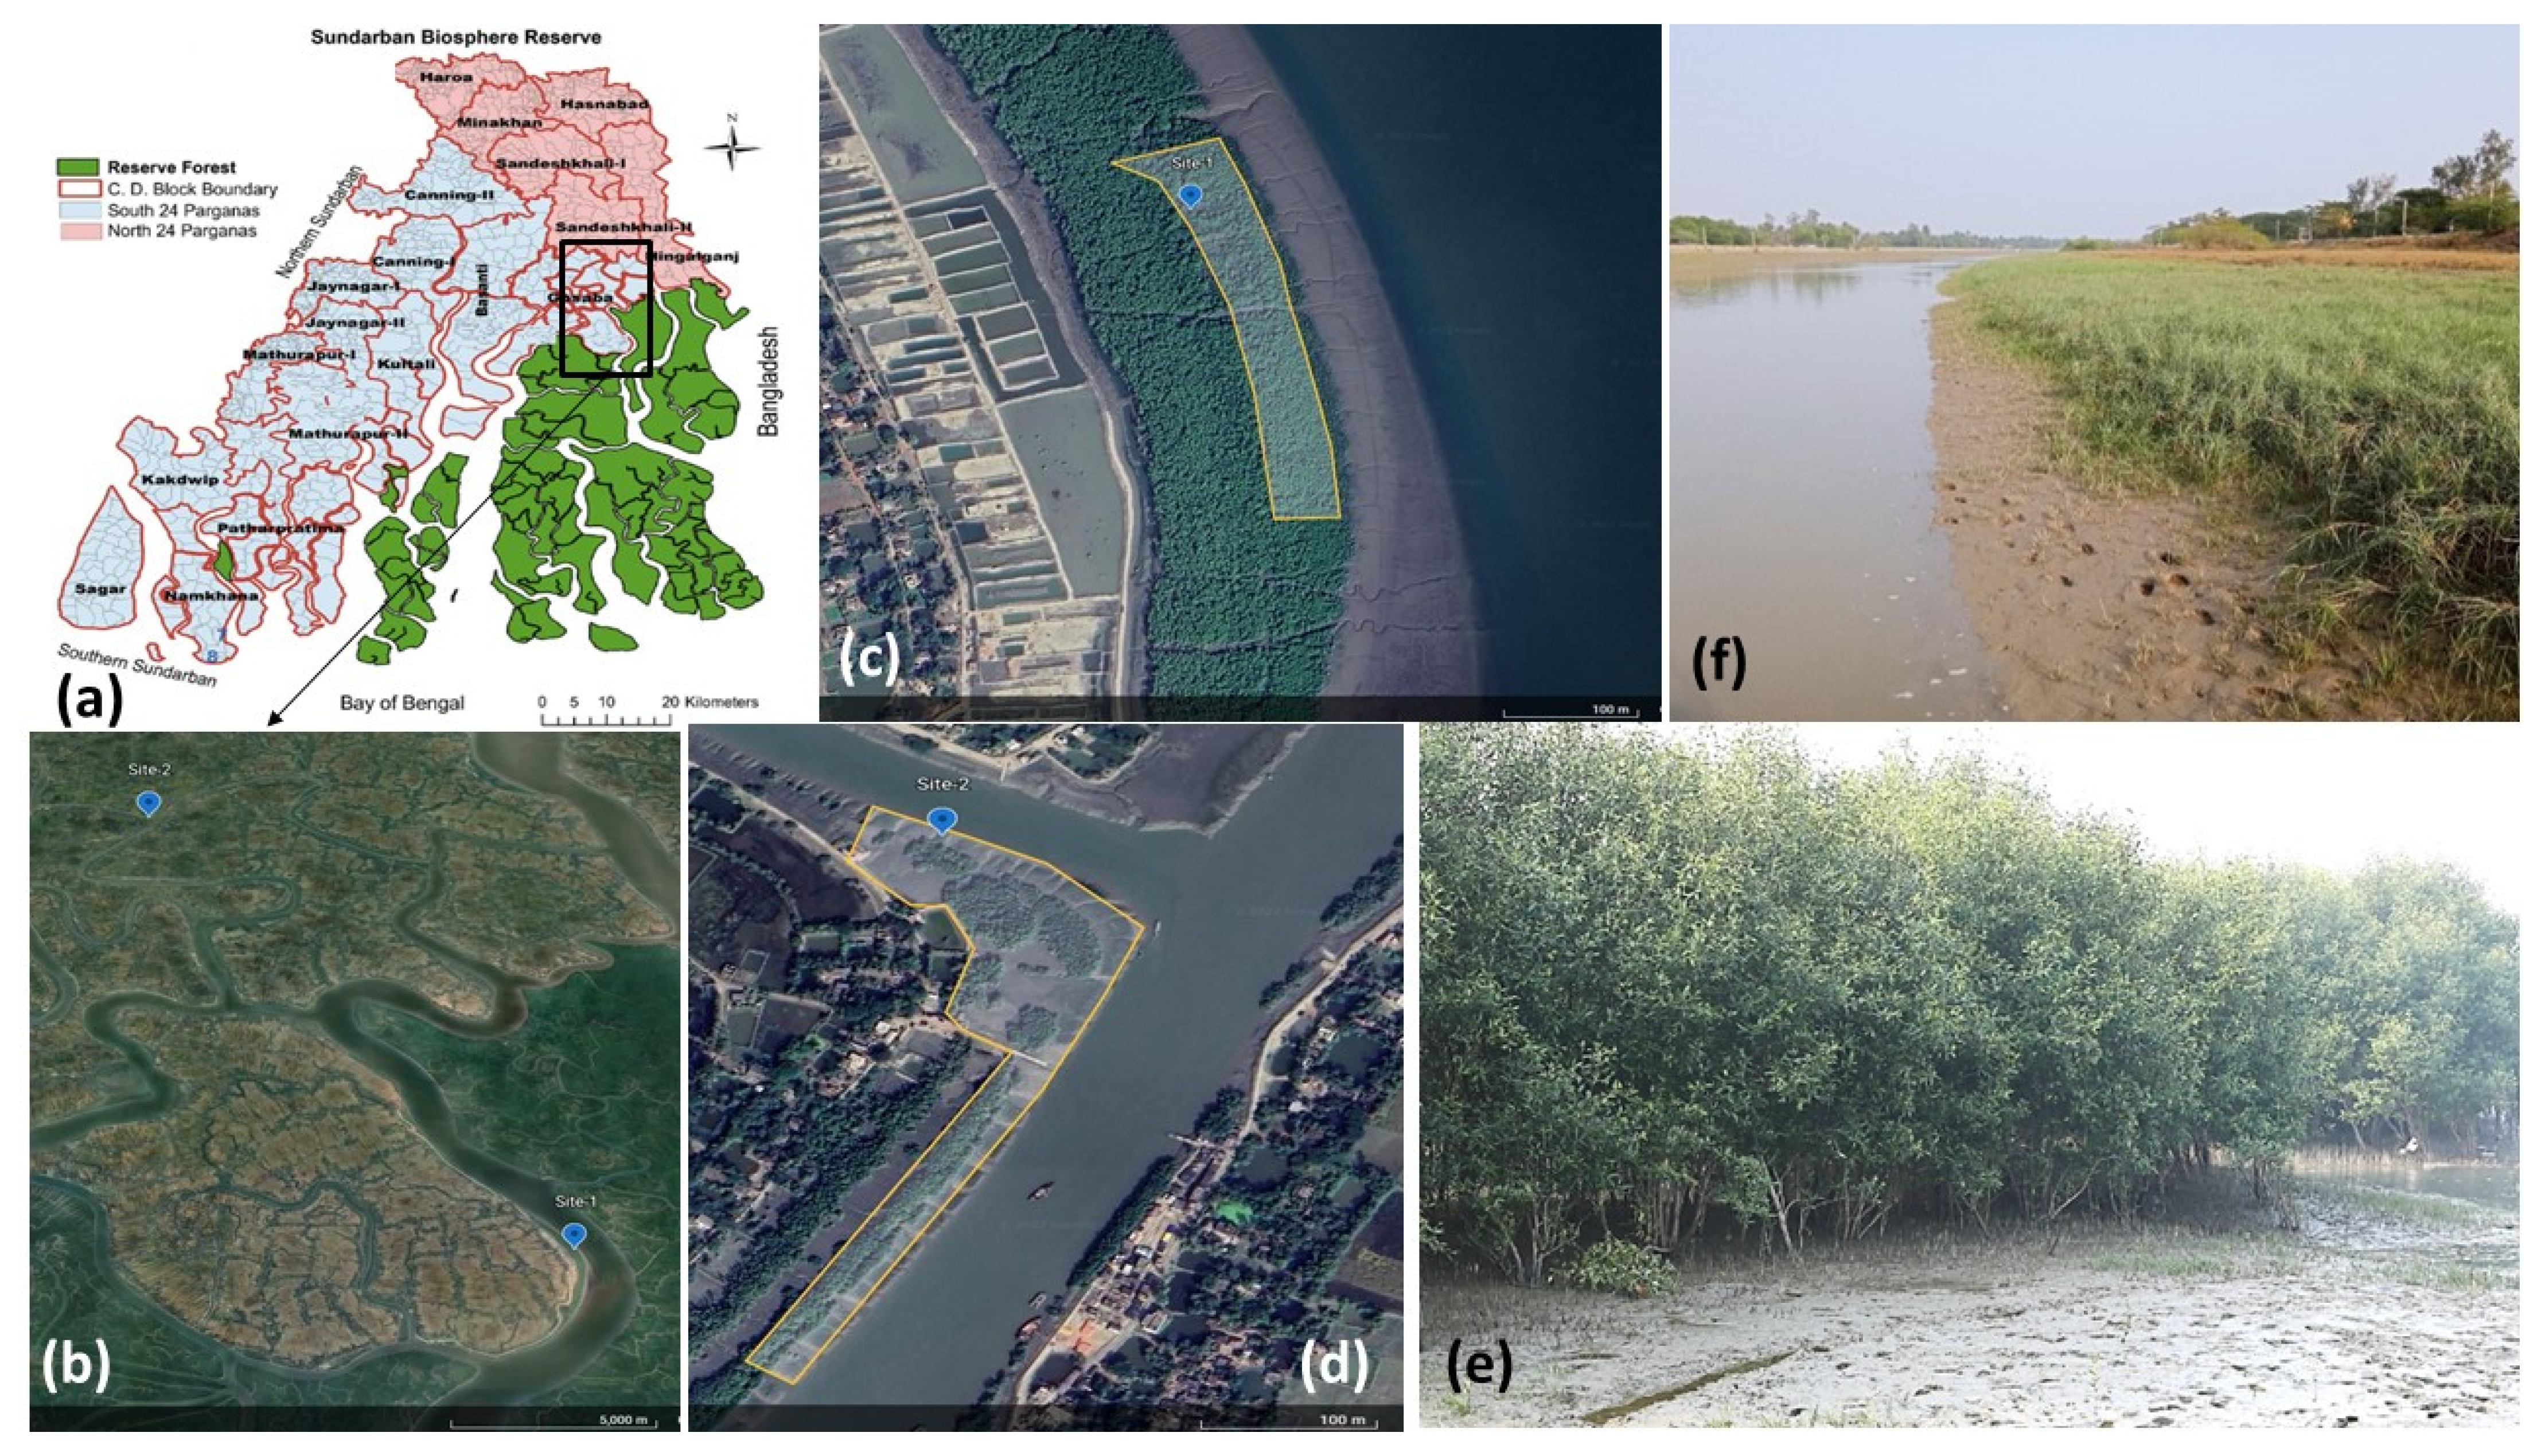
2.1. Study Site

The study area has been selected at different parts of Indian Sundarbans with different forest/plantation types. Site-1 was restored with A. marina seeds in 2012 after clearing the P. coarctata grass that naturally colonized this mudflat. The mudflat for the plantation was selected at the eastern corner of Satjelia island (the last habitable island at Indian Sundarbans). Site-2, a natural patch dominated by mangrove grass, P. coarctata was identified in 2012 near Chotomollakhali revenue village and monitored until 2016. Ecological function and service indicators such as Av N, Av P, OC, and blue carbon pool were monitored yearly in both Site-1 and Site-2. While Site-1 has been restored through plantation activities, Site-2 was kept out from any restoration intervention. Both the sites selected were near to the human habitation areas. Hence, the anthropogenic intervention effect on the experiment and data was the same for both sites. The study areas have been depicted in Figure 1.

2.2. Community Participation in the Restoration Activity

The community residing near the plantation site (Site-1) has been organized in a group-based structure named as Primary Committee for Forest Conservation (PCFC). Each group consists of 15 members who committed to protecting the plantation site for the entire duration of the project (2012–2017).

2.3. Plantation, Monitoring and Assessment Strategy

Site-1: conservation tillage was employed during plantation, which implies that minimum tillage was performed before seeding. Seeds were collected through a net during the monsoon and stored in sacks. Each sac holds 2000 propagules. During plantation, only a small dent in the mudflat was made after which the seeds were implanted in the soft mudflat [6].
Site-2: A controlled plot with about 80% mudflat covered with mangrove grass-Proteresia coarctata. In November 2012 to 2017 (Post-monsoon) surveys were conducted in the plot to assess the natural changes in the biodiversity status of the plots. As this site devoid of human intervention or plantation program, the community ecology of the mangrove metapopulation was liable to change under natural influences. Hence, there has been a need for yearly biodiversity assessments in the area. Five quadrat plots (10 m × 10 m) were randomly set in the site each year, and the average individual of the recorded species was used to assess the biodiversity.
The species diversity of the sites was assessed through Relative density and Frequency as per previous research on community ecology at Indian Sundarbans.
Relative density is an estimate of the numerical strength of a species in relation to all the individuals of all the species defined as:
R e l a t i v e   D e n s i t y   ( D ) = N u m b e r   o f   i n d i v i d u a l s   o f   a   s p e c i e s N u m b e r   o f   i n d i v i d u a l s   o f   a l l   t h e   s p e c i e s × 100
The distribution or dispersion of an individual species is generally estimated as percentage occurrence and is defined as:
F r e q u e n c y   ( % ) = N u m b e r   o f   q u a d r a t s   t h e   s p e c i e s   o c c u r e d T o t a l   n u m b e r   o f   q u a d r a t   s t u d i e d × 100
Both the estimators give an idea of the status of a particular species in relation to the whole community which is used in this study to understand the changes in distribution of the plants.

2.4. Soil Sampling and Analyses

Soil sampling was done within the plot each year from 2012 to 2017. The general soil texture was assessed before commencement of the plantation activity in 2012 and detailed in Table 1 [17]. Acid washed trowel was used to scoop out the soil from the upper surface of the mudflat (0-10 cm). The sample was collected in three replicate subsamples which were further mixed and homogenized to prepare a composite soil sample. The collected soil samples were placed in plastic bags and labelled before being brought to the laboratory. Samples were air-dried at room temperature (25–30 °C) before being sieved with a 2 mm sieve and represented in Table 1.
OC was determined through the wet digestion method and reported as a percentage [18]. While preparing reagents for analysis of OC, 5 g Ag2SO4/L of H2SO4 is added before the use of H2SO4 to minimize the interference of Cl- in the saline mangrove soil [5]. Bulk density was calculated through the standard method [17].
Soil pH was measured by a multiparameter pH probe (HI-2020, Hanna Instruments, Navi Mumbai, India) by making suspension with deionized water (1:2.5, w/v) and after allowing to settle for one hour [11]. Plant-available nitrogen (N) was estimated after digesting the samples with 0.32% KMnO4 solution followed by titration with 0.02 N H2SO4 using Kjeldahl distillation unit (KJELODIST-EAS VA, Pelican Equipment Inc., Chennai, India) [19]. Plant-available Phosphorus was determined by the Olsen method [20].
Carbon pool (0–10 cm) was calculated using % OC concentration, bulk density, and particular soil depth [21] as follows:
Carbon pool (Mg C ha− 1) = % OC × BD × T
where % OC = soil organic carbon (%); BD = bulk density (g cm− 3), and T = soil thickness (cm).

2.5. Assessing Health of Mangrove Ecosystem

‘Dominance’ estimator that focuses on overall dominance of one or group of species in a α- diversity space. The reciprocal of the dominance estimator is the ‘Diversity’ value. However, these estimators are generally biased to the most dominant species in an ecosystem. Hence, information-statistic indices are used to quantify the ‘entropy’ or ‘randomness’ in a community, which shed light onto the overall health of a natural ecosystem (Site 2).
For understanding dominance, ‘Simpson’s Index of Dominance (D)’ is used which is [22,23],
D = i = 1 s n ( n 1 ) N ( N 1 )
Simpson’s Index of Diversity (L) is [22,23],
L = 1 D
The Shannon Diversity Index (H) shed light into the overall diversity and health of the ecosystem depicted as [24],
H = i = 1 s piLn   pi  
In the equations, D = Simpson’s Index of dominance, L = Simpson’s Index of Diversity, H’ = Shannon’s Index, n = Number of individuals of each species ( s ) , N = Total number of individuals of all the species, pi = Total number of individuals in each species/Total number of individuals in all the species [24].

2.6. Statistical Tests

Statistical treatment has been applied in Microsoft Excel 2007 and SPSS 16 (SPSS Inc. Chicago, IL, USA). The regression analysis has been used to understand the trends in temporal changes in salinity regime and biodiversity. The standard error is used to understand the reliability of the data. The variance of the mean (n = 3) has been evaluated by Analysis of Variance (one-way ANOVA), followed by Duncan’s post hoc test after testing the dataset for the application of these statistics using the Shapiro–Wilk’s and Levene’s tests. ANOVA tests the differences in the mean of parameters between the years. The major consideration for applying ANOVA is the assumption of ‘Normality’ and ‘Homogeneity’ of the dataset. The Shapiro–Wilk’s test is used in descriptive statistics to ascertain the normal distribution of the data while Levene’s test indicates the homoscedasticity of the dataset. The samples were analyzed in triplicates, hence for each site and year three sample records were used to compute the ANOVA results.
Multivariate statistics in the form of Principle Component Analysis (PCA) have been applied to reduce the data size and to draw effective analysis from the dataset. Prior to PCA, the data were tested by Kaiser–Meyer–Olkin (KMO) and Bartlett’s Test of Sphericity to get an outlook on effectiveness of using the statistics. The KMO score was around 0.7 (for Site-1 soil parameters) and Bartlett’s Test of Sphericity was significant. Hence, PCA was applied. It was followed by orthogonal rotation (Varimax rotated matrix) with a plot with the most significant extracted components.

3. Results and Discussion

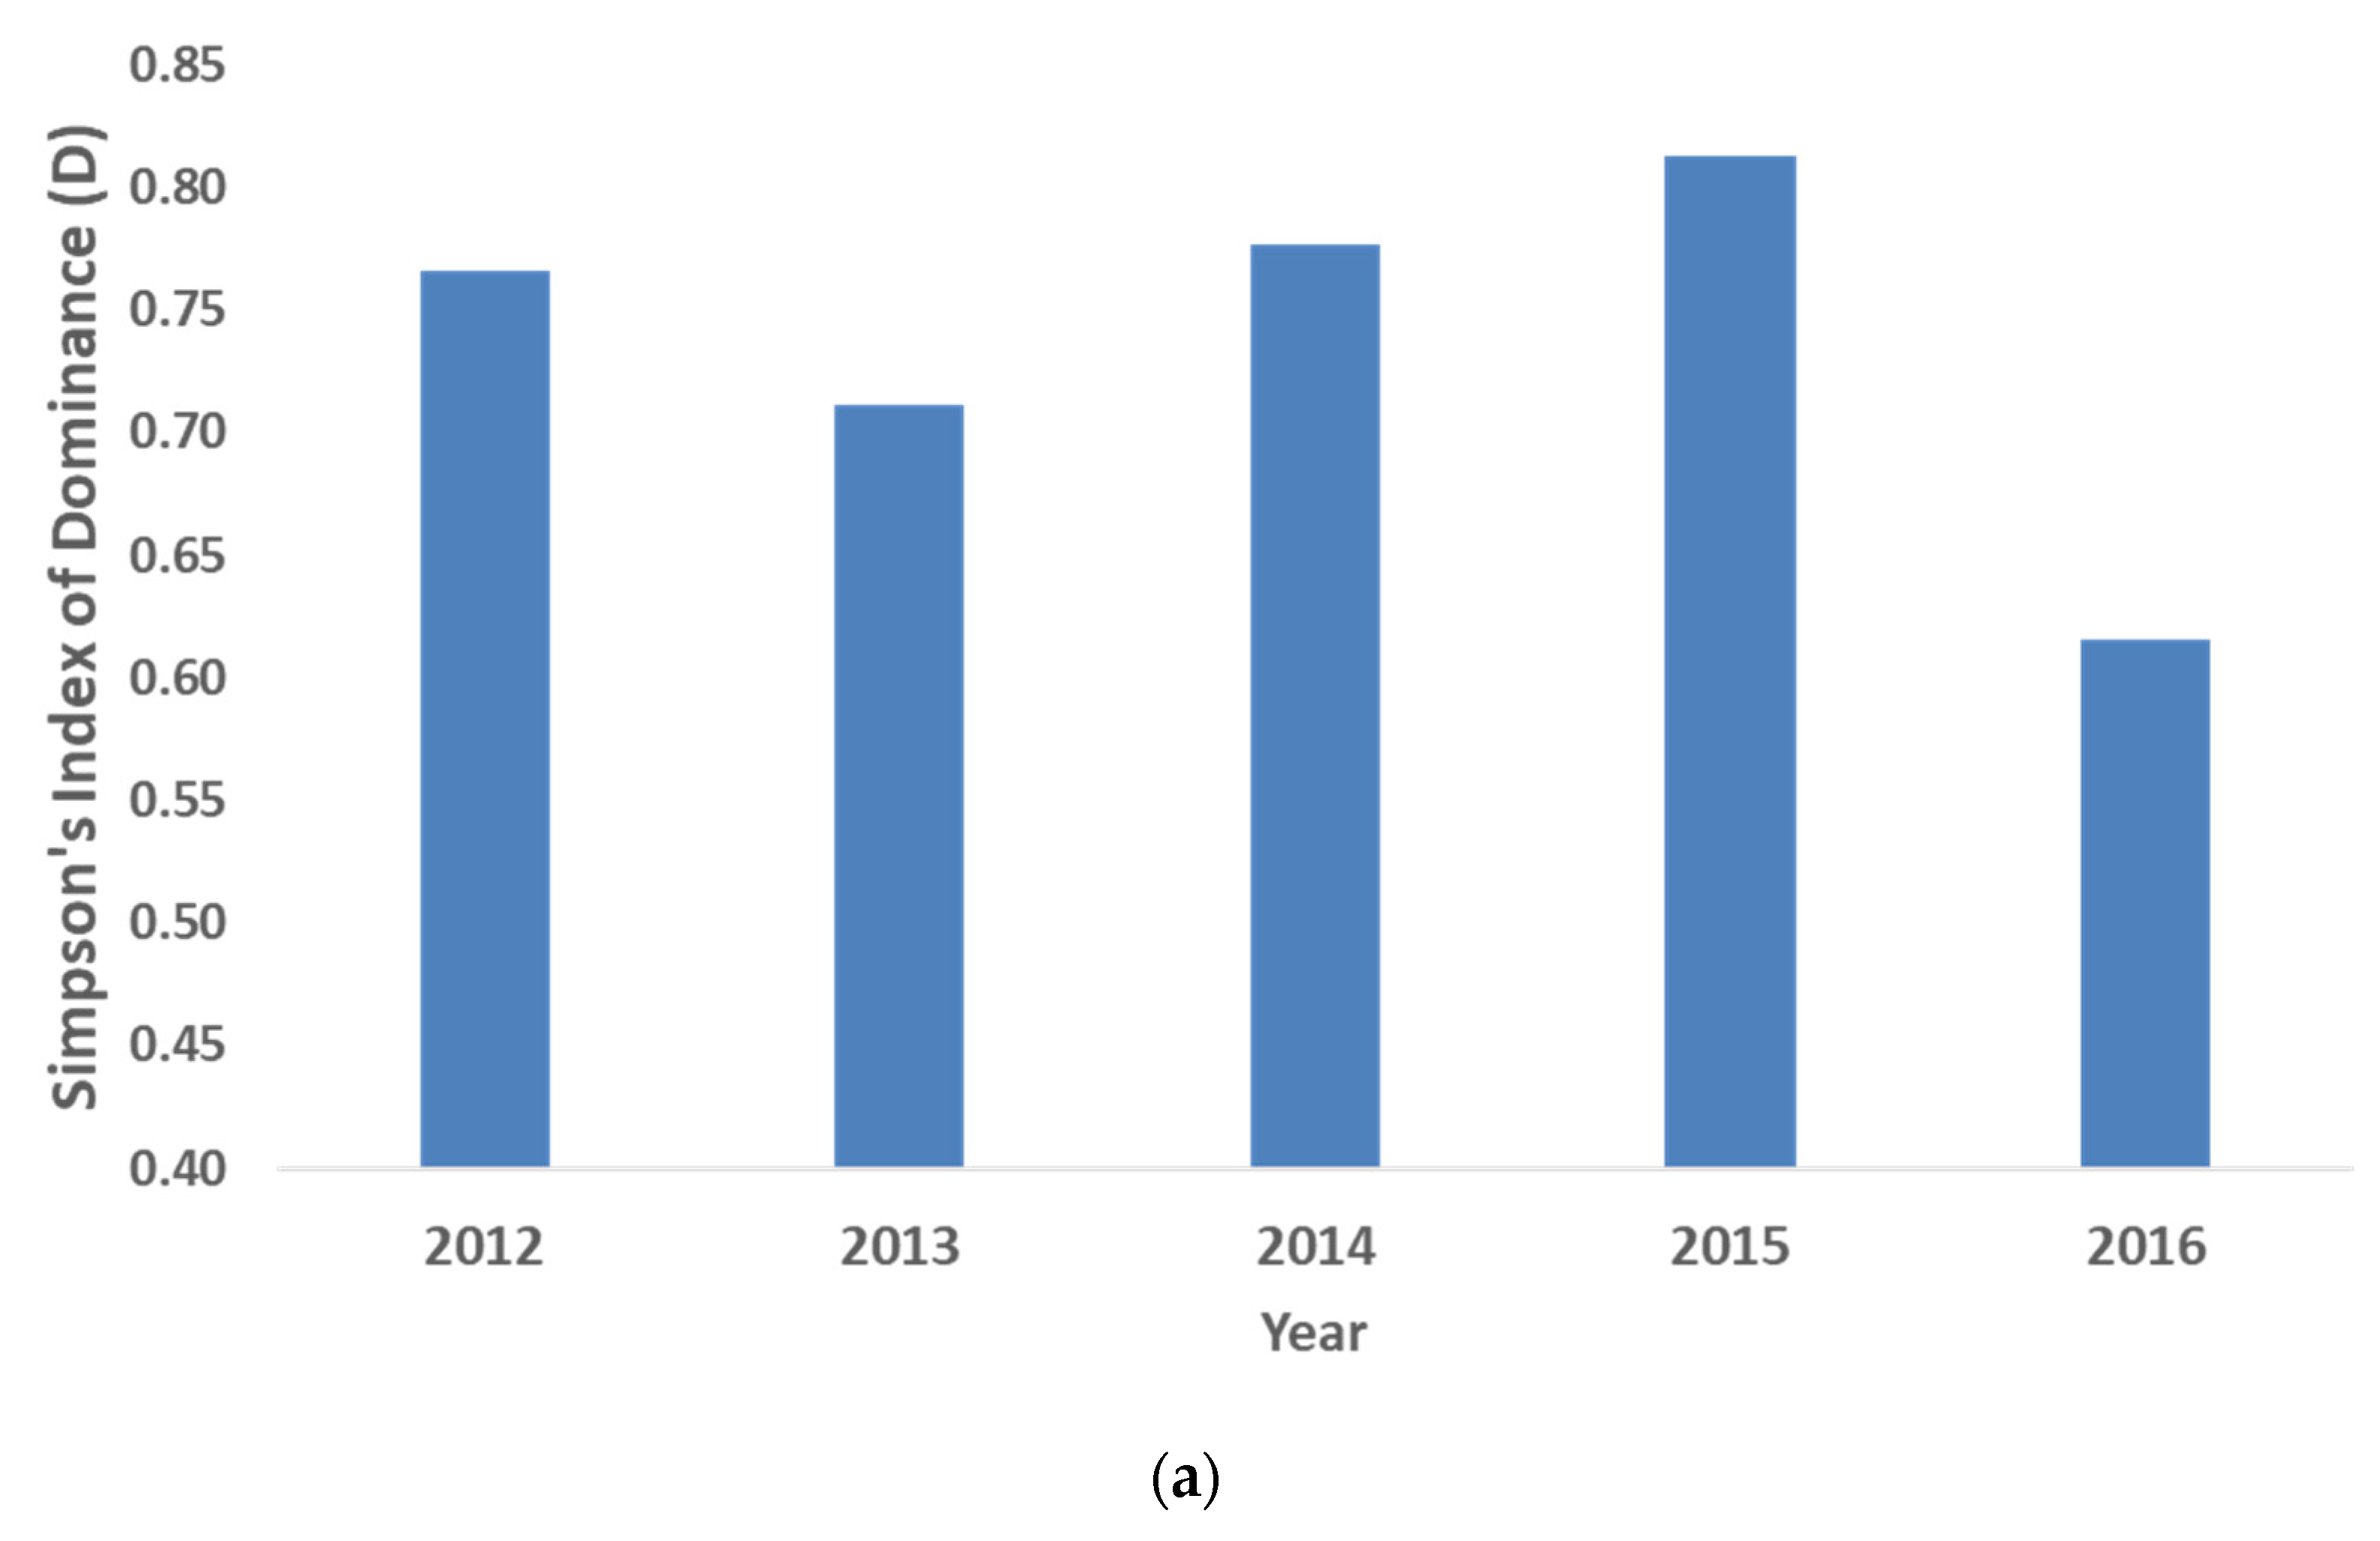
3.1. Changes in Mangrove Community Ecology

The biodiversity assessment at Site-2 indicates a change in some species over the years (Table 2). Quadrats of 10 m × 10 m were laid randomly in the study site as per the standard ecological estimation method, to minimize biases in sampling. A similar method was also used by similar studies on mangrove biodiversity assessment across the globe [1,25,26,27]. However, the dominant species has been the mangrove grass-P. coarctata (Relative density-78–88) and a frequency of 100 as observed between 2012–2016. This indicates that the mudflat was dominated by mangrove grass. It has been observed that mangrove grass slows down colonization by other species due to its extensive coverage and fibrous root system that extends such as a mat in the surface mud. Only resilient species can establish in a P. coarctata dominated mudflat or after a natural disaster. A. marina, is a dominant species in the region with scatted metapopulation across the human inhabited islands as well as the reserve forest fringing Satjelia island [10]. There have been instances of rising salinity across the region and A. marina have the adaptability to survive in this changing water salinity regime [28,29,30]. The mode of propagation for mangroves is to shed the propagules (partially matured while attached to the mother plant-viviparous germination) in the tidal waters and get established in mudflats after the tides recede. Hence, more A. marina metapopulations indicate more propagules that can float in Site-2 and colonize. Still, the Relative density of A. marina ranged between 2 and 8 but with frequency ranging between 40 and 80. High frequency indicates that the species was observed in most of the sampled quadrats showing a higher chance of colonization in the later period. Acanthus ilicifolius L. is a mangrove associate which frequents mudflats of Indian Sundarbans. In Site-2, the relative density of the species ranged between 2 and 12 with a frequency range of 60–100. Mangrove palm, Phoenix paludosa Roxb. (Arecaceae) is the edaphic sub-climax species in the mangrove forest of Sundarbans [1]. In the site, the relative density of the species ranged between 2 and 5 with a frequency of 40–80, showing low distribution. The site remained dominated by P. coarctata between 2012 and 2016 with about 76% Relative density in 2016.
The health of the ecosystem has been evaluated with Simpson Index of Dominance (D), Diversity (D’), Shannon–Weiner Index and depicted in Figure 2.
Site-2 showed a variation in ecological health with random events disruptive to the community composition. The high dominance of P. coarctata and low diversity have been indicating a stress in the ecosystem. The Shannon–Weiner Index ideally should range between 1.5 and 3.5. However, due to the impact of environmental or anthropogenic stresses, ecosystems showed lower values of ‘H’ [31]. This substantiates an unhealthy ecosystem with high entropy (randomness) that has been impacting the community ecology. A local extinction cycle was observed for salinity sensitive, S. caseolaris. Mangroves at Sundarbans do not show any zonation as previously assumed. Ellison et al. 2000, have substantiated through research at Bangladesh, part of Sundarbans, that biodiversity changes in the region has been due to random colonization, other drivers and the ‘a priori’ qualitative assumption that zonation lacks any scientific rationale [32]. A possible driver for dominance of P. coarctata can be attributed to geological reasons (age of sediment deposition, erosion/deposition cycle) or ecological (proximity of other P. coarctata community), which require further research investigation.
Site-1 shows an establishment of A. marina and minimum colonization by other species. A. marina is a salt-tolerant species that grow fast in these mudflats [1]. It creates a mat of root in the upper surface of the mudflats with negatively geotropic pneumatophores that hinder the colonization or establishment of propagules of other species. Community members have tended to the plantation, which reduced the incidences of the destruction of saplings due to goat grazing or trampling by fisher folks using the site regularly. This may be the reason behind the more than 90% dominance of A. marina in the intervention area of Site-2. The survival rate of the plants planted in 2012 is around 70%. The 30% mortality may be because of the initial overcrowding of saplings leading to competition for space, sunlight and nutrient availability.

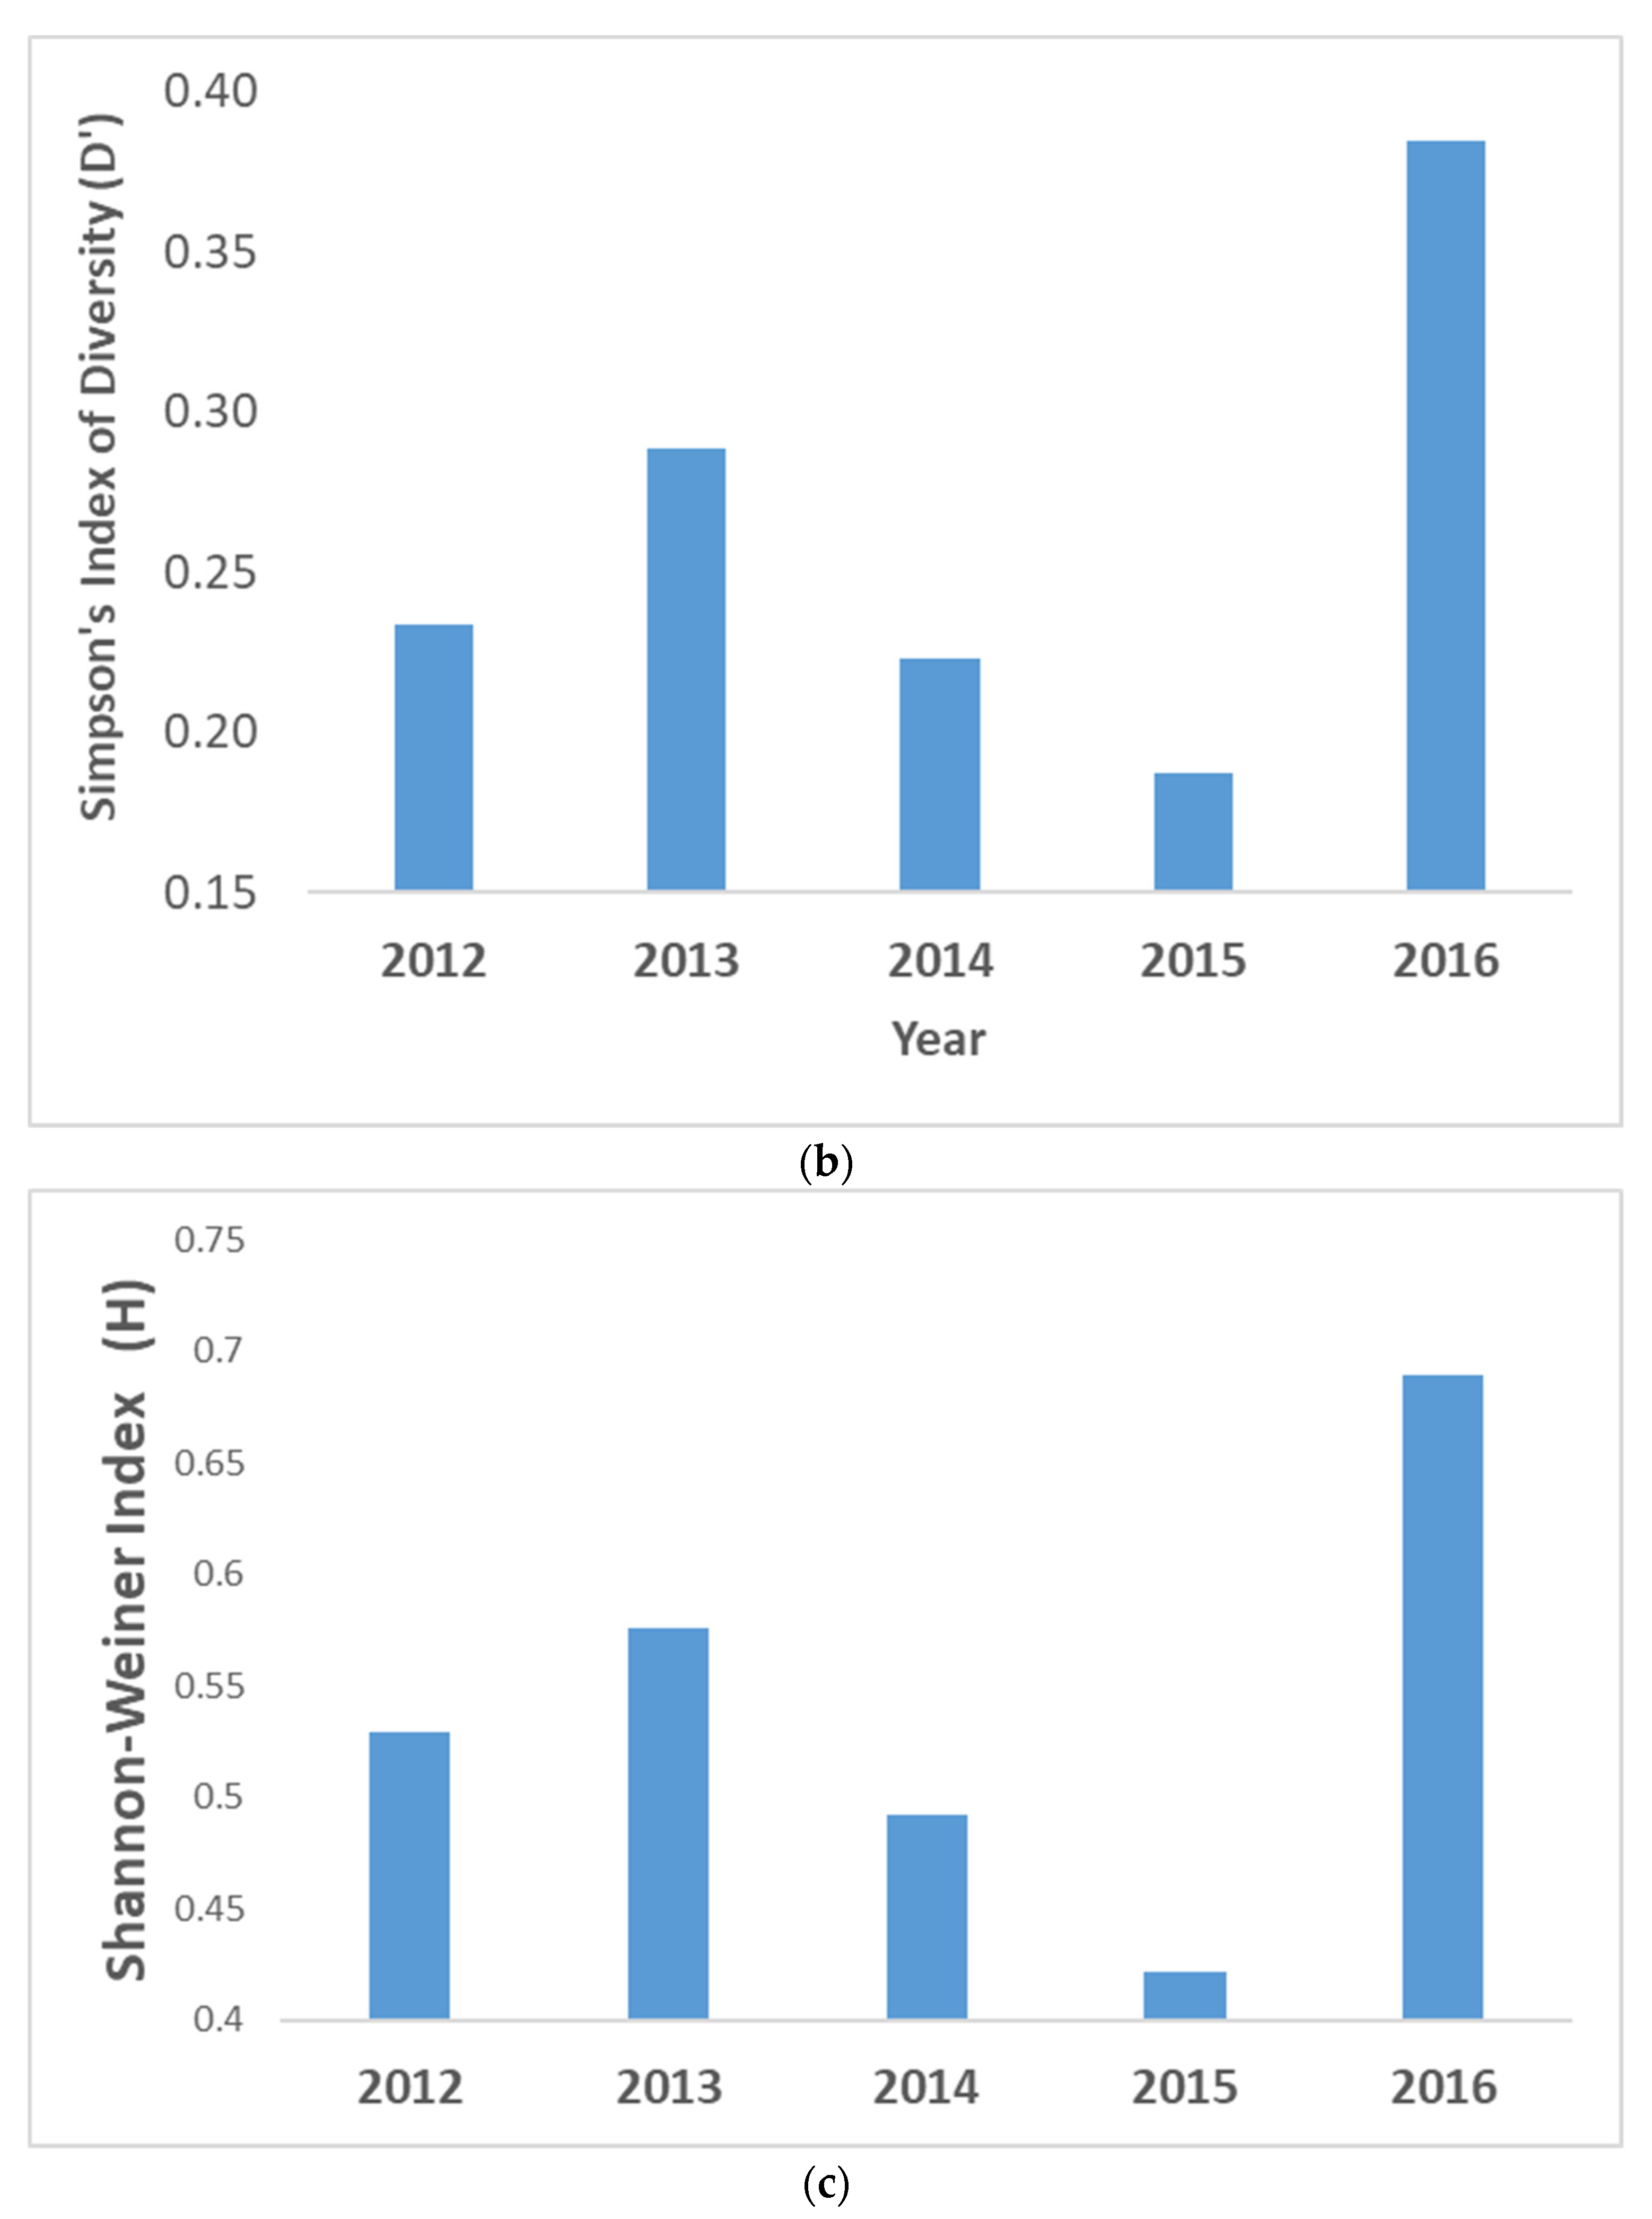
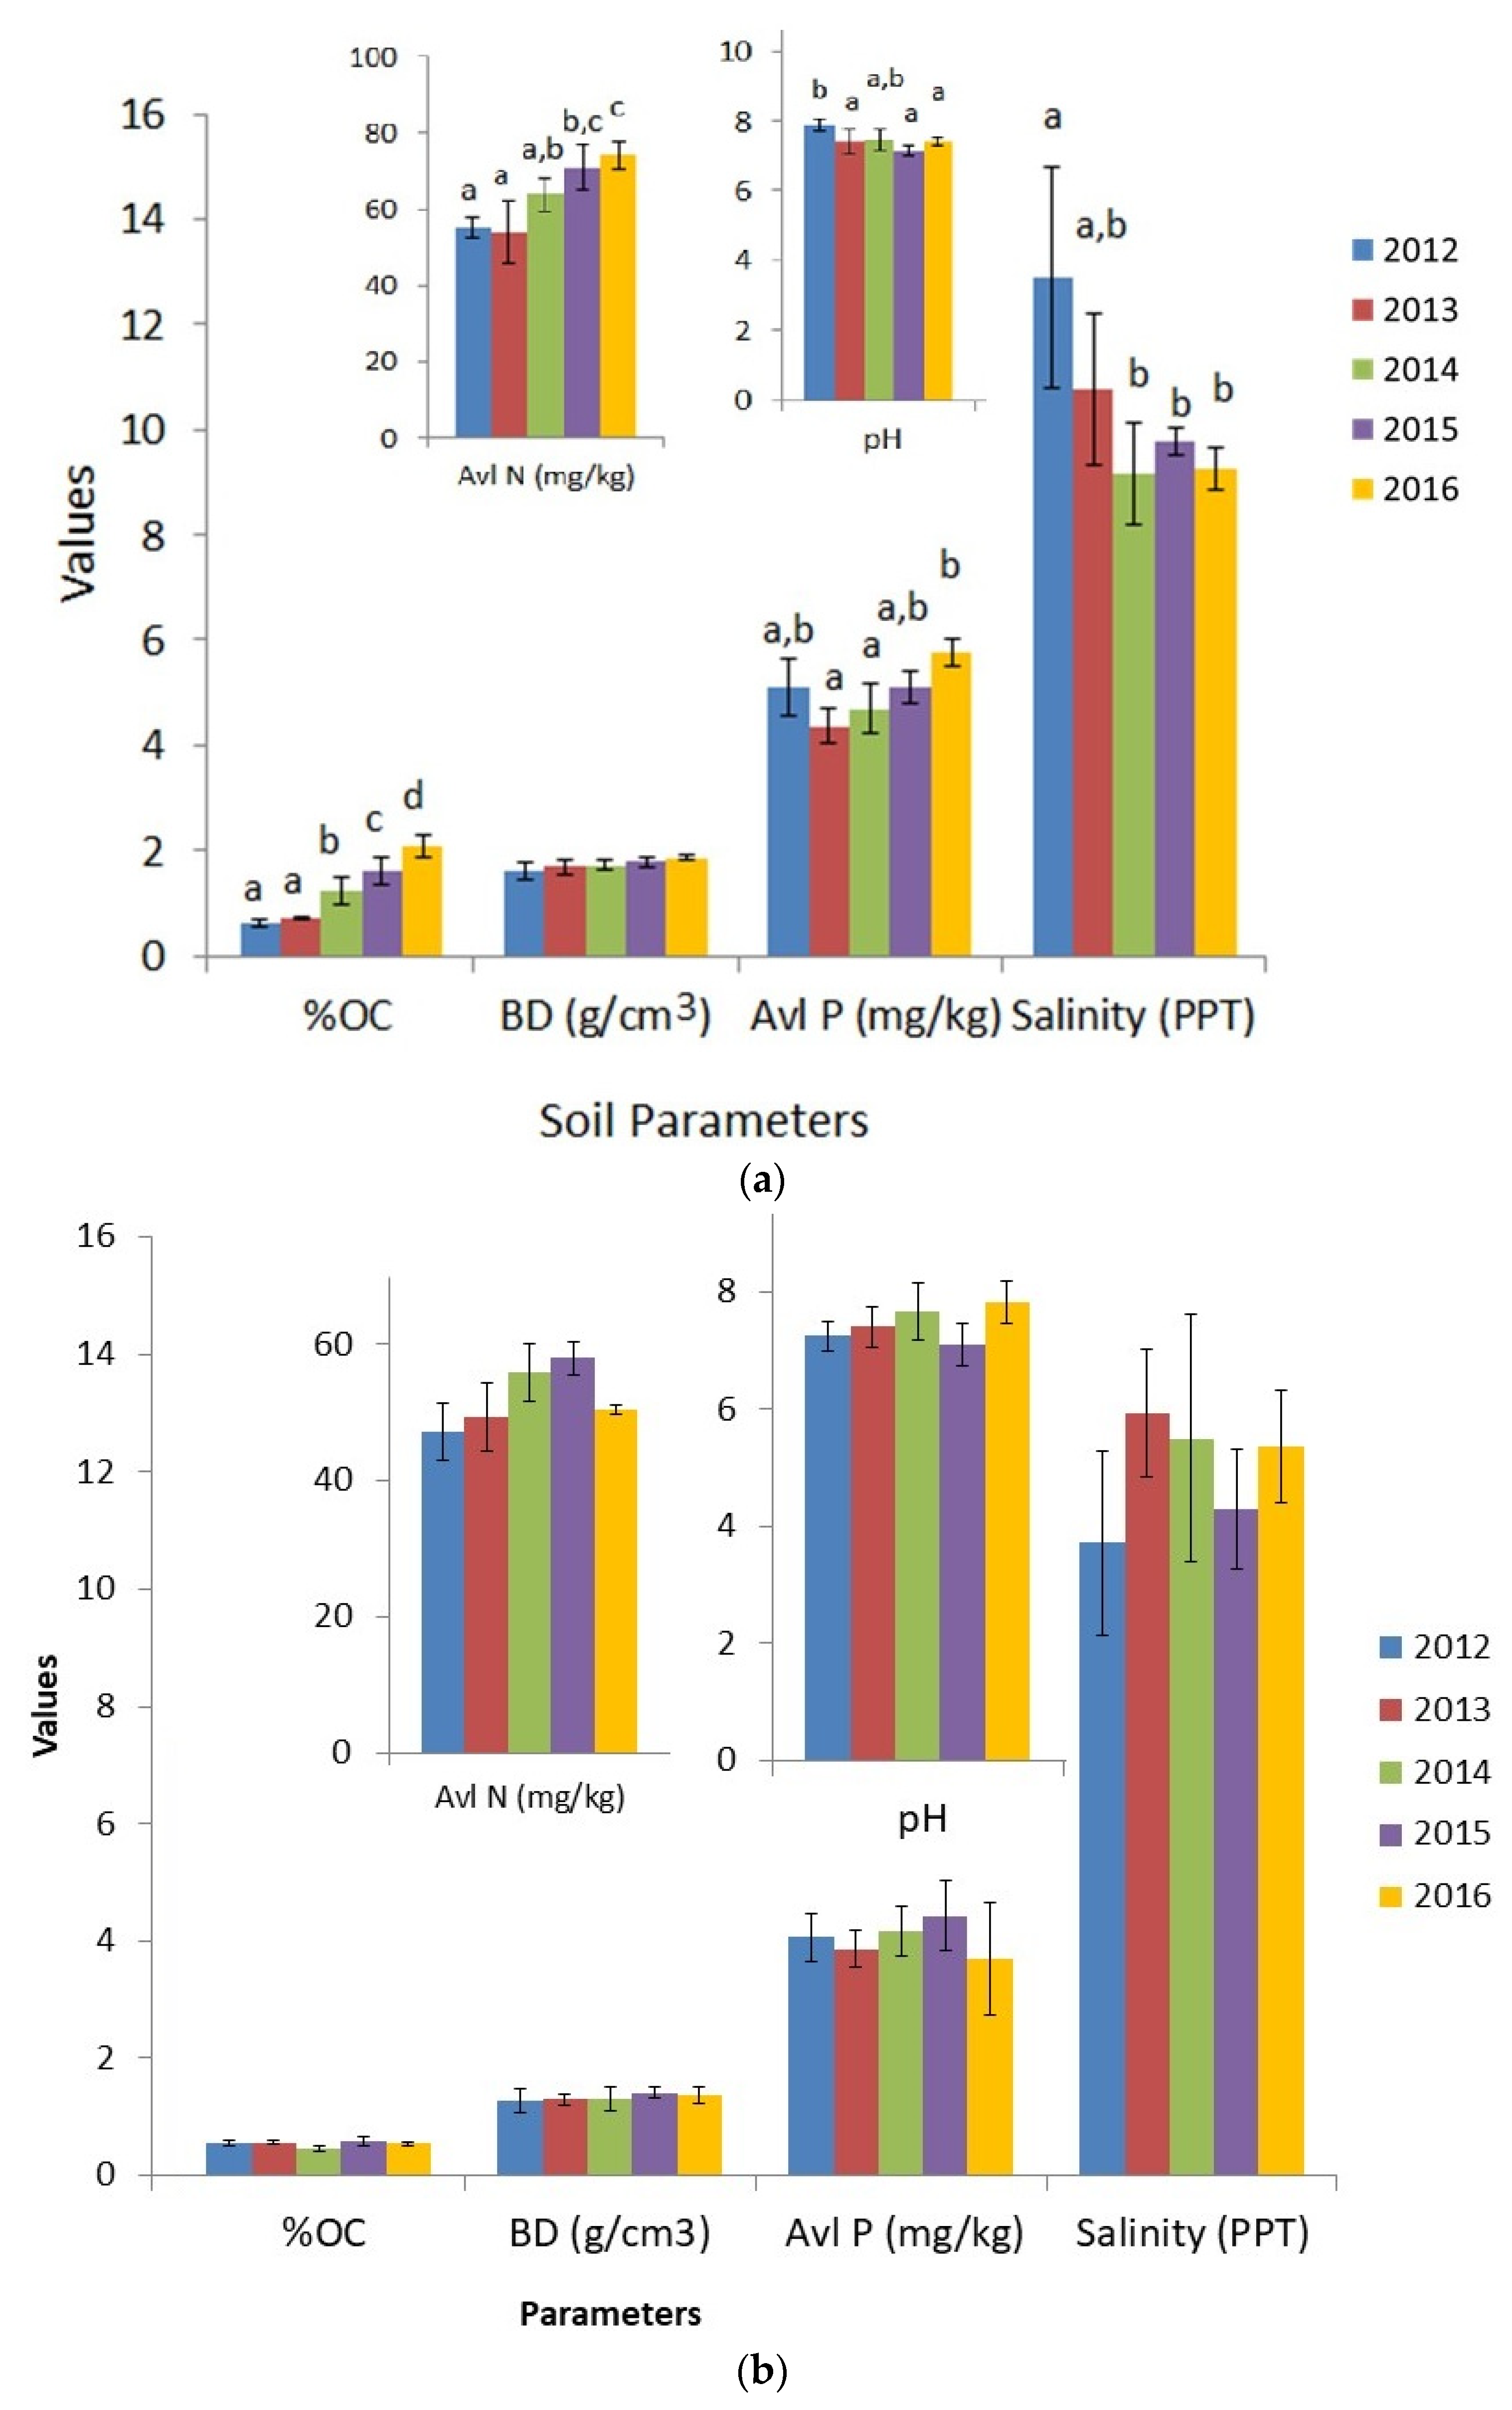
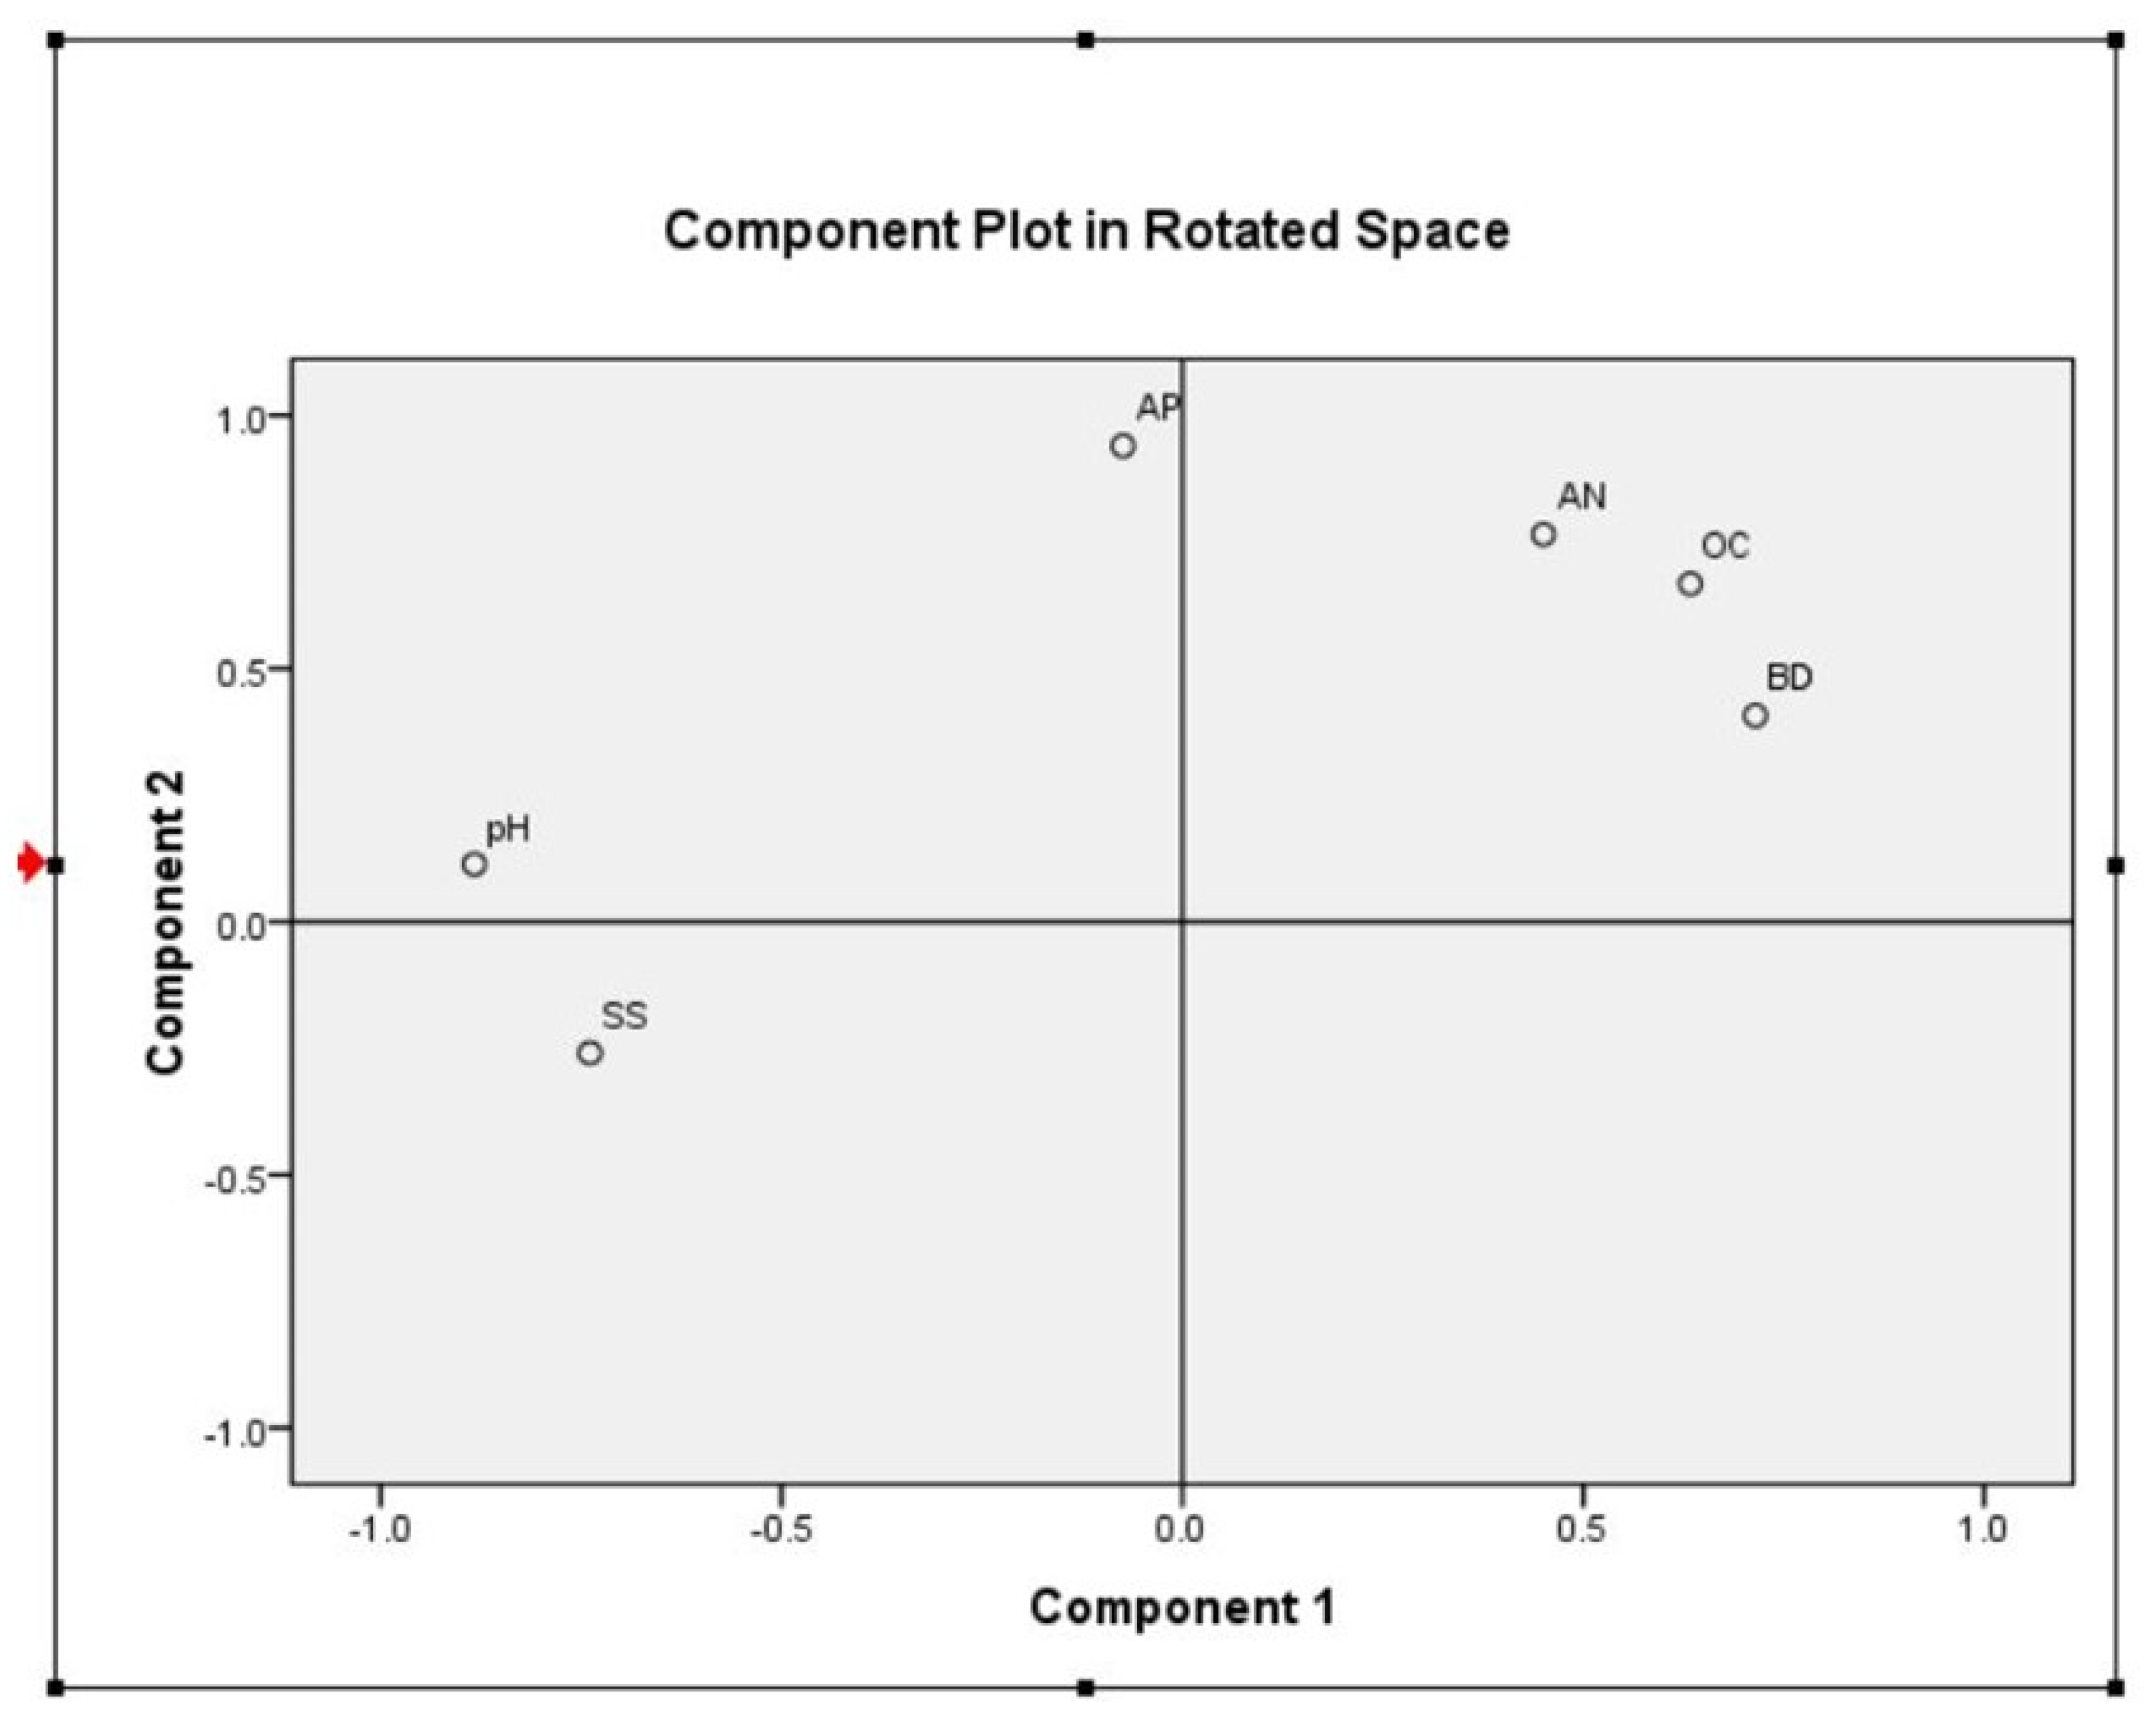
3.2. Variations in Soil Parameters between 2012 and 2016

The soil parameters (pH, OC, Av N, Av P, and salinity) showed a significant variation between the years (2012-2016) as per the one-way ANOVA test (Figure 3a,b). As the main hypothesis of this study was to understand the changes in soil ecological function and service parameters due to plantation, 0-10 cm soil depth has been considered. Fang et al. 2021 [33], have opined that litter impacts mostly the top 10 cm of the soil depth. In this study, we were evaluating the temporal variation in blue carbon dynamics of a site where plantation occurred only in 2012, so it can influence only the top layer (0-10 cm) of sediment till 2017. In case of patch dominated by P. coarctata, the grass rhizoids rarely penetrate beyond a 10 cm depth and can only influence the topsoil depth (0-10 cm). Hence, in both sites, 0-10 cm soil depth has been taken for temporal variation analysis. Only bulk density showed an insignificant variation between the years. The plantation program, hence, has resulted in the alteration of basic parameters of soil. The pH range in the alkaline section has been a common case in saline mangrove soil. There has been a rise in Organic carbon between 2012 and 2016. The A. marina growing in the plot have resulted in litter fall which may have contributed to the trends of rising OC. Research on Avicennia plantations from other mangrove areas does indicate a rise in soil OC due to the intervention [34,35]. The surface soil turned dark in color due to deposition of organic matter that constitute a major portion of the Organic carbon pool in the soil.
Av N is one of the major ‘Ecosystem function’ geo-chemical indicators [36]. Restoration should impact the overall ecosystem function and services. As argued by [36], ecosystem functions are difficult to estimate; hence, chemical, biological and physical soil parameter indicators play an important role in evaluating success of a restoration effort. In this case, the significant increase in Av N, Av P (Chemical indicator of ecological function) over the years has been indicative of restoration of ecological function of the mudflat. Mangrove plantation shows an increase in Av N and Av P as evident from similar studies [37]. High organic content in an ageing mangrove tree plantation influences the changes in soil nutrient content (Av N and Av P) as well as pH and Electrical conductivity or salinity [36,38]. Similarly in Site-1, there is a decrease in salinity but an increase in Av N, Av P and OC, indicating an improvement in the nutrient transfer cycle through the detritus food chain.
In Site-2, the natural colonization by other mangrove species was hindered by the extensive P. coarctata mat. Though previous studies indicate that grass mat help in increased entrapment of mangrove propagules, but the establishment and survival of these newly colonized mangroves are limited as is evident from this study [39]. Moreover, grasses are annual or seasonal, and this Semelparous (single reproduction in a life cycle) species are more susceptible to climatic, abiotic variations [40,41]. Hence, the nutrient variations and associated soil parameters were not found to be significantly (p≤ 0.5) varying between the years as per the ANOVA test (Figure 3a,b). The variations were more influenced by abiotic changes rather than changes in community ecology, as even after 4 years P. coarctata was still dominating Site-2.
Principle component analysis (PCA) extracted two major components which show a clear association between the soil parameters analyzed from Site 1 after undergoing varimax oblique rotation (Figure 4). Av N, OC and BD are grouping closely showing a close association between the three parameters. As expected from the restoration initiative, the A. marina plantation have resulted in consolidation of soil increasing the bulk density and decomposition. A steady supply of litter may have added up to the carbon pool of the mudflats and possibly an active detritus food chain that resulted in release of available nitrogen in the soil.

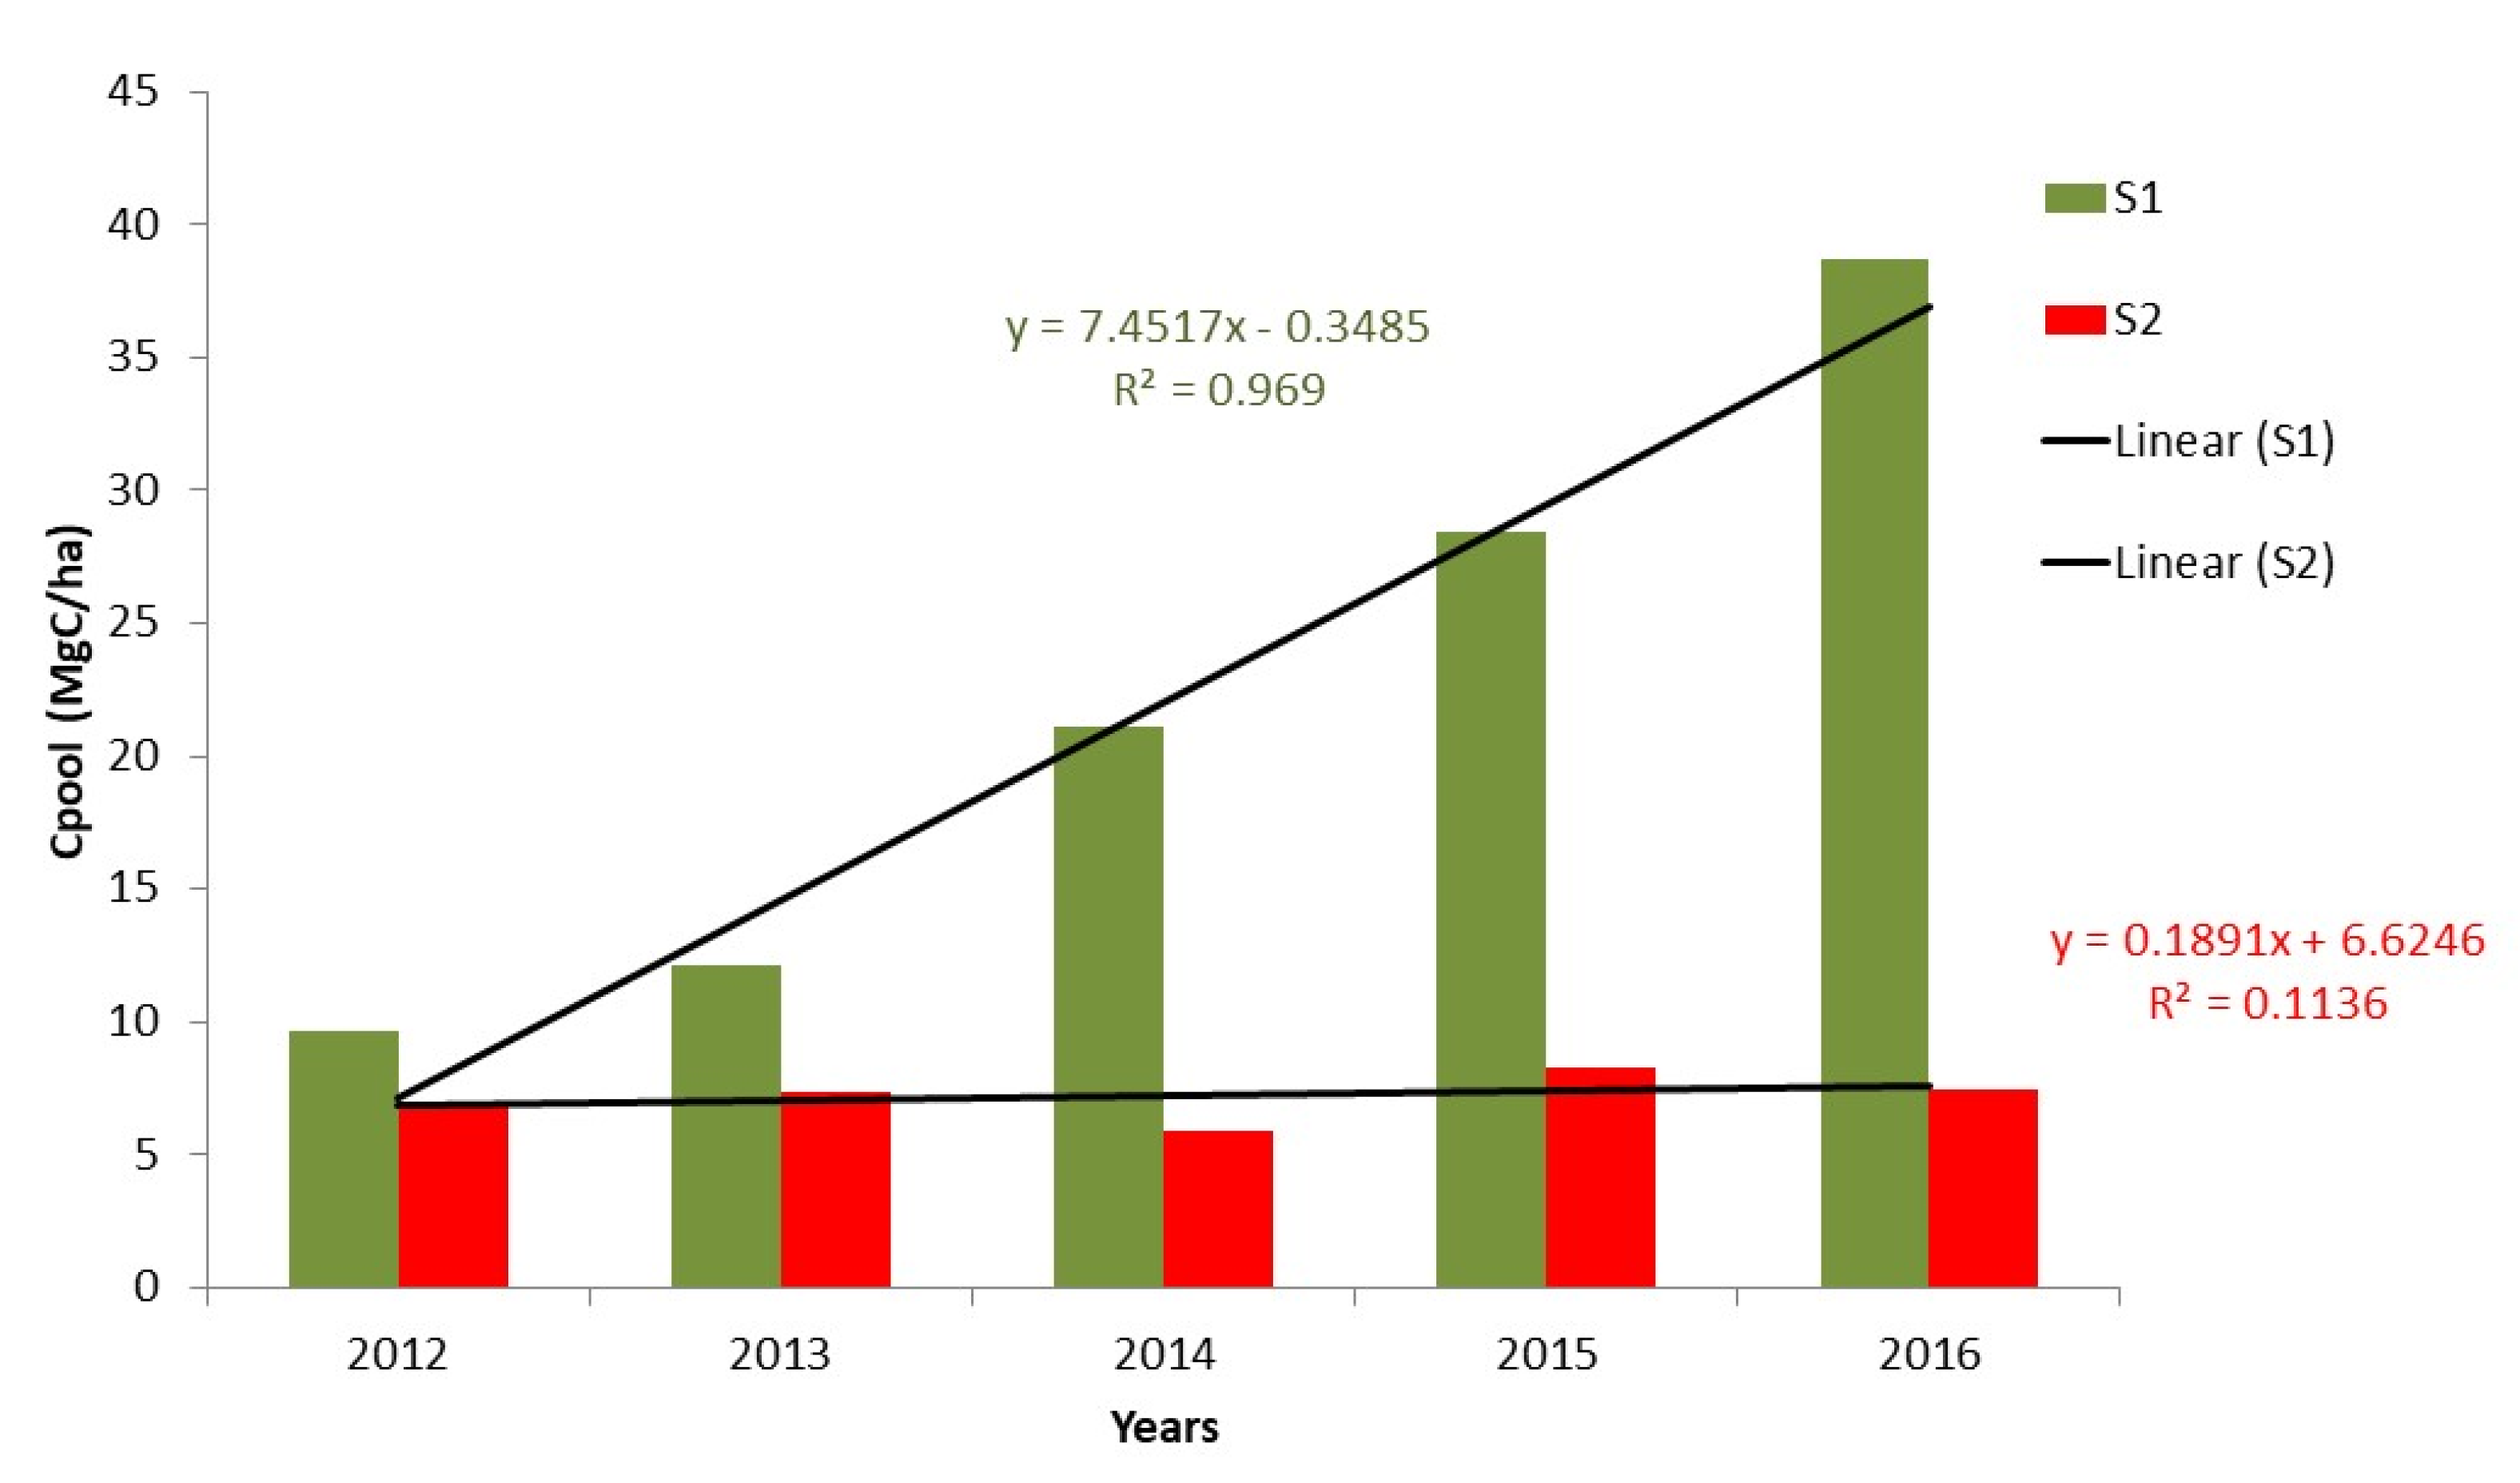
3.3. Blue Carbon Sequestration

One of the key ecosystem services of a restored mangrove ecosystem is the sequestration of blue carbon [4,42]. Hence, blue carbon sequestration is calculated as carbon pool in both the naturally P. coarctata dominated ecosystem (Site 2) and the plantation site for A. marina monoculture (Site 1) (Figure 5). It has been observed that Site-1 showed a steady yet significant linear increase in soil carbon pool (R2 = 0.96) while in Site-2, there has been a negligible, insignificant variation in C-pool (R2 = 0.1) between the years. Though it has been documented in the previous study that saline grassland ecosystems are productive and sequester carbon, it is negligible in comparison with an evergreen tree species, tolerant to abiotic stress such as salinity fluctuations. A. marina grows well in the Sundarban mudflat due to its wide range of tolerance to salinity fluctuations and dominating central part of Indian Sundarbans [1]. Whereas P coarctata’s ecological strategy has been to maximize spread over the mudflat through vegetative reproduction, characteristic of Poaceae family and short life cycle (seasonal or annual), with high seed dormancy, and resilience. This resulted in more random events in the P. coarctata-dominated community influenced by changes in abiotic parameters, unlike well-established A. marina monoculture. Research across the globe also supports the observation that restoration initiatives have been more likely to improve the ‘ecological functions’ of a mangrove ecosystem compared to the naturally degraded forest [43,44,45]. Blue carbon deposition in the soil can be from the input of organic matter from above-ground vegetation or brought by tidal waters or through carbon burial [46,47]. Therefore, carbon may have increased in the ecosystem through any of the processes and may not have been only because of increased litter addition. However, it can be opined that restoration initiatives may have increased the carbon entrapment in the rhizospheric sediment in the restored ecosystem.
A species can be classified as semelparous or iteroparous depending on their reproductive strategy. Semelparous species reproduce only once in their life cycle whereas iteroparous species have more than one reproductive cycle [48] Semelparous species had a survival strategy to proliferate in areas influenced by high stresses (such as anthropogenic interventions/impacts). They grow in these stressed habitats and maximize their energetics in a reproductive cycle and do not persist for a long duration. Hence, they have a lower life span (mostly annual or seasonal) and high seed resistance/dormancy to stress. They allocate entire nutrients, carbon metabolites for one reproductive cycle whereas iteroparous species also keep reserves for their continual survival even after a reproductive cycle [49]. Whereas an iteroparous species such as A. marina has a life cycle strategy to grow and mature before initiating the fruiting phase. For longer survival, it has adaptations such as excess salt secretion through salt glands, pneumatophores to supply oxygen in the below-ground biomass (saline soil is anoxic in nature), woody bark and stem, extensive root system to anchor in soft mud as well as resist regular tidal flushing. Through these processes, it alters the habitat and initiates the recovery of natural ecosystem functions. Mangrove plantations has been a viable option to improve upon the ecosystem function and services by utilizing natural adaptive traits of the plants. Community engagement can play an important role in managing the plantation and maximizing ecosystem services [50,51].
The study concludes that A. marina plantation may have improved the soil indicators of ecological function and services in comparison to degraded mudflats dominated by P. coarctata, mangrove grass. In a positive feedback loop, the plantation of an iteroparous mangrove tree species may have improved the ecosystem function (soil blue carbon sequestration potential) and aided in achieving the targets of UN Sustainability Development Goal 13-Climate action. This substantiates the need for mangrove restoration by plantation of iteroparous species to maximize the blue carbon sequestration service of the ecosystem dominating the saline coastal wetland mudflats. It is recommended that degraded mudflats in Indian Sundarbans, dominated by P. coarctata, can be restored through the plantation of A. marina, to maximize the blue carbon sequestration ecological service.

Author Contributions

Conceptualization, A.C.; Methodology, A.C. and A.N.; Formal analysis, A.N.; Investigation, A.C. and A.N.; Resources, R.D. and S.K.M.; Data curation, A.C. and A.N.; Writing—original draft, A.C.; Writing—review & editing, A.N., R.D. and S.K.M.; Supervision, S.K.M.; Project administration, A.C.; Funding acquisition, R.D. All authors have read and agreed to the published version of the manuscript.

Funding

The first author received an institutional fellowship from the Indian Institute of Technology (Indian School of Mines), Dhanbad from 2013–2017 with registration number 2013DR0015.

Institutional Review Board Statement

Not applicable.

Informed Consent Statement

Not applicable.

Data Availability Statement

All the data used in this study is public.

Acknowledgments

Authors acknowledge the support of the People’s Empowerment Towards Mangrove Restoration (P.E.M.R) program funded by BMZ–Germany for the mangrove restoration initiative presented in this case study. Authors acknowledge the Editor, Editorial board and anonymous reviewers for comments and suggestions which have been instrumental in improving the clarity and quality of the manuscript.

Conflicts of Interest

The authors declare no conflict of interest.

References

  1. Chowdhury, A.; Sanyal, P.; Maiti, S.K. Dynamics of mangrove diversity influenced by climate change and consequent accelerated sea level rise at Indian Sundarbans. Int. J. Global Warm. 2016, 9, 486–506. [Google Scholar] [CrossRef]
  2. Dasgupta, R.; Hashimoto, S.; Basu, M.; Okuro, T.; Johnson, B.A.; Kumar, P.; Dhyani, S. Spatial characterization of non-material values across multiple coastal production landscapes in the Indian Sundarban delta. Sustain. Sci. 2022, 17, 725–738. [Google Scholar] [CrossRef]
  3. Donato, D.C.; Kauffman, J.B.; Murdiyarso, D.; Kurnianto, S.; Stidham, M.; Kanninen, M. Mangroves among the most carbon-rich forests in the tropics. Nat. Geosci. 2011, 4, 293–297. [Google Scholar] [CrossRef]
  4. Bera, B.; Bhattacharjee, S.; Sengupta, N.; Shit, P.K.; Adhikary, P.P.; Sengupta, D.; Saha, S. Significant reduction of carbon stocks and changes of ecosystem service valuation of Indian Sundarban. Sci. Rep. 2022, 12, 7809. [Google Scholar] [CrossRef] [PubMed]
  5. Chowdhury, A.; Naz, A.; Bhattacharyya, S.; Sanyal, P. Cost–benefit analysis of ‘Blue Carbon’ sequestration by plantation of few key mangrove species at Sundarban Biosphere Reserve, India. Carbon Manag. 2018, 9, 575–586. [Google Scholar] [CrossRef]
  6. Islam, S.M.; Bhuiyan, M.A.H. Sundarbans mangrove forest of Bangladesh: Causes of degradation and sustainable management options. Environ. Sustain. 2018, 1, 113–131. [Google Scholar] [CrossRef]
  7. Das, S.; Vincent, J.R. Mangrove protected villages and reduced death toll during Indiansuper cyclone’. Proc. Natl. Acad. Sci. USA 2009, 106, 7357–7360. [Google Scholar] [CrossRef] [Green Version]
  8. Rahman, M. Impact of increased salinity on the plant community of the Sundarbans Mangrove of Bangladesh. Community Ecol. 2020, 21, 273–284. [Google Scholar] [CrossRef]
  9. Takahashi, Y.; Park, K.J.; Natori, Y.; Dublin, D.; Dasgupta, R.; Miwa, K. Enhancing synergies in nature’s contributions to people in socio-ecological production landscapes and seascapes: Lessons learnt from ten site-based projects in biodiversity hotspots. Sustain. Sci. 2022, 17, 823–836. [Google Scholar] [CrossRef]
  10. Naskar, S.; Palit, P.K. Anatomical and physiological adaptations of mangroves. Wetl. Ecol. Manag. 2015, 23, 357–370. [Google Scholar] [CrossRef]
  11. Cano-Ortiz, A.; Musarella, C.M.; Piñar, J.C.; Pinto Gomes, C.J.; del Río González, S.; Cano, E. Diversity and conservation status of mangrove communities in two areas of Mesocaribea biogeographic region. Curr. Sci. 2018, 115, 534–540. [Google Scholar] [CrossRef]
  12. Basáñez-Muñoz, A.D.J.; Jordán-Garza, A.G.; Serrano, A. Forest Structure and Projections of Avicennia germinans (L.) L. at Three Levels of Perturbation in a Southwestern Gulf of Mexico Mangrove. Forests 2021, 12, 989. [Google Scholar] [CrossRef]
  13. Macreadie, P.I.; Costa, M.D.; Atwood, T.B.; Friess, D.A.; Kelleway, J.J.; Kennedy, H.; Duarte, C.M. Blue carbon as a natural climate solution. Nat. Rev. Earth Environ. 2021, 2, 826–839. [Google Scholar] [CrossRef]
  14. Sidik, F.; Supriyanto, B.; Krisnawati, H.; Muttaqin, M.Z. Mangrove conservation for climate change mitigation in Indonesia. Wiley Interdiscip. Rev. Clim. Chang. 2018, 9, e529. [Google Scholar] [CrossRef]
  15. Gulliver, A.; Carnell, P.E.; Trevathan-Tackett, S.M.; Duarte de Paula Costa, M.; Masqué, P.; Macreadie, P.I. Estimating the potential blue carbon gains from tidal marsh rehabilitation: A case study from south eastern Australia. Front. Mar. Sci. 2020, 7, 403. [Google Scholar] [CrossRef]
  16. Jimenez, L.C.Z.; Queiroz, H.M.; Otero, X.L.; Nóbrega, G.N.; Ferreira, T.O. Soil Organic Matter Responses to Mangrove Restoration: A Replanting Experience in Northeast Brazil. Int. J. Environ. Res. Public Health 2021, 18, 8981. [Google Scholar] [CrossRef]
  17. Maiti, S.K. Ecorestoration of Coal Mine Degraded Lands, 1st ed.; Springer: Berlin/Heidelberg, Germany, 2013. [Google Scholar]
  18. Walkley, A.; Black, I.A. An examination of the Degtjareff method for determining soil organic matter and a proposed modification of the chromic acid titration method. Soil Sci. 1934, 37, 29–38. [Google Scholar] [CrossRef]
  19. Subbiah, B.V.; Asija, G.L. A rapid procedure for the determination of available nitrogen in soils. Curr. Sci. 1956, 25, 259–260. [Google Scholar]
  20. Olsen, S.R. Estimation of Available Phosphorus in Soils by Extraction with Sodium Bicarbonate (No. 939); US Department of Agriculture: Washington, DC, USA, 1954. [Google Scholar]
  21. Tue, N.T.; Dung, L.V.; Nhuan, M.T.; Omori, K. Carbon storage of a tropical mangrove forest in Mui Ca Mau National Park, Vietnam. Catena 2014, 121, 119–126. [Google Scholar] [CrossRef]
  22. Simpson, E.H. Measurement of diversity. Nature 1949, 163, 688. [Google Scholar] [CrossRef]
  23. Laude, R. Statistics and partitioning of species diversity, and similarity among multiple communities. Oikos 1996, 76, 5–13. [Google Scholar]
  24. Shannon, C.E. A mathematical theory of communication. Bell Syst. Tech. J. 1948, 27, 379–656. [Google Scholar] [CrossRef]
  25. Acharya, S.; Patra, D.K.; Mahalik, G.; Mohapatra, P.K. Quantitative Ecological Study of Rhizophoraceae Mangroves of Bhitarkanika Wildlife Sanctuary Regions of Odisha Coast, India. Proc. Natl. Acad. Sci. India Sect. B Biol. Sci. 2021, 91, 897–908. [Google Scholar] [CrossRef]
  26. Agraz-Hernández, C.M.; Chan-Keb, C.A.; Muñiz-Salazar, R.; Pérez-Balan, R.A.; Vanegas, G.P.; Manzanilla, H.G.; del Río Rodríguez, R. Pore Water Chemical Variability and Its Effect on Phenological Production in Three Mangrove Species under Drought Conditions in Southeastern Mexico. Diversity 2022, 14, 668. [Google Scholar] [CrossRef]
  27. Singh, J.K. Structural characteristics of mangrove forest in different coastal habitats of Gulf of Khambhat arid region of Gujarat, west coast of India. Heliyon 2020, 6, e04685. [Google Scholar] [CrossRef]
  28. Khan, M.A.; Aziz, I. Salinity tolerance in some mangrove species from Pakistan. Wetl. Ecol. Manag. 2001, 9, 229–233. [Google Scholar] [CrossRef]
  29. Patel, N.T.; Gupta, A.; Pandey, A.N. Salinity tolerance of Avicennia marina (Forssk.) Vierh. from Gujarat coasts of India. Aquat. Bot. 2010, 93, 9–16. [Google Scholar] [CrossRef]
  30. Thivakaran, G.A.; Sharma, S.B.; Chowdhury, A.; Murugan, A. Status, structure and environmental variations in semi-arid mangroves of India. J. For. Res. 2020, 31, 163–173. [Google Scholar] [CrossRef]
  31. Mohanraj, R.; Akil Prasath, R.V.; Rajasekaran, A. Assessment of vegetation, soil nutrient dynamics and heavy metals in the Prosopis juliflora invaded lands at semi-arid regions of Southern India. Catena 2022, 216, 106374. [Google Scholar] [CrossRef]
  32. Ellison, A.M.; Mukherjee, B.B.; Karim, A. Testing patterns of zonation in mangroves: Scale dependence and environmental correlates in the Sundarbans of Bangladesh. J. Ecol. 2000, 88, 813–824. [Google Scholar] [CrossRef]
  33. Fang, X.M.; Wang, G.G.; Xu, Z.J.; Zong, Y.Y.; Zhang, X.L.; Li, J.J.; Chen, F.S. Litter addition and understory removal influenced soil organic carbon quality and mineral nitrogen supply in a subtropical plantation forest. Plant Soil 2021, 460, 527–540. [Google Scholar] [CrossRef]
  34. AboEl-Nil, M.M. Growth and establishment of mangrove (Avicennia marina) on the coastlines of Kuwait. Wetl Ecol Manag. 2001, 9, 421–428. [Google Scholar] [CrossRef]
  35. Feng, J.; Cui, X.; Zhou, J.; Wang, L.; Zhu, X.; Lin, G. Effects of exotic and native mangrove forests plantation on soil organic carbon, nitrogen, and phosphorus contents and pools in Leizhou, China. Catena 2019, 180, 1–7. [Google Scholar] [CrossRef]
  36. Muñoz-Rojas, M. Soil quality indicators: Critical tools in ecosystem restoration. Curr. Opin. Environ. Sci. Health 2018, 5, 47–52. [Google Scholar] [CrossRef]
  37. Salmo, S.G.; Lovelock, C.; Duke, N.C. Vegetation and soil characteristics as indicators of restoration trajectories in restored mangroves. Hydrobiologia 2013, 720, 1–18. [Google Scholar] [CrossRef]
  38. Cardona, P.; Botero, L. Soil characteristics and vegetation structure in a heavily deteriorated mangrove forest in the Caribbean coast of Colombia. Biotropica 1998, 30, 24–34. [Google Scholar] [CrossRef]
  39. Begam, M.; Sutradhar, T.; Chowdhury, R.; Mukherjee, C.; Basak, S.K.; Ray, K. Native salt-tolerant grass species for habitat restoration, their acclimation and contribution to improving edaphic conditions: A study from a degraded mangrove in the Indian Sundarbans. Hydrobiologia 2017, 803, 373–387. [Google Scholar] [CrossRef]
  40. Mandal, A.K.; Nandi, N.C. Fauna of Sundarban Mangrove Ecosystem, West Bengal, India; Zoological Survey of India: Kolkata, India, 1989; Volume 3. [Google Scholar]
  41. Preston, J.C.; Fjellheim, S. Understanding past, and predicting future, niche transitions based on grass flowering time variation. Plant Physiol. 2020, 183, 822–839. [Google Scholar] [CrossRef]
  42. Ellison, A.M. Mangrove restoration: Do we know enough? Restor. Ecol. 2000, 8, 219–229. [Google Scholar] [CrossRef]
  43. Zhang, J.; Shen, C.; Ren, H.; Wang, J.; Han, W. Estimating change in sedimentary organic carbon content during mangrove restoration in southern china using carbon isotopic measurements. Pedosphere 2012, 22, 58–66. [Google Scholar] [CrossRef]
  44. Lee, S.Y.; Hamilton, S.; Barbier, E.B.; Primavera, J.; Lewis, R.R. Better restoration policies are needed to conserve mangrove ecosystems. Nature Ecology & Evolution. Nat. Ecol. Evol. 2019; 3, 870–872. [Google Scholar]
  45. Su, J.; Friess, D.A.; Gasparatos, A. A meta-analysis of the ecological and economic outcomes of mangrove restoration. Nat. Commun. 2021, 12, 1–13. [Google Scholar] [CrossRef] [PubMed]
  46. Saderne, V.; Geraldi, N.R.; Macreadie, P.I.; Maher, D.T.; Middelburg, J.J.; Serrano, O.; Almahasheer, H.; Arias-Ortiz, A.; Cusack, M.; Eyre, B.D.; et al. Role of carbonate burial in Blue Carbon budgets. Nat. Commun. 2019, 10, 1–9. [Google Scholar] [CrossRef] [PubMed]
  47. Cuellar-Martinez, T.; Ruiz-Fernández, A.C.; Sanchez-Cabeza, J.A.; Perez-Bernal, L.H.; Sandoval-Gil, J. Relevance of carbon burial and storage in two contrasting blue carbon ecosystems of a north-east Pacific coastal lagoon. Sci. Total Environ. 2019, 675, 581–593. [Google Scholar] [CrossRef] [PubMed]
  48. Hasibuan, A.; Supriatna, A.K.; Carnia, E. Local stability analysis of two density-dependent semelparous species in two age classes. Front. Appl. Math. Stat. 2022, 8, 953223. [Google Scholar] [CrossRef]
  49. Lundgren, M.R.; Des Marais, D.L. Life history variation as a model for understanding trade-offs in plant–environment interactions. Curr Biol. 2020, 30, 180–189. [Google Scholar] [CrossRef]
  50. Akhand, A.; Chanda, A.; Dasgupta, R. Advancement in Measurement and Estimation Methods of Blue Carbon Studies. Assessing, Mapping and Modelling of Mangrove Ecosystem Services in the Asia-Pacific Region; Springer: Berlin/Heidelberg, Germany, 2022; pp. 127–142. [Google Scholar]
  51. Kadaverugu, R.; Dhyani, S.; Dasgupta, R.; Kumar, P.; Hashimoto, S.; Pujari, P. Multiple values of Bhitarkanika mangroves for human well-being: Synthesis of contemporary scientific knowledge for mainstreaming ecosystem services in policy planning. J. Coast. Conserv. 2021, 25, 1–15. [Google Scholar] [CrossRef]
Figure 1. (a) The map of Indian Sundarban is depicted: (b) the location map of the study sites was zoomed out from the map of Indian Sundarbans showing Site 1 and Site 2; (c) The zoomed-out location of the Site 1, Avicennia marina plantation site and the sample plot; (d) the zoomed-out location and sampling plot of Site 2; (e) The pictorial representation of the Avicennia marina (the trees in the figure) plantation at Site -1 during a high tide; (f) Pictorial representation of Site-2, dominated by Proteresia coarctata (the grass is visible in the picture).
Sustainability 15 00368 g001
Figure 2. The temporal changes in the ecological health of the mangrove community at site 2 is evaluated by (a) The Simpson’s Index of Dominance, (b) Simpson’s Index of Diversity and (c) Shannon–Weiner Index.
Sustainability 15 00368 g002aSustainability 15 00368 g002b
Figure 3. (a): Soil parameters at Site 1. The lowercase alphabets represent similarity according to Duncan post hoc test. (b): Soil parameters at Site 2.
Sustainability 15 00368 g003
Figure 4. Principal components after Varimax rotation. AP = Available P, AN = Available N, OC = Organic carbon, BD = Bulk density, SS = Soil salinity.
Sustainability 15 00368 g004
Figure 5. Comparison between the Carbon pool of Site 1 (A. marina plantation) and Site 2 (P. coarctata dominated community) during the intervention period (2012–2016).
Sustainability 15 00368 g005
Table 1. Soil texture in percentage (n = 3) (%).
SandSiltClay
S11.60 ± 0.1779.57 ± 1.2718.83 ± 1.31
S21.83 ± 0.1580.77 ± 1.7217.40 ± 1.83
Table 2. Relative Density (RD) and Frequency (F) of species variations at Site-2 from 2012–2016.
20122013201420152016
NumberSpeciesFamilyRDFRDFRDFRDFRDF
1Acanthus ilicifolius L.Acanthaceae710041001260360260
2Avicennia marina (Forssk.) Vierh.Acanthaceae26011804100510020100
3Ceriops tagal (Perr.) C.B.RobRhizophoraceae04000000000
4Phoenix paludosa Roxb.Arecaceae240140560160280
5Proteresia coarctata (Roxb.) TateokaPoaceae8710084100781009010076100
6Sonneratia caseolaris (L.) Engl.Lythraceae12000000000
Disclaimer/Publisher’s Note: The statements, opinions and data contained in all publications are solely those of the individual author(s) and contributor(s) and not of MDPI and/or the editor(s). MDPI and/or the editor(s) disclaim responsibility for any injury to people or property resulting from any ideas, methods, instructions or products referred to in the content.

