Article

Experimental Survey of the Sound Absorption Performance of Natural Fibres in Comparison with Conventional Insulating Materials

Department of Environmental Engineering, Faculty of Mechanical Engineering, Technical University of Kosice, 042 00 Kosice, Slovakia
*
Author to whom correspondence should be addressed.
Sustainability 2022, 14(7), 4258; https://doi.org/10.3390/su14074258
Submission received: 10 February 2022 / Revised: 22 March 2022 / Accepted: 23 March 2022 / Published: 3 April 2022

Abstract

:
The purpose of this research is to investigate the acoustic properties of natural fibres and compare them with the values achieved by common insulation materials used in the construction of buildings. Three materials based on biomass were used for testing, namely cork, hemp and fibreboard. From the group of conventional materials, mineral wool, propylat and polyurethane foam were selected. For the purpose of determining the values of the sound absorption coefficient (α), the absorber specimens were tested using the impedance tube and two microphones method, according to standard ISO 10534-2. The measurement was performed for thicknesses of 20, 40, 60, 80 and 100 mm. The highest sound absorption of all materials was measured with a hemp sample at a frequency of 2000 Hz (α = 0.99) and a thickness of 20 mm. The lowest performance was achieved by cork at the same thickness and frequency of 100 Hz (α = 0.02). Among biomass materials, hemp dominated in the entire frequency range and at all thicknesses. The lowest values were for cork, from 160 to 500 Hz with a tendency to exceed the values of the fibreboard sample. Among conventional materials, mineral wool achieved the best results, while the lowest values were recorded for propylat with the occasional exception of the highest frequencies from 1600 to 2500 Hz.

1. Introduction

Studies on the use of natural insulating materials for acoustic purposes suggest that many of them have acoustic properties comparable to those of conventional materials, which burden the environment in their life cycle during production, use or disposal. However, the acoustic properties of many natural materials have been insufficiently researched.
At present, the most commonly used acoustic material is various types of polyurethane (PUR) foams. Cradle-to-gate is an assessment of a partial product life cycle, which includes the raw material stage (cradle), the manufacturing stage and the distribution stage (the factory gate before transportation to the customer) [1]. Based on this type of life cycle analysis (LCA), PUR foam has the most harmful impact on the environment among all insulating materials. It is attributed to polyether polyols and isocyanates with the precursor’s long chain in the product stage, which includes raw material supply, transport to the manufacturer and manufacturing [2].
In the product stage of rigid PUR foam, global warming potential (GWP) represents 14.8 kg eq./m2 (with a thickness of 12 cm and a basis weight of 3.96 kg/m2) [3]. By comparison, if we look at, e.g., 100% ground cork panel, GWP reaches 0.61 kg eq./m2 (with a thickness of 10 cm and a basis weight of 16.5 kg/m2) [4].
The use phase is the largest contributor to PUR foam’s environmental burden due to the gradual release of the blowing agent used and hydrofluorocarbons (HFCs) during the life of the building. HFCs have a high GWP, which makes a significant contribution to climate change [5].
Natural materials have a low environmental footprint throughout their life cycle. The greatest benefit is 100% recyclability and biodegradability. In addition, waste from the production of other products can be used for the production of acoustic panels. Moreover, many of these materials do not require any additives or binders, as compression moulding is sufficient to compact them. Their advantage is the possibility of processing them into effective 3D models that also satisfy the aesthetic requirements of space [6,7,8,9].
One kilogram of hemp consumes approximately 4 kg of CO2 during growth. At the same time, only 0.2 kg of CO2 is released into nature. This makes hemp, like other natural plant materials, an important component of nature conservation. This condition is more favourable compared to the CO2 balance achieved in the production of foamable insulating materials from petroleum or inorganic fibres based on glass or mineral fibres [10]. The amount of primary energy input in hemp insulation is 31.1 MJ/kg. The production of CO2 is negative, GWP = −0.133 kg CO2 eq./m2. The acidification potential or production of SO2 is in the amount of 0.00539 kg SO2 eq./m2 [11,12,13]. The acoustic characteristics of hemp have been the subject of several studies. The fact that hemp has comparable acoustic properties to glass fibre was proven in [14]. The particle shape factor in relation to hemp and acoustics was also the subject of studies [15,16,17]. A physical data analysis revealed that acoustic dissipation is governed by the particle pores of the material in the monitored frequency range on the basis of which it is possible to model the acoustic properties of different particle mixes. Studies show that the acoustic behaviour of a material depends on physical parameters such as the shape factor, the porosity, the mean thickness of the particle and apparent particle density.
Natural fibres can be combined with binders, which can also affect acoustic performance. Hemp is often used in combination with concrete in the concept of green buildings. Combining hemp and concrete and comparing different binders for acoustic purposes were studied in [18,19,20,21].
From the study on the sound absorption of wood-based materials it can be read that the sound absorption coefficient of cork had higher values than all other woods. Among all tested woods, it was found that cork with an attached tea bag filled with corn fibre was the best selection for sound absorption applications [22]. The possibility of using cork wall panels for room acoustic correction was discussed in [23,24,25]. Virgin cork as an acoustic absorber was investigated in [26].
The acoustic behaviour of fibreboards with different densities and resin contents was researched in [27,28]. The porosity was the main factor influencing the ability to absorb sound, as samples with a different thickness and resin content showed different porosity. The more porous samples were more acoustically efficient and were also characterized by better thermal conductivity performance. The fact that the sound absorption coefficient of fibreboard increases with a decrease in density was proven in [29].
Noise pollution due to urbanization and industrial development needs to be controlled in an effective way. Different synthetic materials show excellent acoustic performance, but it is necessary to deal with their high cost and environmentally harmful effects [30,31].
The aim of the research was to compare natural and commonly used insulation building materials from the environmental point of view by summarizing the available information on their environmental impacts, and from the acoustic point of view by measurement.

2. Materials and Methods

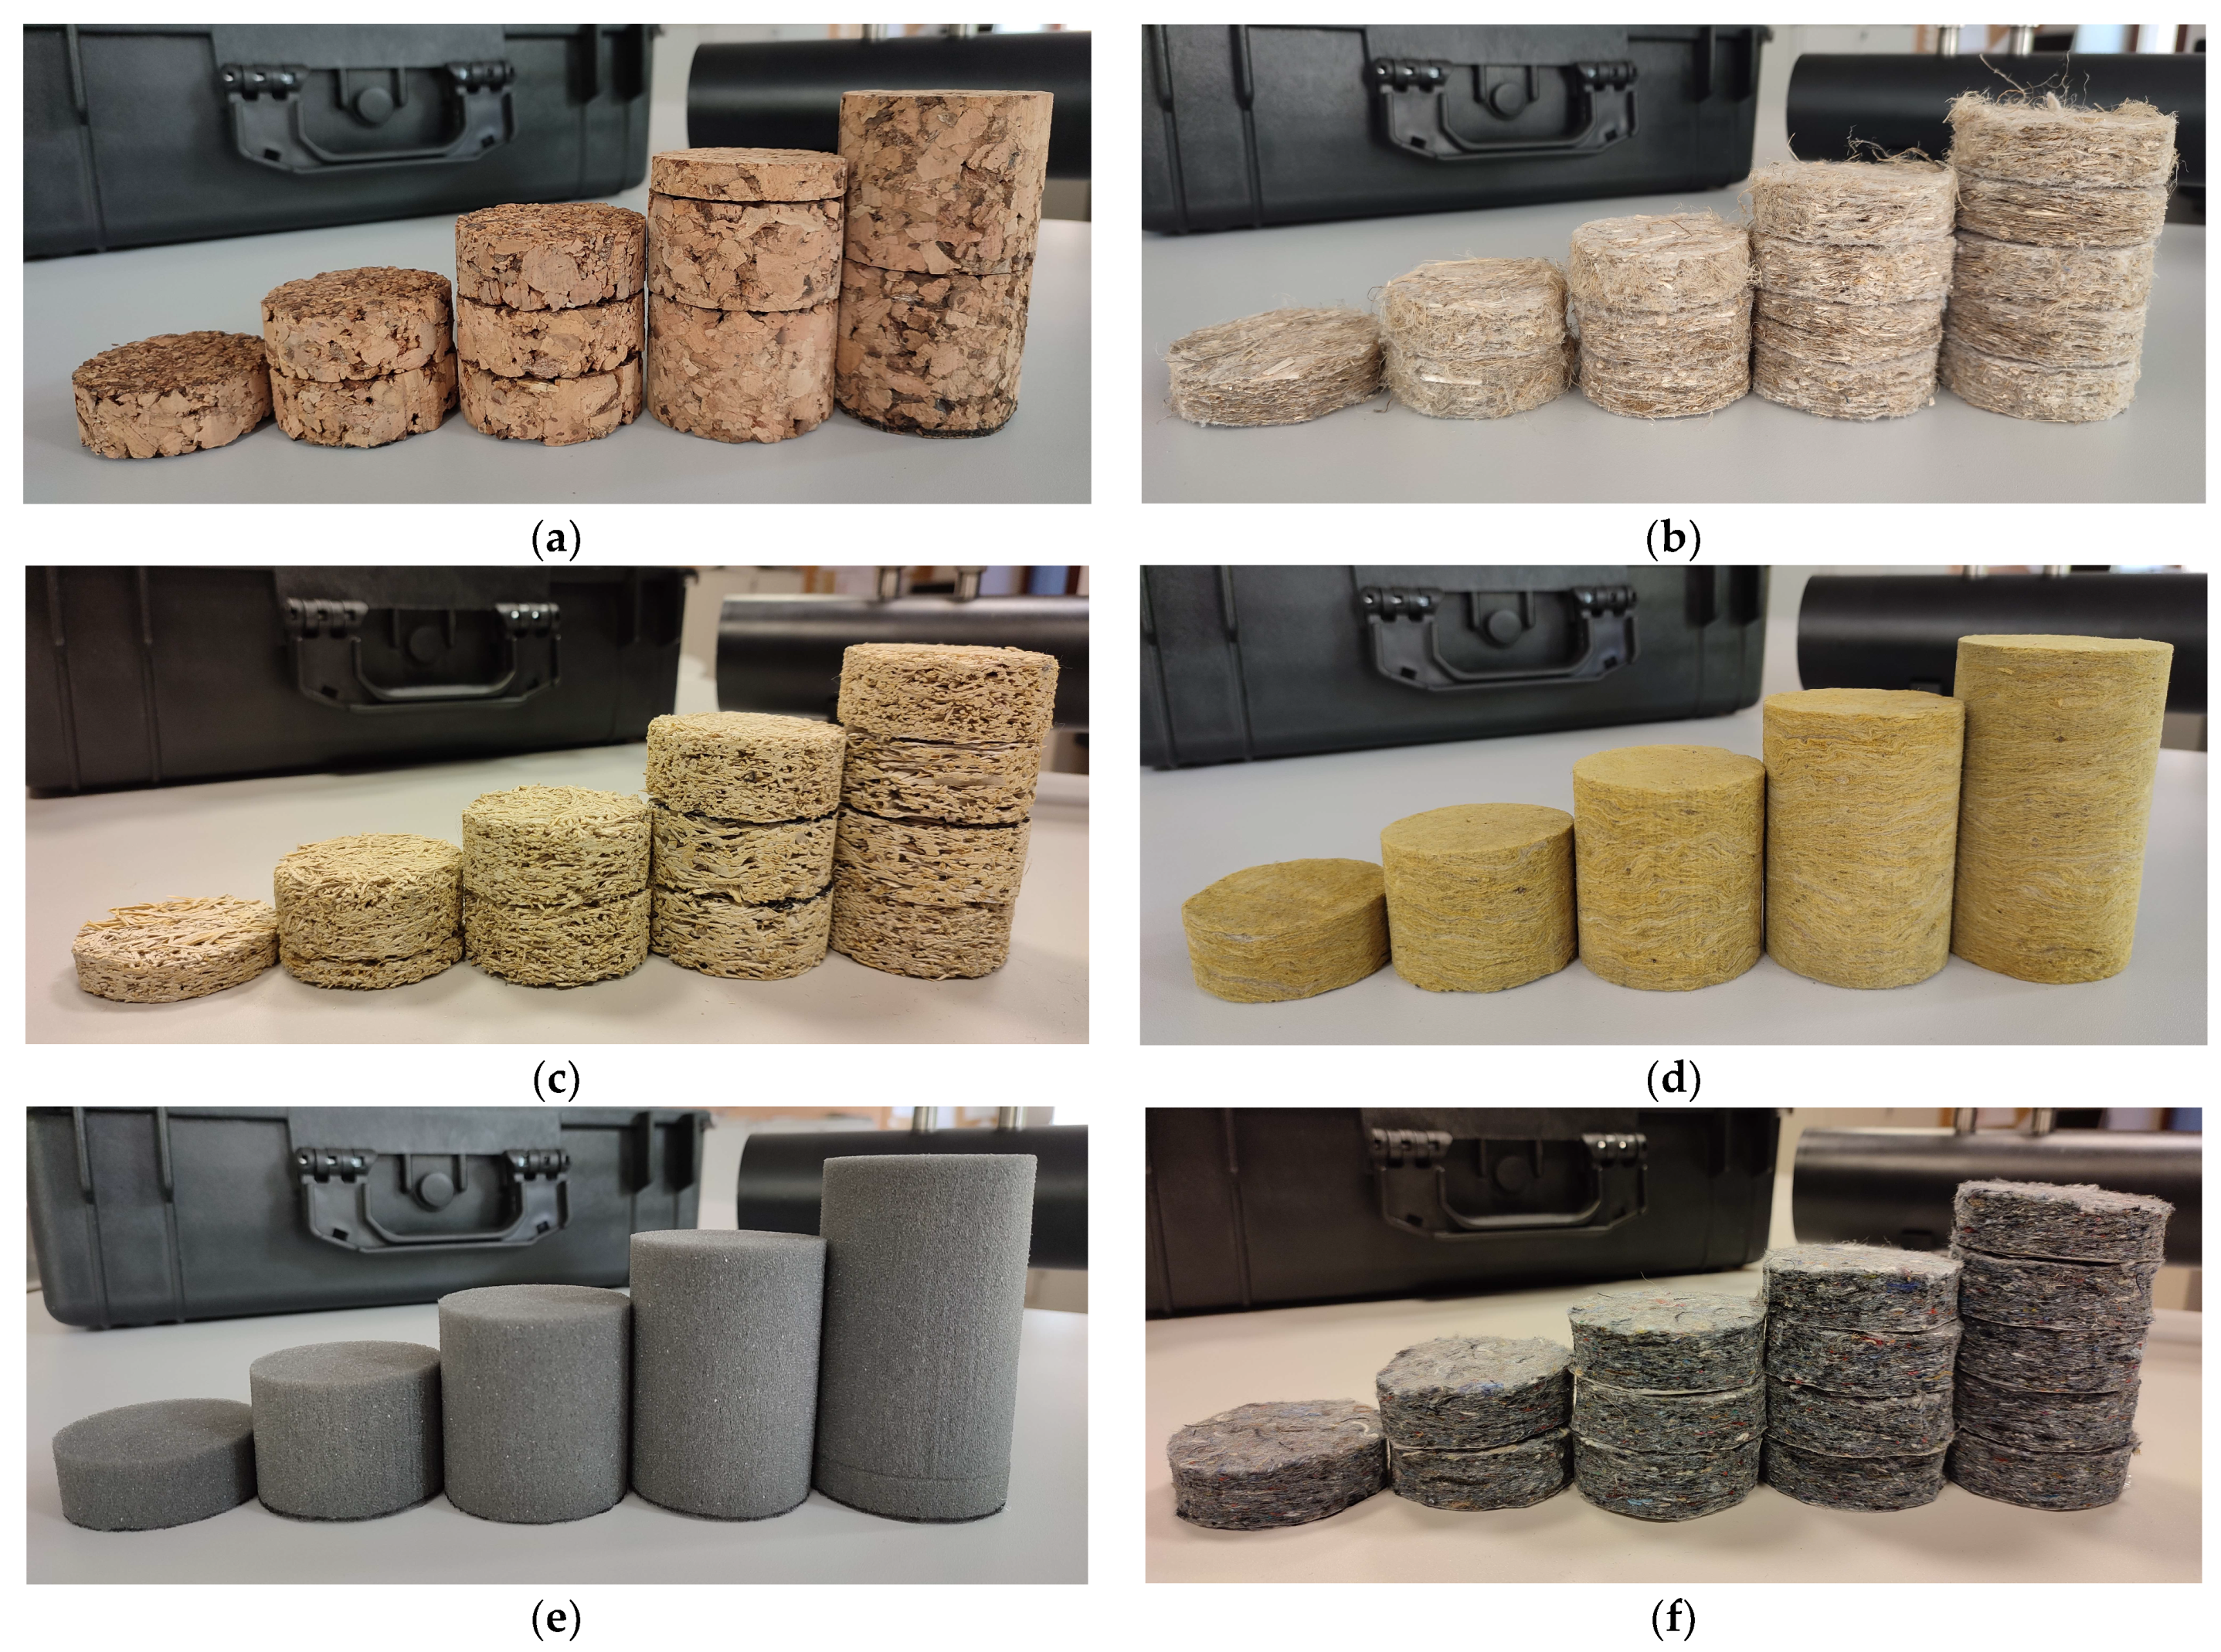
2.1. Properties and Preparation of Samples

The tested materials were obtained from local suppliers of insulation materials from Slovakia and samples of all materials were cut using water jet technology into smaller pieces of whole boards. Measurement in the impedance tube at the selected frequency range requires circular samples with a diameter of 60 mm. The samples were tested at thicknesses of 20, 40, 60, 80 and 100 mm. The properties of the tested materials from the acoustic and environmental point of view are described in the following subchapters. The samples used for testing are shown in Figure 1.

2.1.1. Cork

The cork oak forests in Portugal are a driving force of sustainable development. Cork bark is harvested every nine years, always between May and August, when the tree is in its most active phase of growth. The bark is harvested without harming the tree, which means that the tree is not cut down [32]. Cork boards are made without the use of foreign binders. At an elevated temperature, through the action of water vapour in combination with high pressure (in an autoclave), the resin is extruded from the cork granules, which compresses the granules into the form of boards. In this way, the boards are produced in the required thickness and density and this process is called “expansion” [33]. In the production process, the use of natural resources is a priority: 93% of energy needs for the production are covered by the use of biomass from the waste of the process itself (cork powder) [34].
The acoustic properties of cork result from its structure and chemical composition. Cork has up to 40 million air cells per 1 cm3, and 60% of the cork is air. Therefore, cork is characterized by good sound absorption, and it is able to absorb 30–70% of sound in the range from 400 to 4000 Hz. The structure of the cork and its elasticity make it capable of absorbing air and impact sounds and eliminating zones of acoustic bridges [35].

2.1.2. Hemp

Hemp is one of the most environmentally friendly materials. The plant can reach a height of 4500 mm in 120 days. From one hectare it is possible to collect 12 tons of dry raw material, from which 8 tons of material is produced. Rapid growth causes the plants to obscure the soil, preventing it from becoming clogged. As a result, it does not need any herbicides. It contains substances that naturally repel insects, so that no insecticides are needed to protect it. It can be planted and harvested in the same field for several years [33]. Insulation materials based on technical hemp are made of hemp fibre, with the majority of hemp sheath complemented by artificial bicomponent fibres based on polyester which ensure better compactness of the product [36]. Insulation boards also often consist of hemp swarf and hydraulic lime. The blocks are pressed to the required thickness and dimensions and then cured and dried in fresh air without the need for any energy input of heat [37].
Hemp has good sound absorption due to its open pore structure. The long, flexible and tough hemp fibres significantly weaken the intensity of sound waves. This is the basis for the use of hemp insulation as high-quality acoustic insulation and sandwich compositions to increase insulation of airborne sound [38].

2.1.3. Fibreboard

Samples from a single-layer board made of magnesite-bonded wood wool with a fibre width of 1 mm were used for measurement. The board is characterized by its fine-pored natural surface, which has the potential to absorb sound.
The acoustic properties of fibreboards prepared with different densities and resin contents were the subject of a study [39]. Samples with lower density showed a higher sound absorption capacity. Observations confirmed that samples with different densities and resin contents had different porosity levels, and this was the main factor that controlled the ability to reduce noise. The fact that lower fibreboard density results in a higher sound absorption coefficient was also proved in [40].
Acoustic absorption may also depend on the type of wood. The acoustic properties of several types of wood from Europe as well as tropical areas were compared in [41]. The correlation between sound absorption and air permeability of three species of Japanese wood was investigated in [42].

2.1.4. Mineral Wool

The production process of rock mineral wool involves the processing of natural and abundant raw materials (volcanic rock), blast-furnace slag, recycled content (briquettes) and uses fusion and fiberizing techniques. The products obtained come in the form of a “mineral wool mat” consisting of a soft, airy structure. The mat is made of hydrophilic mineral wool, so that it has special parameters unlike standard mineral wool. The facade slabs with longitudinal fibre are suitable for composite external insulation systems, in which they are mechanically fastened with adhesive to a sufficiently cohesive and solid wall surface [43].
Mineral wool insulation is the most effective insulant at reducing sound transmission and reverberations. The fibre matrix with high density and porosity encourages the absorption of sound waves, converting them into heat energy, where other insulation types simply let the sound pass through [44].
However, from an environmental point of view mineral wool as a material poses a recycling problem. While the manufacturing waste is cleaner with a known composition that is commonly reintroduced into the manufacturing process, when disposing of post-consumer waste, the used waste is inappropriately sorted leading to unknown quality and contamination. Most waste rock wool consists of three major components—aluminium oxide (Al2O3), silicon dioxide (SiO2) and calcium oxide (CaO). These contaminants or dirt in the porous rock wool present the biggest hurdle to recycling efforts, making it the most apparent reason behind million tons of waste rock wool piling up every year in landfills and adversely affecting the environment [45]. The issue of waste and recycling of mineral wool as well as new possibilities for its reuse as a filler or as an absorbent for oils is discussed in more detail in [45,46,47].

2.1.5. PUR Foam

As already mentioned, PUR insulation represents the largest environmental burden of all insulation materials. The impacts on the environment of the production stage are mainly determined by raw material production and processing (GWP = 14.8 kg CO2 eq./m2, abiotic depletion potential for fossil resources (ADPF) = 306 MJ/m2). In all impact categories, upstream processes prior to the production of isocyanate have significant effects, especially in the ozone depletion potential (ODP) = 0.000234 kg CFC-11 eq./m2. Non-renewable primary energy consumption excluding non-renewable primary energy resources used as raw materials can mainly be attributed to the upstream processes within the production of isocyanate and polyol, approximately 70% in total (226 MJ/m2). The environmental load in the disposal phase is caused by the combustion of the PUR insulation board (GWP = 8.74 kg CO2 eq./m2, ADPF = 2.07 MJ/m2). All data refer to PUR foam with a thickness of 12 cm and a basis weight of 3.96 kg/m2 [3].
Due to their open pore structure, density and elasticity, PUR foams are characterized by good sound absorption, especially at high frequencies. Achieving better sound absorption at low frequencies using composite production with bamboo leaf particles has been demonstrated in [48]. Factors that affect the sound absorption coefficient such as thickness, density and flow resistivity have been observed in [49].

2.1.6. Propylat

Propylat is a non-woven fabric made mostly of recycled pieces of textile, which is produced for the purpose of noise reduction in car interiors. The basic raw material is cotton which is hardened by using thermoplastic fibres (polypropylene, polyamide, polyester, polyethylene). Depending on the field of application, propylat is manufactured in densities from 80 to 250 kg/m3. The particular characteristic of this material is that different densities can be produced within the same component. Thus, it is possible to combine characteristics like sound absorption and rigidity [50].
The influence of bonding methods on the sound absorption characteristic of recycled polyester/cotton nonwoven fabrics was discussed in [51]. The results indicated that recycled cotton and polyester fibrous materials could be effectively used as raw material for sound-absorbing nonwoven fabric at low cost in an eco-friendly manner. The effect of thickness, flow resistance and fibre size on the sound absorption coefficient of nonwovens was investigated in [52].
Given the global problem in the textile industry related to water use and pollution, greenhouse gas emissions and accumulation of waste in landfills, acoustic solutions from waste textiles are considered sustainable and ecological.

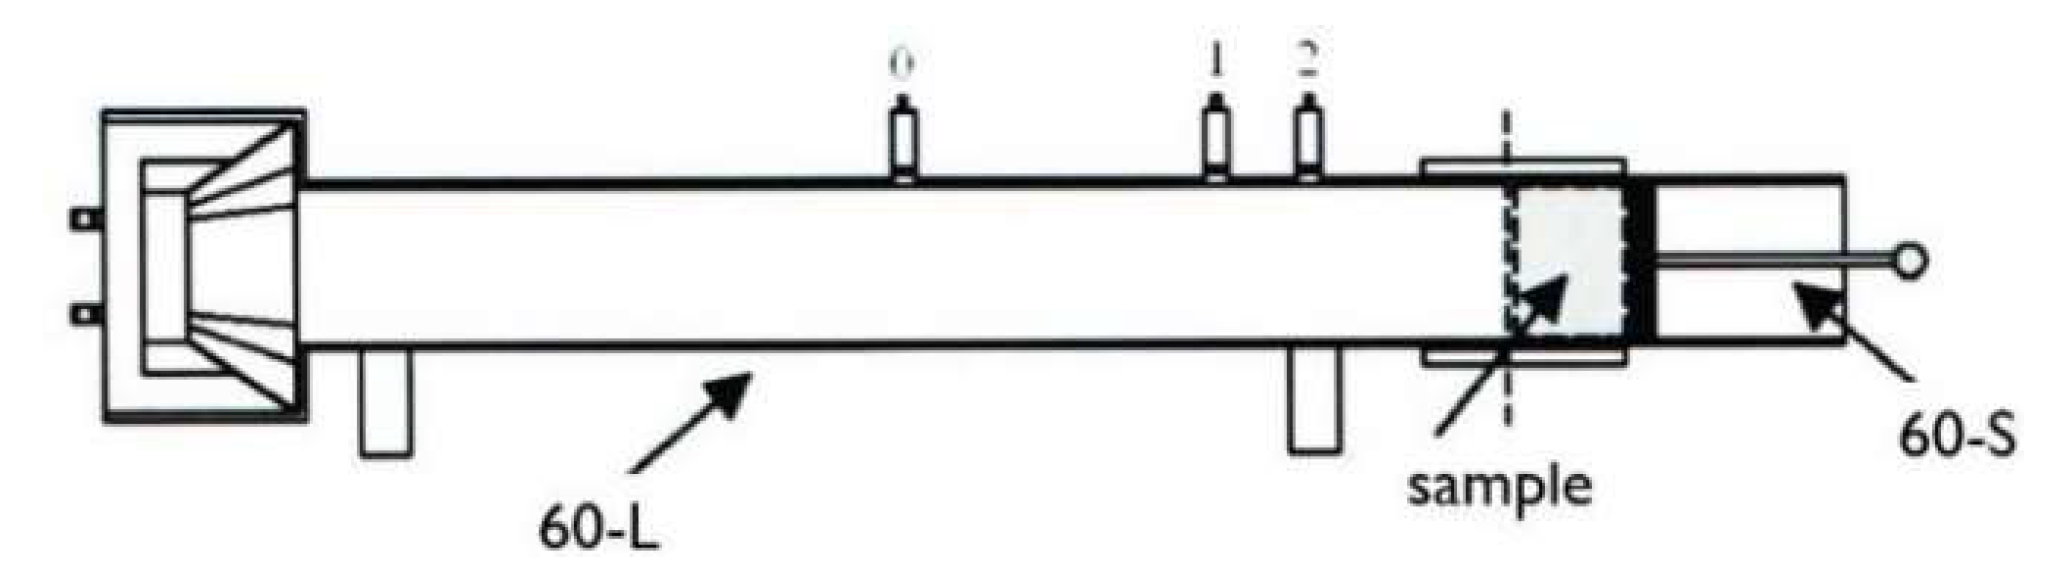
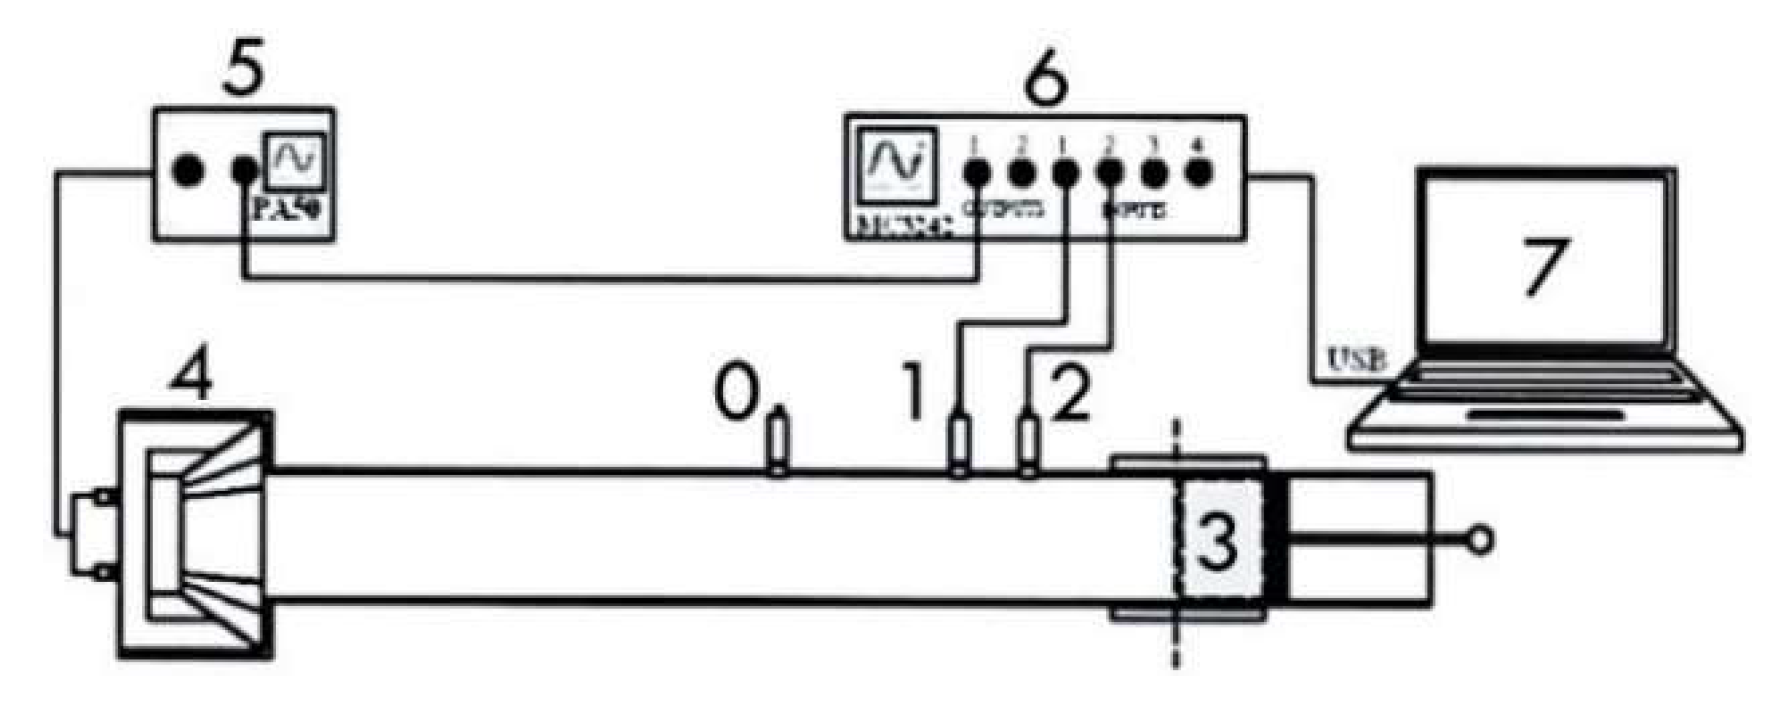
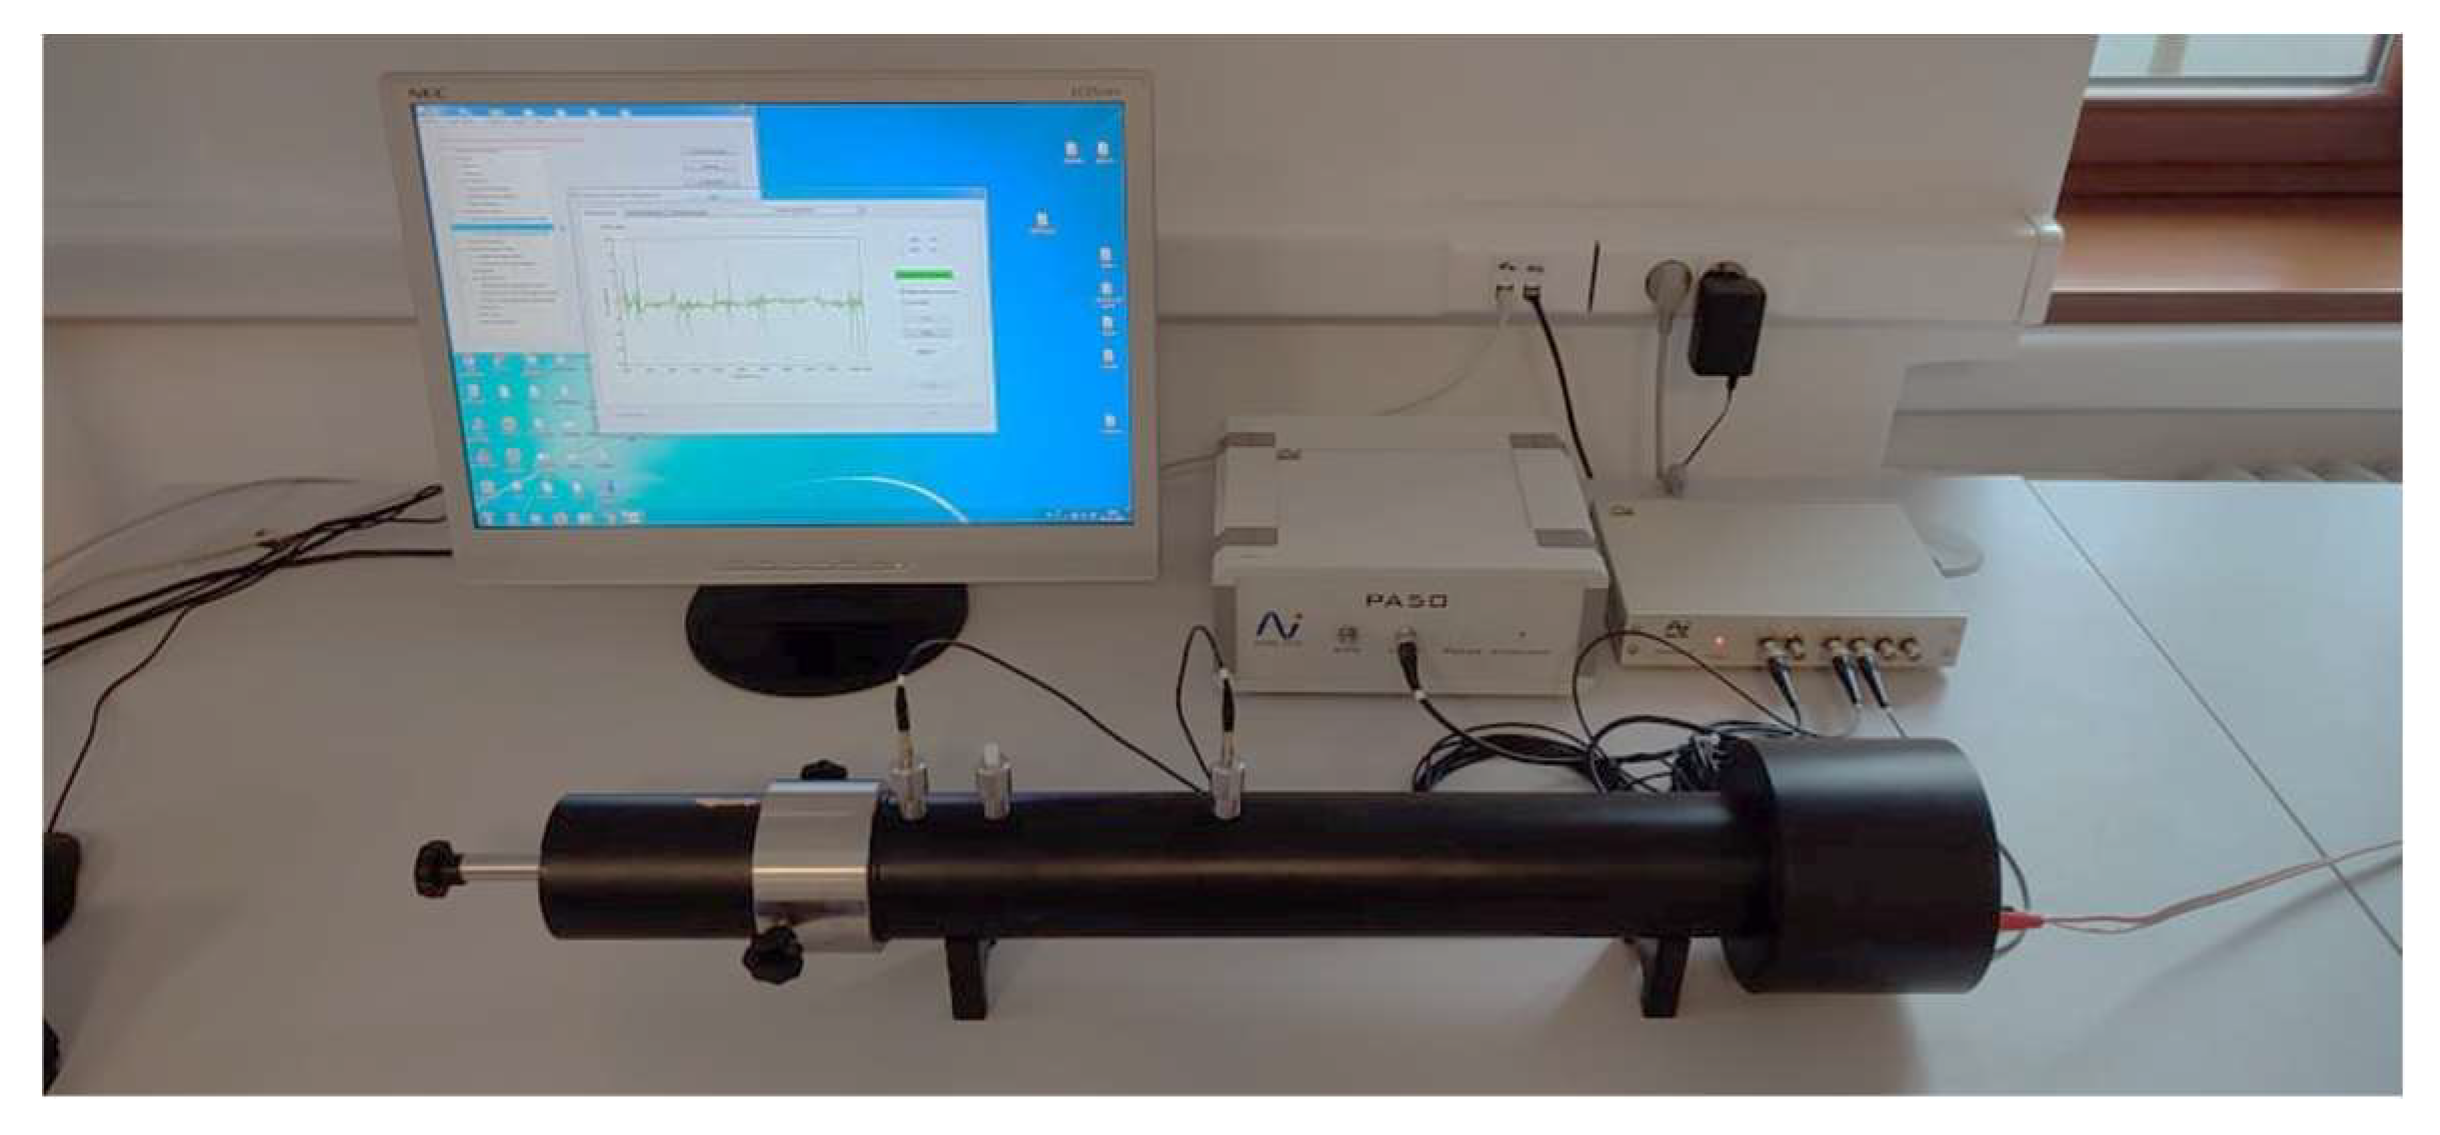
2.2. Measuring Setup with the Impedance Tube

For measurements an SW466 impedance tube from manufacturer BSWA TECH was used. The technical parameters of the measuring device are given in Table 1. The complete BSWA TECH SW466 impedance tube system contains [53]:
  • Built-in speaker as sound source;
  • Sample holders for measuring the sound absorption coefficient;
  • Extension tubes for measuring transmission attenuation;
  • Microphones and microphone cables;
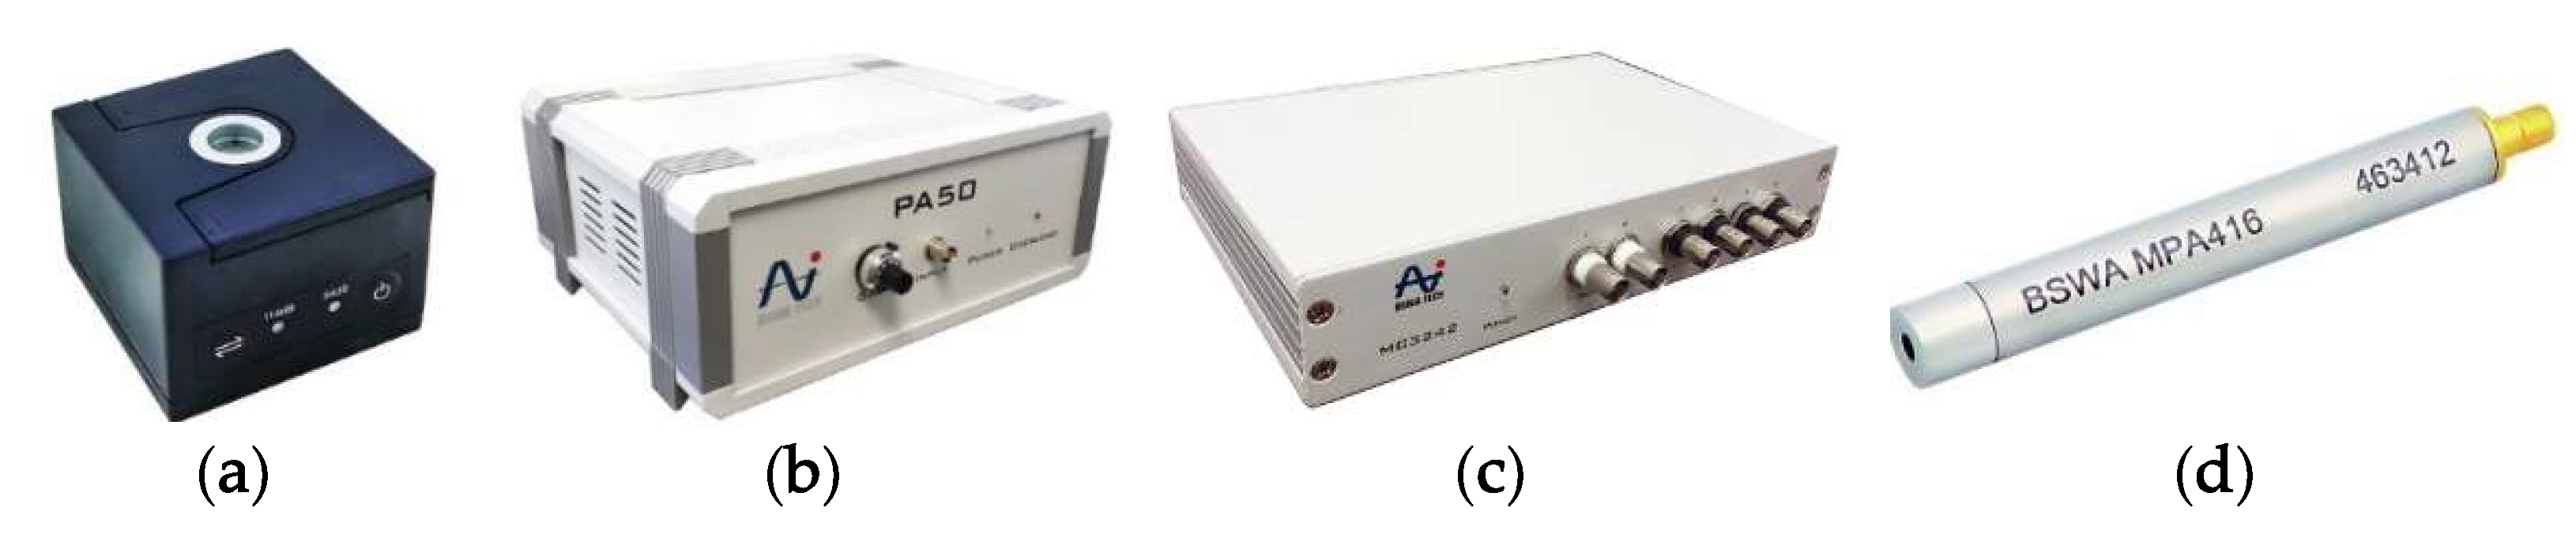
  • Microphone calibrator;
  • Hardware for signal generation and data collection;
  • Amplifier used to drive the loud speaker;
  • Software for analysis and evaluation of measured data.
Technical equipment of the BSWA TECH impedance tube is shown in Figure 2.
The measured parameter was the sound absorption coefficient (α), which can be defined as the ratio of sound energy absorbed by the material to the total impacted energy.
The measurement took place in two frequency bands: 100–800 Hz and 400–2400 Hz, which were combined using software into the resulting frequency band 100–2400 Hz. Each measurement was repeated 5 times to avoid errors.
The system for measuring the sound absorption coefficient (α) for the frequency bands 100–800 Hz and 400–2500 Hz is shown in Figure 3. The system consists of [54]:
  • Tube with an inner diameter of 60 mm (60-L);
  • Measuring sample holder with an inner diameter of 60 mm (60-S).
The measurement was performed according to the microphone exchange method recommended by the standard to avoid errors. In both frequency bands, the micro-phones exchanged their position six times [55]. The connection of the measuring chain for individual frequency bands is shown in Figure 4 and Figure 5.

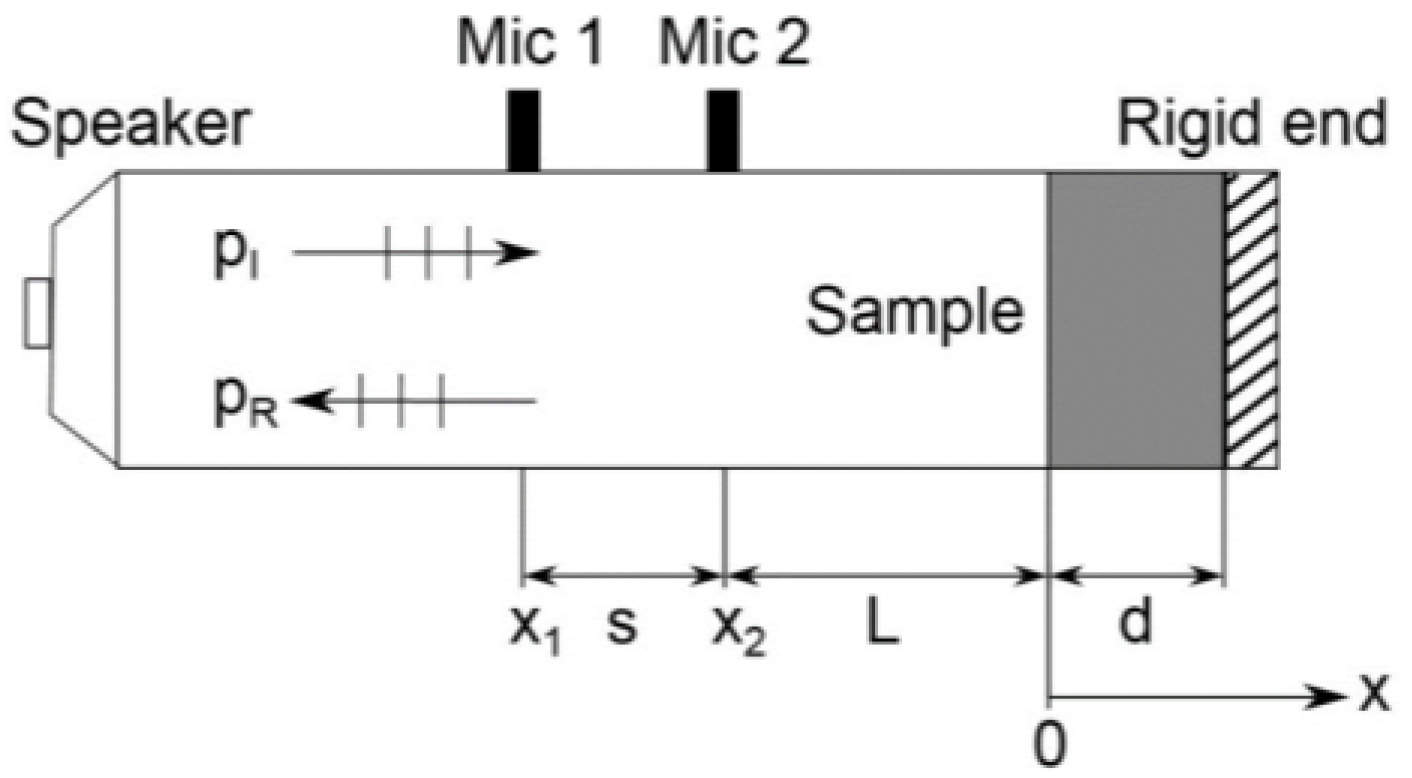
2.3. Mathematical Determination of the Sound Absorption Coefficient Using Transfer Function Method (Two-Microphone Method)
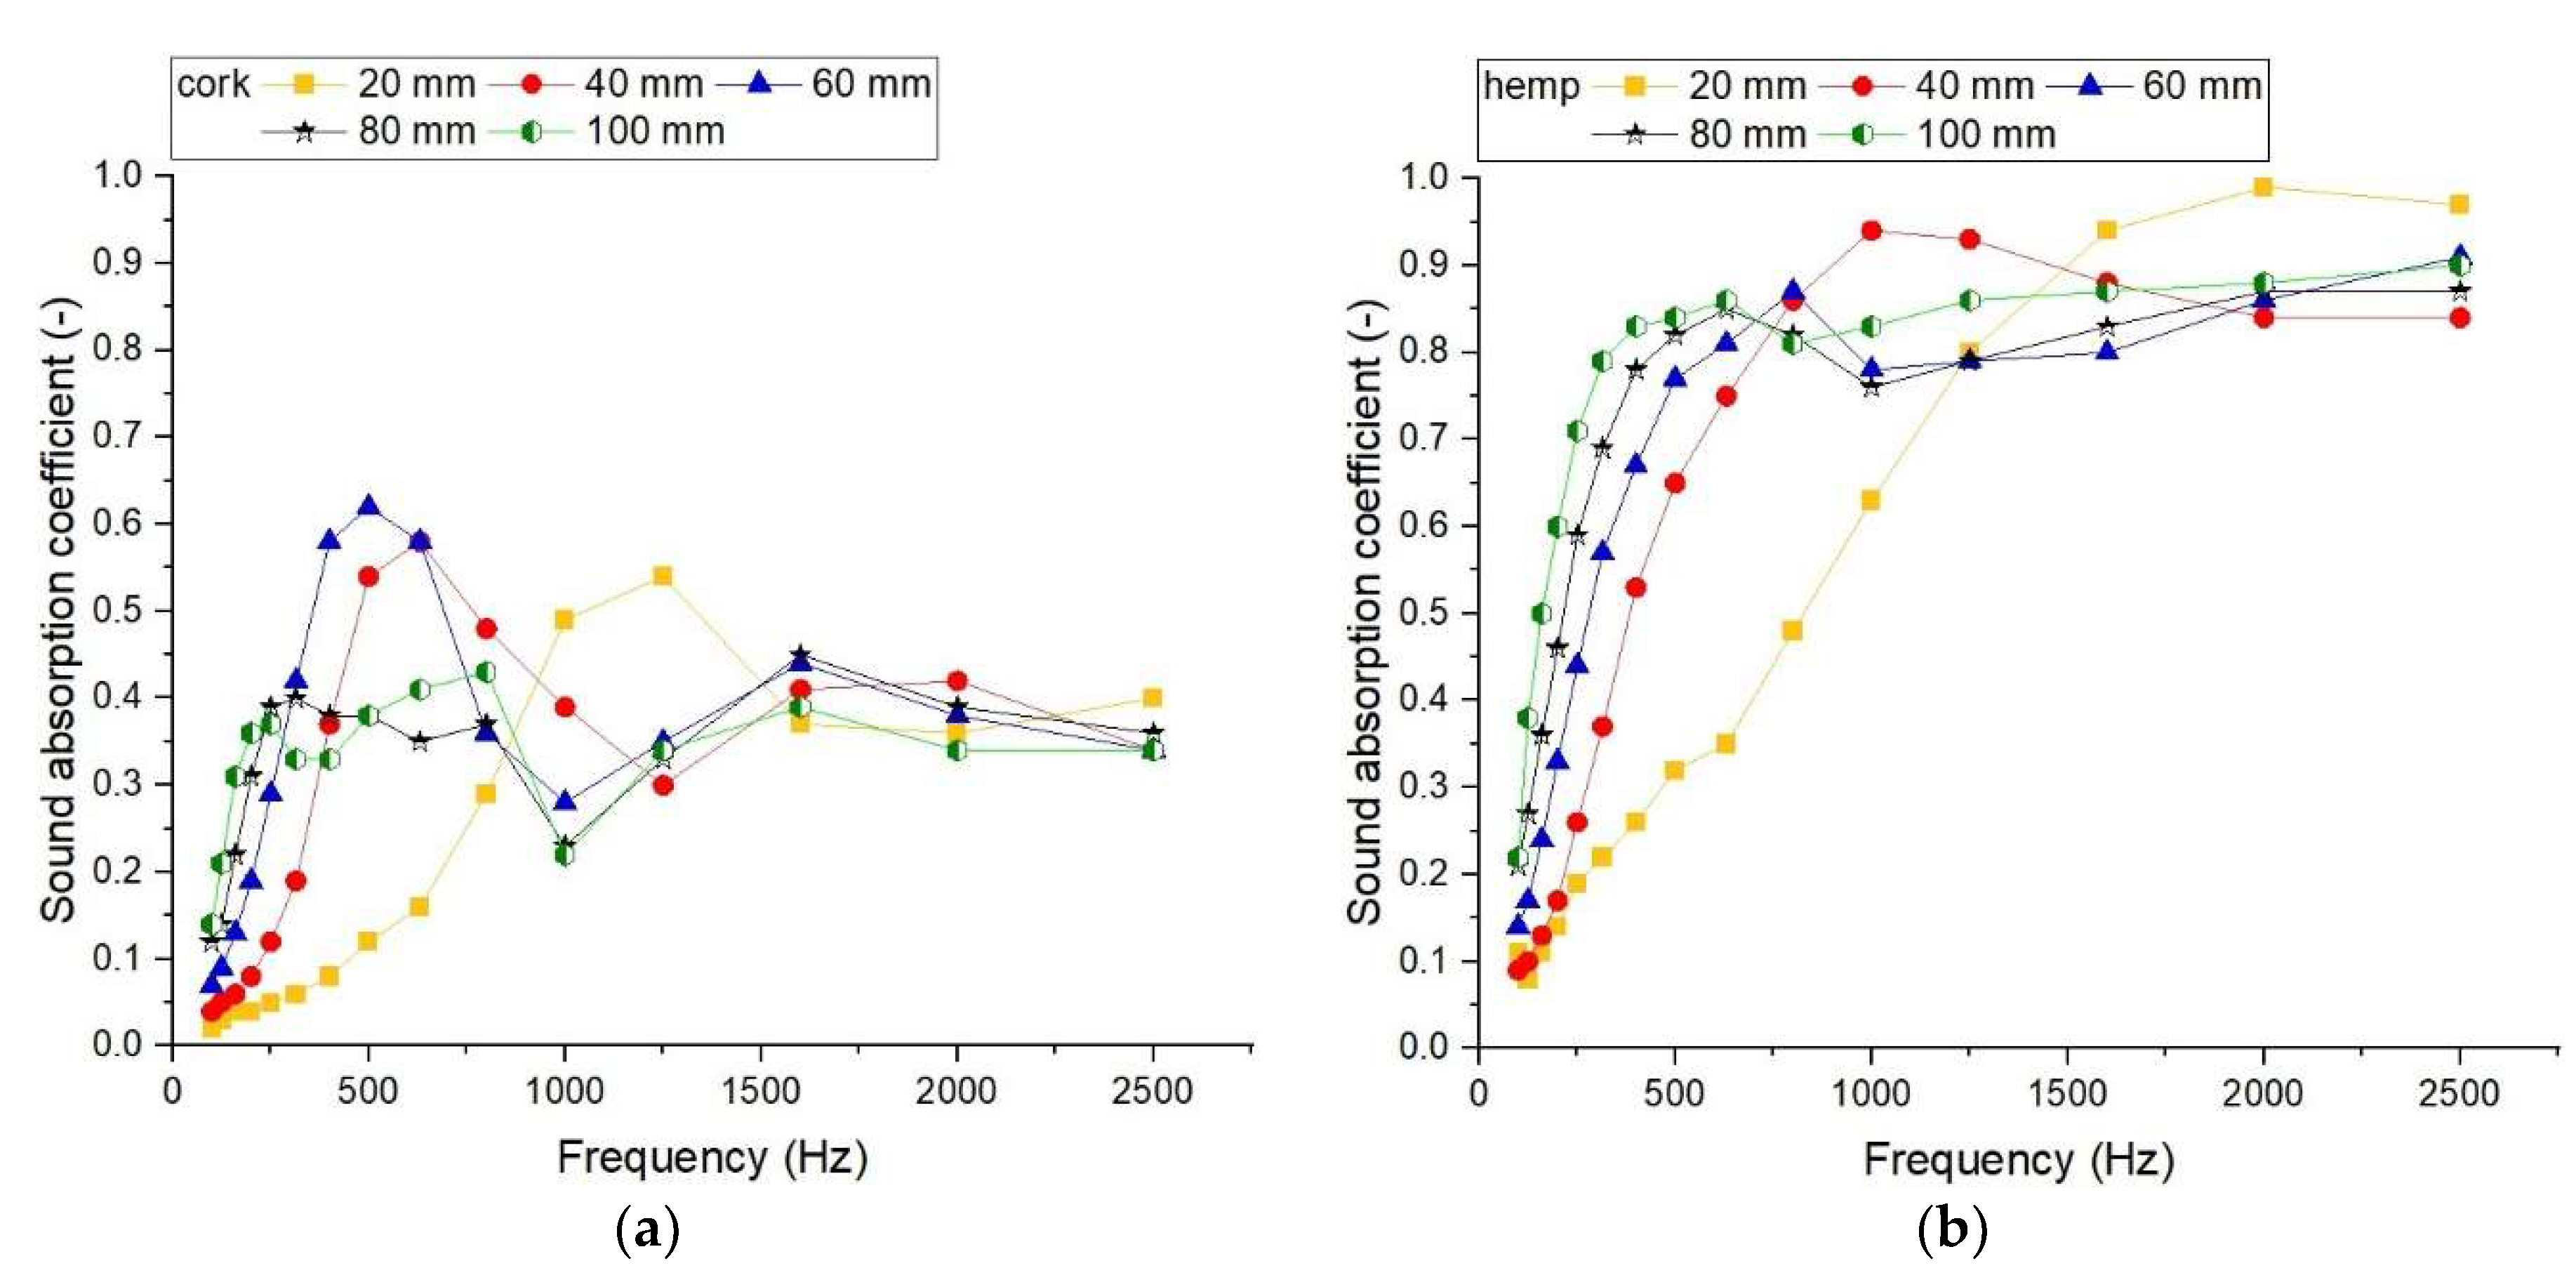
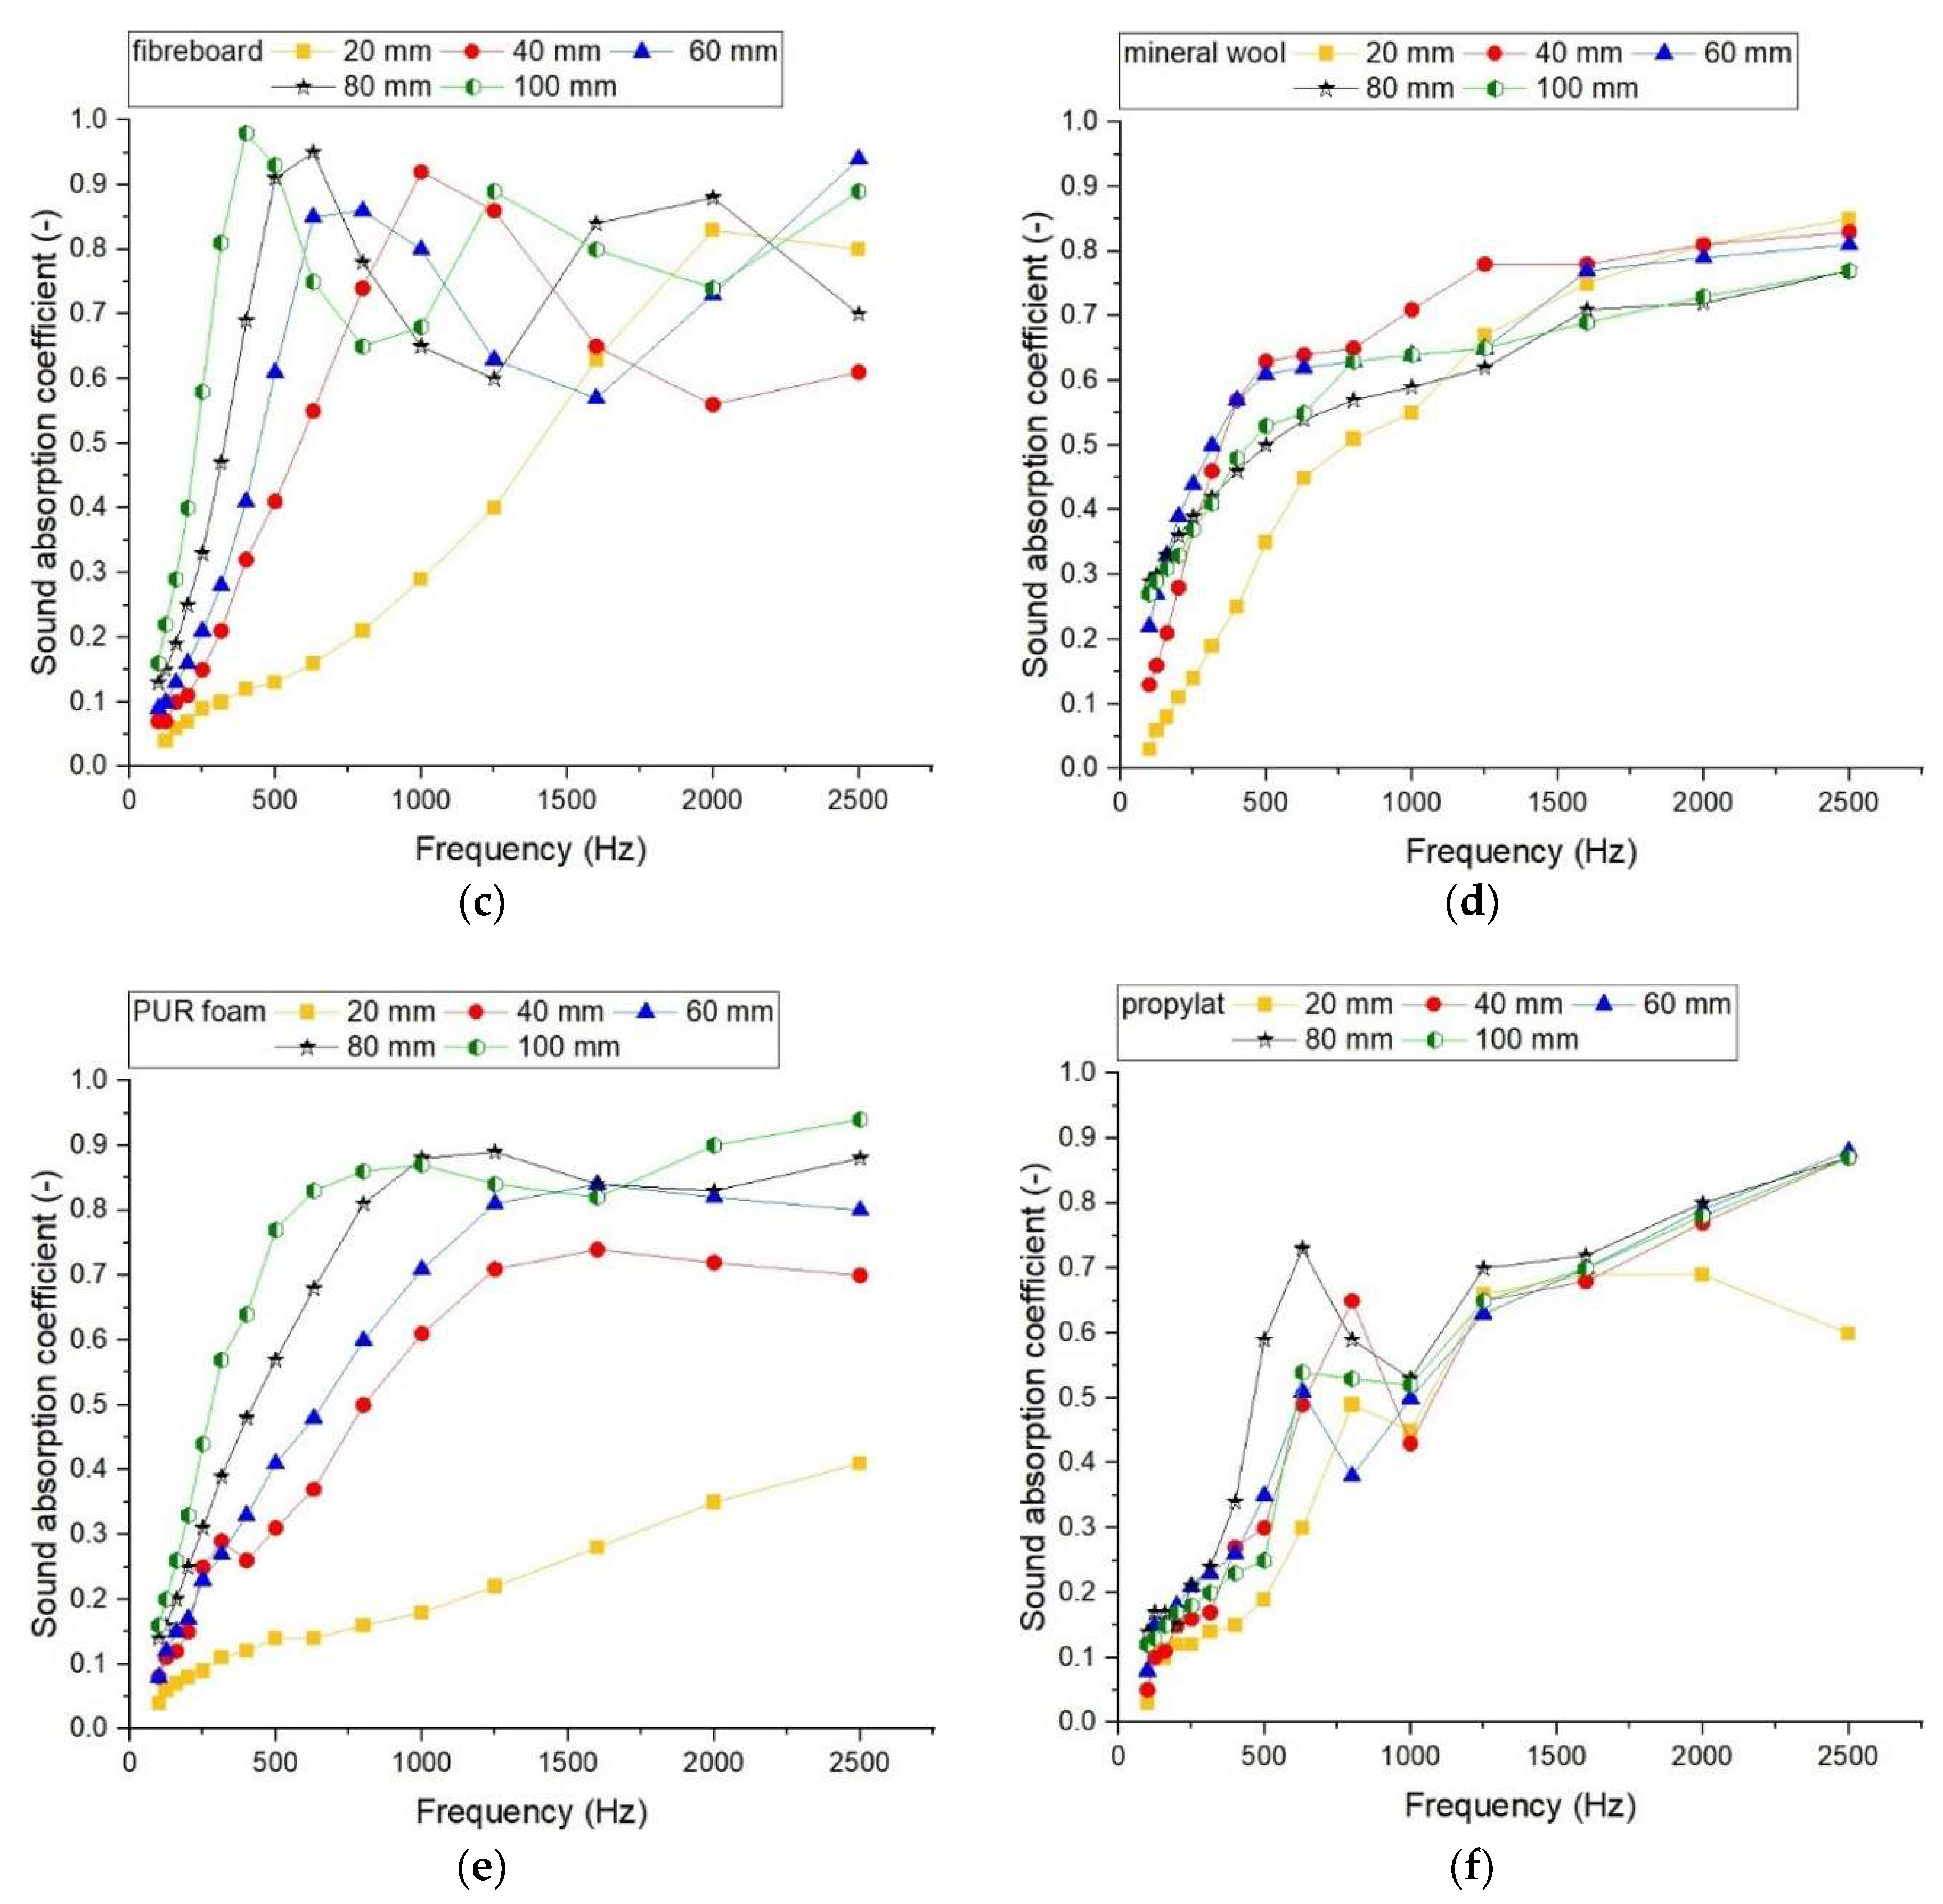
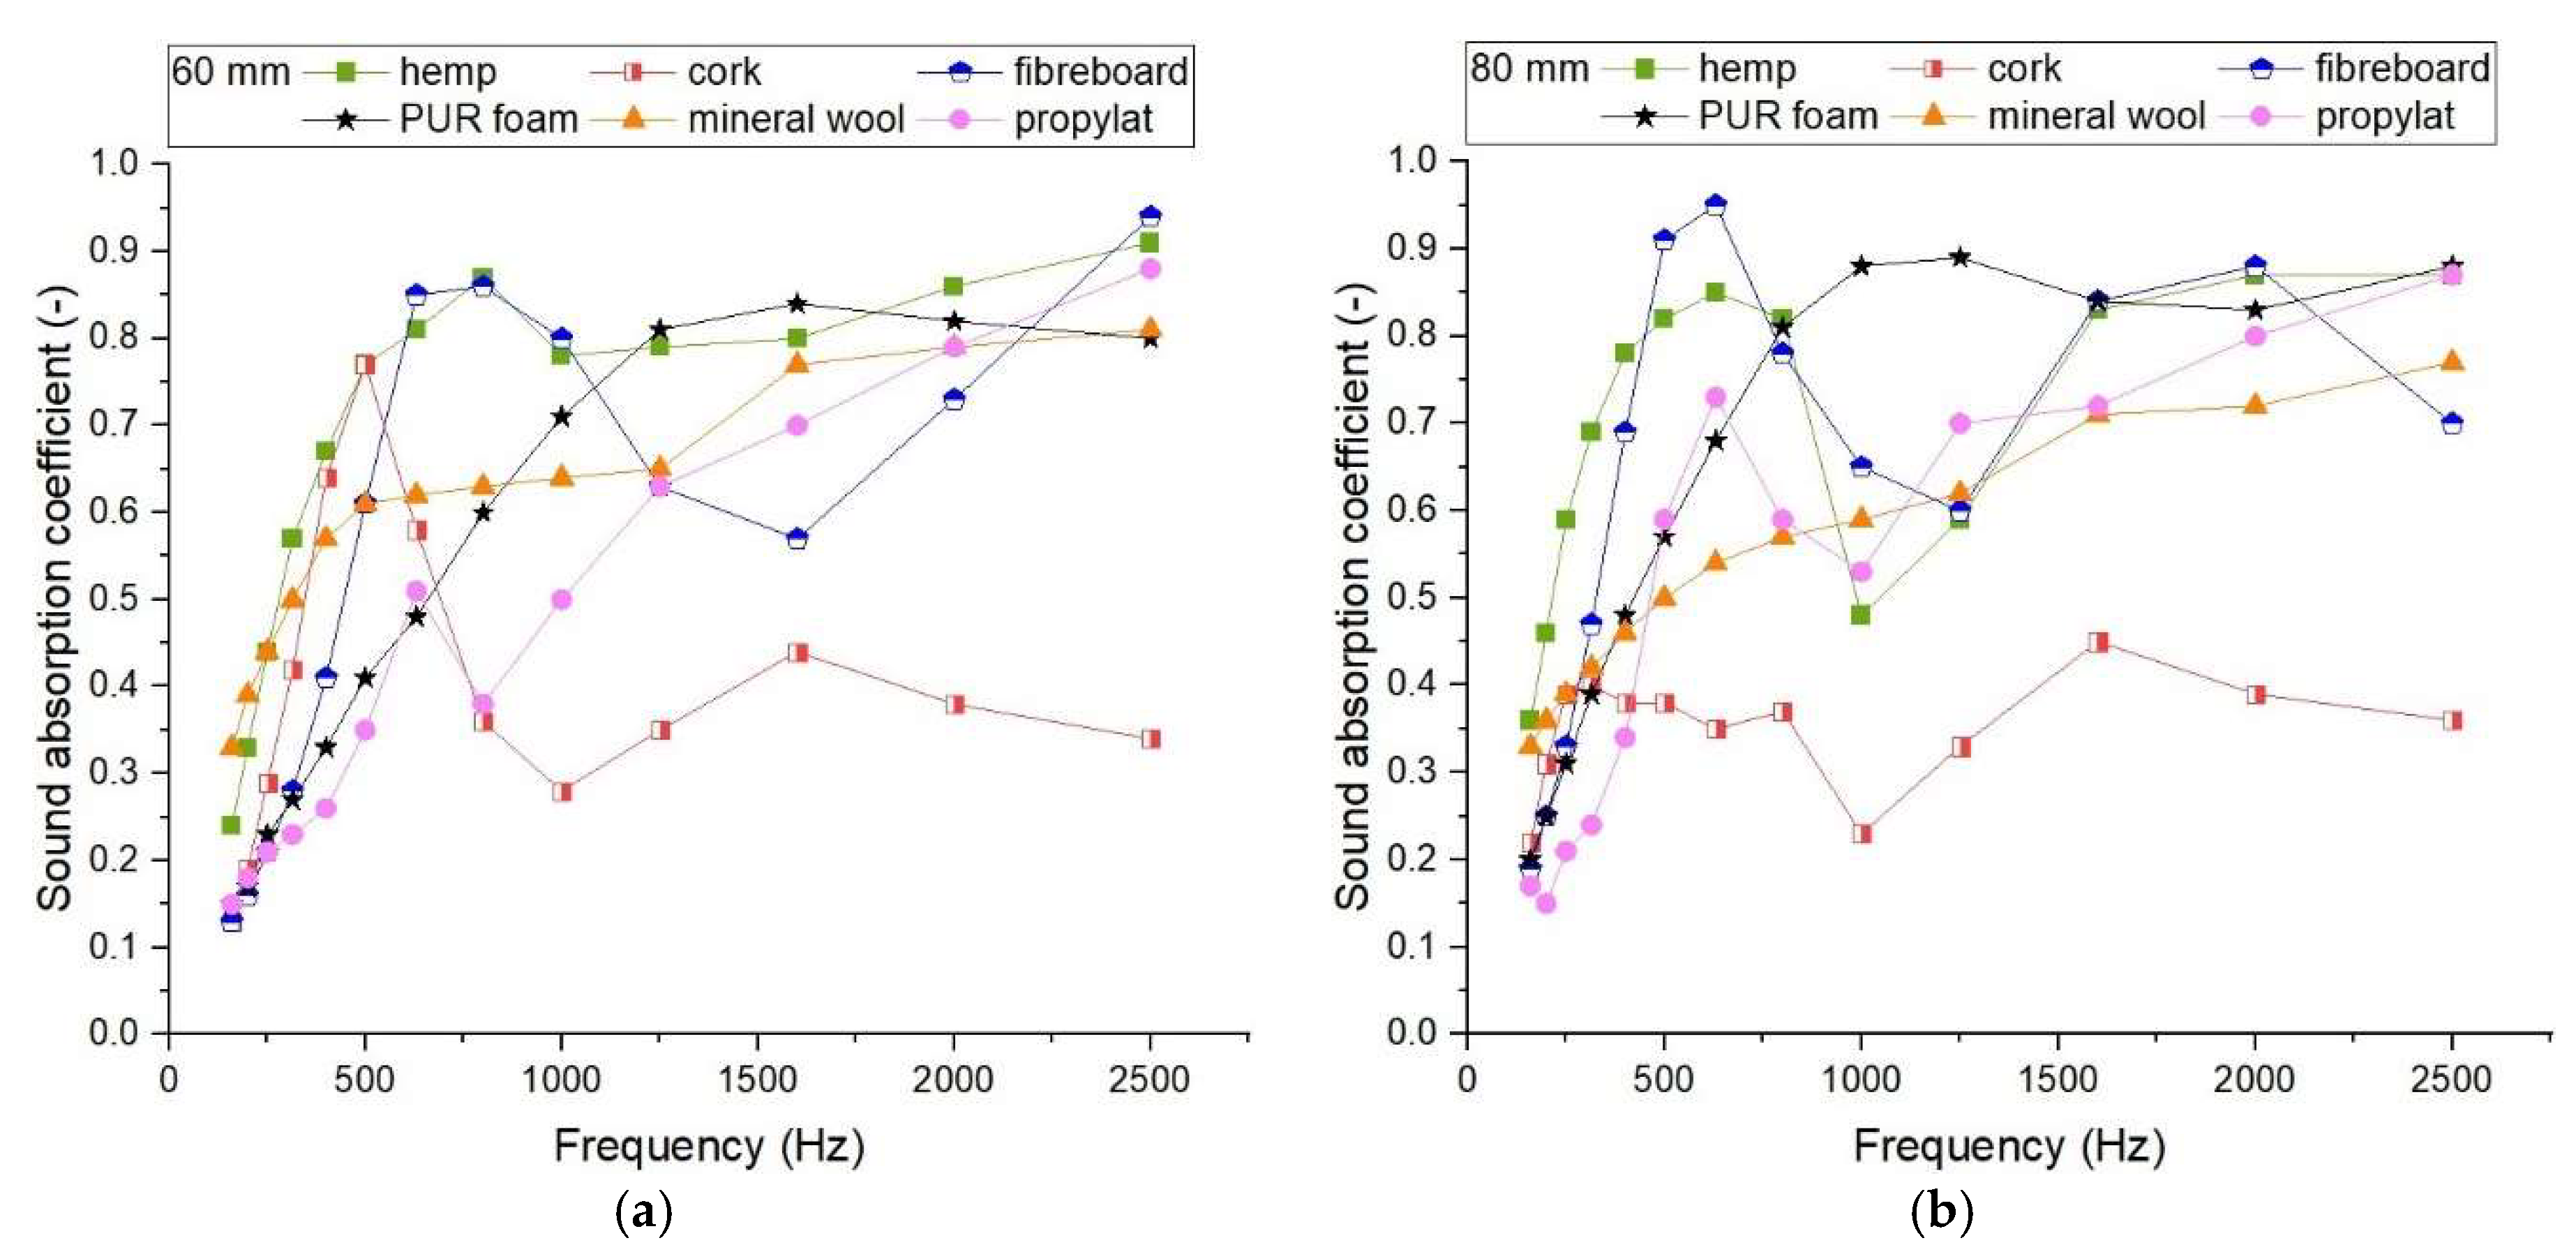
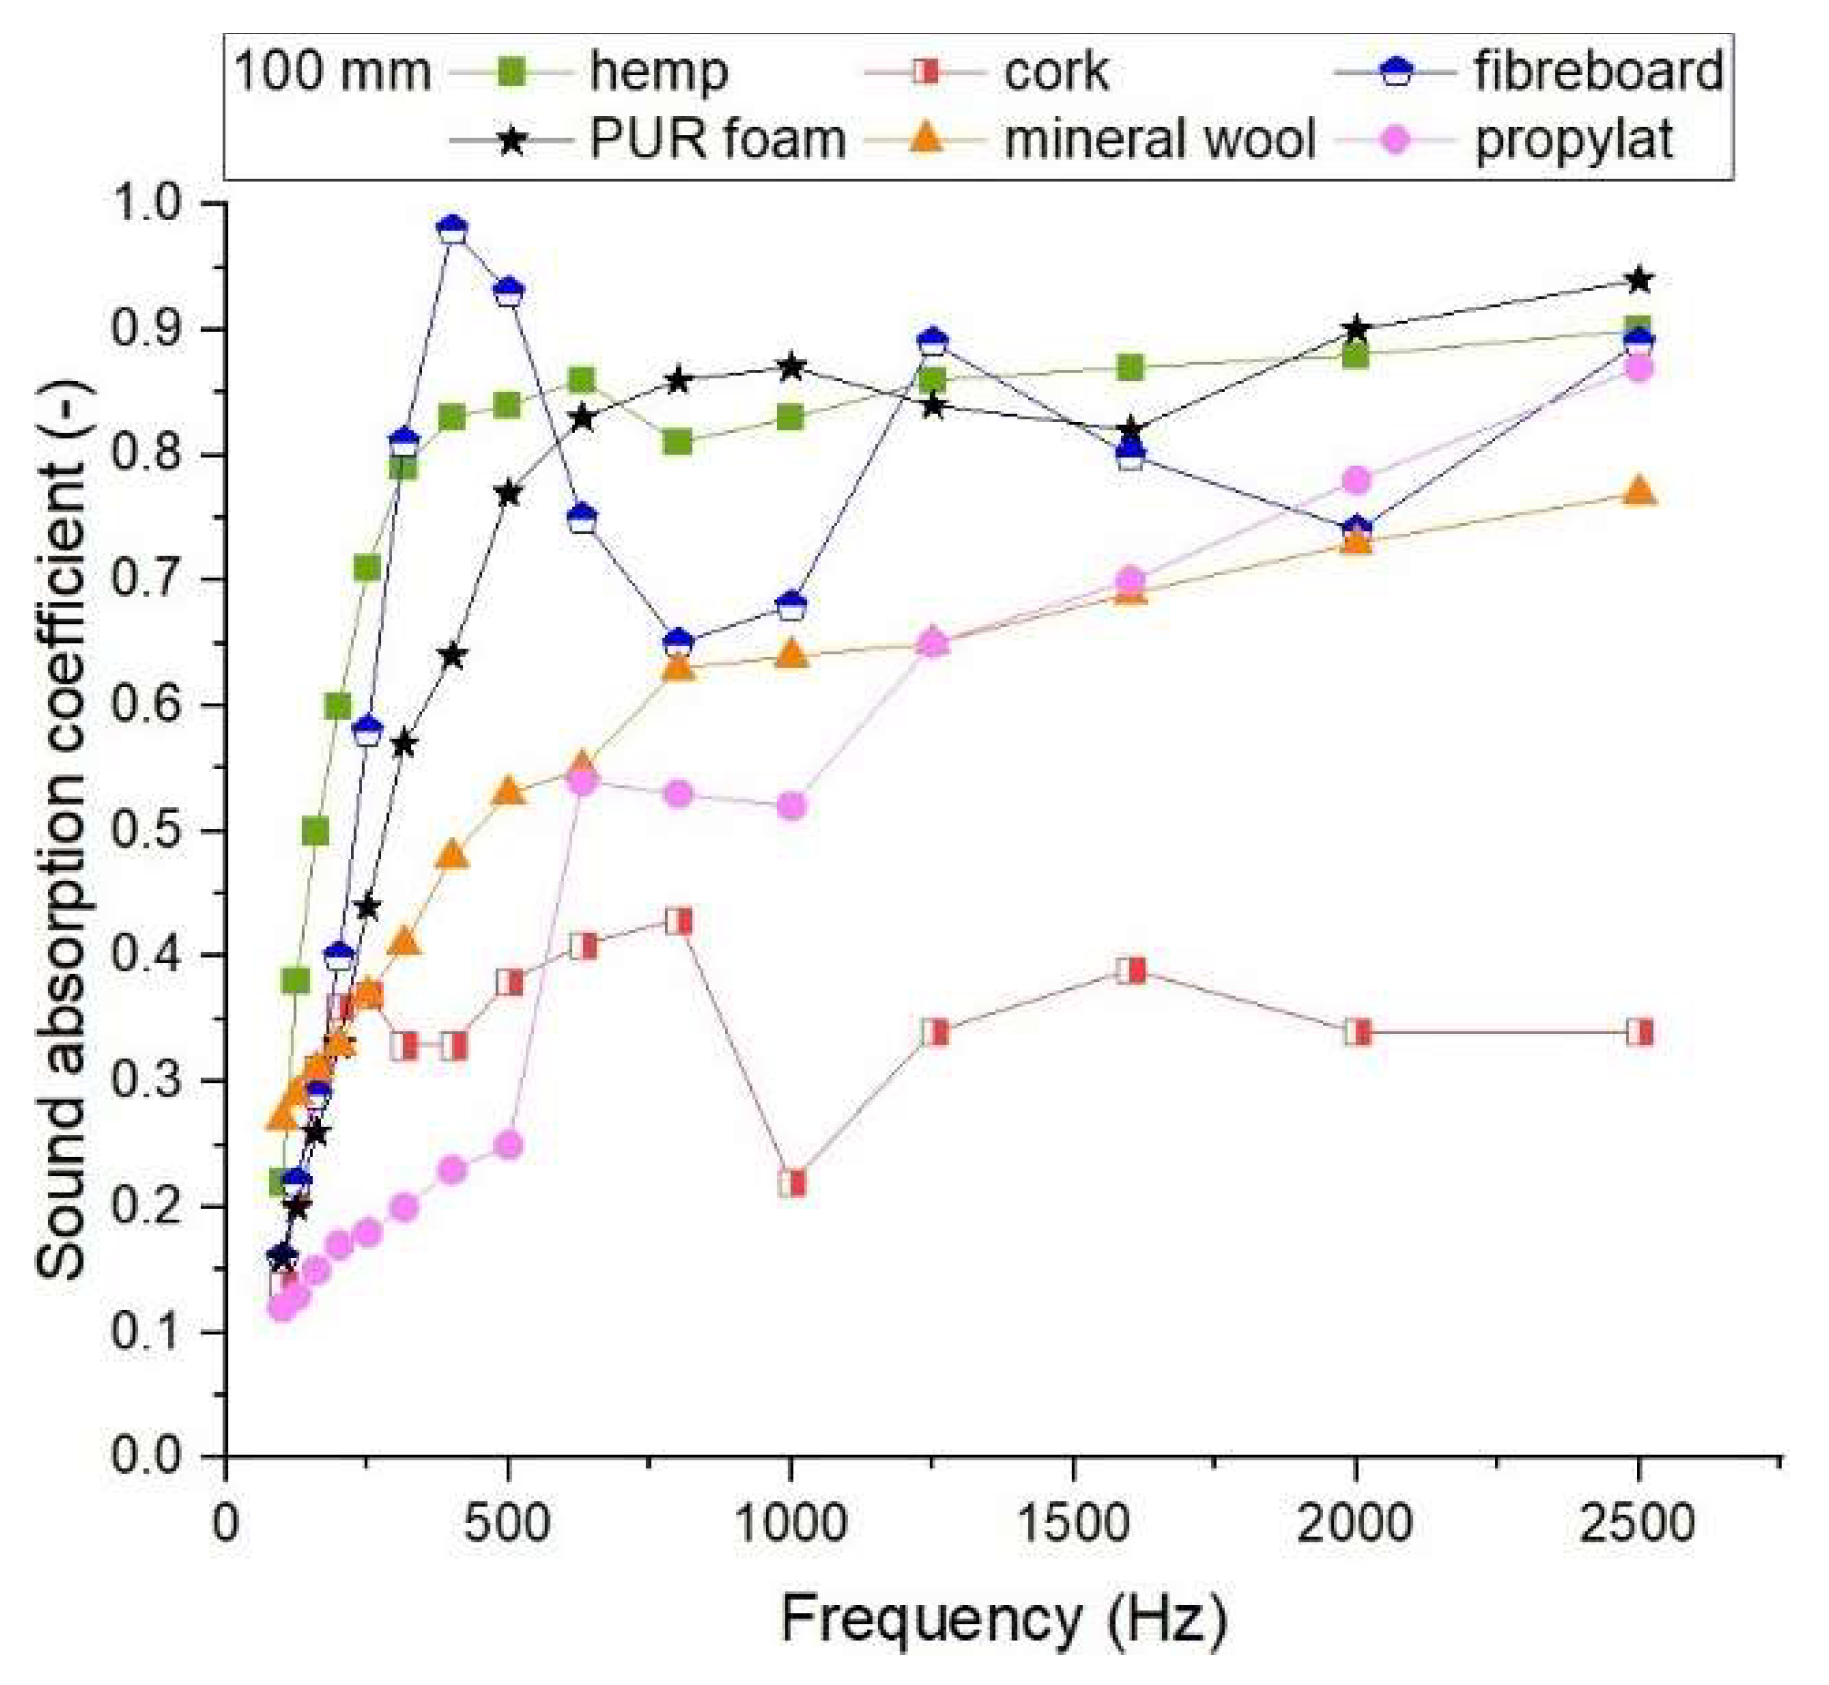
In this test method, plane waves are generated in the tube by the noise source. The decomposition of the interference field is achieved by the measurement of acoustic pressures at two fixed locations using wall-mounted microphones, and subsequent calculation of the complex acoustic transfer function H12, the normal incidence absorption and the impedance ratios of the acoustic material (Figure 6) [56].
The sound pressures of the incident wave pI and the reflected wave pR are, respectively [55]:
p I = p ^ I e jk 0 x
and
p R = p ^ R e jk 0 x
where k 0 —complex wave number ( k 0 = k 0 jk 0 ).
The sound pressures p1 and p2 in the two microphone positions are
p 1 = p ^ I e jk 0 x 1 + p ^ R e jk 0 x 1
and
p 2 = p ^ I e jk 0 x 2 + p ^ R e jk 0 x 2
The transfer function for the incident wave alone HI is:
H I = p 2 I p 1 I e jk 0 ( x 1 x 2 ) = e jk 0 S
Similarly, the transfer function for the reflected wave alone HR is:
H R = p 2 R p 1 R e jk 0 ( x 1 x 2 ) = e jk 0 S
The transfer function H12 for the total sound field may now be obtained by using Equations (3) and (4) and noting that p ^ R = rp I , as:
H 12 = p 2 p 1 = e jk 0 x 2 + re jk 0 x 2 e jk 0 x 1 + re jk 0 x 1
Transposing Equation (7) to yield r, and using Equations (5) and (6), one has:
r = H 12 H I H R H 12 e 2 jk 0 x 1
The sound reflection factor r at the reference plane (x = 0) can now be determined from the measured transfer functions, the distance between the sample and the far microphone location x 1 and the wave number k 0 , which may include the tube attenuation constant k 0 .
The equation for the normal incidence sound absorption coefficient is:
α = 1 | r | 2 [ ]

3. Results

The sound absorption coefficient is a dimensionless number ranging from 0 to 1. The closer its value is to 1, the more sound the material can absorb. The measured results for a single material in all its thicknesses are shown in Figure 7. Comparisons of results for individual thicknesses and materials are shown in Figure 8, Figure 9 and Figure 10.
The highest value of materials based on natural fibres was measured for hemp (α = 0.99 (2000 Hz, 20 mm)). Hemp also achieved excellent values at other thicknesses and frequencies: α = 0.97 (2500 Hz, 20 mm), 0.94 (1600 Hz, 20 mm), 0.91 (2500 Hz, 60 mm) and 0.9 (2500 Hz, 100 mm). The fibreboard with values of 0.98 (400 Hz, 100 mm), 0.95 (630 Hz, 80 mm) and 0.94 (2500 Hz, 60 mm) approached the maximum absorption. The maximum for cork was 0.77 (500 Hz, 60 mm).
Among the conventional materials, the best values were recorded for PUR foam, namely 0.94 (2500 Hz, 100 mm), 0.9 (2000 Hz, 100 mm) and 0.89 (1250 Hz, 80 mm). Similar values occurred for propylat: 0.88 (2500 Hz, 60 mm) and 0.87 (2500 Hz, 40 mm/100 mm). The best result for the mineral wool sample was 0.85 (2500 Hz, 100 mm).
From all the materials tested, hemp achieved the highest absorption. In general, the acoustic performance of materials increased with a frequency.
At a thickness of 20 mm, in the case of PUR foam and mineral wool, a rising trend across the overall frequency range can be read from the graph (mineral wool: α = min. 0.03 (100 Hz)—max. 0.85 (2500 Hz); PUR foam: α = min. 0.04 (100 Hz)—max. 0.41 (2500 Hz)). A gradual increase in values with increasing frequency in almost the entire frequency range can also be observed for hemp and fibrewood, with the exception of a decrease at 2500 Hz (hemp: α = min. 0.11 (100 Hz)—max. 0.99 (2000 Hz), α = 0.97 (2500 Hz); fibreboard: α = min. 0.06 (100 Hz)—max. 0.83 (2000 Hz), α = 0.8 (2500 Hz)). The trend of rising, falling and rising (R-F-R trend) was recorded for cork and propylat. The values of the sound absorption coefficient of the cork sample increased up to 1250 Hz, where the highest absorption for the cork was measured (α = min. 0.02 (100 Hz)—max. 0.54 (1250 Hz)). Then the values decreased (1600–2000 Hz) and increased again at 2500 Hz. In the case of propylat, the value decreased at two points, at 1000 (α = min. 0.45) and 2500 Hz (α = min. 0.45), with the highest value being measured at 2000 Hz (α = min. 0.03 (100 Hz), max. 0.7 (2000 Hz)).
In the frequency range 100–400 Hz (α = 0.11–0.26) and 1000–2500 Hz (α = 0.63–0.97), the highest values of the sound absorption coefficient were measured for hemp. At 500–800 Hz in the graph, mineral wool was the leader (α = 0.35–0.51). The lowest values in the frequency band 100–500 Hz were measured for cork (α = 0.02–0.12) and at 630–2500 Hz for PUR foam (α = 0.14–0.41).
It can be stated that at a thickness of 40 mm, the sound absorption of mineral wool increased with the frequency (α = min. 0.13 (100 Hz)—max. 0.83 (2500 Hz)). An increasing trend can also be observed for propylat with a single decrease at 1000 Hz (α = min. 0.05 (100 Hz)—max. 0.87 (2500 Hz), α = 0.43 (1000 Hz)) and for PUR foam with a decrease in the highest frequencies (α = min. 0.08 (1000 Hz)—max. 0.74 (1600 Hz), α = 0.72 (2000 Hz), α = 0.7 (2500 Hz)). The values of the sound absorption coefficient of the hemp sample increased up to the frequency of 1000 Hz, where the maximum was reached (α = min. 0.09 (100 Hz)—max. 0.94 (1000 Hz)), then slowly decreased. The highest value for the fibreboard sample was measured at a frequency of 1250 Hz (α = min. 0.07 (100 Hz)—max. 0.86 (1250 Hz)) followed by a decrease up to a frequency of 2500 Hz, when a slight increase was again recorded. The cork values increased up to 630 Hz, where the highest value for the cork was measured (α = min. 0.04 (100 Hz)—max. 0.58 (630 Hz)), then the values fell (800–1250 Hz), rose (1600–2000 Hz) and fell again (2500 Hz).
The best ability to absorb sound in the frequency range 100–400 Hz was demonstrated by mineral wool (α = 0.13–0.57), and at 500–2500 Hz by hemp (α = 0.13–0.94). At the frequency of 100–250 Hz, the lowest values were measured for cork (α = 0.04–0.12) and at a frequency of 800–2500 cork (α = 0.3–0.48). The lowest sound absorption coefficient at 315 Hz (α = 0.15) and at 500 Hz (α = 0.3) was measured for propylat, and at 400 Hz (α = 0.26) and at 630 Hz (α = 0.37) for PUR foam.
Within a thickness of 60 mm, the sound absorption of mineral wool increased along with the frequency (α = min. 0.22 (100 Hz)—max. 0.81 (2500 Hz)). The values of the PUR foam sound absorption coefficient increased up to a frequency of 1600 Hz, at which the highest value was reached (α = min. 0.08 (100 Hz)—max. 0.84 (1600 Hz)), before decreasing slightly (2000–2500 Hz). The values measured for hemp increased up to a frequency of 800 Hz (α = min. 0.14 (100 Hz)–0.87 (800 Hz)), decreased slightly at a frequency of 1000 Hz (α = 0.78), and from 1250 Hz (α = 0.79) increased again, with the highest value recorded at 2500 Hz (α = max. 0.91). A similar R-F-R trend occurred for fibreboard and propylat. For fibreboard, the sound absorption coefficient increased up to a frequency of 800 Hz (α = min. 0.09 (100 Hz)–0.86 (800 Hz)), decreased at 1000 Hz (α = 0.8), 1250 Hz (α = 0.63) and 1600 Hz (α = 0.57), and increased again at 2000 Hz (α = 0.73) and 2500 Hz (α = max. 0.94). Cork achieved its highest ability to absorb sound at a frequency of 500 Hz (α = min. 0.07 (100 Hz)—max. 0.62 (500 Hz)). As can be seen in the graph after reaching the maximum, the values decreased (800–1000 Hz), increased (1250–1600 Hz) and decreased again (2000–2500 Hz).
The best results in the frequency band 100–250 Hz were measured for mineral wool (α = 0.22–0.44), with the same value at a frequency of 250 Hz (α = 0.44) being shared with hemp. Subsequently, from 315 Hz to 500 Hz, hemp had the highest values (α = 0.57–0.77), which it maintained even at 2000 Hz (α = 0.86) and 2500 Hz (α = 0.91). In the frequency band 630–1000 Hz, wood dominated (α = 0.8–0.86) and in the band 1250–1600 PUR foam (α = 0.81–0.84). Cork performed worst at the lowest frequencies of 100 Hz (α = 0.07) and 125 Hz (α = 0.09), and also at higher frequencies from 800 to 2500 Hz (α = 0.28–0.44). From 160 to 250 Hz the lowest sound absorption capacity was for wood (α = 0.13–0.21), from 315 to 500 Hz for propylat (α = 0.23–0.35) and at a frequency of 630 Hz for PUR foam (α = 0.48).
As with all other thicknesses, at 80 mm the values for mineral wool increased with frequency (α = min. 0.29 (100 Hz)–max. 0.77 (2500 Hz)). The R-F-R trend was observed for PUR foam, hemp and propylat. PUR foam measured its highest value at a frequency of 1250 Hz (α = max. 0.89); from a frequency of 1600 Hz (α = 0.84) to 2000 Hz (α = 0.83) there was a decrease and at the highest frequency of 2500 Hz (α = 0.88) the value again was just below the highest. The minimum value at the lowest frequency of 100 Hz was α = min 0.14. The sound absorption coefficient of the hemp sample increased up to a frequency of 630 Hz (α = min. 0.21 (100 Hz)–0.85 (630 Hz)). The rising trend was interrupted in the frequency range 800–1250 Hz (α = 0.82–0.79) and resumed from 1600–2500 Hz (α = 0.83–max. 0.87). The increase in values for the propylat sample was maintained up to 630 Hz (α = min. 0.14 (100 Hz)–0.73 (630 Hz)), a decrease occurred from 800–1000 Hz (α = 0.59–max. 0.53) and the values again climbed to a maximum of 1250 to 2500 Hz (α = 0.7–max. 0.87). In the case of fibreboard, the values repeatedly increased and decreased, with the highest value at a frequency of 630 Hz (α = min. 0.13 (100 Hz)–max. 0.95 (630 Hz), α = 0.78–0.6 (800–1250 Hz), α = 0.84–0.88 (1600–2000 Hz), α = 0, 7 (2500 Hz)). The values for cork repeatedly increased slightly and decreased several times (α = min. 0.12 (100 Hz), α = max. 0.45 (1600 Hz)). A more significant decrease occurred at 1000 Hz (α = min. 0.23).
In the frequency band 100–125 Hz (α = 0.29–0.3), the highest values were recorded for mineral wool, at 200–400 Hz (α = 0.46–0.78) and at 800 Hz (α = 0.82) for hemp, at 500–630 Hz (α = 0.91–0.95) for fibreboard and at 1000–2500 Hz (α = 0.83–0.89) for PUR foam. At 1600 Hz, the PUR foam and fibreboard shared the same value (α = 0.84). The lowest values were measured for cork in the frequency range 100–125 Hz (α = 0.12–0.14) and 500–2500 Hz (α = 0.23–0.45), and at 160–400 Hz (α = 0.17–0.34) for propylat.
Even at a thickness of 100 mm, the frequency-dependent rising trend of the mineral wool did not change (α = min. 0.27 (100 Hz)—max. 0.77 (2500 Hz)). The rising curve of hemp only decreased slightly at a frequency of 800 Hz (α = min. 0.22 (100 Hz), α = 0.81 (800 Hz), α = max. 0.9 (2500 Hz)). A similar condition can be found for propylat (α = min. 0.12 (100 Hz), α = 0.84–0.82 (1250–1600 Hz), α = max. 0.94 (2500 Hz)) and PUR foam (α = min. 0.16 (100 Hz), α = 0.52 (1000 Hz), α = max. 0.87 (2500 Hz)). The coefficient of sound absorption of wood fibre increased to 400 Hz, where the maximum was measured (α = min. 0.16 (100 Hz)—max. 0.98 (400 Hz)), it gradually decreased from 500 to 800 Hz (α = 0.93–0.65) and from 1000 Hz to 2500 Hz upwards an increase was recorded again (α = 0.68–0.89) with the exception of a decrease in the frequency between 1600 Hz and 2000 Hz (α = 0.8–0.74). The curve of the cork graph alternated with small differences (α = min. 0.14 (100 Hz), α = max. 0.43 (800 Hz)). A more obvious jump from 800 Hz occurred again at a frequency of 1000 Hz (α = 0.22).
Almost absolute absorption was recorded for the fibreboard sample at a frequency of 400 Hz (α = 0.98), which was the highest value overall of all materials at a thickness of 100 mm. By contrast, the lowest power was shown by the propylat sample at a frequency of 100 Hz (α = 0.12).

4. Discussion

It should be noted that the values of the sound absorption coefficient are influenced by the shape, structure and size of the particles as well as the proportion of pores in the material and its bulk density [58,59]. In this case, these aspects were not examined. In general, it is proven that a higher porosity of the material increases its ability to absorb sound, as confirmed by studies devoted to various synthetic and natural materials. Many authors have also concluded that the ability to absorb sound increases with lower bulk density [29,60,61,62,63]. The material that in this case achieves the worst performance can provide better performance with targeted improvement of parameters.
Ultimately, therefore, the results apply to the selected samples with specific parameters and cannot be generalized to the type of material. Nevertheless, some natural materials achieve higher absorption than, e.g., with acoustic PUR foam at a greater bulk density; this natural material can therefore be said to have excellent absorption [14,64,65,66].
The measurements carried out on biomass samples have shown that, similarly to traditional porous materials, these fibres have good sound absorption, mainly at medium and high frequencies. Furthermore, by increasing the material thickness it is possible to obtain significant sound absorption also at low frequencies, when otherwise other ways such as adding air gaps or perforated layer would be needed.
Some manufacturers do not have an environmental product declaration (EPD), so that it is not possible to objectively compare the environmental impacts of all materials. The geographical location, the distance of the transport and other factors also play an important role in the LCA analysis process. For this reason, it is important to extend and harmonise the existing inventory databases of construction materials to the characteristics of the construction industries in each country. To meet this requirement, public institutions should urge manufacturers to have an EPD developed by independent assessors. Without this information, the environmental impact can only be estimated approximately using existing inventories, which in some cases are difficult to adapt to a specific geographical location.
Despite all the stated limits in assessing the environmental impacts of building materials, there is a clear agreement about the high impact of conventional sound absorbers, which require much more industrial processing compared to natural fibres [67].

5. Conclusions

Natural materials have the potential to replace conventional insulating materials because of their good acoustic properties, low price, low weight, availability and last but not least their incomparably lower CO2 emissions and biodegradability [14,68,69,70].
From the results of this study, it can be concluded that natural materials can surpass conventional ones even at the thinnest tested thickness. At 20 mm and for the entire frequency band, hemp achieved higher values than PUR foam, and in the frequency bands 100–400 Hz and 1000–2500 Hz it was better than mineral wool. In addition, although the values from 500 to 800 were lower than for mineral wool, the deviations were minimal. Hemp achieved the highest, almost absolute sound absorption of all tested materials at a thickness of 20 mm and a frequency of 2000 Hz (α = 0.99). The lowest value was measured at the same thickness for the cork sample at the lowest frequency of 100 Hz (α = 0.02).
Out of the natural materials, hemp dominated in all thicknesses and frequency bands. For conventional materials, the highest values occurred alternately for polyurethane foam and mineral wool. At low frequencies, cork performed the least well of the natural materials. Cork was the weakest of the natural materials even at the highest frequencies, with the irregular exception being the middle frequencies at which the values slightly exceeded those for the sample of fibreboard. The lowest sound absorption coefficient among the conventional materials was typical of propylat, at all thicknesses, but values higher than or approaching the values of PUR foam and mineral wool were measured at high frequencies from 1600 to 2500 Hz.
If the material is to serve as part of the internal partitions of buildings, other practical performance criteria must be considered, such as fire resistance, pest resistance, the effect of aging, etc. At present, it is also possible to achieve these properties in the case of natural materials with various surface coatings or additives which do not affect their biodegradability in any way. These criteria could be the subject of further studies as well as a comparison of LCA analyses of individual types of natural materials with conventional representatives such as different types of polyurethane foams and mineral wool. Another aspect of natural materials that may affect their acoustic performance may also be the effect of fibre length and arrangement or the type of binder used.
Materials based on biomass are currently little studied from an acoustic point of view. The measured results can serve as a database for designers who are increasingly emphasizing the use of environmentally friendly materials. Another subject of research will be a prediction model processed into software by means of which it will be possible to determine the sound absorption coefficient at a given frequency without measurement. This software can be used by designers when selecting materials for building walls and partitions, wall, ceiling or hanging tiles, screens, floors, doors or other acoustic elements. The measured values will be used to select the most suitable prediction model for software development based on their comparison with the calculated values.

Author Contributions

Conceptualization, V.G.; methodology, V.G.; validation, M.B.; formal analysis, T.D.; investigation, V.G.; resources, V.G.; data curation, V.G. and M.M.; writing—original draft preparation, V.G.; writing—review and editing, M.B. and T.D.; visualization, T.D.; supervision, L.S.; project administration, M.M.; funding acquisition, L.S. All authors have read and agreed to the published version of the manuscript.

Funding

The paper was prepared within the project KEGA 009TUKE-4/2021: Implementation of the latest knowledge from recycling technologies for material recovery of product components at the end of their life cycle.

Conflicts of Interest

The authors declare no conflict of interest.

References

  1. Kylili, A.; Seduikyte, L.; Fokaides, P.A. Recycling of Polyurethane Foams; William Andrew Publishing: Norwich, NY, USA, 2018; pp. 97–113. [Google Scholar] [CrossRef]
  2. Cao, C. Advanced High Strength Natural Fibre Composites in Construction; Woodhead Publishing: Sawston, UK, 2017; pp. 529–544. [Google Scholar] [CrossRef]
  3. Environmental Product Declaration. PU Thermal Insulation Boards Made of Block Foam. Available online: https://en.puren.com/fileadmin/user_upload/puren-gruppe/nachhaltigkeit/epd/IVPU_21-0158b_EPD_2022_09_21_PU-Daemmplatten_aus_Blockschaumstoff_englisch.pdf (accessed on 12 November 2021).
  4. Dichiarazione Ambientale di Prodotto. Available online: https://portal.environdec.com/api/api/v1/EPDLibrary/Files/80b5d794-bd17-440f-8ab0-eb45275f6bfe/Data (accessed on 12 November 2021).
  5. Kairytė, A.; Kirpluks, M.; Ivdre, A.; Cabulis, U.; Vaitkus, S.; Pundienė, I. Cleaner production of polyurethane foam: Replacement of conventional raw materials, assessment of fire resistance and environmental impact. J. Clean. Prod. 2018, 183, 760–771. [Google Scholar] [CrossRef]
  6. Ashby, M.F. Materials and the Enviroment, 3rd ed.; Butterworth-Heinemann: Oxford, UK, 2021; pp. 267–294. [Google Scholar] [CrossRef]
  7. Bhingare, N.H.; Prakash, S.; Jatti, V.S. A review on natural and waste material composite as acoustic material. Polym. Test. 2019, 80, 106–142. [Google Scholar] [CrossRef]
  8. Berardi, U.; Iannace, G. Acoustic characterization of natural fibres for sound absorption applications. Build. Environ. 2015, 94, 840–852. [Google Scholar] [CrossRef]
  9. Švajlenka, J.; Kozlovská, M.; Pošiváková, T. Analysis of the indoor environment of agricultural constructions in the context of sustainability. Environ. Monit. Assess. 2019, 191, 489. [Google Scholar] [CrossRef] [PubMed]
  10. Sudarshan, D.K.; Sudarsan, J.S. Hemp Concrete: A Sustainable Green Material for Conventional Concrete. J. Build. Mater. Sci. 2021, 3, 1–7. [Google Scholar] [CrossRef]
  11. Niyigena, C.; Amziane, S.; Chateauneuf, A.; Arnaud, L.; Bessette, L.; Collet, F.; Escadeillas, G.; Lanos, C.; Lawrence, M.; Magniont, C.; et al. RRT3: Statistical analysis of hemp concrete mechanical properties variability. Acad. J. Civ. Eng. 2015, 33, 334–340. [Google Scholar] [CrossRef]
  12. Nguyen, T.T.; Picandet, V.; Carre, P.; Lecompthe, T.; Amziane, S.; Baley, C. Effect of compaction on mechanical and thermal properties of hemp concrete. Eur. J. Environ. Civ. Eng. 2011, 14, 545–560. [Google Scholar] [CrossRef]
  13. Masto, A.D.; Trivaudey, F.; Guicheret-Retel, V.; Placet, V.; Boubakar, L. Investigation of the possible origins of the differences in mechanical properties of hemp and flax fibres: A numerical study based on sensitivity analysis. Compos. Part A Appl. Sci. Manuf. 2019, 124, 105488. [Google Scholar] [CrossRef]
  14. Yang, T.; Hu, L.; Xiong, X.; Petru, M.; Noman, M.T.; Mishra, R.; Militky, J. Sound Absorption Properties of Natural Fibers: A Review. Sustainability 2020, 12, 8477. [Google Scholar] [CrossRef]
  15. Glé, P.; Gourdon, E.; Arnaud, L. Modelling of the acoustical properties of hemp particles. Construction and Building Materials 2012, 37, 801–811. [Google Scholar] [CrossRef]
  16. Glé, P.; Horoshenkov, K.V.; Gourdon, E.; Arnaud, L.; Khan, A. The effect of particle shape and size distribution on the acoustical properties of mixtures of hemp particles. J. Acoust. Soc. Am. 2013, 134, 4698. [Google Scholar] [CrossRef] [PubMed]
  17. Degrave-Lemeurs, M.; Glé, P.; Hellouin de Menibus, A. Acoustical properties of hemp concretes for buildings thermal insulation: Application to clay and lime binders. Constr. Build. Mater. 2018, 160, 462–474. [Google Scholar] [CrossRef]
  18. Gourlay, E.; Glé, P.; Marceau, S.; Foy, C.; Moscardelli, S. Effect of water content on the acoustical and thermal properties of hemp concretes. Constr. Build. Mater. 2017, 139, 513–523. [Google Scholar] [CrossRef]
  19. Chabriac, P.A.; Gourdon, E.; Glé, P.; Fabbri, A.; Lenormand, H. Agricultural by-products for building insulation: Acoustical characterization and modeling to predict micro-structural parameters. Constr. Build. Mater. 2016, 112, 158–167. [Google Scholar] [CrossRef]
  20. Kinnane, O.; Reilly, A.; Grimes, J.; Pavia, S.; Walker, R. Acoustic absorption of hemp-lime construction. Constr. Build. Mater. 2016, 122, 674–682. [Google Scholar] [CrossRef] [Green Version]
  21. Delannoy, G.; Marceau, S.; Glé, P.; Gourlay, E.; Guéguen-Minerbe, M.; Diafi, D.; Nour, I.; Amziane, S.; Farcas, F. Influence of binder on the multiscale properties of hemp concretes. Eur. J. Environ. Civ. Eng. 2018, 23, 609–625. [Google Scholar] [CrossRef]
  22. Lee, H.M.; Luo, W.; Xie, J.; Wen, G.; Lee, H.P. Studies on the sound absorption and transimission loss performances of wood-based natural and waste materials. Acta Mech. Sin. 2021, 37, 861–873. [Google Scholar] [CrossRef]
  23. Iannace, G.; Ciaburro, G.; Guerriero, L.; Trematerra, A. Use of cork sheets for room acoustic correction. J. Green Build. 2020, 15, 45–55. [Google Scholar] [CrossRef]
  24. Ciaburro, G.; Iannace, G. Membrane-type acoustic metamaterial using cork sheets and attached masses based on reused materials. Appl. Acoust. 2022, 189, 108605. [Google Scholar] [CrossRef]
  25. Trematerra, A.; Lombardi, I. Acoustic Properties of Cork Sheets. Key Eng. Mater. 2017, 744, 66–70. [Google Scholar] [CrossRef]
  26. Barrigón Morillas, J.M.; Montes Gonzáles, D.; Vílches-Gómez, R.; Gómez Escobar, V.; Maderuelo-Sanz, R.; Rey Gozalo, G.; Atanasio Moraga, P. Virgin Natural Cork Characterization as a Sustainable Material for use in Acoustic Solutions. Sustainability 2021, 13, 4976. [Google Scholar] [CrossRef]
  27. Park, S.-H.; Lee, M.; Seo, P.-N.; Kang, E.; Kang, C.W. Acoustical properties of wood fiberboards prepared with different densities and resin contents. BioResources 2020, 15, 5291–5304. [Google Scholar] [CrossRef]
  28. Bertolini, M.S.; Morais, C.A.G.; Christoforo, A.L.; Bertoli, S.R.; Santos, W.N.; Rocco Lahr, F.A. Acoustic absorption and thermal insulation of wood panels inflence of porosity. Biorescources 2019, 14, 3746–3757. [Google Scholar] [CrossRef]
  29. Nandanwar, A.; Kiran, M.C.; Varadarajulu, K.C. Influence of Density on Sound Absorption Coefficient of Fibre Board. Open J. Acoust. 2017, 7, 1–9. [Google Scholar] [CrossRef] [Green Version]
  30. Sohn, J.L.; Kalbar, P.P.; Banta, G.T.; Birkved, M. Life-cycle based dynamic assessment of mineral wool insulation in a Danish residential building application. J. Clean. Prod. 2017, 142, 3243–3253. [Google Scholar] [CrossRef] [Green Version]
  31. Schmidt, A.C.; Jensen, A.A.; Clausen, A.U.; Kamstrup, O.; Postlethwaite, D.A. Comparative life cycle assessment of building insulation products made of stone wool, paper wool and flax. Int. J. Life Cycle Assess. 2004, 9, 122. [Google Scholar] [CrossRef]
  32. Sustainability and the Cork Oak Forest. Reaching Balance. Available online: https://www.amorimcork.com/en/sustainability/sustainability-and-the-cork-oak-forest/ (accessed on 19 November 2020).
  33. Chybík, J. Přírodní Stavební Materiály, 1st ed.; Grada Publishing: Prague, Czech Republic, 2009; pp. 111–114. [Google Scholar]
  34. Amorim Insolamentos. Available online: https://amorimcorkinsulation.com/xms/files/BROCHURAS_DOWNLOADS/2017_Amorim_Isolamentos_brochure.pdf (accessed on 19 November 2021).
  35. Pereira, H. Cork: Biology Production and Uses; Elsevier Science: Amsterdam, The Netherlands, 2007; pp. 163–186. [Google Scholar] [CrossRef]
  36. Hudec, M.; Johanisová, B.; Mansbart, T. Pasivní Domy z Přírodních Materiálu, 1st ed.; Grada Publising: Prague, Czech Republic, 2013; pp. 54–55. [Google Scholar]
  37. Technical Data Sheet. Isohemp Hemp Block. Available online: https://www.isohemp.com/sites/default/files/fichiers/isohemp-technical-data-sheet-hempblocks.pdf (accessed on 5 November 2021).
  38. Sahmenko, G.; Sinka, M.; Namsone, E.; Korjakins, A.; Bajare, D. Sustainable Wall Solutions Using Foam Concrete and Hemp Composites. Environ. Clim. Technol. 2021, 25, 917–930. [Google Scholar] [CrossRef]
  39. Maderuelo-Sanz, R.; García-Cobos, F.J.; Sánchez-Delgado, F.J.; Mota-López, M.I.; Meneses-Rodríguez, J.M.; Romero-Casado, A.; Acedo-Fuentes, P.; López-Ramos, L. Mechanical, thermal and acoustical evaluation of biocomposites made of agricultural waste for ceiling tiles. Appl. Acoust. 2022, 191, 108689. [Google Scholar] [CrossRef]
  40. Mawardi, I.; Aprilia, S.; Faisal, M.; Ikramullah, I.; Rizal, S. An investigation of thermal conductivity and sound absorption from binderless panels made of oil palm wood as bio-insulation materials. Results Eng. 2022, 13, 100319. [Google Scholar] [CrossRef]
  41. Smardzewski, J.; Batko, W.; Kamisiński, T.; Flach, A.; Pilch, A.; Dziurka, D.; Mirski, R.; Edward Roszyk, E.; Majewski, A. Experimental study of wood acoustic absorption characteristics. Holzforschung 2013, 68, 467–476. [Google Scholar] [CrossRef]
  42. Kang, C.; Jang, E.; Jang, S.; Hasegawa, M.; Matsumura, J. Studies of the Relationship Between Sound Absorption Coefficient and Air Permeability of Wood. J. Fac. Agric. Kyushu Univ. 2020, 65, 351–355. [Google Scholar] [CrossRef]
  43. ISOVER TF PROFI EPD. Available online: https://www.isover.sk/specificke-epd-sw-kamenna-vlna-subor-dokumentov (accessed on 7 November 2021).
  44. Moretti, E.; Belloni, E.; Agosti, F. Inovative mineral fiber insulation panels for buildings: Thermal and acoustic characterization. Appl. Energy 2016, 169, 421–432. [Google Scholar] [CrossRef]
  45. Yap, Z.S.; Khalid, N.H.A.; Haron, Z.; Mohamed, A.; Tahir, M.M.; Hasyim, S.; Saggaff, A. Waste Mineral Wool and Its Opportunities—A Review. Materials 2021, 14, 5777. [Google Scholar] [CrossRef] [PubMed]
  46. Väntsi, O.; Kärki, T. Mineral wool waste in Europe: A review of mineral wool waste quantity, quality, and current recycling methods. J. Mater. Cycles Waste Manag. 2014, 16, 62–72. [Google Scholar] [CrossRef]
  47. Sattler, T.; Pomberger, R.; Schimek, J.; Vollprecht, D. Mineral wool waste in austria, associated health aspects and recycling options. Detritus 2019, 9, 174–180. [Google Scholar] [CrossRef] [Green Version]
  48. Chen, S.; Jiang, Y. The acoustical property study of polyurethane foam with addition of bamboo leaves particles. Polym. Compos. 2016, 39, 1370–1381. [Google Scholar] [CrossRef]
  49. Samaranayake, K.W.N.S.; Coore, R.V. Analysis of factors controlling acoustic absorption of commercial flexible polyurethane foams. J. Sri Lanka Assoc. Adv. Sci. 2018, 1, 21–31. [Google Scholar]
  50. From Ecological Thinking to Custom-Made Solutions. Available online: https://www.borgers-group.com/en/materials/absorber/propylatnvh/ (accessed on 12 November 2021).
  51. Sakthivel, S.; Senthil kumar, B. Studies on influence of bonding methods on sound absorption characteristic of polyester/cotton recycled nonwoven fabrics. Appl. Acoust. 2021, 174, 107749. [Google Scholar] [CrossRef]
  52. Prasetiyo, I.; Gunawan, G.; Adhika, D. Sound absorption performance of nonwoven fabrics. J. Phys. Conf. Ser. 2021, 1896, 012008. [Google Scholar] [CrossRef]
  53. BSWA SW Series Impedance Tubes. Available online: https://www-panacoustics-com.translate.goog/bswa-sw-series-impedance-tubes.html?_x_tr_sl=en&_x_tr_tl=sk&_x_tr_hl=sk&_x_tr_pto=op,sc (accessed on 17 December 2021).
  54. Supplementary User Manual for BSWA Impedance Tube Measurement Systems. Available online: https://dokumen.tips/reader/f/supplementary-user-manual-for-bswa-impedance-tube-user-manual-for-bswa-impedance (accessed on 31 January 2022).
  55. ASTM E1050-08; Standard Test Method for Impedance and Absorption of Acoustical Materials Using a Tube, Two Micro-phones and a Digital Frequency Analysis System. ASTM International: West Conshohocken, PA, USA, 2008.
  56. ISO 10534-2; Acoustics—Determination of Sound Absorption Coefficient and Impedance in Impedance Tubes—Part 2: Transfer-Function Method. International Organization for Standardization: Geneva, Switzerland, 1998.
  57. Wolkesson, M. Evaluation of Impedance Tube Methods—A Two Microphone In-Situ Method for Road Surfaces and the Three Microphone Transfer Function Method for Porous Materials. Master’s Thesis, Master’s Programme in Sound and Vibration, Chalmers University of Technology, Gothenburg, Sweden, 2013. [Google Scholar]
  58. Samaei, S.E.; Taban, E.; Berardi, U.; Mousavi, S.M.; Faridan, M.; Mahabadi, H.A. Optimization and Modeling of Sound-Absorption Properties of Natural Fibers for Acoustical Application. J. Nat. Fibers 2021, 18, 1–17. [Google Scholar] [CrossRef]
  59. Berardi, U.; Iannace, G. Predicting the sound absorption of natural materials: Best-fit inverse laws for the acoustic impedance and the propagation constant. Appl. Acoust. 2017, 115, 131–138. [Google Scholar] [CrossRef]
  60. Zhang, Y.; Li, H.; Abdelhady, A.; Du, H. Laboratorial investigation on sound absorption property of porous concrete with different mixtures. Constr. Build. Mater. 2020, 259, 120414. [Google Scholar] [CrossRef]
  61. Dunne, R.; Desai, D.; Sadiku, R. A review of the factors that influence sound absorption and the available empirical models for fibrous materials. Acoust. Aust. 2017, 45, 453–469. [Google Scholar] [CrossRef]
  62. Witczak, E.; Jasińska, I.; Lao, M.; Krawczyńska, I.; Kamińska, I. The influence of structural parameters of acoustic panels textile fronts on their sound absorption properties. Appl. Acoust. 2021, 178, 107964. [Google Scholar] [CrossRef]
  63. Rivera-Gómez, C.; Galán-Marín, C.; López-Cabeza, V.P.; Diz-Mellado, E. Sample key features affecting mechanical, acoustic and thermal properties of a natural-stabilised earthen material. Constr. Build. Mater. 2021, 271, 121569. [Google Scholar] [CrossRef]
  64. Iannace, G. The acoustic characterization of green materials. Build. Acoust. 2017, 24, 101–113. [Google Scholar] [CrossRef]
  65. Ciaburro, G.; Puyana-Romero, V.; Iannace, G.; Jaramillo-Cevallos, W.A. Characterization and Modeling of Corn Stalk Fibers tied with Clay using Support Vector Regression Algorithms. J. Nat. Fibers 2021, 18, 1–16. [Google Scholar] [CrossRef]
  66. Ali, M.; Alabdulkarem, A.; Nuhait, A.; Al-Salem, K.; Iannace, G.; Almuzaiqer, R. Characteristics of Agro Waste Fibers as New Thermal Insulation and Sound Absorbing Materials: Hybrid of Date Palm Tree Leaves and Wheat Straw Fibers. J. Nat. Fibers 2021, 1–19. [Google Scholar] [CrossRef]
  67. Ricciardi, P.; Belloni, E.; Cotana, F. Innovative panels with recycled materials: Thermal and acoustic performance and Life Cycle Assessment. Appl. Energy 2014, 134, 150–162. [Google Scholar] [CrossRef]
  68. Arenas, J.P.; Sakagami, K. Sustainable Acoustic Materials. Sustainability 2020, 12, 6540. [Google Scholar] [CrossRef]
  69. Moravec, M.; Badida, M.; Mikušová, N.; Sobotová, L.; Švajlenka, J.; Dzuro, T. Proposed Options for Noise Reduction from a Wastewater Treatment Plant: Case Study. Sustainability 2021, 13, 2409. [Google Scholar] [CrossRef]
  70. Švajlenka, J.; Kozlovská, M.; Badida, M.; Moravec, M.; Dzuro, T.; Vranay, F. Analysis of the Characteristics of External Walls of Wooden Prefab Cross Laminated Timber. Energies 2020, 13, 5974. [Google Scholar] [CrossRef]
Figure 1. Material samples with thicknesses of 20 mm, 40 mm, 60 mm, 80 mm and 100 mm: (a) cork, (b) hemp, (c) fibreboard, (d) mineral wool, (e) PUR foam, (f) propylat.
Sustainability 14 04258 g001
Figure 2. Technical equipment of the BSWA TECH impedance tube: (a) microphone calibrator, (b) amplifier, (c) hardware, (d) microphone [53].
Sustainability 14 04258 g002
Figure 3. Composition of the measuring system for the sound absorption coefficient (α) (for frequency bands 100–800 Hz and 400–2500 Hz) [54].
Sustainability 14 04258 g003
Figure 4. Measuring chain diagram for the sound absorption coefficient in the frequency band 400–2500 Hz: 0—microphone holder; 1, 2—microphones; 3—sample; 4—sound source; 5—amplifier; 6—signal generator; 7—frequency analysis system (software) [54].
Sustainability 14 04258 g004
Figure 5. Measuring chain diagram for the sound absorption coefficient in the frequency band 100–800 Hz during real conditions.
Sustainability 14 04258 g005
Figure 6. Scheme of impedance tube with two microphones: s—the distance between the two microphones (s = x1 – x2); x1—the distance between the sample and the far microphone location; x2—the distance between the sample and the near microphone location; pI—the sound pressure of the incident wave; pR—the sound pressure of the reflected wave; d—sample thickness [57].
Sustainability 14 04258 g006
Figure 7. Comparison of sound absorption coefficient of single material with thicknesses of 20 mm, 40 mm, 60 mm, 80 mm and 100 mm for: (a) cork, (b) hemp, (c) fibreboard, (d) mineral wool, (e) PUR foam, (f) propylat.
Sustainability 14 04258 g007aSustainability 14 04258 g007b
Figure 8. Comparison of sound absorption coefficients for samples of thicknesses: (a) 20 mm, (b) 40 mm.
Sustainability 14 04258 g008
Figure 9. Comparison of sound absorption coefficients for samples of thicknesses: (a) 60 mm, (b) 80 mm.
Sustainability 14 04258 g009
Figure 10. Comparison of sound absorption coefficients for samples of a thickness of 100 mm.
Sustainability 14 04258 g010
Table 1. Technical parameters and equipment of the BSWA TECH impedance tube [53].
Main Measuring CapabilitiesFrequency RangeTube DiameterSoftware
Sound absorption coefficient (α) Sound transmission loss (STL)100–6300 Hz60 mm VA-LAB IMP
Microphone calibratorAmplifierHardwareMicrophones (4)
model CA115model PA50model MC3242model 1/4″ MPA416
Publisher’s Note: MDPI stays neutral with regard to jurisdictional claims in published maps and institutional affiliations.

