
Modular Regulators of Water Level in Ditches of Subirrigation Systems
by
 , ,
, ,
Sławomir Bajkowski
1, 
Janusz Urbański
1,
Ryszard Oleszczuk
2,
Piotr Siwicki
2,*,
Andrzej Brandyk
3 and
Zbigniew Popek
2 1
Institute of Civil Engineering, Warsaw University of Life Sciences, 02-787 Warsaw, Poland
2
Institute of Environmental Engineering, Warsaw University of Life Sciences, 02-787 Warsaw, Poland
3
Water Centre, Warsaw University of Life Sciences, 02-766 Warsaw, Poland
*
Author to whom correspondence should be addressed.
Sustainability 2022, 14(7), 4103; https://doi.org/10.3390/su14074103
Submission received: 14 February 2022
/
Revised: 24 March 2022
/
Accepted: 28 March 2022
/
Published: 30 March 2022
(This article belongs to the Special Issue Environmental Engineering and Water Resources Management)
Abstract
:Economical management of water resources involves water management on a national scale, including river basins and catchment areas, as well as on the scale of drainage systems. One of the devices for controlling the outflow of groundwater from a network of ditches is a flow regulator. In this work, three flow regulators were studied for their water damming capacity in the drainage network and the adjacent ground with the aim of determining their hydraulic characteristics and operating conditions. The adjustment consisted of changing the closing height in order to obtain the required damming level in a ditch. All three tested regulators were characterized by the presence of effective flow Qe, the value of which was determined for different damming levels. Water leaks occurred mainly in places where the damming elements were embedded in vertical guides and, to a lesser extent, at the horizontal joints of successively placed beams. The impact of the overflow shape and the development of the crest line on the obtained flow rate increase was different for the tested S, U, and Z models. The expansion coefficient of the overflow crest equaled kr = 1.0 for the rectilinear S regulator, kr = 1.58 for the labyrinth U regulator, and kr = 1.74 for the compound Z regulator. For the S4 variant, the modular total flow factor reached kQ = 1.19 for the elevation of the upper water above the overflow H = 14.9 cm. The U2 variant was characterized by a modular flow coefficient of kQ = 1.48 for H = 10.7 cm. For the Z1 variant with a cylindrical corner shape, the modular flow coefficient value was kQ = 1.60 for H = 8.2 cm in elevation. For the Z2 variant with an angular corner shape, kQ = 1.63 for H = 8.4 cm.
1. Introduction
The projected climate change and progressive anthropopressure will contribute to reduction in water resources. According to the forecasts of the UN Intergovernmental Panel on Climate Change [1], the incidence of 100-year droughts will increase at least 10-fold. Preparing agriculture for the upcoming changes [2] involves effective management of water resources to increase availability and retention, education in the field of drought, and coordination of actions to counteract the effects of these changes. Therefore, it is necessary to undertake actions aimed at effective water management in resource generation areas through the collection of rainwater (in the form of ground, habitat, and reservoir retention) and the appropriate distribution, control, and regulation of outflow [3,4].
Water collection and runoff control is carried out by drainage systems, including ditches [5,6,7,8,9] and underground pipelines or buried drains [10,11,12,13]. For the regulation of flow in watercourses [14] and reservoirs [15], the following options are used: vortex regulators [16], gate and overflow regulators [17,18], and tower regulators [19]. Float regulators are largely used for stabilizing upper and lower water levels [20]. One of the ways to increase water retention in water drainage facilities is the use of damming regulators in drainage ditches, which will consequently have an impact on water storage of the adjacent ground [21,22,23,24]. The parameters of regulators periodically enable the network of drainage ditches to be transformed into a system of drainage and irrigation ditches [25].
Prototypes of the new regulators were made by S. i A. Pietrucha Sp. z o.o. (a limited liability company) [26]. Tests and validation of the devices in laboratory conditions were carried out at the hydraulic laboratory of the Warsaw University of Life Sciences. The tested regulators ensure optimal conditions for drainage/irrigation of crops in areas close to ditches equipped with this type of device. The innovation is based on the use of typical structural elements of plastic sheet piling instead of the ones used in Poland so far, such as structures made of concrete, steel, or wood. The tested plastic structures were made and used in practice for the first time in Poland. Plastic constructions have an advantage over traditional ones due to the much lower cost of execution and operation, easier and precise assembly from typical structural elements, easy handling of the closures (due to the relatively light weight, which means there is no need to use additional mechanical lifting devices), long-term use (no corrosion), and no need for costly maintenance.
The aim of this research was to determine the conditions of use of these regulators and in particular their regulatory features (the occurrence of idle, initial flow defined as effective flow above which the proper operation of the regulator begins). The analyses were aimed at determining the characteristics of the regulators relative to their applied and proven computation techniques. The dimensionless modular coefficients of regulators with different shapes of beams and damming heights were also studied. The purpose of the laboratory tests was to assess the design and functioning of the regulators under conditions of variable hydrostatic and hydrodynamic loads in terms of tightness, installation and operation methods, and the discharge and regulatory capabilities.
2. Materials and Methods
2.1. Regulators
In the network of drainage ditches, gate regulators are usually used to stabilize the flow and water level in the form of individual wooden beams (shandors) or steel gates. The tested prototype beam regulators were developed using typical structural elements of plastic sheet piling. The cut sections of the sheet piling formed vertical closures constituting the overflow element of the regulator. These closures can be used in existing (Figure 1a,b) or new (Figure 1c,d) irrigation gates.
The regulator was mounted to the flaps, and the vertical elements of the guides were installed in the recesses directly or using reinforcement (Figure 1c). The edges of the sheet piles created an overflow developed in the plan, with the water impoundment maintained above the valve cross section.
This study analyzed water flow for four beam regulators: (1) the computational C regulator (thin-walled/sharp-crested) equipped with a thin-walled steel or wooden closure (Figure 1a,b); (2) the S regulator (rectilinear) made of straight beams of vinyl sheets used for strengthening excavations (Figure 1c); (3) the U (labyrinth) regulator with beams made of uniform, nonsplit vinyl sheet piles; and (4) the Z regulator (compound) made of double beams (Figure 1d). In beam regulators, the upper water level is determined by the sill height obtained by assuming the required number of bars. The top edge of the highest beam forms an overflow. The type of element used determines the length and shape of the active edge of the overflow and the shape of its crest.
The total flow rate of the beam regulators (Qc in dm3·s−1) is the sum of the intensity of the control flow Qr (dm3·s−1) and the effective flow Qe (dm3·s−1). The control flow Qr (dm3·s−1) over the crest depends on the shape of the overflow line in the plan; the length of the overflow edge Lp (m), the width of the outlet opening b (m), the width of the laboratory flume B (m), the height of the upper sill P (cm), the depth of the upper water T (cm), and the height of the water layer above the overflow crest H = T – P (cm). Effective flow Qe (dm3·s−1) is the idle, uncontrolled flow through the beam locks (vertical connections to the guides) and through the horizontal seals between the beams. The output Qe (dm3·s−1) is influenced by the depth of the upper water T (cm), the height of the upper sill P (cm), and the shape of the sheet piles used to make the closure beams (S, U, and Z). The flow rate at which the water flows over the edge of the regulator is defined as the effective flow QeP (dm3·s−1) at a given height of the upper sill P (cm).
2.2. Laboratory Experiment
The discharge of the model C regulator was determined by the Bazin formula according to [27] (described later in the paper), and the S, U, and Z regulators were obtained from our own research carried out at the hydraulic laboratory (LH). The laboratory station used to test the regulators is shown in Figure 2. The tests were carried out in a concrete channel 1.07 m wide and 1.00 m high. The station was supplied with water in a closed circuit, which included the lower water collection tank, the suction and discharge pump, supply pipelines, pipelines for water discharge, and the bottom tank. The water installation was equipped with a control valve and an electromagnetic flow meter (ENKO MPP600 DN60) with a flow rate measurement accuracy of ±1%. A pin water gauge (MICRO MD-2108) with a reading accuracy of ±1 × 10⁻⁴ m (±0.01 cm) was used to measure the position of the water table. A stream of water of a fixed, controlled discharge Qc (dm3·s−1) was applied to the tested regulator.
2.3. Study Models
The subjects of the research were models of three types of prototype beam regulators (Figure 3). These were (Table 1, Figure 3): S (rectilinear), U (labyrinth), and Z (compound) regulators. The C model regulator was the base structure to which the modular capacity of the tested regulators was compared. The prototypes were made on a 1:1 scale; therefore, a modelling criteria was not required, and there was no need to convert the constructional and hydraulic parameters into real conditions. In this situation, all geometrical parameters and the determined hydraulic characteristics can be directly related to the actual on-site conditions. Taking measurements on prototypes in a 1:1 scale is undoubtedly an advantage of the executed research.
The modules of the analyzed regulators differed in the width of the outlet opening. The three modules of regulators were marked with the following widths: M45 module with outlet width b = 45.0 cm for variant C4–S4; M59 with outlet width b = 58.8 cm for variant C2–U2; and M54 with outlet width b = 54.4 cm for variants C1–Z1 and C2–Z2, which had different sill heights P. The capacity of the modules was compared with the same height of the dam. In this way, a series of overflows was obtained in the area covering one beam shape with the same development of the overflow line. It was assumed that the beams of the rectilinear computational C regulator were made of rectangular thin-walled elements. The rectilinear box beams of the S regulator were characterized by a limitation of the output resulting from the interaction of long and deep recesses and a semicircular overflow on the crest (Figure 3b). The flow rate of the rectilinear thin-walled C regulator was determined using the Bazin formula according to [27] to calculate overflows with a sharp crest taking into account the side and bottom throttling. The flow rate curves of the regulators in variants S4, U2, Z1, and Z2 were developed based on the results of laboratory tests.
For closures made of modular vinyl beams, the main research task is to estimate the hydraulic capacity of the entire module. Summing up the capacity of the rectilinear and curvilinear elements helped to calculate the exceedance of nominal discharges, namely polygonal, saw-labyrinthine, and keyboard drains [6,28]. The tested regulators were characterized by frontal water inflow, while [29,30,31,32,33,34] had analyzed them as side weirs. The studies in the literature and in the presented paper dealt with different hydraulic conditions. In [29,30,31,32,33,34], lateral overflows with variable discharge along the length of the crest were studied. These studies concerned lateral labyrinth overflows in which water was flowing outwards. In the present research, water was overflowing from the other side towards the interior. In terms of strength, such a beam arrangement is statically more favorable. For modular beams cut from sheet piles, the authors referred their actual capacity to a rectilinear overflow with the same width of the drain opening (module width). The overflow element of such closures are beams with sharp edges, for which calculation formulas are known [27]. The closures of one module have the same dimension of the width of the outlet hole. For beams with a developed crest in the plan, the beams are fastened in the spacing of locks. The beams of one module have the same shape expressed by the type of elements and the value of the coefficient kr for the development of the overflow line. This coefficient expresses the ratio of the length Lp (m) of the overflow measured along the edge developed in the plan to the width b (m) of the outlet hole (column 6 in Table 1).
To determine the throughput of the module, a dimensionless relative modular total flow factor kQ was applied. This coefficient expresses the ratio of the capacity of the S, U, and Z modules with developed shapes to the overflow capacity of a typical thin-walled C closure made of a straight beam with an edge length equal to the width of the module outlet hole.
The M45 module (Figure 4a,e) with the outlet width b = 45.0 cm was represented by the C4–S4 variant (row 1 in Table 1). The computational C4 variant is a structure consisting of four thin-walled beams (Figure 4a). The research S4 variant (Figure 4e) consisted of H126 mm I-section guides and four beams (Figure 3a). The guides rested on the bottom beam. The shape of the beams made it possible to connect them to each other with the use of a lock, while the horizontal seals ensured tightness along the contact of adjacent beams. The tested S regulator with the outlet opening width b = 0.450 m made it possible to set the sill height within the range of P = 6.8–87.7 cm (Table 1).
The M59 module (Figure 4b,f) with the outlet width b = 58.8 cm was represented by the C2–U2 variant (row 2 in Table 1). The computational C2 variant consisted of two thin-walled beams (Figure 4b). The research U2 variant consisted of two labyrinth beams (Figure 4f) and two guides: one with a female lock and the other with a male lock (Figure 3b). The effective flow Qe (dm3∙s−1) in this type of structure was caused by water leaks in the gaps between vertical guides and beams along the vertical locks and on the horizontal seals between the beams. In the U regulator model with the outlet hole width b = 0.588 m, adjustment of the sill height was possible in the range of P = 0.00–102.6 (Table 1).
The M54 module with the outlet width b = 54.4 cm was represented by the variant C1–Z1 (row 3 in Table 1) and the variant C2–Z2 (row 4 in Table 1). The M54 module was tested for two sill heights: (1) variant C1–Z1 (Figure 4c,g) with one beam, P = 20.5 cm and (2) variant C2–Z2 (Figure 4h) with two beams, P = 41.6 cm. The computational C1 variant consisted of one thin-walled beam (Figure 4c). The research variant Z1 consisted of one complex beam (Figure 3c). Both elements of the beam were connected with each other in a vertical line with a lock. The computational C2 variant consisted of two thin-walled beams (Figure 4d). The research Z2 variant consisted of two folded beams (Figure 4h). In the tested Z model with the b = 0.544 m, adjustment of the sill height was possible within the range of P = 0.00–102.6 cm (Table 1).
3. Laboratory Test Results
The total flow rate Qc (dm3∙s−1) for regulators with a developed overflow crest line is the sum of the effective flow Qe (dm3∙s−1) and the control flow Qr (dm3∙s−1):
In the first stage of the research, the effective flow Qe (dm3∙s−1) was determined. In the second stage, the measurements of the total flow Qc (dm3∙s−1) of the regulators were performed for the specified range of upper water height T (cm) and elevation H (cm) of the upper water above the overflow. The hydraulic parameters and their measuring ranges are presented in Table 2.
The Reynolds number values in Table 2 were calculated according to the following formulas:
where Ho is the elevation of the energy line above the overflow (m), Vg is the velocity of the inflowing water (m∙s−1), ν is the kinematic viscosity coefficient of water (ν20 = 1.01 × 10⁻⁶ m2s−1), g is the acceleration due to gravity (g = 9.81 m·s−2), and B is the width of the laboratory flume (B = 1.07 m).
3.1. Effective Flow Qe
Effective flow Qe (dm3∙s−1) is the flow necessary to compensate (cover) water losses leaking through the connections of structural elements, slots, cavities, or gaskets. It is a variable value that depends on the type of regulator, the number of installed beams, the method of assembly, and the type and accuracy of sealing. Effective flow QeP (dm3∙s−1) is the flow rate at the sill height P (cm); when exceeded, the process of automatic adjustment of the water table level in front of the damming structure begins. The effective flow curves were developed with the use of five beams in each of the regulators (S, U, and Z) (Figure 5).
The S regulator was characterized by the highest effective flow among all the tested prototypes. In this regulator, the beams were inserted into the slots of the guides without special connecting locks. Water leaks occurred mainly at the places where the damming elements were embedded in the recesses and, to a lesser extent, at the horizontal joints of the successively installed beams where seals were utilized. As the upper water depth T increased, the effective flow increased from Qe = 0.35 dm3∙s−1 at T = 0.20 m to Qe = 0.95 dm3∙s−1 at T = 0.90 m (five beams) (curve 1 in Figure 5).
The U regulator was characterized by lower effective flow values compared to the S model. This regulator was mounted in guides with the use of special locks, which ensured greater tightness. Minor leaks occurred locally at the gasket joint between the beams. Water losses increased with an increase in the level of dammed water from Qe = 0.04 dm3∙s−1 to Qe = 0.40 dm3∙s−1 (curve 2 in Figure 5).
The Z regulator was characterized by the lowest effective flow among the tested regulators, although there was an additional third lock connecting the two parts of the beam. The research involved the construction of the Z regulator ensuring maximum depth of upper water T = 1.05 m. The effective flow rate varied from Qe = 0.01 dm3∙s−1 to Qe = 0.20 dm3∙s−1 (curve 3 in Figure 5).
The set of results presented in Figure 5 was subjected to statistical elaboration. Using a nonlinear approximation model, the following regression equations were developed:
- S model, the scope of formula validity 19.1 cm ≤ H ≤ 85.4 cm:
- U model, the scope of formula validity 20.0 cm ≤ H ≤ 89.2 cm:
- Z model, the scope of formula validity 21.0 cm ≤ H ≤ 105.0 cm:
where Qe (dm3∙s−1) is the effective flow, T (cm) is the upper water depth above the bottom, r is the correlation coefficient, and R2 is the determination coefficient.
The values of the statistical measures used indicate a very good representation of the measured values of the effective flow rate with the adopted models. Using the developed predictive Equations (5)–(7), the effective flow QeP (dm3·s−1) was calculated for the upper water depth equal to the sill height for the S4, U2, Z1, and Z2 variants. The results of the calculations are summarized in column 9 in Table 1. When the QeP value is exceeded, the flow over the crest of the highest situated beam is effectively regulated.
3.2. Total Flow Qc
The basis for the comparisons was a regulator with a sharp-crested weir overflow (computational C model), the throughput of which was calculated from the generally available and proven Bazin formula provided by [30]. This formula takes into account the influence of the sill height described by the ratio H/(H + P), where H (m) is the upper water elevation above the overflow. T = H + P (m) is the upper water depth. Lateral throttling in the Bazin formula is determined by the ratio b/B, where b (m) is the outlet width of the regulator module, and B (m) is the width of the upper water table. In new solutions of C regulators made of thin-walled beams, polytetrafluoroethylene (PTFE) is used to seal the closures, which guarantees the tightness of the structure. For this reason, the occurrence of the effective flow QeC = 0.0 dm3∙s−1 was not taken into account in the C model. Regulatory flow QrC (dm3∙s−1) of the computational C regulator is described by the formula for the discharge of the unflooded overflow:
where mBAZ = f(H, b, B, P) is the discharge coefficient for thin-walled C regulator calculated from the Bazin formula according to [30]:
where b (m) is the module outlet width, H (m) is the upper water elevation above the overflow, B (m) is the width of the upper water table, and P (m) is the height of the upper sill.
Formula (9) should be applied for 0.06 m ≤ H ≤ 0.6 m; 0.5 m < b ≤ 2.0 m; and 0.2 m ≤ P ≤ 2.0 m.
Formulas (8) and (9) were used to calculate the flow rate of the C regulator for widths equal to the width of the outlet hole for individual modules, namely M45 for the C4–S4 variant, M59 for the C2–U2 variant, and M54 for the C1–Z1 and C2–Z2 variants. The flow rate measurement curves for the S, U, and Z regulators and the curves calculated for the C regulator at variable upper water depth T and different upper sill heights P are given in Figure 6. The graph (Figure 6) also presents the effective flow Qe curves. Moreover, Figure 6 shows the curves for the C regulator: curve 5 for C4–S4, curve 6 for C2–U2, curve 7 for C1–Z1, and curve 8 for C2–Z2. The tests were carried out with flow rate from minimum values to about 60.0 dm3∙s−1, and the graph was developed in the range up to 20.0 dm3∙s−1. The greatest elevation of the upper water table above the weir H (column 6 in Table 2) was obtained for the S beam from 2.04 to 14.89 cm, with the maximum flow amounting to Qc = 55.90 dm3∙s−1. The total flow curves of the U and Z regulators were similar. Compared to the S regulator, the design of the U and Z regulators ensured the stabilization of the position of the dammed water table to a greater extent thanks to the lower values of the effective flow Qe (Figure 5).
The flow rate curves (Qr = Qc − QeP) for different heights of the upper sill P of the tested regulators are shown in Figure 7. The results of measurements of the flow rate of the tested regulators can be described with a nonlinear model using the following equation:
where a1, a2, b1, b2, and c1 are the coefficients of Equation (10), which are presented in Table 3.
4. Discussion
The tested regulators, apart from the shape of the module, differed in the width of the outlet opening. The hydraulic efficiency of the tested regulators was determined using the values of the total flow rate Qc (dm3·s−1), which were calculated from Formula (1) as the sum of the control flow rate Qr (dm3·s−1) and effective flow rate QeP (dm3·s−1). The effective flow rate was calculated from Formulas (5)–(7) depending on the height of the upper sill P (cm) of the analyzed variants (column 9 in Table 1). The total flows of the tested variants of the S4, U2, Z1, and Z2 regulators were compared with the discharge of analogous variants of the C regulator calculated using Equations (8) and (9). The calculations were conducted for the height of the upper sill P (cm) and the elevation of the upper water above the overflow H (cm) measured in the tests for variants S4, U2, Z1, and Z2.
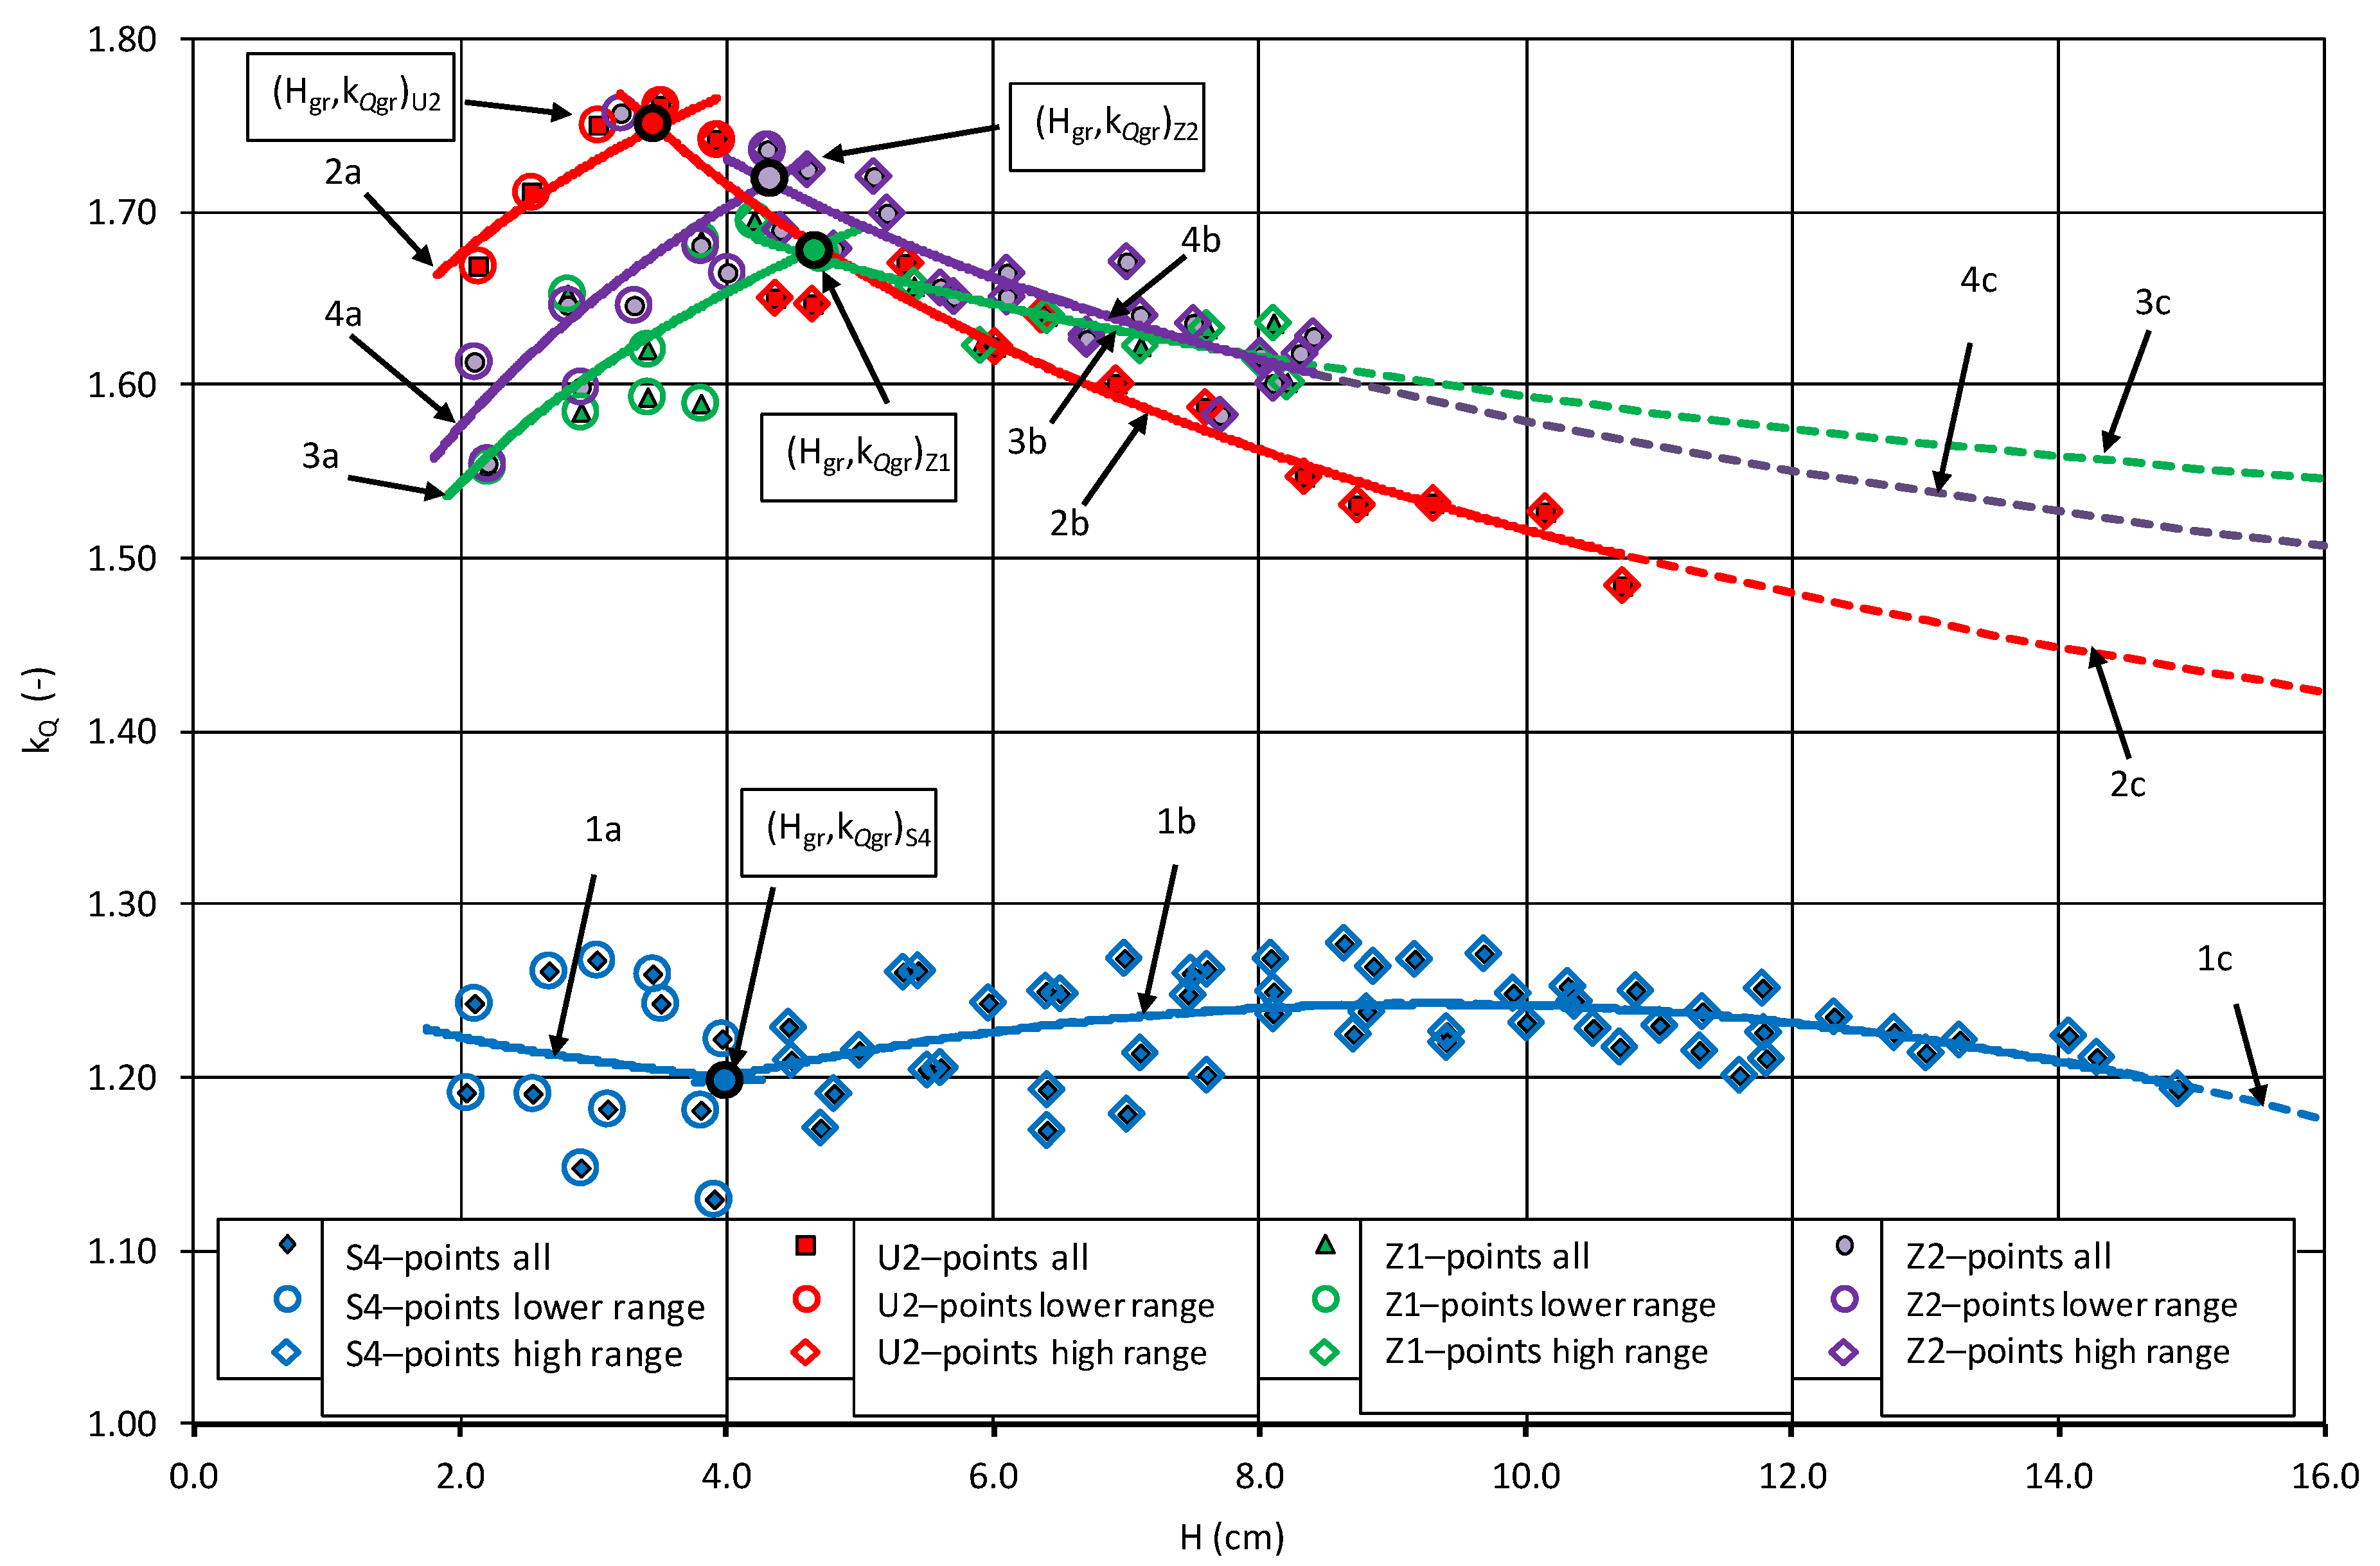
The efficiency of water level control with the tested regulators was described by the modular total flow factor kQ, which takes into account the influence of the edge shape and the development of the overflow line in the plan, thereby affecting the regulator capacity. The values of the kQ coefficient (Figure 8) were calculated as the ratio of the total flow value from the following proposed formula:
where kQ is the modular flow coefficient; (dm3·s−1) is the measured total flow rate of S, U, and Z regulators for a module width b (m); and (dm3·s−1) is the calculated total flow rate of the C regulator for module width b (m).
The impact of the shape of the overflow edge, the height of the sill, and the development of the crest line on the resulting increase in the flow rate depending on the elevation of the upper water above the overflow H (cm) was different for the tested S, U, and Z regulators. In the studied range of changes in H, two zones of influence of the development of the overflow line and the shape of the overflow edge on the regulator’s discharge rates were distinguished: (1) the lower zone of free flow, which was characterized only by the influence of the edge shape and the height of the sill, and (2) the upper zone of influence, within which the regulator’s discharge was also conditioned by the development of the shape of line transfer in the plan view. The modular flow rate change zones were separated by a point with coordinates (Hgr, kQgr). The values of Hgr of the upper water depth above the overflow and kQgr of the modular flow coefficient were determined by the intersection of the curves marked (a) for the free-flow zone and (b) for the beam shape influence zone in Figure 8 (rows 10 and 11 in Table 4). The curves presented in the figure were calculated according to the following proposed formula:
where a3, a4, b3, b4, and c2 are the coefficients of Equation (12) presented in Table 4.
In the lower free-flow zone below the Hgr limit elevation, the influence of the shape of the overflow edge on the output was small or absent (curves 1a, 2a, 3a, and 4a in Figure 8). After exceeding the Hgr elevation, there was a clear influence of the shape of the overflow on the flow of the regulators, which translated into a decrease in the value of the modular flow coefficient (curves 1b, 2b, 3b, and 4b in Figure 8). Approximation curves developed according to Formula (12) for the upper influence zone were used to extrapolate the value of the kQ coefficient into the elevation zone H (cm) above the test range up to H = 16.0 cm above the overflow level of the regulators (curves 1c, 2c, 3c, and 4c in Figure 8).
For the C4–S4 variant, there was a slight variation in the value of the coefficient kQ of the modular flow rate coefficient in the range of the tested damming height above the overflow (curves 1a,b in Figure 8). At small depths below 4.0 cm, the kQ coefficient decreased from 1.22 to 1.20. Above the 14.89 cm layer, its values were stabilized at kQ = 1.19. For the C2–U2 variant, in the area of the lower water depth zone, the value of the modular total flow coefficient increased from kQ = 1.68 at a depth of 2.0 cm to kQ = 1.75 at a depth of 3.48 cm (curve 2a in Figure 8). When the water depths above the overflow crest exceeded the limit depth Hgr, the shape of the overflow edge in the plan had an impact on the discharge, which caused the coefficient to drop to kQ ≅ 1.48 for H = 10.72 cm (curve 2b in Figure 8). For the C1–Z1 variant, with a sill height of 20.5 cm with low fillings up to Hgr = 4.58 cm, the value of the kQ factor varied from 1.54 to 1.68. After exceeding Hgr, the value of the coefficient decreased to kQ ≅ 1.60 in the scope of the conducted measurements and to kQ = 1.55 in the scope of curve extrapolation. For the C2–Z2 variant, with a sill height of 41.6 cm in the filling range from 2.0 cm to Hgr = 4.32 cm, the value of the kQ coefficient increased from 1.58 to 1.72. Then, it decreased to 1.63 in the measuring range and to 1.51 in the extrapolation range to a depth of 16.0 cm.
The output of the Z regulators was influenced by the height of the upper sill, which is indicated by the course of curves 3a and 4a as well as 3b and 4b in Figure 8. Below the filling limit, the modular kQ coefficient was greater for the Z2 variant than for the Z1 variant, while the relationship was inverse above the filling limit. This trend was also maintained in the area of extrapolation of the kQ coefficient value to a depth of 16.0 cm. The influence of the shape of the overflow plan is illustrated by curves 2a,b for the U2 variant and curves 4a,b for the Z2 variant. For small water depths below 3.48 cm, the regulator with circular corner shapes, namely variant U2 (curve 2a in Figure 8), had an output greater than the regulator with angular corner shapes, namely variant Z2 (curve 4a in Figure 8). After the filling Hgr = 4.32 cm was exceeded, the relationship was reversed. As a result, at a depth of 16.0 cm, the extrapolated values of the kQ coefficient became stabilized at the level of 1.42 for the C2–U2 variant and at 1.51 for the C2–Z2 variant.
5. Conclusions
The results of laboratory tests made it possible to determine the outflow coefficients of four types of regulators and their hydraulic characteristics, which is important in both designing these structures and using them in the field as measuring devices. The practical advantage of the tested regulators is the possibility of precise control of water level and flow due to low water losses resulting from the high tightness of the structures compared to those commonly used at present. The impact of the shape of the overflow edge, the development of the overflow in the plan, the height of the sill, and the water depth above the overflow crest on the discharge of the regulators was analyzed. In the present study, the water flowed to the weir frontally and overflowed into the interior of the labyrinth formed by the beams. The conclusions therefore only apply to such hydraulic situations. The different hydraulic conditions do not allow comparison of the results of this work with those from the literature [29,30,31,32,33,34]. Comparing results for two different hydraulic schemes is a research error. From the charts presented in Figure 5, Figure 6, Figure 7 and Figure 8, it can be seen that individual factors affected the discharge of regulators to varying degrees. A common feature of the studied regulators was the fact that the impact of these factors stabilized after reaching a certain water level above the crest of the overflow. The level of this stabilization, expressed by the modular total flow coefficient, was different for the tested regulator models. In the range of the measured water depths above the overflow, the modular flow factor was equal to kQ = 1.19 for the depth H = 14.9 cm in the S4 variant. The U2 variant was characterized by a modular flow coefficient of kQ = 1.48 for water depth above the overflow crest H = 10.7 cm. For the Z1 variant, the value of the modular flow coefficient was equal to kQ = 1.60 for the water depth H = 8.2 cm. For the Z2 variant, kQ = 1.63 for water depth H = 8.4 cm.
Research has shown that the discharge of regulators is influenced by the corner profile, whether it is a circular or a refracted corner. This is evidenced by the shape of curves 2b and 4b in Figure 8. The influence of the sill height, illustrated by the course of curves 3a,b and 4a,b in Figure 8, can also be noted. The values of statistical measures summarized in Table 3 for Formula (10) and in Table 4 for Formula (12) indicate a good match between the predictive models and the obtained results.
On the basis of the conducted research, the following conclusions can be drawn:
- The tested regulators are suitable for damming water in drainage ditches with flows equal to or greater than the effective flow. The S regulator with straight beams, which are mounted in side recesses without special locks, has the highest effective flow.
- The S rectilinear regulator is characterized by the lowest value of modular flow coefficient taking into account the shape of the overflow edge profile compared to other regulators.
- The capacity of regulators with beams with a developed shape in the plan depends on the shape of the overflow plan described by the type of U and Z beams, the height of the sill P, and the height of the elevation of the upper water above the overflow H (Figure 8). With water depth above the control overflow crest up to 4.0 cm, the flow increase for the U beams in the plan is greater than that for the Z beams with a refracted shape in the plan (curve 2a compared to curves 3a and 4a in Figure 8).
- At the same sill height P, for fillings smaller than 4.0 cm, curvilinear U beams have a higher value of modular flow coefficient than the Z beams with a refracted shape. With fillings greater than 4.0 cm, the opposite relationship occurs (curve 2 compared to curve 3 in Figure 8). The height of the overflow sill for the same beam shape in the plan (Z1 and Z2 variants) changes the value of the modular flow coefficient (curve 3 compared to curve 4 in Figure 8).
Author Contributions
Conceptualization, S.B. and J.U.; methodology, Z.P.; laboratory tests, P.S.; validation, R.O., Z.P., and S.B.; formal analysis, S.B. and P.S.; investigation, writing—review and editing, J.U.; resources, P.S.; data curation, J.U. and Z.P.; writing—original draft preparation, A.B.; writing—review and editing, visualization, J.U. and P.S.; visualization, S.B.; supervision, J.U.; project administration, R.O. All authors have read and agreed to the published version of the manuscript.
Funding
This research was funded by the project “Technological innovations and system of monitoring, forecasting and planning of irrigation and drainage for precise water management on the scale of drainage/irrigation system (INOMEL)” under the BIOSTRATEG3 program funded by the Polish National Centre for Research and Development, contract number BIOSTRATEG3/347837/11/NCBR/2017.
Institutional Review Board Statement
Not applicable.
Informed Consent Statement
Not applicable.
Data Availability Statement
Not applicable.
Acknowledgments
Administrative and technical support was provided by the BIOSTRATEG3 program funded by the Polish National Centre for Research and Development.
Conflicts of Interest
The authors declare no conflict of interest.
References
- Climate Change 2014 Synthesis Report, IPICC, 2015, Switzerland. Available online: https://www.ipcc.ch/site/assets/uploads/2018/02/SYR_AR5_FINAL_full.pdf (accessed on 11 February 2022).
- PGWP 2019. Projekt Plan Przeciwdziałania Skutkom Suszy (PPSS). Państwowe Gospodarstwo Wody Polskie, Warszawa, Sierpień 2019. Available online: https://www.wody.gov.pl/nasze-dzialania/stop-suszy (accessed on 11 February 2022). (In Polish)
- Przybyła, C.Z.; Szafrański, C.Z. Water management problems in agriculture in Wielkopolska. Water Environ. Rural Areas 2004, 4, 25–38. [Google Scholar]
- Wilderer, P.A. Applying Sustainable Water Management Concepts in Rural and Urban Areas: Some Thoughts About Reasons, Means and Needs. Water Sci. Technol. 2004, 49, 8–16. [Google Scholar] [CrossRef] [PubMed]
- Ankum, P.; Renault, D. Modernization of Irrigation Systems–Technical Modules; FAO Land & Water Division, Masscote: Rome, Italy, 2008; pp. 1–32. [Google Scholar]
- Machiels, O.; Erpicum, S.; Dewals, B.J.; Archambeau, P.; Pirotton, M. Piano Key Weirs: The experimental study of an efficient solution for rehabilitation. WIT Trans. Ecol. Environ. 2010, 133, 95–106. [Google Scholar] [CrossRef] [Green Version]
- Oleszczuk, R.; Stocka, I.; Urbański, J.; Hewelke, E. Ocena stanu technicznego budowli wodno-melioracyjnych na obiekcie nawodnień podsiąkowych Solec. Wiadomości Melior. I Łąkarskie 2016, 2, 72–76. (In Polish) [Google Scholar]
- Oleszczuk, R.; Stocka, I.; Urbański, J.; Hewelke, E. Stan techniczny budowli piętrzących na przykładzie wybranego systemu nawodnień podsiąkowych. Water Environ. Rural Areas 2017, 17, 89–100. (In Polish) [Google Scholar]
- Schuurmans, J.; Hof, A.; Dijkstra, S.; Bosgra, O.H.; Brouwer, R. Simple Water Level Controller for Irrigation and Drainage Canals. J. Irrig. Drain. Eng. 1999, 125, 189–195. [Google Scholar] [CrossRef]
- Popek, Z.; Bajkowski, S.; Siwicki, P.; Urbański, J. Laboratory Tests of New Groundwater Table Level Regulators in Subsurface Drainage Systems. Water 2021, 13, 631. [Google Scholar] [CrossRef]
- Skaggs, R.W.; Fausey, N.R.; Evans, R.O. Drainage water management. J. Soil Water Conserv. 2012, 67, 167A–172A. [Google Scholar] [CrossRef] [Green Version]
- Smedema, L.K.; Vlotman, W.F.; Rycroft, D.W. Modern Land Drainage: Planning, Design and Management of Agricultural Drainage Systems; CRC Press: Abingdon, UK, 2004; p. 449. [Google Scholar] [CrossRef]
- Szejba, D.; Bajkowski, S. Determination of Tile Drain Discharge under Variable Hydraulic Conditions. Water 2019, 11, 120. [Google Scholar] [CrossRef] [Green Version]
- Bajkowski, S. Discharge coefficients of the horizontal vortex chamber. Sci. Pap. Univ. Agric. Krakow Environ. Engineer. Ser. 2001, 21, 673–681. (In Polish) [Google Scholar]
- Subhash, C.; Jain, M. Free-surface swirling flows in vertical dropshaft. J. Hydraul. Eng. 1987, 113, 1277–1289. [Google Scholar]
- Bajkowski, S. Hydraulic properties of horizontal vortex chamber. Adv. Hydro-Sci. Eng. 2002, 150, 47–58. (In Polish) [Google Scholar]
- Bos, M.G. Discharge Measurement Structures. International Institute for Land Reclamation and Improvement, 3rd ed.; International Institute for Land Reclamation and Improvement: Wageningen, The Netherlands, 1989; p. 402. [Google Scholar]
- Bajkowski, S. Submerged sharp-crested morning-glory-spillway criteria of submergence and the discharge coefficients. Model. Investig. Hydro-Eng. 1987, 51, 5–15. [Google Scholar]
- Harada, M. The Society of Instrument and Control Engineers. In Fluid Control and Measurement; Pergamon Press: Tokyo, Japan, 1986; Volume 1, p. 587. [Google Scholar]
- Voron, B. Regulation and management of water in irrigation canals and water saving irrigation methods and technologies. La Houille Blanche 1995, 4, 72–81. [Google Scholar] [CrossRef] [Green Version]
- Frankenberger, J.; Kladivko, E.; Sands, G.; Jaynes, D.; Fausey, N.; Helmers, M.; Brown, L. Drainage Water Management for the Midwest: Questions and Answers about Drainage Water Management for the Midwest; Purdue Extension: West Lafayette, IN, USA, 2006; 8p. [Google Scholar]
- Jaynes, D.B. Changes in yield and nitrate losses from using drainage water management in central Iowa. J. Soil Water Conserv. 2012, 67, 485–494. [Google Scholar] [CrossRef] [Green Version]
- Sunohara, M.D.; Gottschall, N.; Craiovan, E.; Wilkes, G.; Topp, E.; Frey, S.K.; Lapen, D.R. Controlling tile drainage during the growing season in Eastern Canada to reduce nitrogen, phosphorus, and bacteria loading to surface water. Agric. Water Manag. 2016, 178, 159–170. [Google Scholar] [CrossRef]
- Sojka, M.; Kozłowski, M.; Stasik, R.; Napierała, M.; Kęsicka, B.; Wróżyński, R.; Jaskuła, J.; Liberacki, D.; Bykowski, J. Sustainable Water Management in Agriculture—The Impact of Drainage Water Management on Groundwater Table Dynamics and Subsurface Outflow. Sustainability 2019, 11, 4201. [Google Scholar] [CrossRef] [Green Version]
- Brandyk, A.; Kaca, E.; Oleszczuk, R.; Urbański, J.; Jadczyszyn, J. Conceptual Model of Drainage-Sub Irrigation System Functioning-First Results from a Case Study of a Lowland Valley Area in Central Poland. Sustainability 2021, 13, 107. [Google Scholar] [CrossRef]
- Pietrucha, J.; Gralewski, J.; Kolasiński, D. Device for Water Level Control. Patent Office of the Republic of Poland Patent 237597, 2021. [Google Scholar]
- Żbikowski, A.; Bajkowski, S.; Batijewski, W.; Dąbkowski, L.; Kubrak, J.; Lipka, W. Wytyczne wymiarowania przelewów i ich kanałów odprowadzających w budowlach wodnomelioracyjnych. In Obliczenia Hydrauliczne Przelewów Budowli Wodno-Melioracyjnych; Okruszko, H., Ed.; BiblioteczkaWiadomości IMUZ: Warsaw, Poland, 1986; Volume 67, pp. 9–93. (In Polish) [Google Scholar]
- Bekheet, A.A.; AboulAtta, N.M.; Saa, N.Y.; El-Molla, D.A. Effect of the shape and type of piano key weirs on the flow efficiency. Ain Shams Eng. J. 2022, 13, 1–15. [Google Scholar] [CrossRef]
- Nezami, F.; Farsadizadeh, D.; Nekooie, M.A. Discharge coefficient for trapezoidal side weir. Alexandria University. Alex. Eng. J. 2015, 54, 595–605. [Google Scholar] [CrossRef] [Green Version]
- Emiroglu, M.E.; Kaya, N.; Agaccioglu, H. Discharge Capacity of Labyrinth Side Weir Located on a Straight Channel. J. Irrig. Drain. Eng. 2010, 136, 37–46. [Google Scholar] [CrossRef]
- Sadeghian, H.; Parvaneh, A.; Nekooie, M.A.; Parvaneh, M. Discharge characteristics of triangular labyrinth side weirs (with inclined bed) located on a straight channel. In Proceedings of the 38th Iahr World Congress, Panama City, Panama, 1–6 September 2019; pp. 1–7. [Google Scholar] [CrossRef]
- Ikinciogullari, E.; Emiroglu, M.E. Estimation of triangular labyrinth side weir discharge capacity using schmidt approach. Sigma J. Eng. Nat. Sci. 2019, 37, 289–303. [Google Scholar]
- Khalili, M.; Honar, T. Discharge Coefficient of Semi-Circular Labyrinth Side Weir in Subcritical Flow. WSA 2017, 43, 433. [Google Scholar] [CrossRef] [Green Version]
- Dursun, O.F.; Kaya, N.; Firat, M. Estimating Discharge Coefficient of Semi-Elliptical Side Weir Using ANFIS. J. Hydrol. 2012, 426–427, 55–62. [Google Scholar] [CrossRef]
Figure 1.
Gates of water level regulators in ditches: (a) sharp-crested steel gate, (b) thin-walled wooden beams, (c) vinyl straight beams, (d) vinyl composite beams (photo P. Siwicki).
Figure 1.
Gates of water level regulators in ditches: (a) sharp-crested steel gate, (b) thin-walled wooden beams, (c) vinyl straight beams, (d) vinyl composite beams (photo P. Siwicki).
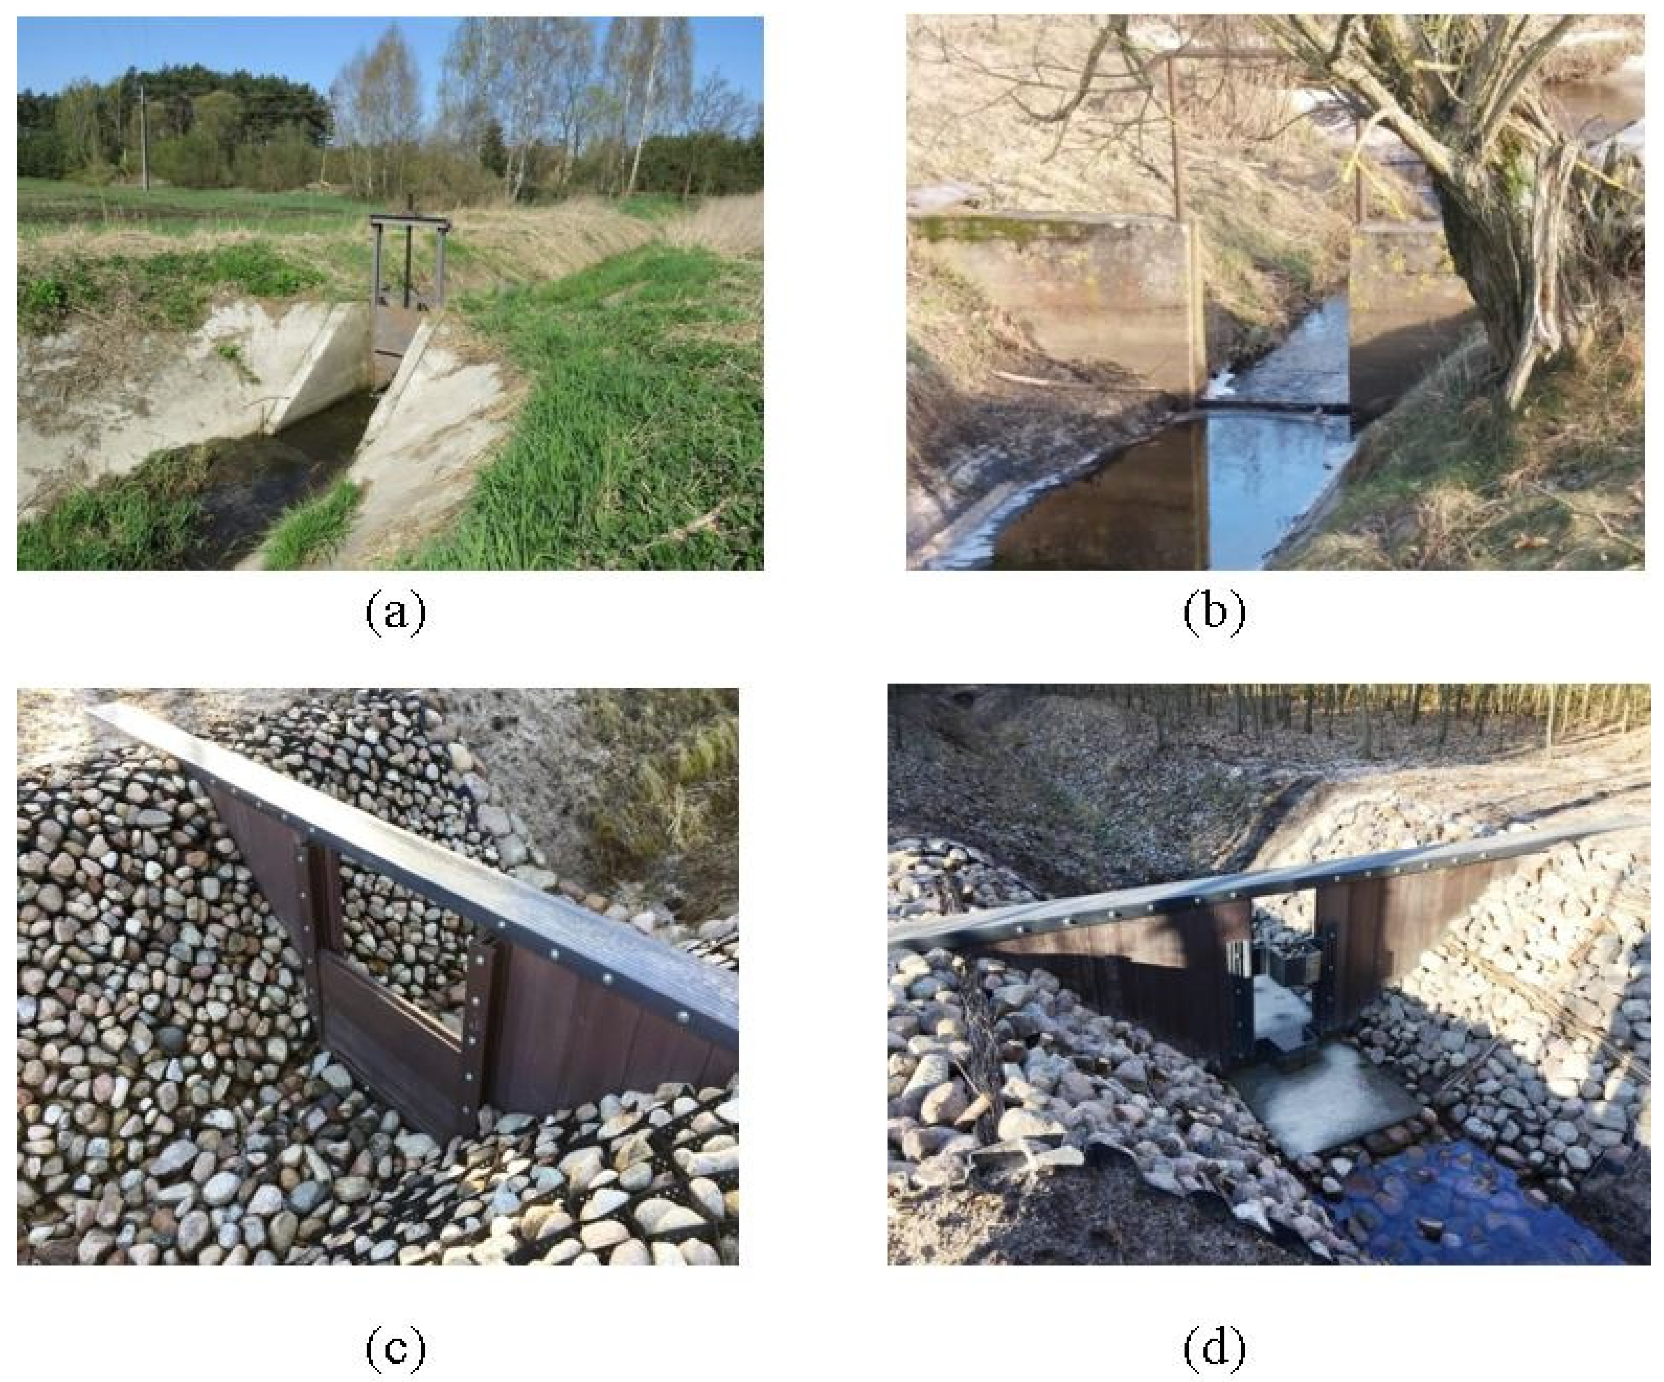
Figure 2.
Scheme of the regulator test stand: 1: flume, 2: down tank, 3: pump, 4: upper stability tank, 5: regulating valve, 6: electromagnetic flow meter, 7: precise water gauge staff, 8: regulators, H (cm): upstream water head, P (cm): height of the sill.
Figure 2.
Scheme of the regulator test stand: 1: flume, 2: down tank, 3: pump, 4: upper stability tank, 5: regulating valve, 6: electromagnetic flow meter, 7: precise water gauge staff, 8: regulators, H (cm): upstream water head, P (cm): height of the sill.
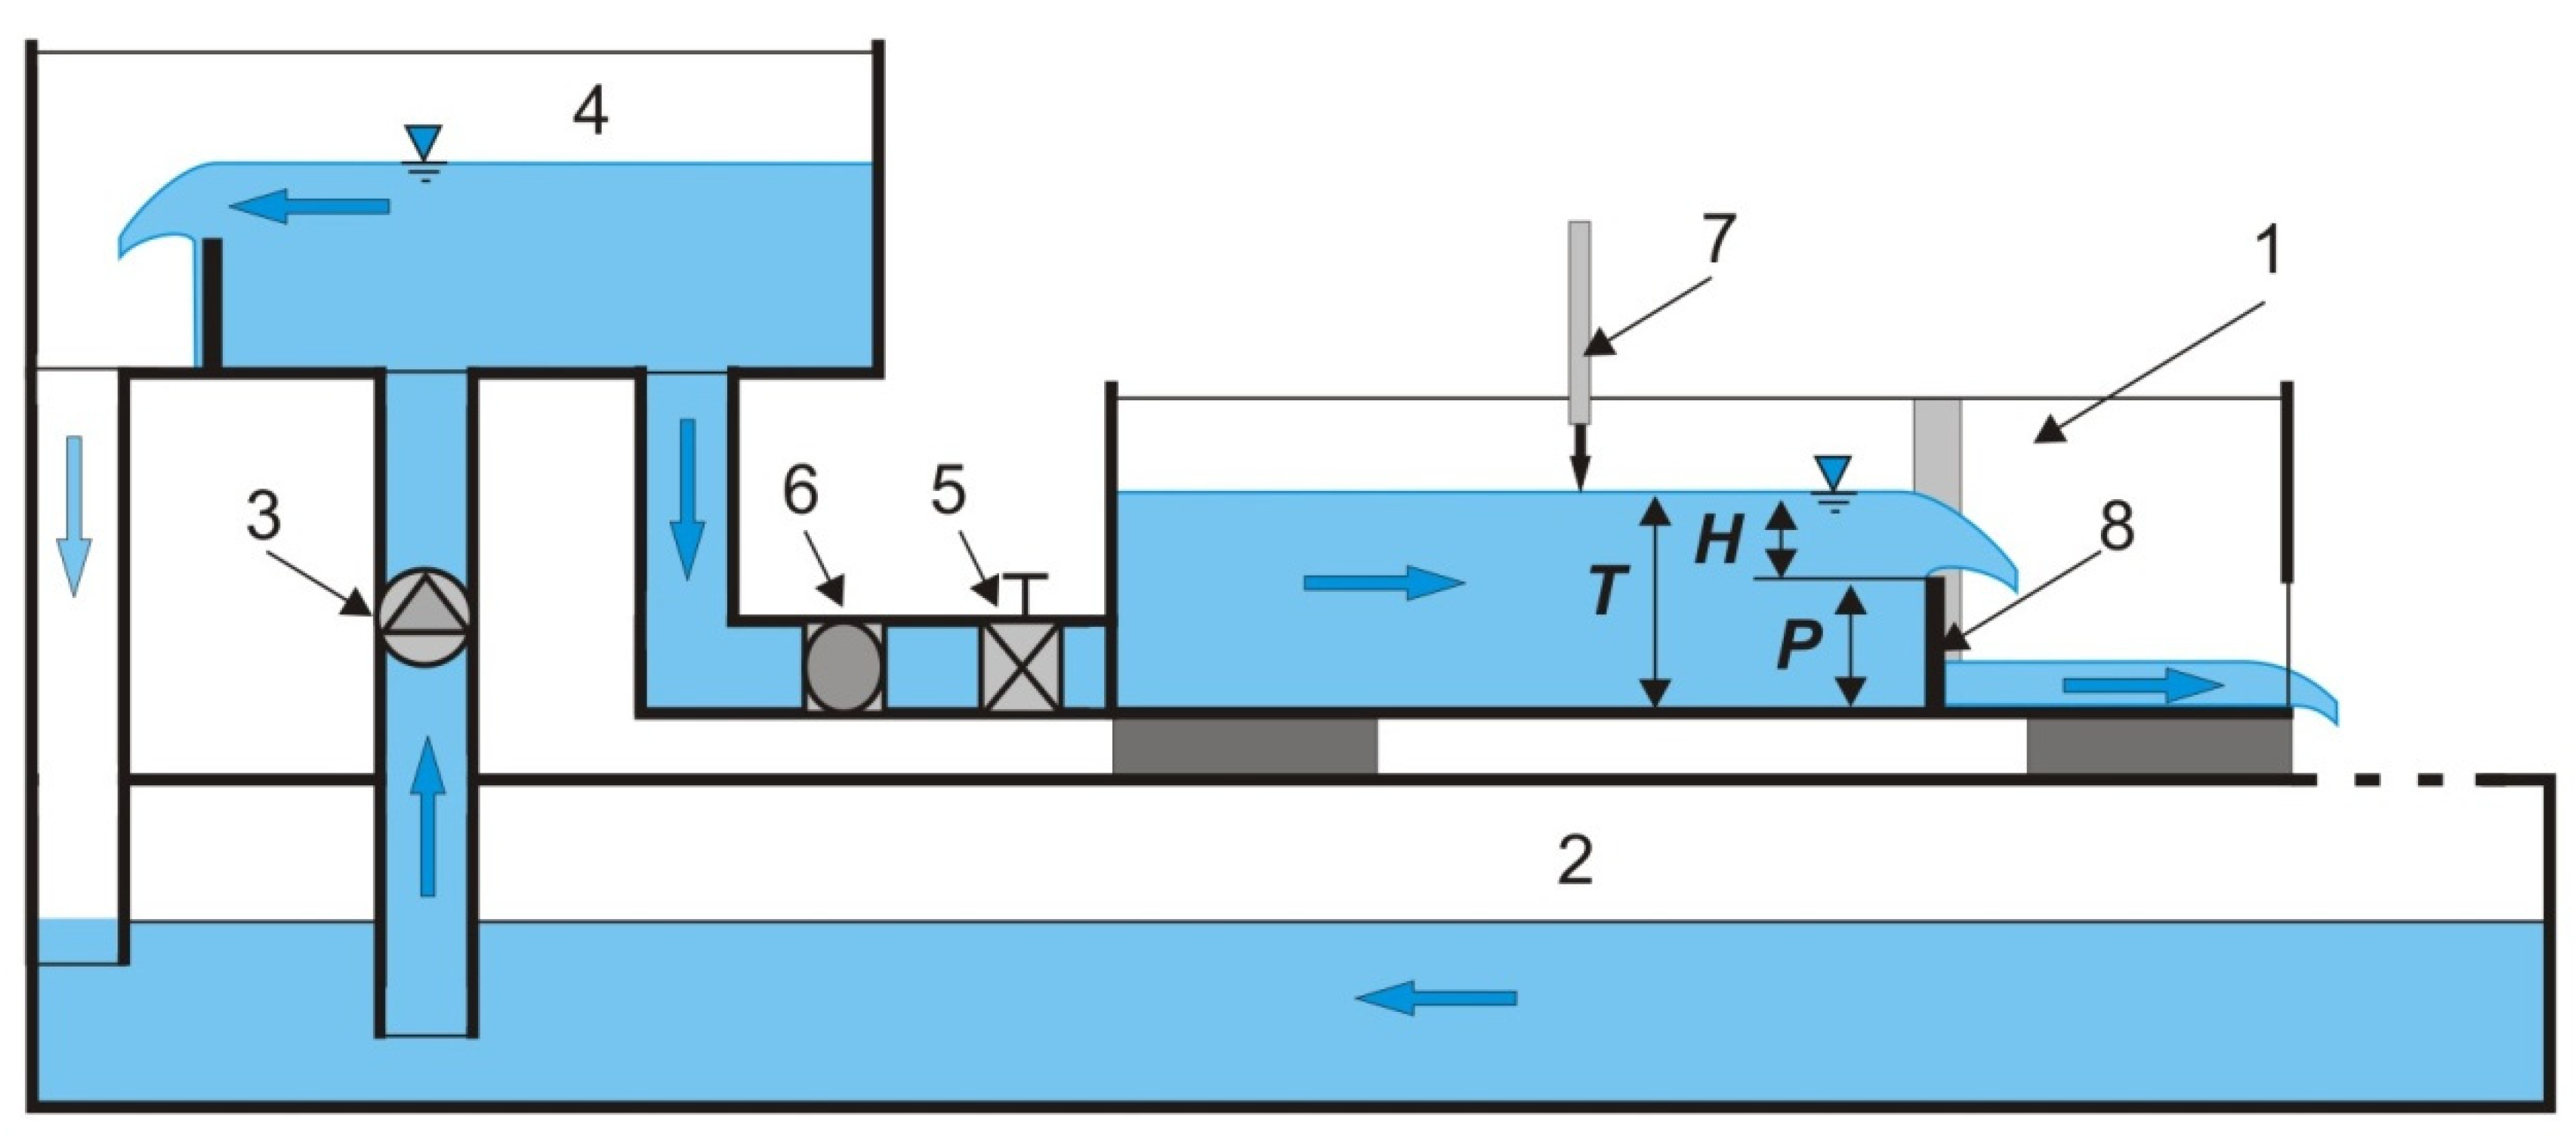
Figure 3.
Measurement schemes of the tested regulators: (a) measuring S regulator, (b) beam S regulator, (c) measuring U regulator, (d) beam U regulator, (e) measuring Z regulator, (f) beam Z regulator. 1: beam, 2: simple beam guide of S regulator, 3: beam guide with female lock of U and Z regulators, 4: beam guide with male lock of U and Z regulators.
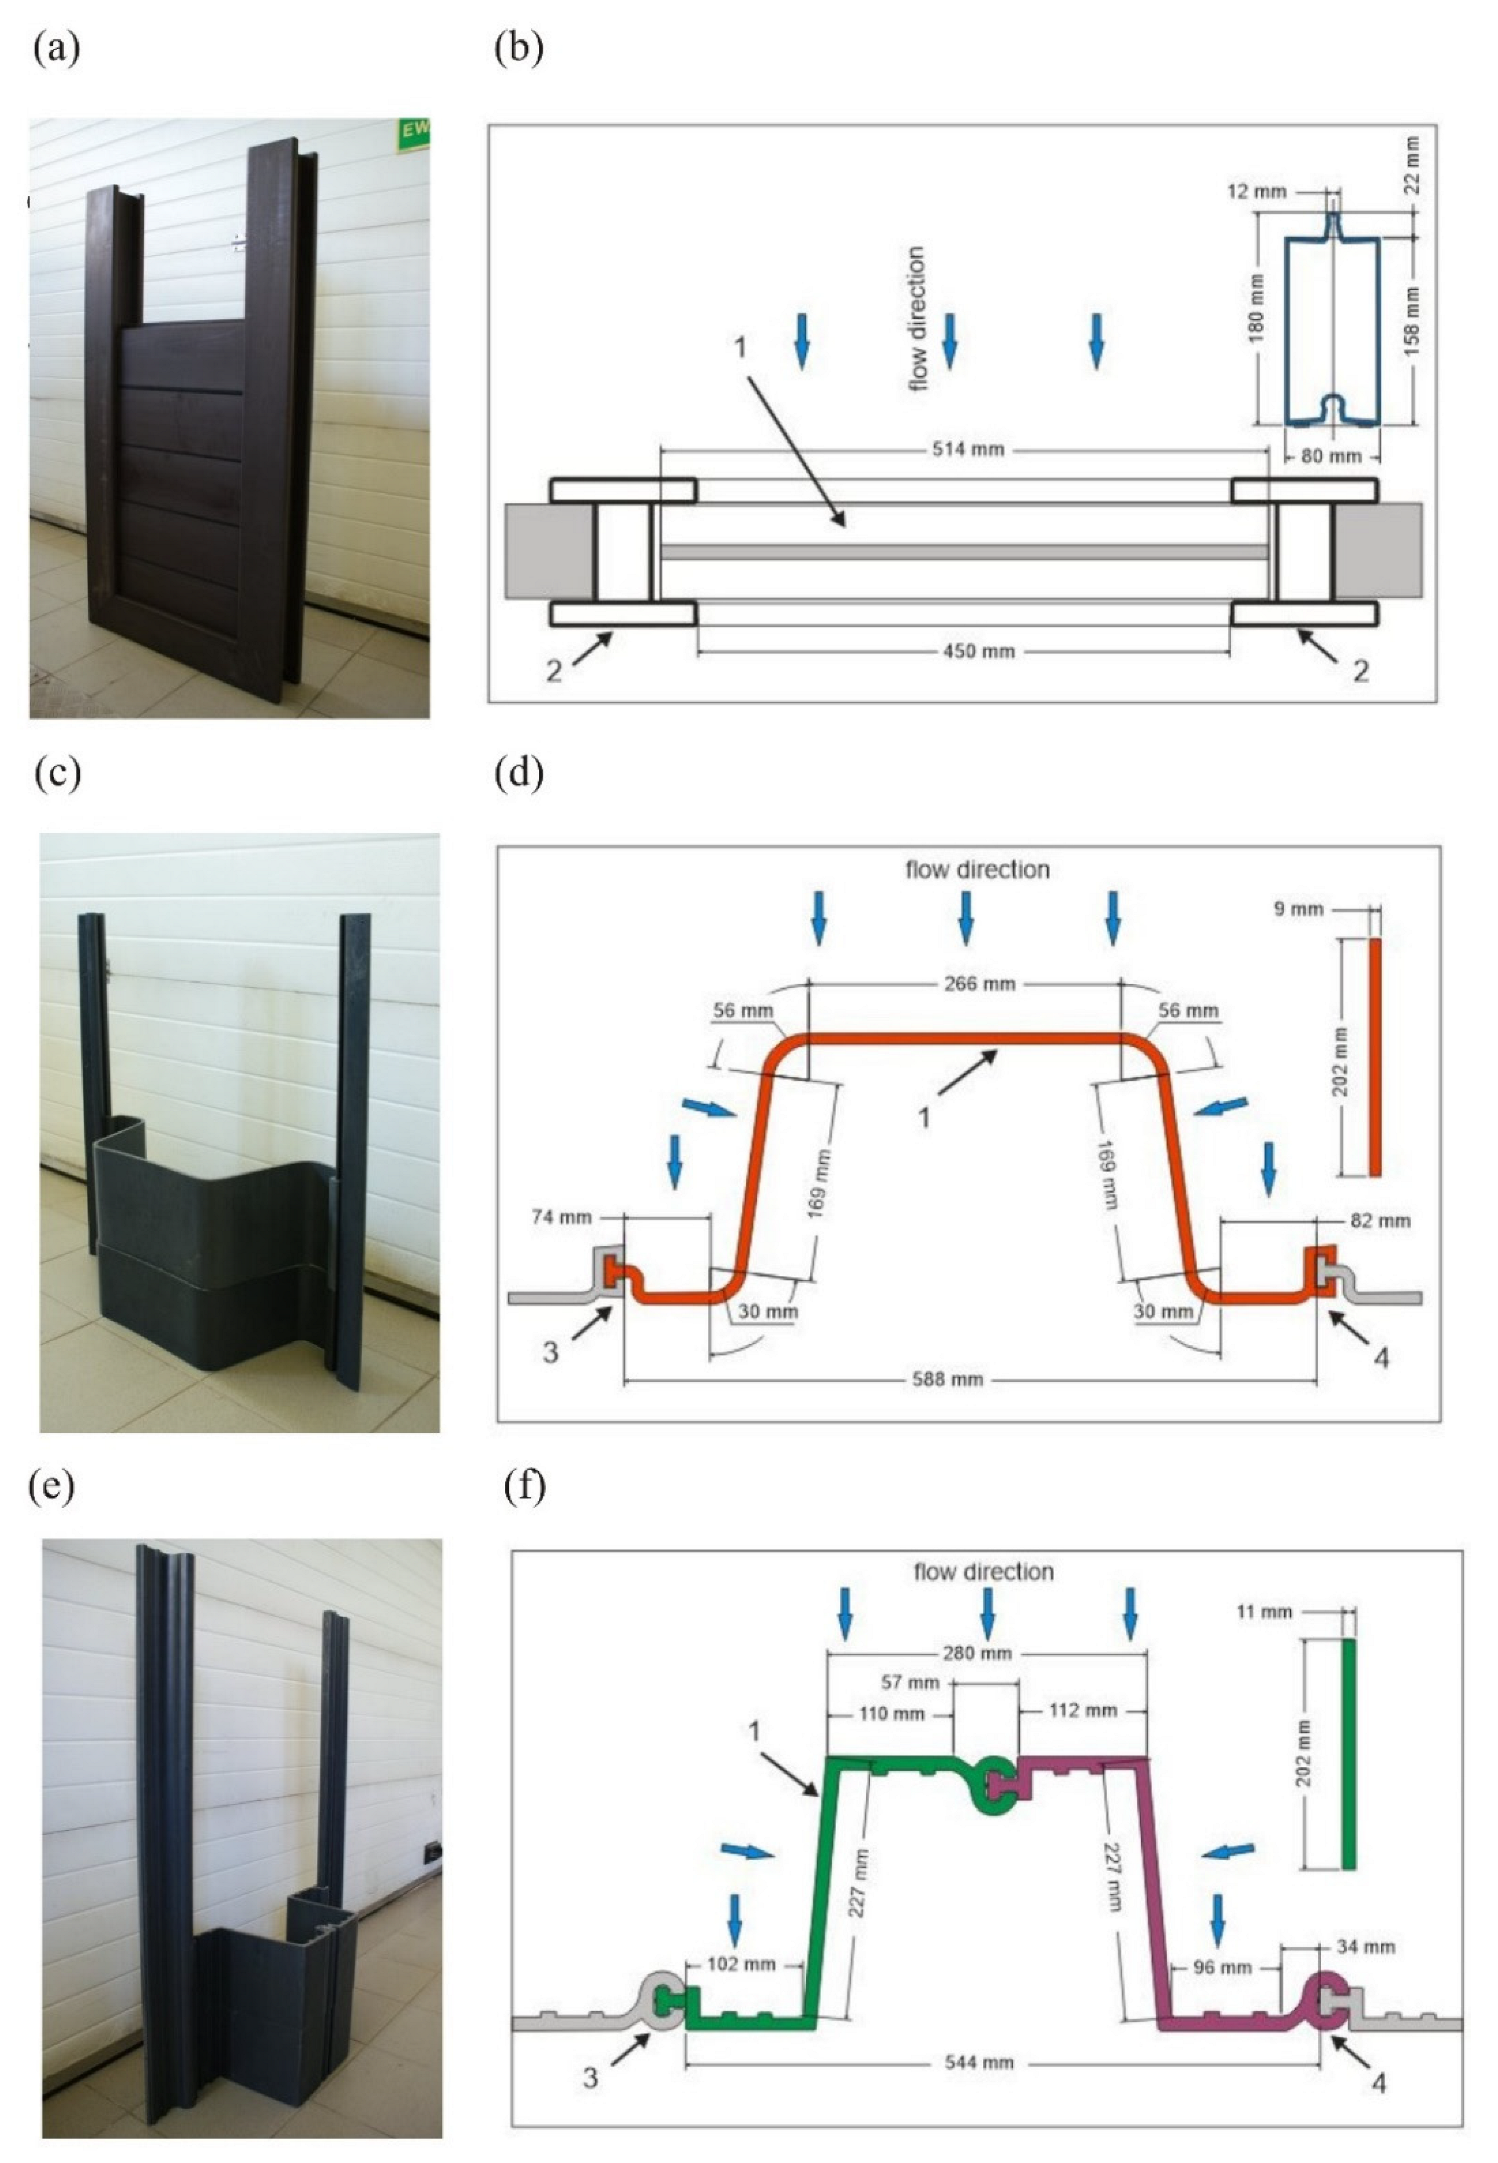
Figure 4.
Calculation modules of regulators: (a) M45 module, C4 variant; (b) M59 module, C2 variant; (c) M54 module, C1 variant; (d) M54 module, C2 variant; (e) M45 module, S4 variant; (f) M59 module, U2 variant; (g) M54 module, Z1 variant; (h) M54 module, Z2 variant. (a–d): sharp-crested C regulator, (e): rectilinear S regulator, (f): labyrinth U regulator, (g,h): compound Z regulator.
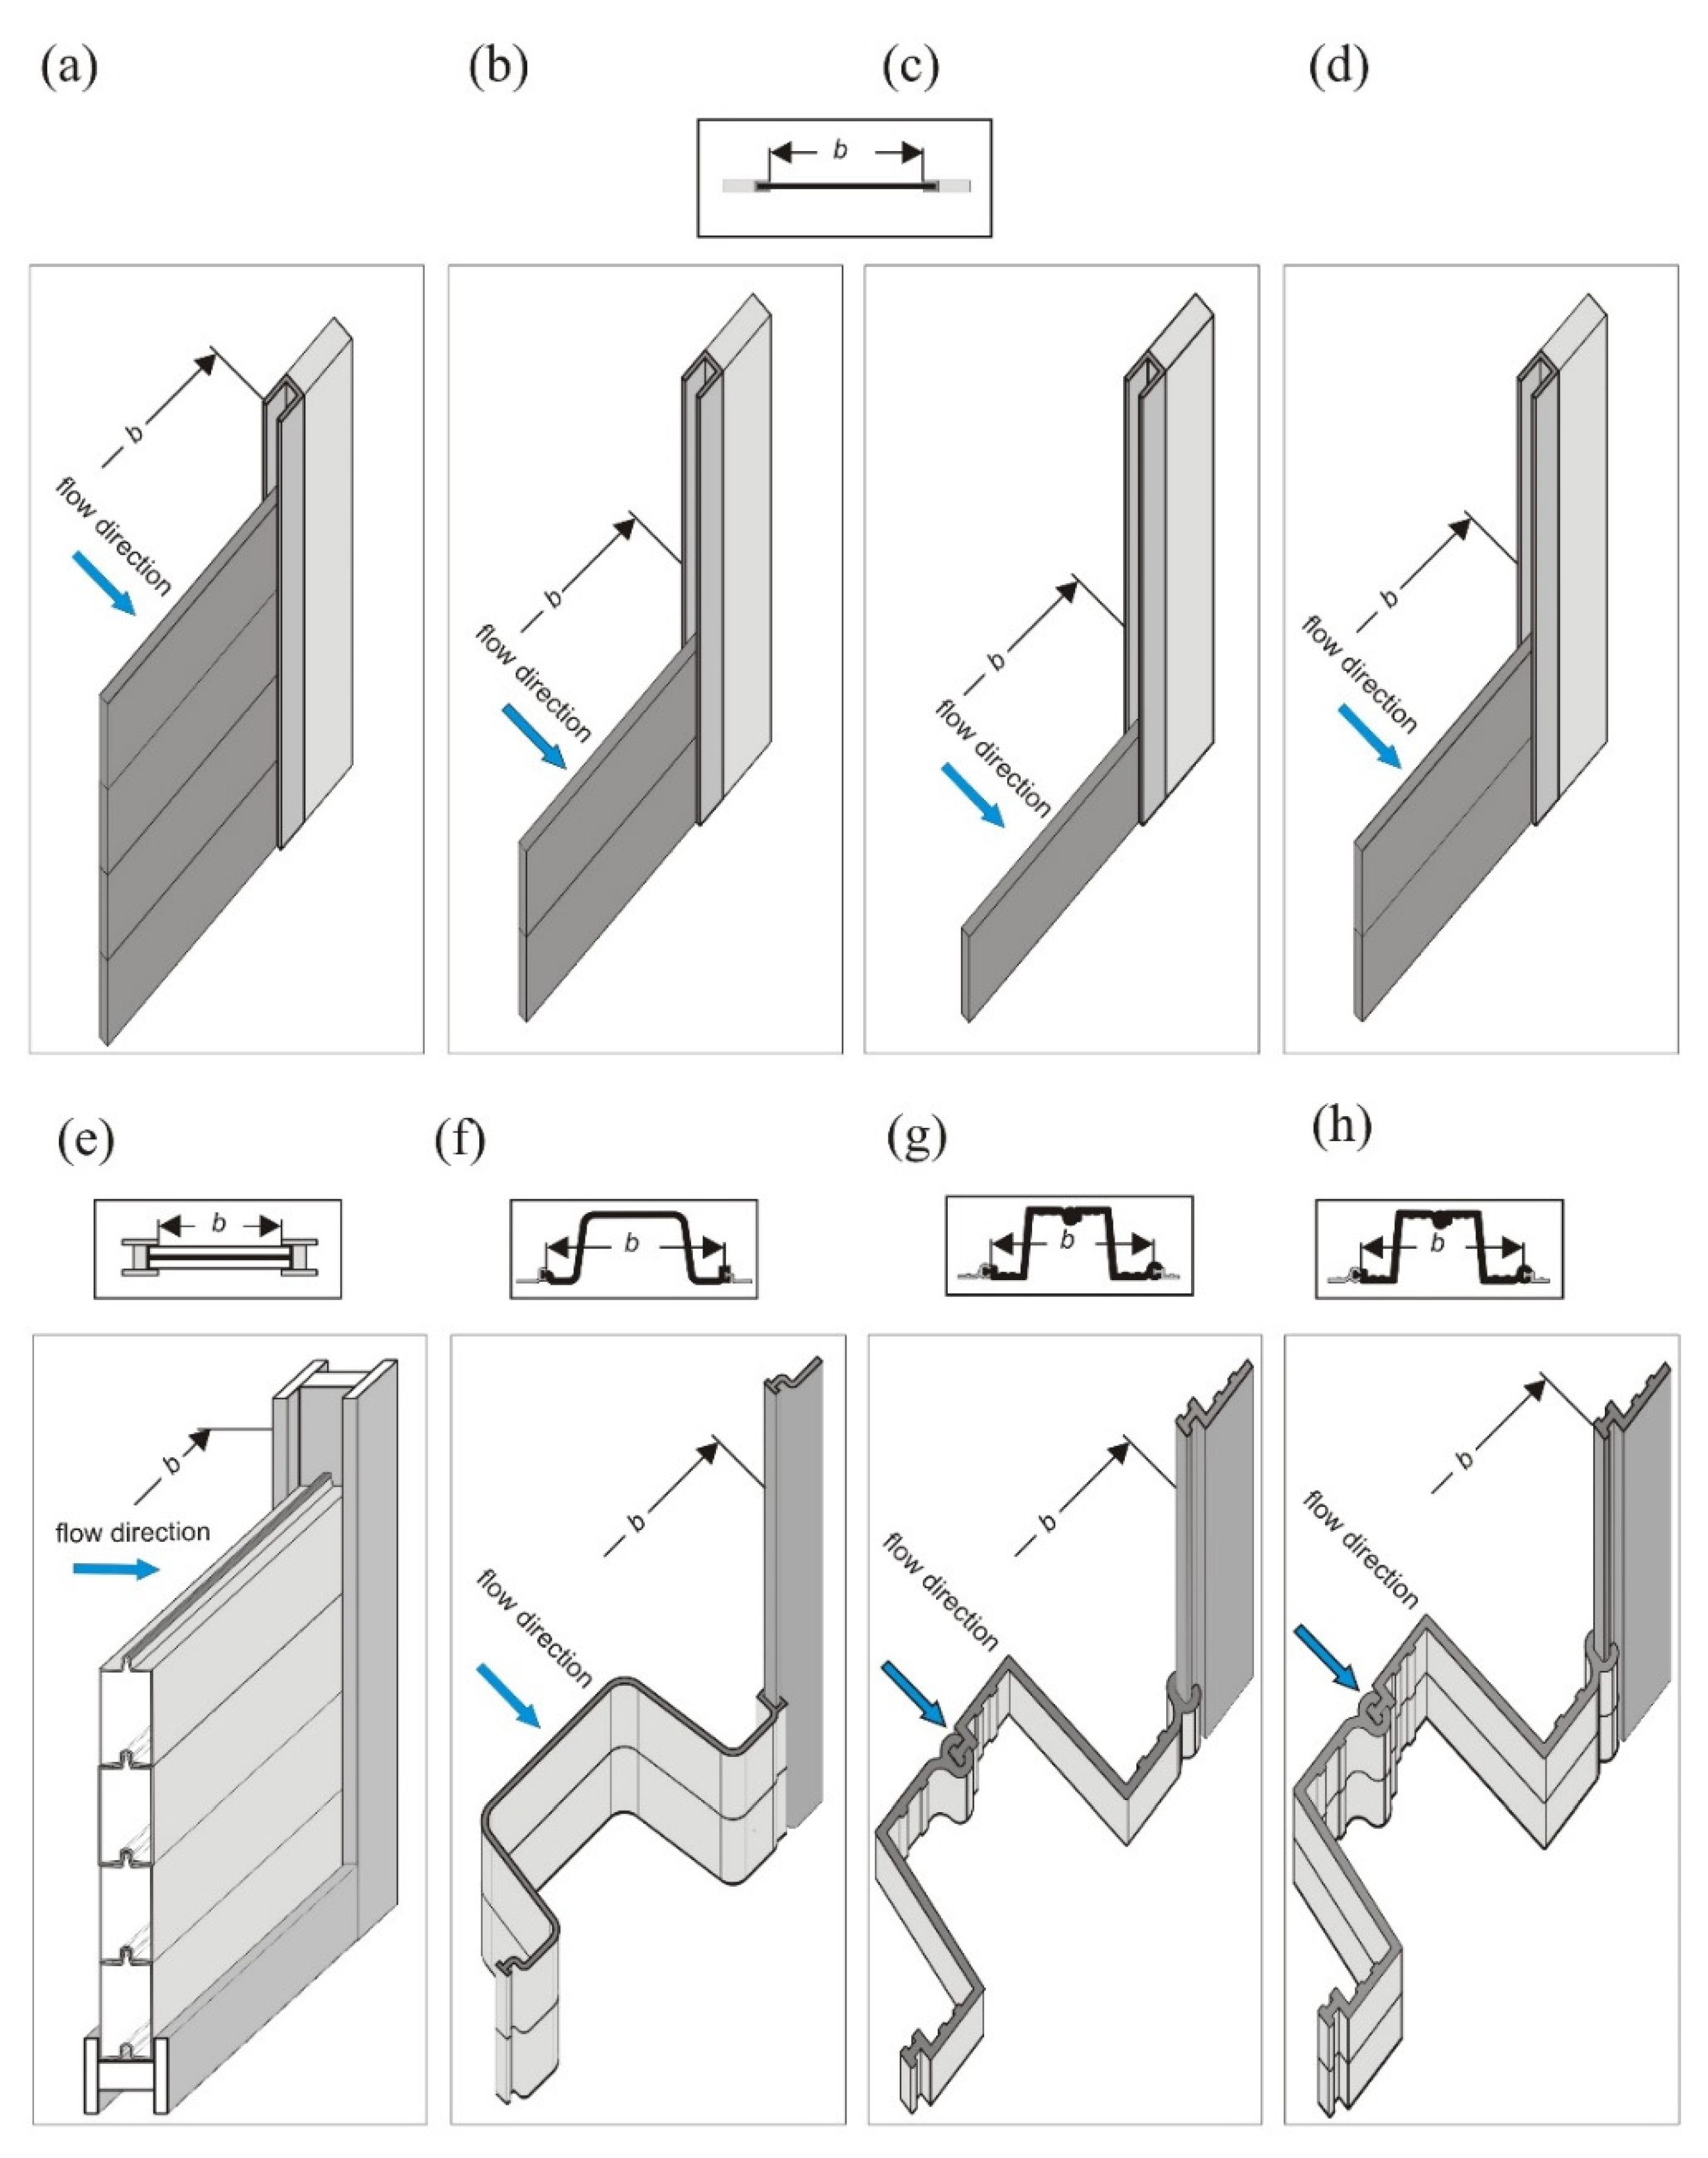
Figure 5.
Effective flow Qe of the tested regulators depending on the water depth. 1: S regulator, 2: U regulator, 3: Z regulator.
Figure 5.
Effective flow Qe of the tested regulators depending on the water depth. 1: S regulator, 2: U regulator, 3: Z regulator.
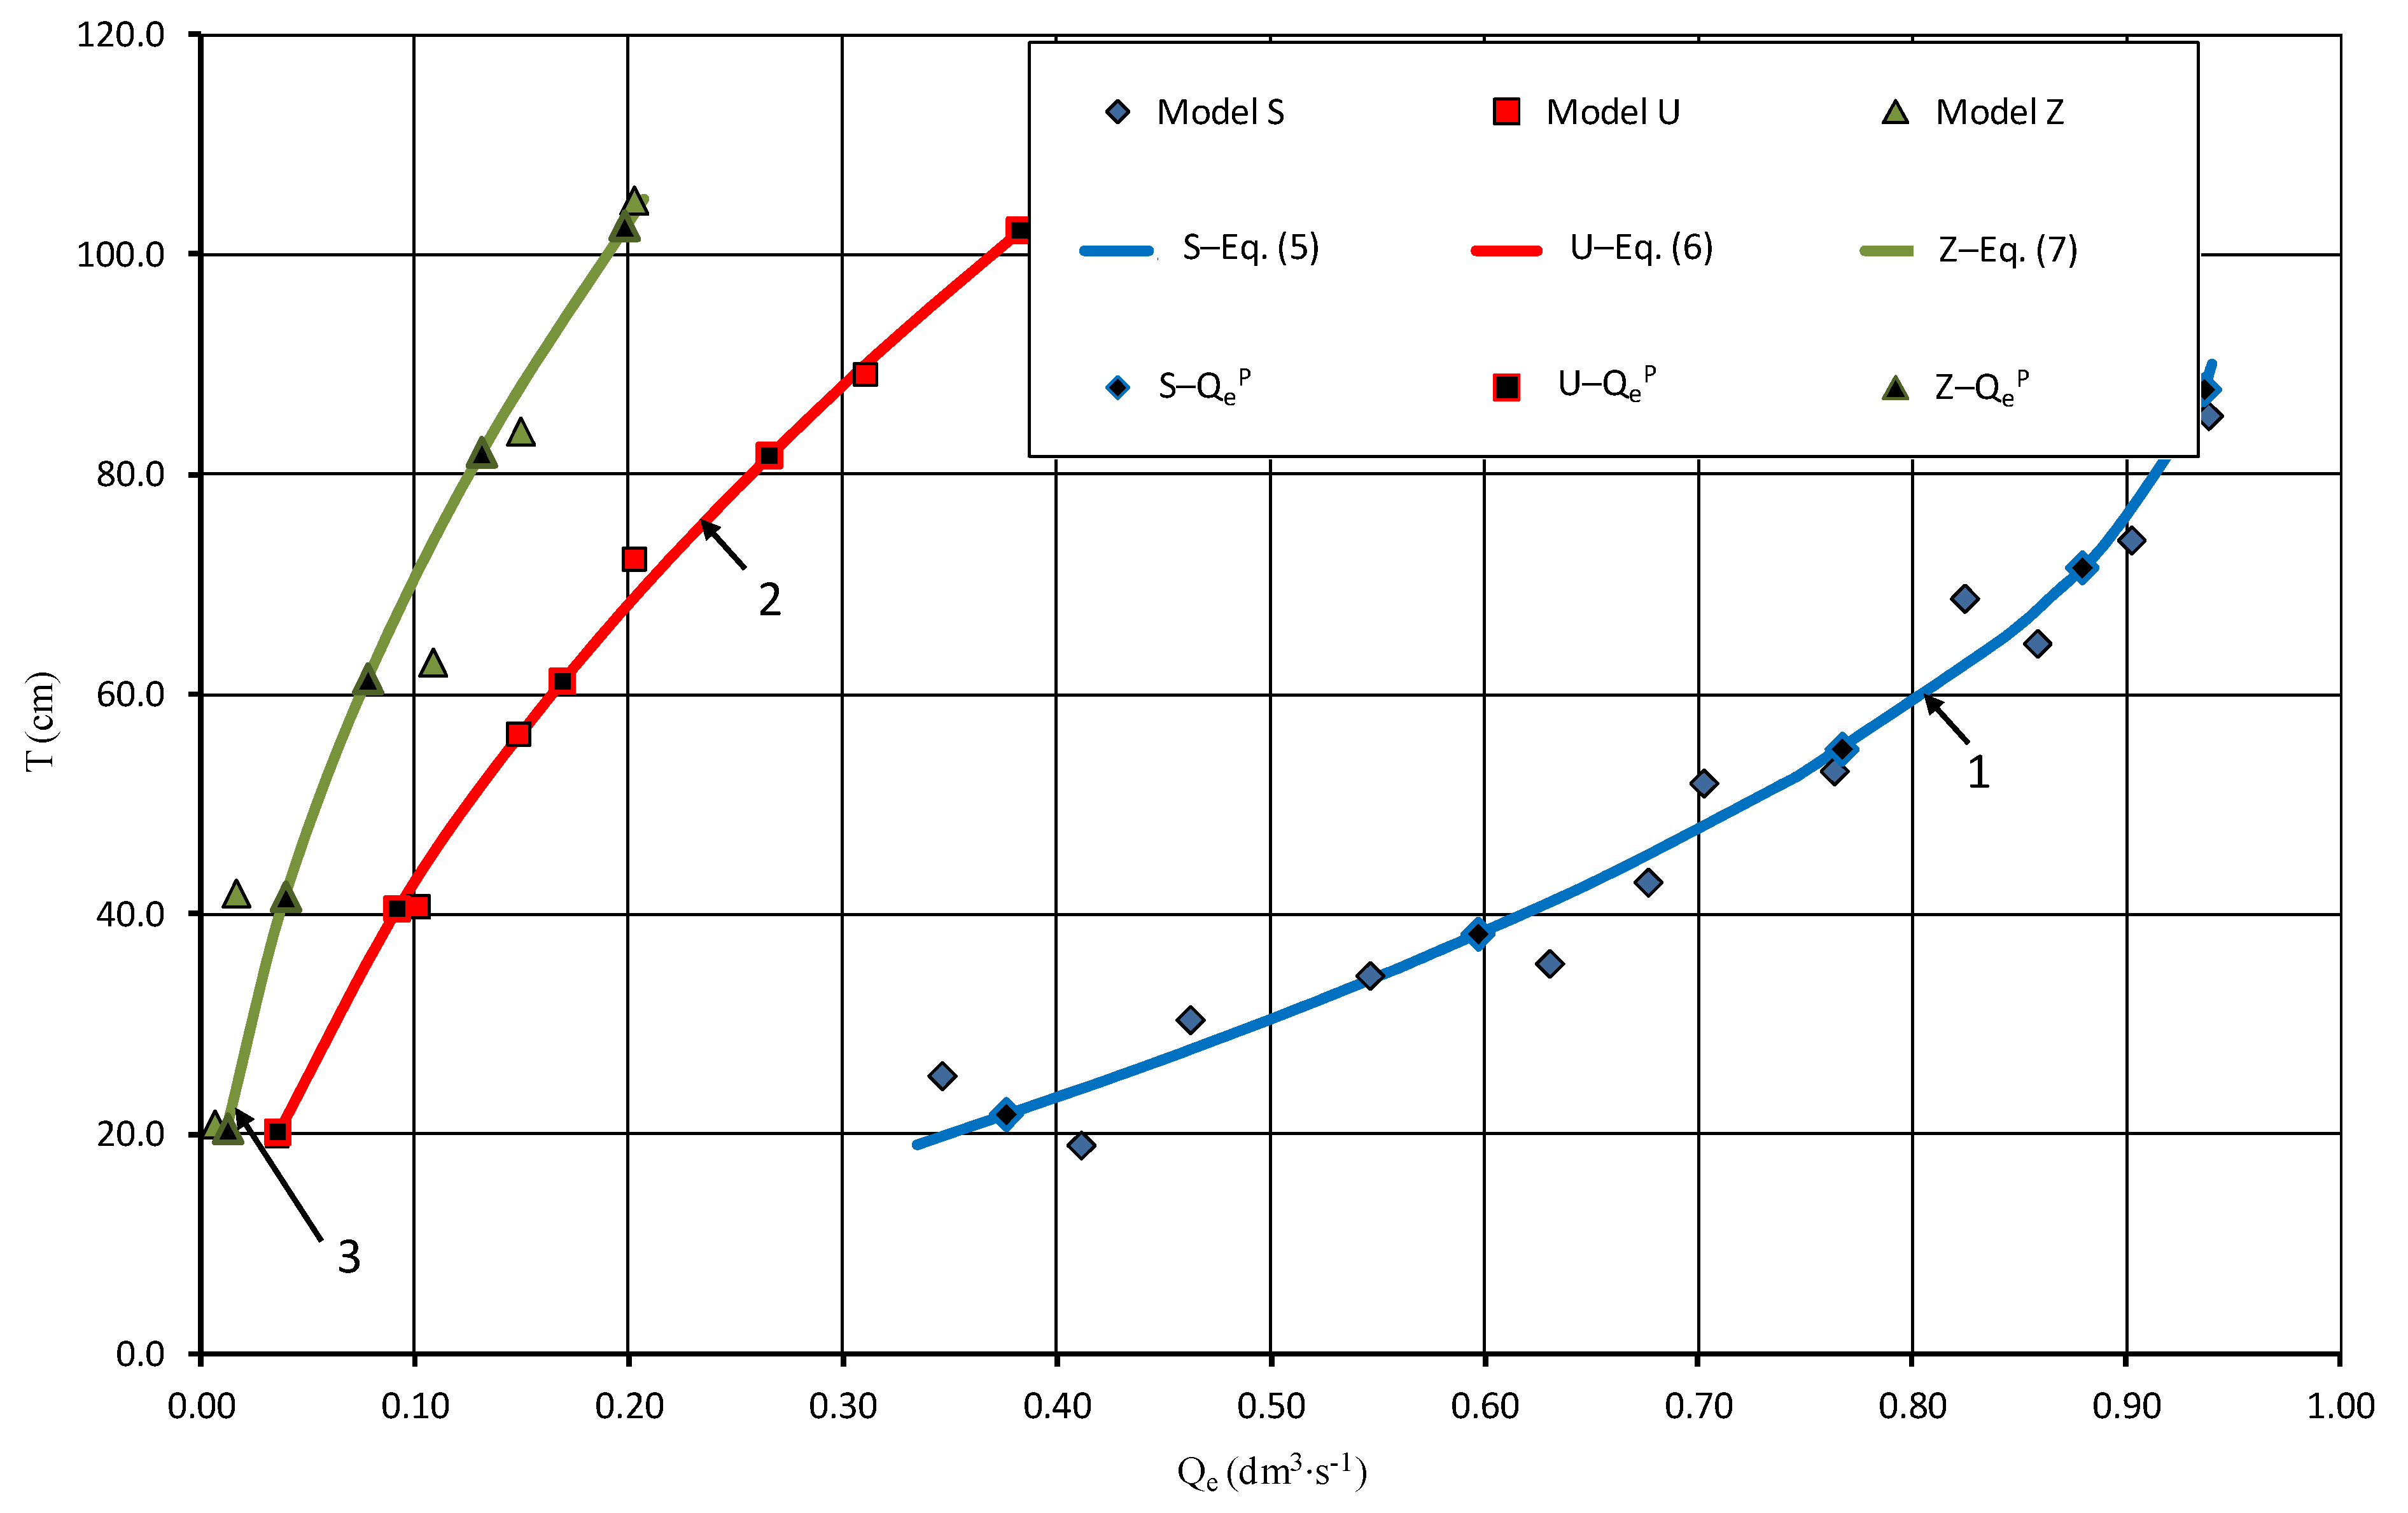
Figure 6.
Measured and calculated flow rate curves of the regulators. 1: variant S4, 2: variant U2, 3: variant Z1, 4: variant Z2, 5: variant C4–S4, 6: variant C2–U2, 7: variant C1–Z1, 8: variant C2–Z2. Series designation according to column 8 in Table 1.
Figure 6.
Measured and calculated flow rate curves of the regulators. 1: variant S4, 2: variant U2, 3: variant Z1, 4: variant Z2, 5: variant C4–S4, 6: variant C2–U2, 7: variant C1–Z1, 8: variant C2–Z2. Series designation according to column 8 in Table 1.
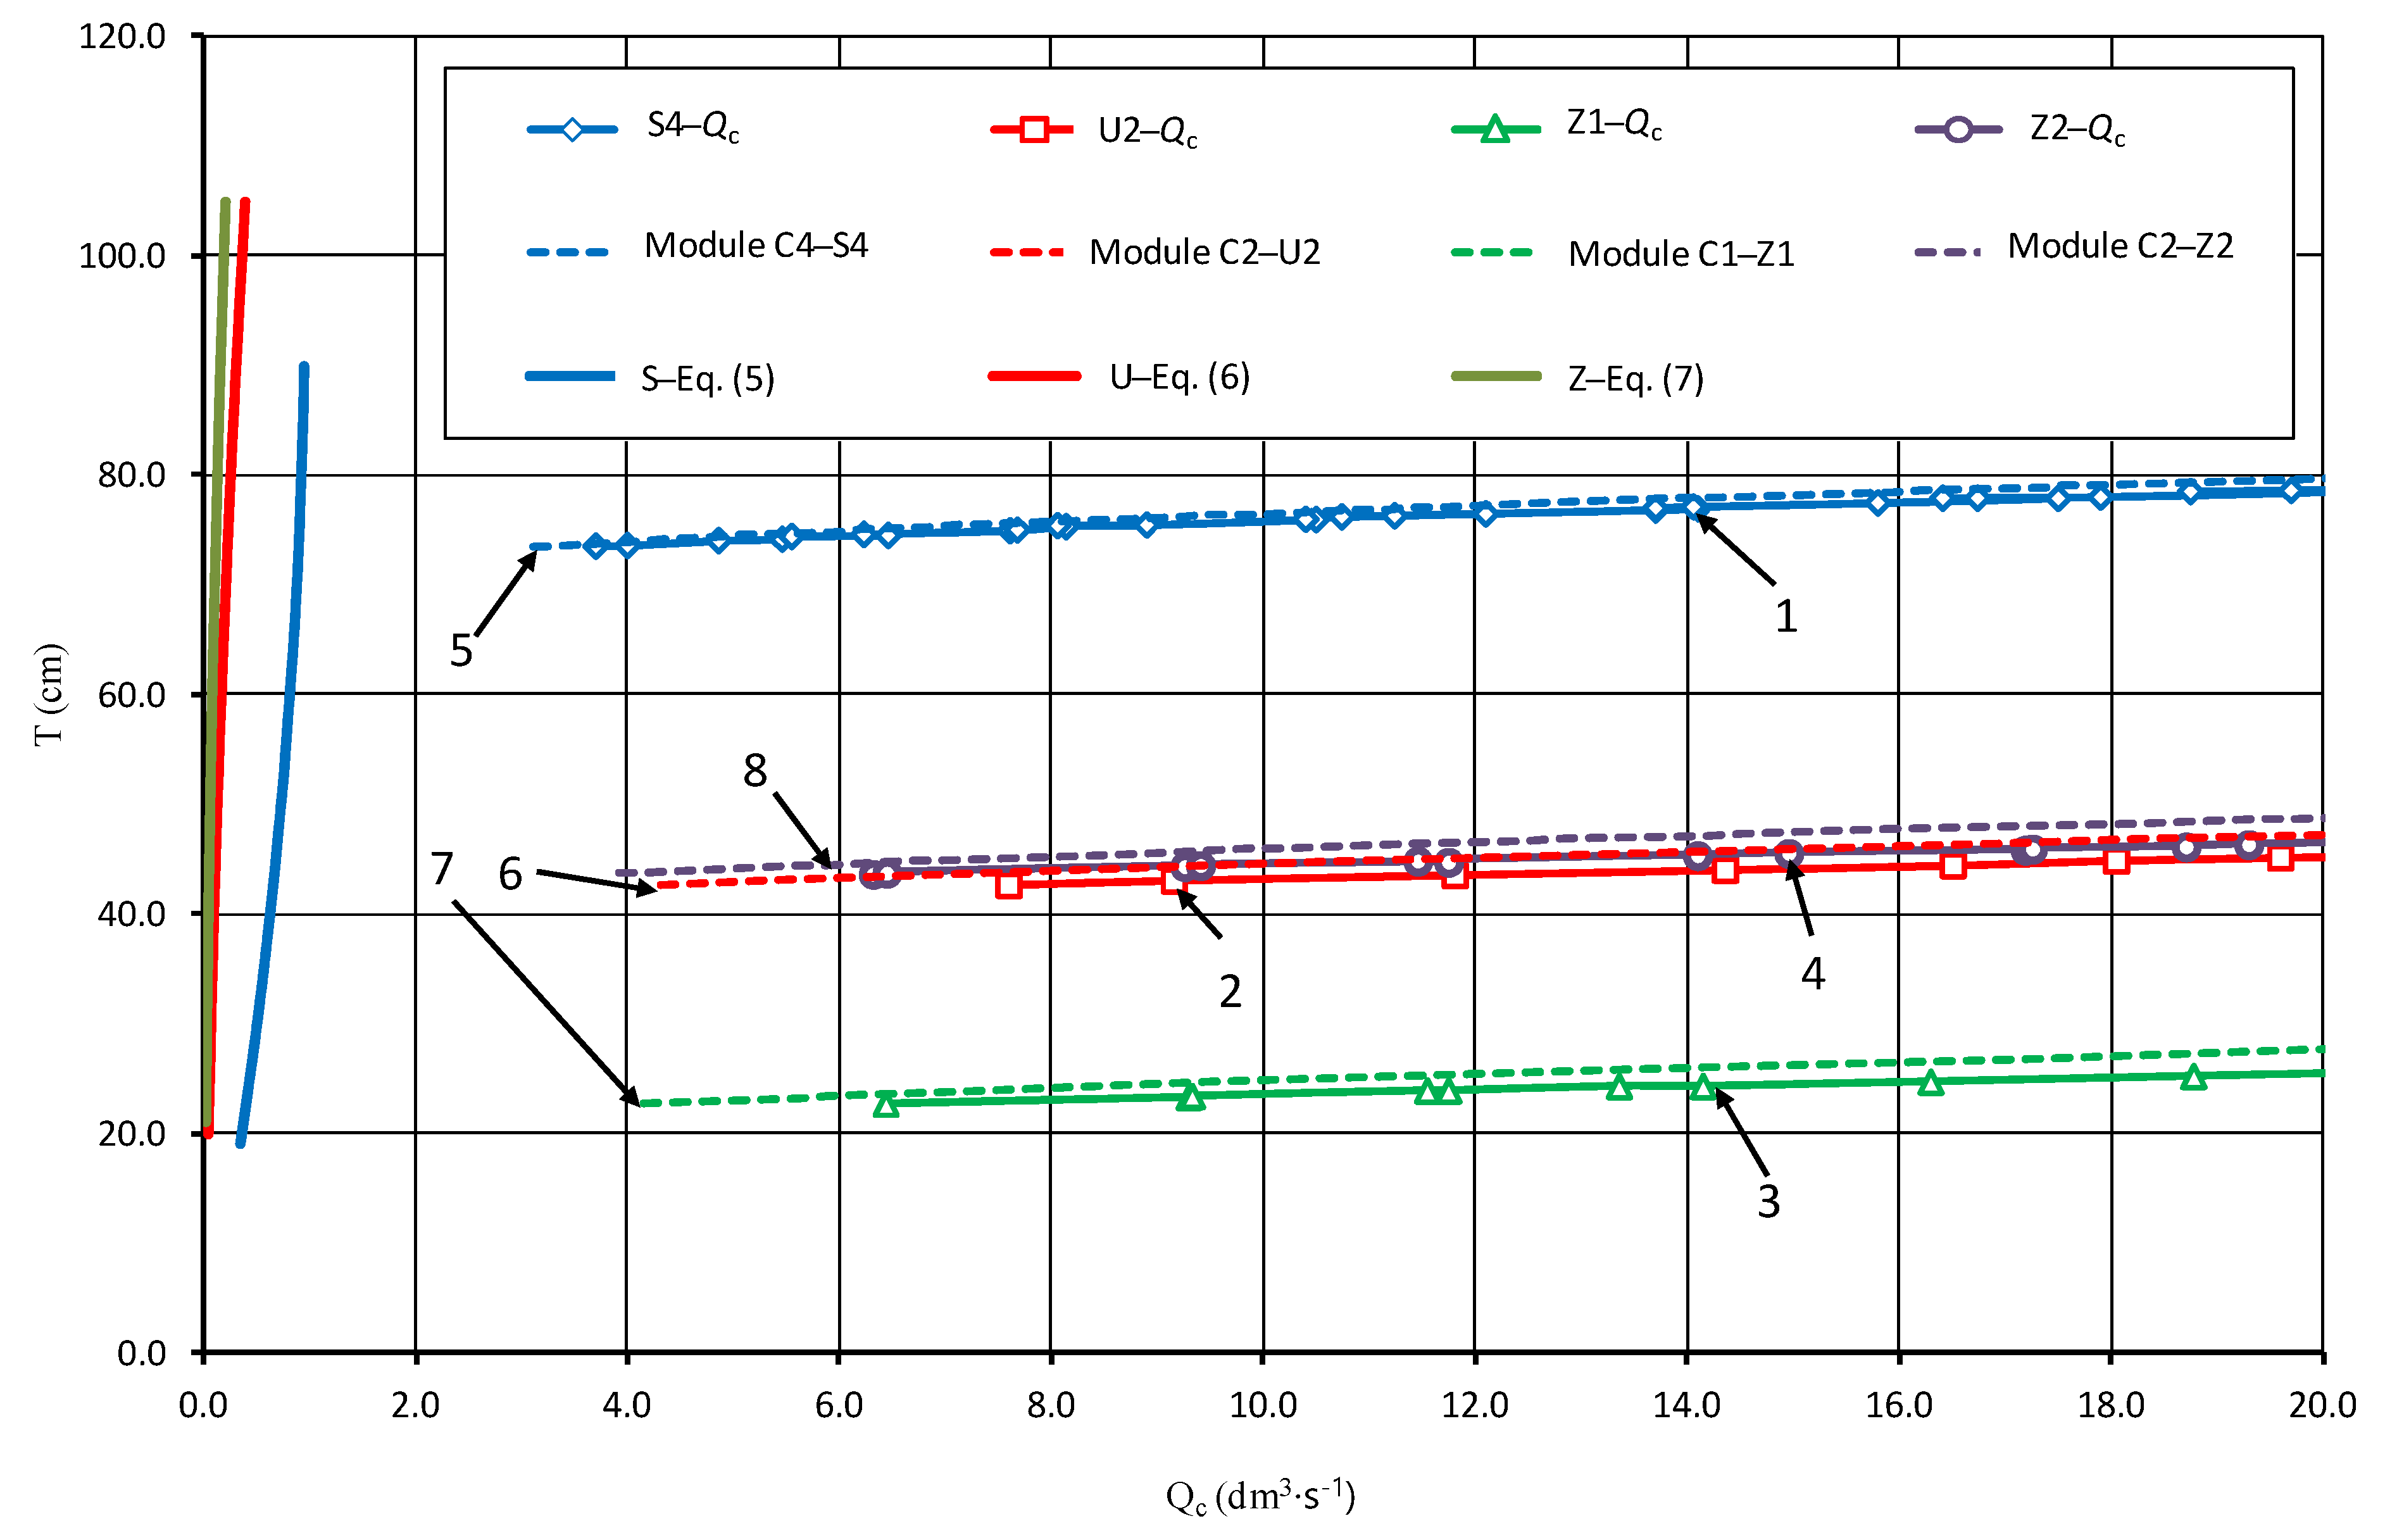
Figure 7.
Measuring points and curves of regulation discharge with different sill height. 1: variant S4; 2: variant U2; 3: variant Z1; 4: variant Z2; 5: module M45, variant C4–S4; 6: module M59, variant C2–U2; 7: module M54, variant C1–Z1; 8: module M54, variant C2–Z2.
Figure 7.
Measuring points and curves of regulation discharge with different sill height. 1: variant S4; 2: variant U2; 3: variant Z1; 4: variant Z2; 5: module M45, variant C4–S4; 6: module M59, variant C2–U2; 7: module M54, variant C1–Z1; 8: module M54, variant C2–Z2.
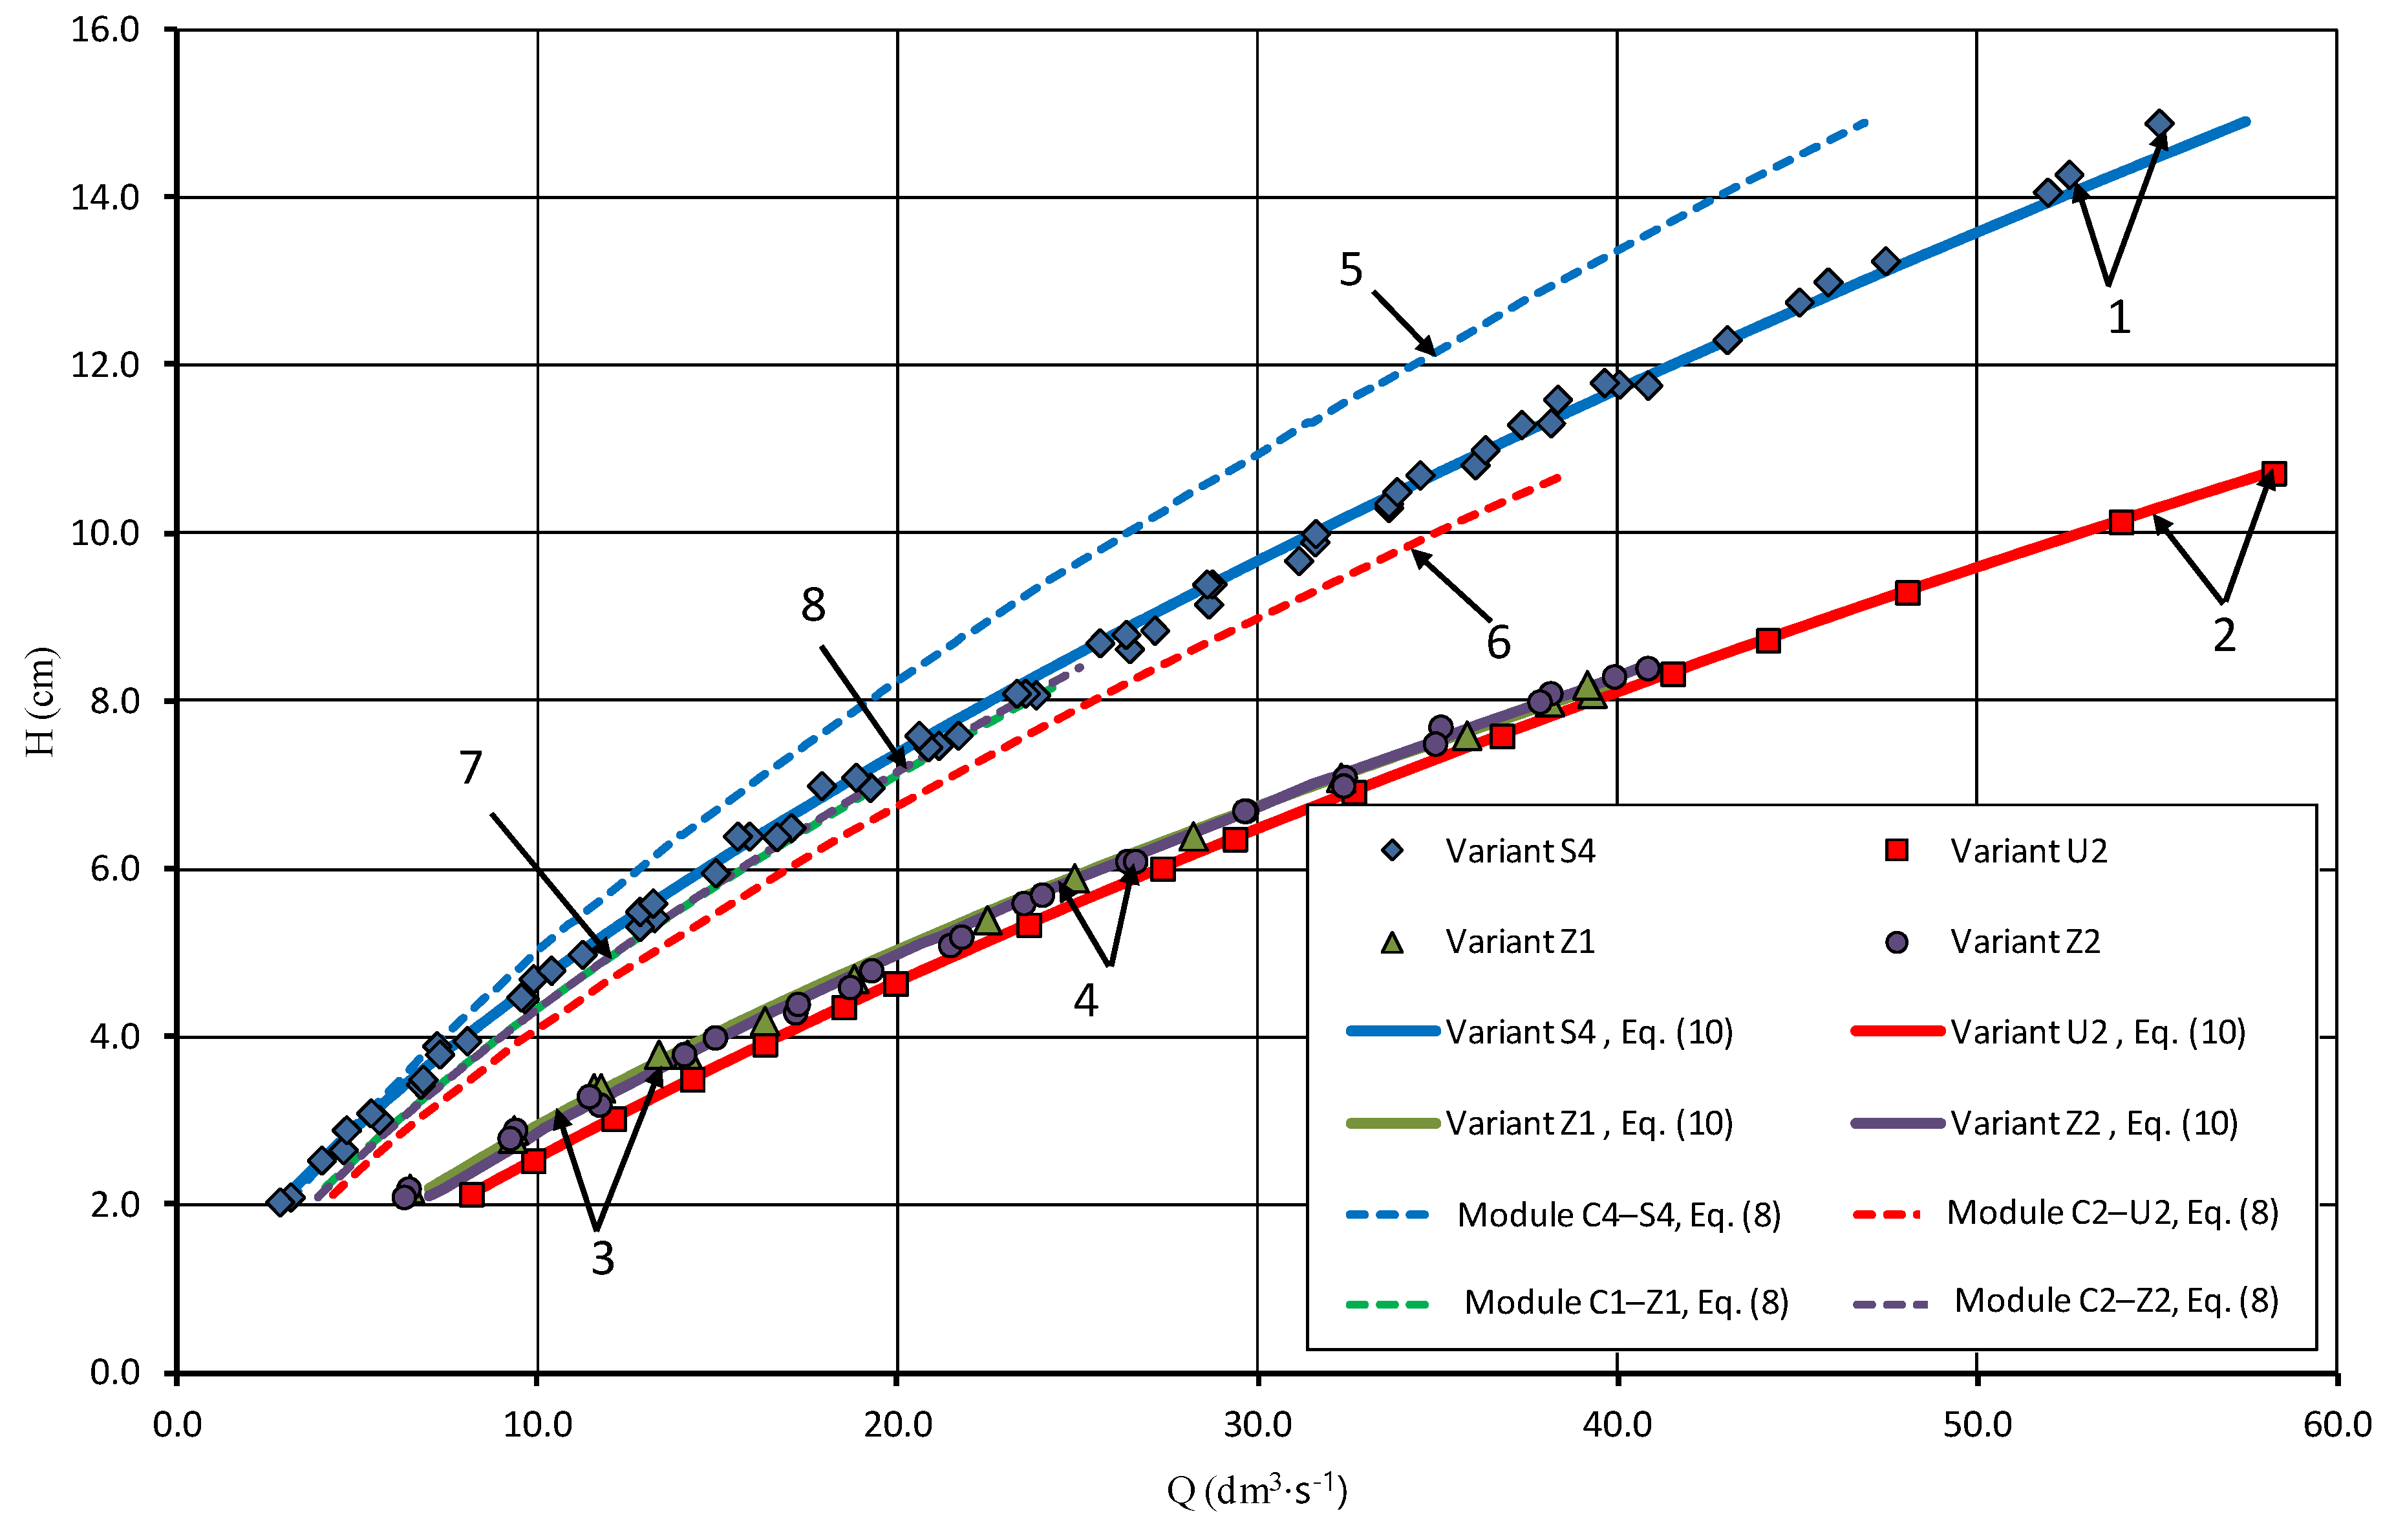
Figure 8.
Modular total flow factor kQ. 1a,b: variant C4–S4; 2a,b: variant C2–U2; 3a,b: variant C1–Z1; 4a,b: variant C2–Z2; 1c: C4–S4 extrapolation; 2c: C2–U2 extrapolation; 3c: C1–Z1 extrapolation, 4c: C2–Z2 extrapolation.
Figure 8.
Modular total flow factor kQ. 1a,b: variant C4–S4; 2a,b: variant C2–U2; 3a,b: variant C1–Z1; 4a,b: variant C2–Z2; 1c: C4–S4 extrapolation; 2c: C2–U2 extrapolation; 3c: C1–Z1 extrapolation, 4c: C2–Z2 extrapolation.

Table 1.
Parameters of beam regulator modules.
| No. | Model | Module | b (m) | Lp (m) | Lk (cm) | kr | Variant | P (cm) | Qe (dm3·s−1) |
|---|---|---|---|---|---|---|---|---|---|
| 1 | 2 | 3 | 4 | 5 | 6 | 7 | 8 | 9 | 10 |
| 1. | C (sharp-crested) | M45 | 0.450 | 0.450 | 1.2 | C4–S4 | 71.5 | ||
| 2. | M59 | 0.588 | 0.588 | 0.9 | 1.00 | C2–U2 | 40.5 | ||
| 3. | M54 | 0.544 | 0.544 | 1.1 | C1–Z1 | 20.5 | |||
| 4. | M54 | 0.544 | 0.544 | 1.1 | C2–Z2 | 41.6 | |||
| 5. | S (rectilinear) | S5 | 87.7 | 0.937 | |||||
| 6. | S4 | 71.5 | 0.879 | ||||||
| 7. | M45 | 0.450 | 0.450 | 1.2 | 1.00 | S3 | 55.0 | 0.767 | |
| 8. | S2 | 38.2 | 0.597 | ||||||
| 9. | S1 | 21.8 | 0.376 | ||||||
| 10. | S0 | 6.8 | 0.000 | ||||||
| 11. | U (labyrinth)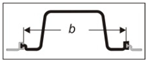 | U5 | 102.2 | 0.383 | |||||
| 12. | U4 | 81.7 | 0.266 | ||||||
| 13. | M59 | 0.588 | 0.935 | 0.9 | 1.58 | U3 | 61.2 | 0.169 | |
| 14. | U2 | 40.5 | 0.092 | ||||||
| 15. | U1 | 20.2 | 0.036 | ||||||
| 16. | U0 | 0.0 | 0.000 | ||||||
| 17. | Z (compound)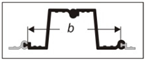 | Z5 | 102.6 | 0.198 | |||||
| 18. | Z4 | 82.0 | 0.131 | ||||||
| 19. | M54 | 0.544 | 0.967 | 1.1 | 1.74 | Z3 | 61.4 | 0.078 | |
| 20. | Z2 | 41.6 | 0.040 | ||||||
| 21. | Z1 | 20.5 | 0.013 | ||||||
| 22. | Z0 | 0.0 | 0.000 |
Abbreviations: b (m): module outlet width, Lp (m): length of the overflow line, Lk (cm): thickness of the rectangular edge of the overflow (replacement width for S model), kr: coefficient of expansion of the overflow line, P (cm): height of the upper sill, Qe (dm3·s−1): effective flow rate.
Table 2.
Measuring ranges according to own research.
| No. | Variant | Variable | Qc (dm3·s−1) | T (cm) | H (cm) | Re | H/P | H/Lk | H/B |
|---|---|---|---|---|---|---|---|---|---|
| 1 | 2 | 3 | 4 | 5 | 6 | 7 | 8 | 9 | 10 |
| 1 | S4 (rectilinear)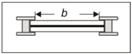 | max | 55.90 | 86.39 | 14.89 | 1.56 × 10⁵ | 0.21 | 12.34 | 0.139 |
| 2 | average | 24.39 | 79.34 | 7.84 | 7.43 × 10⁴ | 0.11 | 6.50 | 0.073 | |
| 3 | min | 3.70 | 73.54 | 2.04 | 1.33 × 10⁴ | 0.03 | 1.69 | 0.019 | |
| 4 | U2 (labyrinth) 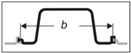 | max | 57.36 | 51.22 | 10.72 | 1.55 × 10⁵ | 0.26 | 12.60 | 0.100 |
| 5 | average | 29.13 | 46.59 | 6.09 | 7.10 × 10⁴ | 0.15 | 7.16 | 0.057 | |
| 6 | min | 7.20 | 42.63 | 2.13 | 1.36 × 10⁴ | 0.05 | 2.50 | 0.020 | |
| 7 | Z1 (compound) | max | 39.28 | 28.70 | 8.20 | 1.05 × 10⁵ | 0.40 | 7.67 | 0.077 |
| 8 | average | 20.98 | 25.51 | 5.01 | 5.51 × 10⁴ | 0.24 | 4.68 | 0.047 | |
| 9 | min | 6.44 | 22.70 | 2.20 | 1.43 × 10⁴ | 0.11 | 2.06 | 0.021 | |
| 10 | Z2 (compound) | max | 40.85 | 50.00 | 8.40 | 1.07 × 10⁵ | 0.20 | 7.86 | 0.079 |
| 11 | average | 23.25 | 47.02 | 5.42 | 6.53 × 10⁴ | 0.13 | 5.07 | 0.051 | |
| 12 | min | 6.31 | 43.70 | 2.10 | 1.43 × 10⁴ | 0.05 | 1.97 | 0.020 |
Table 3.
Parameters of Equation (10) of total discharge curves.
| No. | Parameter | S4 | U2 | Z1 | Z2 |
|---|---|---|---|---|---|
| 1 | 2 | 3 | 4 | 5 | 6 |
| Curve in Figure 7 | 1 | 2 | 3 | 4 | |
| 1 | a1 | 1.0 | 0.1871 | 0.2798 | 0.2408 |
| 2 | b1 | 1.5 | 2.0 | 2.0 | 2.0 |
| 3 | a2 | 0.0 | 3.4250 | 2.5577 | 2.8244 |
| 4 | b2 | 0.0 | 1.0 | 1.0 | 1.0 |
| 5 | c1 = Qe (dm3·s−1) | 0.8794 | 0.0917 | 0.0126 | 0.0397 |
| 6 | r | 0.9956 | 0.9983 | 0.9984 | 0.9985 |
| 7 | R2 | 0.9987 | 0.9990 | 0.9987 | 0.9978 |
| 8 | N | 65 | 17 | 18 | 28 |
where r is the linear correlation coefficient, and R2 is the coefficient of determination.
Table 4.
Parameters of Equation (12) of the module discharge factor kQ.
| No. | Parameter | S4 | U2 | Z1 | Z2 |
|---|---|---|---|---|---|
| 1 | 2 | 3 | 4 | 5 | 6 |
| Lower zone | |||||
| 1 | Curve in Figure 8 | 1a | 2a | 3a | 4a |
| 2 | Hmin (cm) | 2.04 | 2.13 | 2.20 | 2.10 |
| 3 | Qmin (dm3·s−1) | 3.70 | 7.20 | 6.44 | 6.31 |
| 4 | a3 | 1.2473 | 1.5871 | 1.4413 | 1.4589 |
| 5 | b3 | −0.0280 | 0.0779 | 0.0991 | 0.1115 |
| 6 | a4, b4, c2 | 0.0 | 0.0 | 0.0 | 0.0 |
| 7 | r | −0.1810 | 0.8327 | 0.7692 | 0.7092 |
| 8 | R2 | 0.0272 | 0.7675 | 0.5976 | 0.5229 |
| 9 | N | 12 | 5 | 10 | 9 |
| Border point | |||||
| 10 | Hgr (cm) | 3.98 | 3.48 | 4.58 | 4.32 |
| 11 | kQgr (dm3·s−1) | 1.20 | 1.75 | 1.68 | 1.72 |
| Upper zone | |||||
| 14 | Curve in Figure 8 | 1b | 2b | 3b | 4b |
| 15 | a3 | −0.0015 | 2.0691 | 1.8489 | 1.9885 |
| 16 | b3 | 2.0 | −0.1350 | −0.0646 | −0.1001 |
| 17 | a4 | 0.0279 | 0.0 | 0.0 | 0.0 |
| 18 | b4 | 1.0 | 0.0 | 0.0 | 0.0 |
| 19 | c2 | 1.113 | 0.0 | 0.0 | 0.0 |
| 20 | r | 0.0268 | −0.9549 | −0.8671 | −0.8683 |
| 21 | R2 | 0.2071 | 0.9318 | 0.7917 | 0.7719 |
| 22 | N | 53 | 14 | 10 | 20 |
| 23 | Hmax (cm) | 14.89 | 10.72 | 8.20 | 8.40 |
| 24 | Qmax (dm3·s−1) | 55.90 | 57.36 | 39.28 | 40.85 |
Publisher’s Note: MDPI stays neutral with regard to jurisdictional claims in published maps and institutional affiliations. |
© 2022 by the authors. Licensee MDPI, Basel, Switzerland. This article is an open access article distributed under the terms and conditions of the Creative Commons Attribution (CC BY) license (https://creativecommons.org/licenses/by/4.0/).
Share and Cite
MDPI and ACS Style
Bajkowski, S.; Urbański, J.; Oleszczuk, R.; Siwicki, P.; Brandyk, A.; Popek, Z. Modular Regulators of Water Level in Ditches of Subirrigation Systems. Sustainability 2022, 14, 4103. https://doi.org/10.3390/su14074103
AMA Style
Bajkowski S, Urbański J, Oleszczuk R, Siwicki P, Brandyk A, Popek Z. Modular Regulators of Water Level in Ditches of Subirrigation Systems. Sustainability. 2022; 14(7):4103. https://doi.org/10.3390/su14074103
Chicago/Turabian StyleBajkowski, Sławomir, Janusz Urbański, Ryszard Oleszczuk, Piotr Siwicki, Andrzej Brandyk, and Zbigniew Popek. 2022. "Modular Regulators of Water Level in Ditches of Subirrigation Systems" Sustainability 14, no. 7: 4103. https://doi.org/10.3390/su14074103
Note that from the first issue of 2016, this journal uses article numbers instead of page numbers. See further details here.