
Analysis of Taxi Travels during an Epidemic Period Using System Dynamics Method
by
 , ,
, ,
Hui Yao
1,2,3, 
Zhengfeng Huang
1,2,3,
Xiaofei Ye
1,2,3 ,
,
Manel Grifoll
4 ,
,
Guiyun Liu
1,2,3,* and
Pengjun Zheng
1,2,3,* 1
Faculty of Maritime and Transportation, Ningbo University, Ningbo 315832, China
2
Collaborative Innovation Center of Modern Urban Traffic Technologies, Southeast University, Nanjing 211189, China
3
National Traffic Management Engineering & Technology Research Centre Ningbo University Sub-Centre, Ningbo 315832, China
4
Department of Civil and Environmental Engineering, Universitat Politècnica de Catalunya (UPC-BarcelonaTech), 08003 Barcelona, Spain
*
Authors to whom correspondence should be addressed.
Sustainability 2022, 14(6), 3457; https://doi.org/10.3390/su14063457
Submission received: 30 January 2022
/
Revised: 5 March 2022
/
Accepted: 11 March 2022
/
Published: 16 March 2022
(This article belongs to the Topic Intelligent Transportation Systems)
Abstract
:This paper explores the factors influencing taxi travel in the context of COVID-19 from both demand and supply sides and provides a quantitative comparison of taxi travel characteristics and taxi industry operations before and after the epidemic. A model was established using system dynamics to simulate a taxi travel system, which was used to analyze the changes in demand and supply of taxi travel under scenarios such as closedowns, travel restrictions, etc. The analysis is based on a typical middle-sized city in China, Ningbo in Zhejiang Province, revealing factors leading to the significant drop in the amount of taxi travel due to the epidemic. The study can provide insights into impacts of public (or similar anomalous or catastrophic) events on taxi travel systems and could be useful for urban transport planning and management.
1. Introduction
In recent years, taxis have become more and more popular due to their high convenience, and the connection between taxi travel and the lives of city dwellers has become increasingly close. Taxis are an integral part of the comprehensive urban transport system and act as a supplement to urban public transportation, providing personalized transportation services. Taxi services mainly include cruising and online reservation [1]. Public transportation options such as the metro, bus or taxi compete with each other to attract passengers. Passengers choose between these public transportation methods based on their preference for travel time, reliability, cost, convenience or comfort [2]. Taxis are a mode of transportation that can provide flexibility, convenience and comfort according to individual needs.
Under the influence of the epidemic in 2020, both demand for and supply of taxi travel have been significantly affected. In terms of demand, as it is believed that staying at home is safer than being out until the epidemic is fully controlled, people choose “not to go out unless absolute necessary” and a majority of people work remotely online, which reduces less rigid commuting demands to a minimum. In addition, the government has compulsorily restricted some of the travels made by residents, and the demand for flexible trips such as weekend entertainment and shopping has decreased as a result. The closure of all types of tourist attractions during the epidemic has also greatly reduced the demand for taxis. Therefore, total urban transport demand has fallen considerably from the initial stage of the epidemic, with a corresponding fall in taxi demand. Secondly, it is generally believed that mass public transportation is more likely to spread the epidemic than cars, coupled with the fact that buses and subways were closed during the peak epidemic period, which leaves only taxis and private cars as travel options and thus increases the proportion of private car and taxi travel to some extent. On the supply side, firstly, drivers were reluctant to provide taxi services during the epidemic for both economic and safety reasons. Due to the decreased taxi travel demand, it makes little sense for taxi drivers to provide taxi services as usual because the expected orders could be very low. Secondly, during the epidemic, taxi drivers were facing the risk of being infected and were less willing to provide service. Both contributed to the reduction on the supply side. Under the epidemic, the interaction between demand and supply caused a downturn in the transportation industry.
As the various factors in the taxi system are interactive, interconnected and interact with each other, the individual variables within them are constantly evolving and changing, which in turn can affect the taxi system. It is therefore difficult to accurately describe taxi systems using purely qualitative or quantitative analysis. System dynamics modelling is a systematic and holistic approach based on complexity science and is suitable for dealing with the complex interrelationships between factors in complex systems and for quantitatively modelling future developments. It combines qualitative and quantitative models. The qualitative model is usually expressed by a causal loop diagram. The causal relationship connects entities and loops that include positive and negative feedback loops, which can clearly show the feedback relationship among factors affecting taxi supply and demand [3].
In view of this, this paper uses system dynamics theory to describe the complex urban taxi system and to analyze the dynamics of the urban taxi system from a combination of macro and micro perspectives. Taking the relationship between taxi supply and demand in Ningbo (China) in the context of the epidemic as the research object, the taxi travel data is processed, the influencing factors are analyzed and a system dynamics model is developed to simulate and predict the possible conditions of taxi operations under different scenarios. The methodology allows to seek hidden patterns in the dynamic changes of taxi travel. These results provide insights into urban taxi systems in public crise, and recommendations for the management of taxi operations are also discussed.
2. Related Work
The urban taxi system is a complex system that covers multiple players, multiple stakeholders and multiple feedbacks. There are many uncertain factors in its development and evolution, such as urban economy, society, environment, population, culture and policies. These factors have an impact on the taxi system. Richard [4] pointed out: in the socially optimal state, taxis must be subsidized by the government, because in the socially optimal state, the waiting time of passengers is low, and correspondingly, taxi drivers have to pay the cost of empty driving. Only if these empty driving costs are subsidized can the supply of taxis be maximized. Fuel prices also account for a very large share of the cost of taxi supply. The daily fuel cost of taxis accounts for almost half of the cost. The freight rate of taxis reflects changes in the price of fuel, which affects the supply of taxis [5]. Similarly, the income level of drivers also affects the supply of the taxi market. Under the established market demand, when taxi drivers’ income does not reach the expected ideal value, their enthusiasm for supply is reduced. When the income level of residents increases, the demand for visiting relatives, friends and tourism increases accordingly, and the demand for taxi consumption related to this increases accordingly [6]. The travel demand of taxis is also affected by the service level. The service level mainly includes travel reliability, comfort, safety, etc. As the service level of taxis improves, the demand for taxis from travelers also increases [7]. Urban road traffic infrastructure also affects the demand for taxis. When the city’s public transit stations are not fully covered, the total number of transportation hubs is insufficient, or the public transportation connection is unreasonable, the demand for taxis increases. On the contrary, if the city’s public transportation has been able to satisfy residents’ travel the demand for taxis decreases. In addition, the demand and supply of taxis is also affected by the geographic characteristics of cities and tourism. For example, cities with relatively high traffic pressure on river bridges due to the natural barrier limit the development of taxi traffic [8]. Beesley et al. [9] focused on the price of taxis. Their research showed that the price of taxis affects both supply and demand. The higher the taxi price, the more services taxi drivers are willing to provide and vice versa. For consumers, the lower the price of taxis, the greater the demand for them.
Among the methods based on modelling and simulation, agent-based modelling, discrete event simulation and system dynamics (SD) approach are the most applied. SD adopts a top-down approach, coping with a complex system at a more aggregate level and modelling the interrelationships between sub-systems in order to analyze the specific overall system behavior. It has been used to understand and assess the impacts of variables in transportation systems, such as the specific topics of reliability calculation, pollution assessment, congestion analysis, mode choice, etc.
Abbas [10] pointed out that the application of system dynamics in the field of transportation has the advantage of conforming to the law of development on the whole, but at the same time there is the disadvantage of the low reliability of micro-simulation, which clarifies the direction for the application of system dynamics in the field of transportation. Armah et al. [11] analyzed the characteristics of system dynamics, applied it to establish a model of the relationship between traffic congestion and air pollution, formulated traffic policies based on the output of the model and proposed the key links for air governance but did not establish an actual data model. The model is only a theoretical innovation. Wang et al. [12] selected the main factors that influence subway stations to attract passenger flow from the aspects of subway passenger flow and surrounding environment and subways’ own service level, and established a station passenger flow prediction model based on system dynamics, revealing the passenger flow under many influencing factors. Qi [13] used a system dynamics model to reveal the evolution of urban residents’ travel mode structure and simulated the impact of changes in travel mode under different policies on road load, traffic pollution and other aspects. Zhang et al. [14] established a targeted urban system dynamics model for the problem of urban carbon emissions and concluded that the main reason for increasing urban carbon emissions was the continuous agglomeration of population and the growth of population with the development of urbanization. The number of motor vehicles has increased rapidly. Sun et al. [15] established a system dynamics model based on the multi-feedback and multi-loop characteristics of public transport pricing, reflecting the impact of public transport pricing strategies on various interest groups and selecting indicators such as social welfare and capital utilization ratio to evaluate the implementation effects of public transport pricing combination strategies. Song et al. [16] established a system dynamics model on the public transportation system and simulated the relationship between passenger volume, congestion and share rate from the common strategies of public transportation development and evaluated the effects of different strategies.
Some other researchers focus on transport policy study using the SD approach. Yang et al. [17] constructed a system dynamics model of urban transportation, analyzed transportation choices and transportation energy consumption, analyzed the future transportation development problems in Beijing through empirical analysis and put forward policy recommendations. Wang et al. [18] established an urban transportation system dynamics model from seven aspects including transportation supply and transportation demand, set policies as control parameters, analyzed the impact of policies on the transportation system and put forward suggestions and countermeasures for transportation development. Fan et al. [19] used Beijing as an example to predict the size of private cars in the future under the public transport priority policy and used a model to study the impact of the “single and even number restriction” measures implemented during the 2008 Beijing Olympic Games under the assumption that the transportation policy will be implemented for a long time and that the development of private cars will continue, and provided policy recommendations for the reasonable control of the development of private cars.
The existing research mainly analyzes the problem of taxi travel from the perspective of the balance between the supply and demand of taxis, combining various daily factors. Existing research does not take into account the complexity and dynamics of taxi trips. As a complex system, taxi trips cannot be considered only from the perspective of economics. It is necessary to consider the impact of taxi trips in special periods and the change in influencing factors. Few works have shown the potential of applying SD to taxi travel. Besides, the pandemic situation has exacerbated transport system analysis, adding new paradigms and a degree of complexity. This paper focuses on the application of SD in taxi travel during an epidemic period, identifying its main contributions, assumptions and opportunities for current works.
3. System Dynamics Model
3.1. System Boundaries and Model Factors
The system dynamics research applied to complex problems is a combination of qualitative, quantitative and systematic comprehensive reasoning method. The modeling process is a process of learning, investigation and research.
In the theory of SD, the driving force of the development of a system stems from factors within the system and results from interactions between internal elements, and the system boundary is defined as the minimum extent affected when the objectives of the system are achieved. Therefore, before defining a taxi system, the system boundary needs to be defined based on the modelling objectives and feedback mechanisms of the taxi system, which in turn identifies the endogenous and exogenous variables of the taxi system. An overall taxi system is a complex system that includes not only taxis themselves but also other factors in terms of travel demand, taxi supply and taxi policies, which are directly or indirectly associated with taxis within the city. Following the principles of simplicity, purpose and validity, this study defines the boundaries of the taxi travel system and the factors contained in the system as follows:
- (1)
- Taxi demand factors, representing taxi demand and basic characteristics of taxi operations, etc., includes:
- -
- The average distance travelled per taxi per day;
- -
- Taxi fares (total trip fares);
- -
- Total taxi demand.
- (2)
- Taxi supply factors, representing taxi supply and road infrastructure, etc., includes:
- -
- Number of taxis;
- -
- Average waiting time;
- -
- Average travel time.
- (3)
- Taxi policy factors, representing regulatory policies, taxation policies, etc., includes:
- -
- Taxi unit subsidy;
- -
- Limit on the number of taxis;
- -
- Taxi epidemic related policies.
3.2. Causality Diagram for Taxi Trips
The causal feedback method refers to a scientific method that controls the process through the feedback mechanism between the cause and the effect to achieve a specific purpose. The interrelationships between all the key factors in the system are depicted in a cause–effect diagram, with causal chains representing positive or negative effects. The plus sign indicates that the variable at the end of the arrow increases (decreases) as the variable at the beginning of the arrow increases (decreases), while the minus sign indicates an inverse relationship between the variables. In this study, cause–effect diagrams were drawn for the factors influencing taxi supply and demand in order to analyze the interrelationship between changes in urban taxi trips and the parameters.The causal relationship diagram is shown in Figure 1. The main causal feedback loops are summarized in Table 1.
3.3. Flow Diagram of Taxi System Dynamics
This paper is based on the theory of supply and demand, and the model is constructed as separate sub-models in terms of the spread of the epidemic, travel demand and taxi supply, respectively, as shown in Figure 2. The boundaries of the system are first determined, and for the total model, a series of state variables, auxiliary variables and flow rate variables are set as endogenous variables to reflect the development trend.
4. Case Study of Taxi Operations in Ningbo
4.1. Sub-Models and Estimation of Parameters
The taxi order data was obtained through the Ningbo City Taxi Industry Dynamic Monitoring Project, and the established system dynamics model was parameter calibrated and divided into three sub-models.
4.1.1. Epidemic Transmission Sub-Model
The epidemic transmission sub-model is mainly based on the SIR (susceptible–infected–recovered) model, which divides the population into three categories: infected, susceptible and immune and analyses the transmission mechanism of infected people. Vaccine prevalence is set as an exogenous variable in order to analyze the impact of policy regulation on the spread of the epidemic. The specific model is shown in Figure 3, and the specific model parameters are shown in Table 2.
4.1.2. Travel Demand Sub-Model
The travel demand sub-model analyzes the impact of epidemic growth and level of service on travel demand, with the level of service including three factors: price, efficiency and safety. The travel incentive coefficient is set as an exogenous variable in order to analyze the impact of policy regulation on travel demand. The specific model is shown in Figure 4, and the specific model parameters are shown in Table 3.
4.1.3. Taxi Supply Sub-Model
The taxi supply sub-model considers the impact of taxi unit subsidies on taxi dispatching and thus analyses the overall profitability of taxis. The government unit subsidy is set as an exogenous variable in order to analyse the impact of policy regulation on taxi supply. The specific model is shown in Figure 5 and the specific model parameters are shown in Table 4.
4.2. Model Correction and Validity Analysis
Adjustments to any set of parameters in the SD model affect the final results of the simulation. It is therefore important to use reliable data to test the validity of the model before proceeding with the case study. Simulation tests were conducted using 2020 taxi data to verify the validity and reasonableness of the model through dimensional consistency tests and goodness-of-fit tests.
4.2.1. Latitudinal Consistency Test
The SD model requires that the units of the variables on both sides of the equation be consistent. In this study, auxiliary variables were used to ensure dimensional consistency on both sides of the equation and the model passed the dimensional consistency test.
4.2.2. Goodness-of-Fit Tests
The goodness-of-fit test verifies the reasonableness and correctness of the simulation results by comparing the difference between the simulated and true values. In this study, representative metrics from the two main systems were selected to calculate the rate of deviation between the simulated and true values. Details are shown in Figure 6 and Figure 7.
As the simulation results show, the prediction deviation is less than 10%, which implies a high validity. Therefore, the model can be used for simulation and analysis.
For the cumulative number of confirmed cases in the Figure 6, the reason for the rapid increase in the first stage is that due to the outbreak of the epidemic, various epidemic prevention measures did not work immediately, resulting in a continuous increase in the number of confirmed cases.
As to the change trend of total daily orders, we could find there are 2 phases in the recovery stage. The first phase shows the rapid change in slope. The number of total daily orders in the second phase rises relatively slowly compared with the first phase. The reason is that China decided to resume production and work after the epidemic alleviated in February, 2020, and the first phase came around that time. We could effectively simulate this situation by controlling the parameter of travel restriction adequately.
4.3. Ningbo Taxi Operation Scenario Simulation
Using Ningbo taxis as the application object, we simulated the changes in daily potential demand and taxi operating profit under different vaccine penetration rates, the impact on the supply and demand status under different travel restrictions and the taxi operating status under different unit subsidies and analyzed the impact of parameter changes on each variable of the whole system.
4.3.1. Vaccine Penetration Rate Analysis
We want to find the time-varying effects of varied vaccine penetration rates on daily potential demand and operating profit under the condition of less strict travel restriction. The following Figure 8 shows the trend of potential daily demand and operating profit of taxis in Ningbo under 0%, 2%, 4% and 6% vaccine penetration rates.
As can be seen from the graph above, when the vaccine was not yet widely available, transport demand was still slow to pick up and had a significant impact on the income of taxi drivers. Under the gradual spread of the vaccine, transport demand recovered more quickly, with the personal safety aspects of the epidemic being the main reason. It can also be concluded that the policy of universal access to vaccines is relatively effective in recovering and improving the economy.
4.3.2. Travel Restriction Analysis
As a result of the home-based policy during the epidemic, the number of daily taxi orders dropped sharply. The Figure 9 below show the trend of the total number of daily taxi orders and cumulative taxi operating profits under travel restrictions of 0%, 30%, 60% and 90% (the less the number is, the stricter the restriction is), respectively.
The 0% travel restriction policy shows that it basically restored the most critical period of the epidemic, when residents were basically restricted from travelling and the number of taxi orders reached a nadir, and the order figures gradually rebounded under the gradual opening of the travel restriction policy, which was particularly effective. The restriction policy has to a certain extent controlled the further deterioration of the epidemic and created good preconditions for the recovery of the economy.
According to the simulation results, after the outbreak of the epidemic, taxi travel data gradually recovered, but did not return to the level of previous years, due to the following reasons:
With the increase in public transportation methods such as subways and the competition of online travel, the number of taxi trips has been declining year after year, even in the normal environment.
Under the normalization of the epidemic environment, although work and life have returned to normal, some work patterns have changed from offline to online. In addition, tourism traffic has not fully recovered, all of which have a certain impact on the number of taxi trips.
4.3.3. Analysis of Unit Subsidies
Taxi subsidies have been introduced in several provinces during the epidemic. The policy was introduced to maintain basic operations in epidemic cities, to increase drivers’ willingness to travel and to subsidize drivers who risked infection to travel during the epidemic so that they could increase their earnings by a certain amount. The system dynamics model in this paper considers a unit subsidy policy of CNY 0, CNY 10, CNY 20 and CNY 30 per car per day, respectively. As shown in Figure 10 that the effect on the number of daily orders is relatively small, and there is still a relative increase in earnings on the cumulative operating profit of taxi drivers, after which the operating profit starts to decrease again due to competition among them, leading to loss-making operations; maintaining healthy competition is what helps the industry to grow.
5. Discussion
Based on the dynamic travel analysis, the following recommendations are provided for the future development of the taxi industry in Ningbo and the future response to public emergencies related to pandemic:
(1) The implementation of a policy to encourage vaccination is conducive to the development of the recovery of the transport industry and the gradual realization of the new crown immunization. The number of taxi orders can be effectively increased while increasing the rate of vaccine popularity.
(2) The introduction of different traffic restriction policies according to different epidemic conditions is conducive to epidemic prevention and control. For epidemic prevention and control, it is necessary to reduce the movement of people, after which the travel restrictions are opened up according to the development situation of the region to increase the travel volume and promote the recovery of the transport industry according to the model.
(3) Appropriate fare control can help increase taxi drivers’ income, reduce waste, help improve the efficiency of taxi operations and reduce unnecessary energy consumption. However, excessive fare increases may harm the interests of urban residents and even taxi drivers.
(4) Make appropriate unit subsidies. In the face of rising prices and the impact of the epidemic, an appropriate reduction in taxi costs and an appropriate unit subsidy can increase taxi drivers’ willingness to travel, which helps to increase their motivation and improve the quality of service.
Although the proposed method is a useful tool to support the implementation of SD in the taxi travel analysis during an epidemic period in Ningbo, more scenarios over the world should be surveyed to test and promote our method. The skills obtained from the analysis may also be useful for unexpected events such as catastrophes in terms of transport management. Future work includes several points related to potential advanced methods in behavioral science pursuing the understanding of traveler behavior. In this sense, Li and Henser (2010) pointed out methodological aspects based on prospect theory which may complement our analysis based on system dynamics [20]. Moreover, cumulative prospect theory coupled with multi-attribute decision making for modeling travel behavior has been recently introduced by Gao et al. (2021) [21]. They found that empirical results demonstrate that sensitivity to gains and losses in cost and travel time are divergent in mode shift behavior. Consequently, general limitations may be identified from the application of dynamic systems such as the heterogeneity in people’s travel behavior, infection rates due to different physical characteristics or disparities in influences of COVID-19 (Brough et al., 2021) [22] among other topics. The integration of these considerations based on traveler behavior may enrich our analysis and open new research lines using holistic methods.
6. Conclusions
The investigation of the factors influencing taxi travel in the context of COVID-19 from both demand and supply sides has provided a quantitative comparison of taxi travel characteristics and taxi industry operations before and after the epidemic. We used system dynamics to simulate taxi travel systems, analyzing the changes in demand and supply of taxi travel under scenarios such as closedowns, travel restrictions, etc. The analysis was based on a typical middle-sized city in China, Ningbo in Zhejiang Province, revealing factors leading to the significant drop in the amount of taxi travel due to the epidemic. Even though the work is focused on the Ningbo taxi system, the methodology and conclusions may be useful in similar transportation systems analyses.
Author Contributions
Conceptualization, P.Z., G.L. and M.G.; methodology, H.Y. and M.G.; software, H.Y.; analysis, H.Y., Z.H. and X.Y.; writing—original draft preparation, H.Y. and Z.H.; writing—reviewing and editing, Z.H. and P.Z.; supervision, P.Z. All authors have read and agreed to the published version of the manuscript.
Funding
This research was funded in part by the National Key Research and Development Program of China (2017YFE9134700), EC H2020 Project (690713), National Natural Science Foundation of China (No. 61074142).
Institutional Review Board Statement
Not applicable.
Informed Consent Statement
Not applicable.
Data Availability Statement
Not applicable.
Acknowledgments
We would like to thank the National “111” Centre on Safety and Intelligent Operation of Sea Bridges (D21013) and the Zhejiang 2011 Collaborative Innovation Center for Port Economy for the financial support in publishing this paper. The authors would like to thank the Ningbo Highway and Transportation Management Center for providing data.
Conflicts of Interest
The authors declare no conflict of interest.
References
- Anonymous. The General Office of the State Council issued the “Guiding Opinions on Deepening Reform and Promoting the Healthy Development of the Taxi Industry”. Urban Traffic 2016, 14, 2. [Google Scholar]
- Ulak, M.B.; Yazici, A.; Aljarrah, M. Value of convenience for taxi trips in New York City. Transp. Res. Part A Policy Prac. 2020, 142, 85–100. [Google Scholar] [CrossRef]
- Shepherd, S. A review of system dynamics models applied in transportation. Transp. B Transp. Dyn. 2014, 2, 83–105. [Google Scholar] [CrossRef] [Green Version]
- Arnott, R. Taxi Travel Should Be Subsidized. J. Urban Econ. 1996, 40, 316–333. [Google Scholar] [CrossRef]
- Lv, H. Research on Urban Passenger Taxi Pricing Based on System Dynamics; Harbin Institute of Technology: Harbin, China, 2011. [Google Scholar]
- Yue, Y. Research on Government Regulation in Nanjing Taxi Industry; Nanjing University of Aeronautics and Astronautics: Nanjing, China, 2007. [Google Scholar]
- Ji, B. Study on the Large City Taxi Demand Countermeasures and Management Mode; South China University of Technology: Guangzhou, China, 2014. [Google Scholar]
- Yang, J. The Analysis of China’s Urban Taxi Industry Characteristics and the Construction of Demand Forecast Model: The Case of Nanchang; Nanchang University: Nanchang, China, 2009. [Google Scholar]
- Beesley, G. Information for regulation: The case of taxi. Econ. J. 1983, 93, 594–615. [Google Scholar] [CrossRef]
- Abbas, K. The use of system dynamics in modeling transportation system with respect to new cities in Egypt. System 1990, 90, 17. [Google Scholar]
- Armah, F.; Yawson, D.; Pappoe, A. A systems dynamics approach to explore traffic congestion and air pollution link in the city of Accra, Ghana. Sustainability 2010, 2, 253–265. [Google Scholar] [CrossRef] [Green Version]
- Wang, Z.; Liu, X.; Zhao, Z.; Qin, Y. Passenger volume forecasting of subway stations based on system dynamics model. Logist. Technol. 2010, 219, 90–92. [Google Scholar]
- Qi, J. Research on the Evolution of Urban Traffic Mode Structure Based on System Dynamics; Southwest Jiaotong University: Chengdu, China, 2012. [Google Scholar]
- Zhang, J.; Lei, X.; Li, J. Research on building urban low-carbon transportation system based on system dynamics: Taking Zhengzhou as an example. Soft Sci. 2012, 26, 77–81. [Google Scholar]
- Sun, G.; Wang, J.; Hu, X. System dynamics model and simulation of integrated price strategies of urban public transport. J. Transp. Syst. Eng. Inf. Technol. 2010, 10, 123–127. [Google Scholar]
- Song, C.; Zhang, Y.; Jiang, L. Modeling and simulation for the development strategy of urban public transit system using system dynamics. J. Heilongjiang Inst. Technol. 2014, 28, 15–19. [Google Scholar]
- Yang, Y.; He, D.; Tong, H.; Qu, W. A system dynamic model of urban transportation for policy simulation: A case study of Beijing. Forum Sci. Technol. China 2013, 4, 28–34. [Google Scholar]
- Wang, J.; Lu, H.; Peng, H. System dynamics model of urban transportation system and its application. J. Transp. Syst. Eng. Inf. Technol. 2008, 8, 83–89. [Google Scholar] [CrossRef]
- Fan, J.; Yan, G. Simulation and control of amount of private cars in Beijing based on system dynamics. J. Highw. Transp. Res. Dev. 2009, 26, 120–125. [Google Scholar]
- Li, Z.; Hensher, D. Prospect Theoretic Contributions in Understanding Traveller Behaviour: A Review and Some Comments. Transp. Rev. 2011, 31, 97–115. [Google Scholar] [CrossRef]
- Gao, K.; Sun, L.; Yang, Y.; Meng, F.; Qu, X. Cumulative prospect theory coupled with multi-attribute decision making for modeling travel behavior. Transp. Res. Part A Policy Prac. 2021, 148, 1–21. [Google Scholar] [CrossRef]
- Brough, R.; Freedman, M.; Phillips, D. Understanding Socioeconomic Disparities in Travel Behavior during the COVID-19 Pandemic; Social Science Electronic Publishing: Rochester, NY, USA, 2021. [Google Scholar]
Figure 1.
Causality diagram.

Figure 2.
System flow diagram.
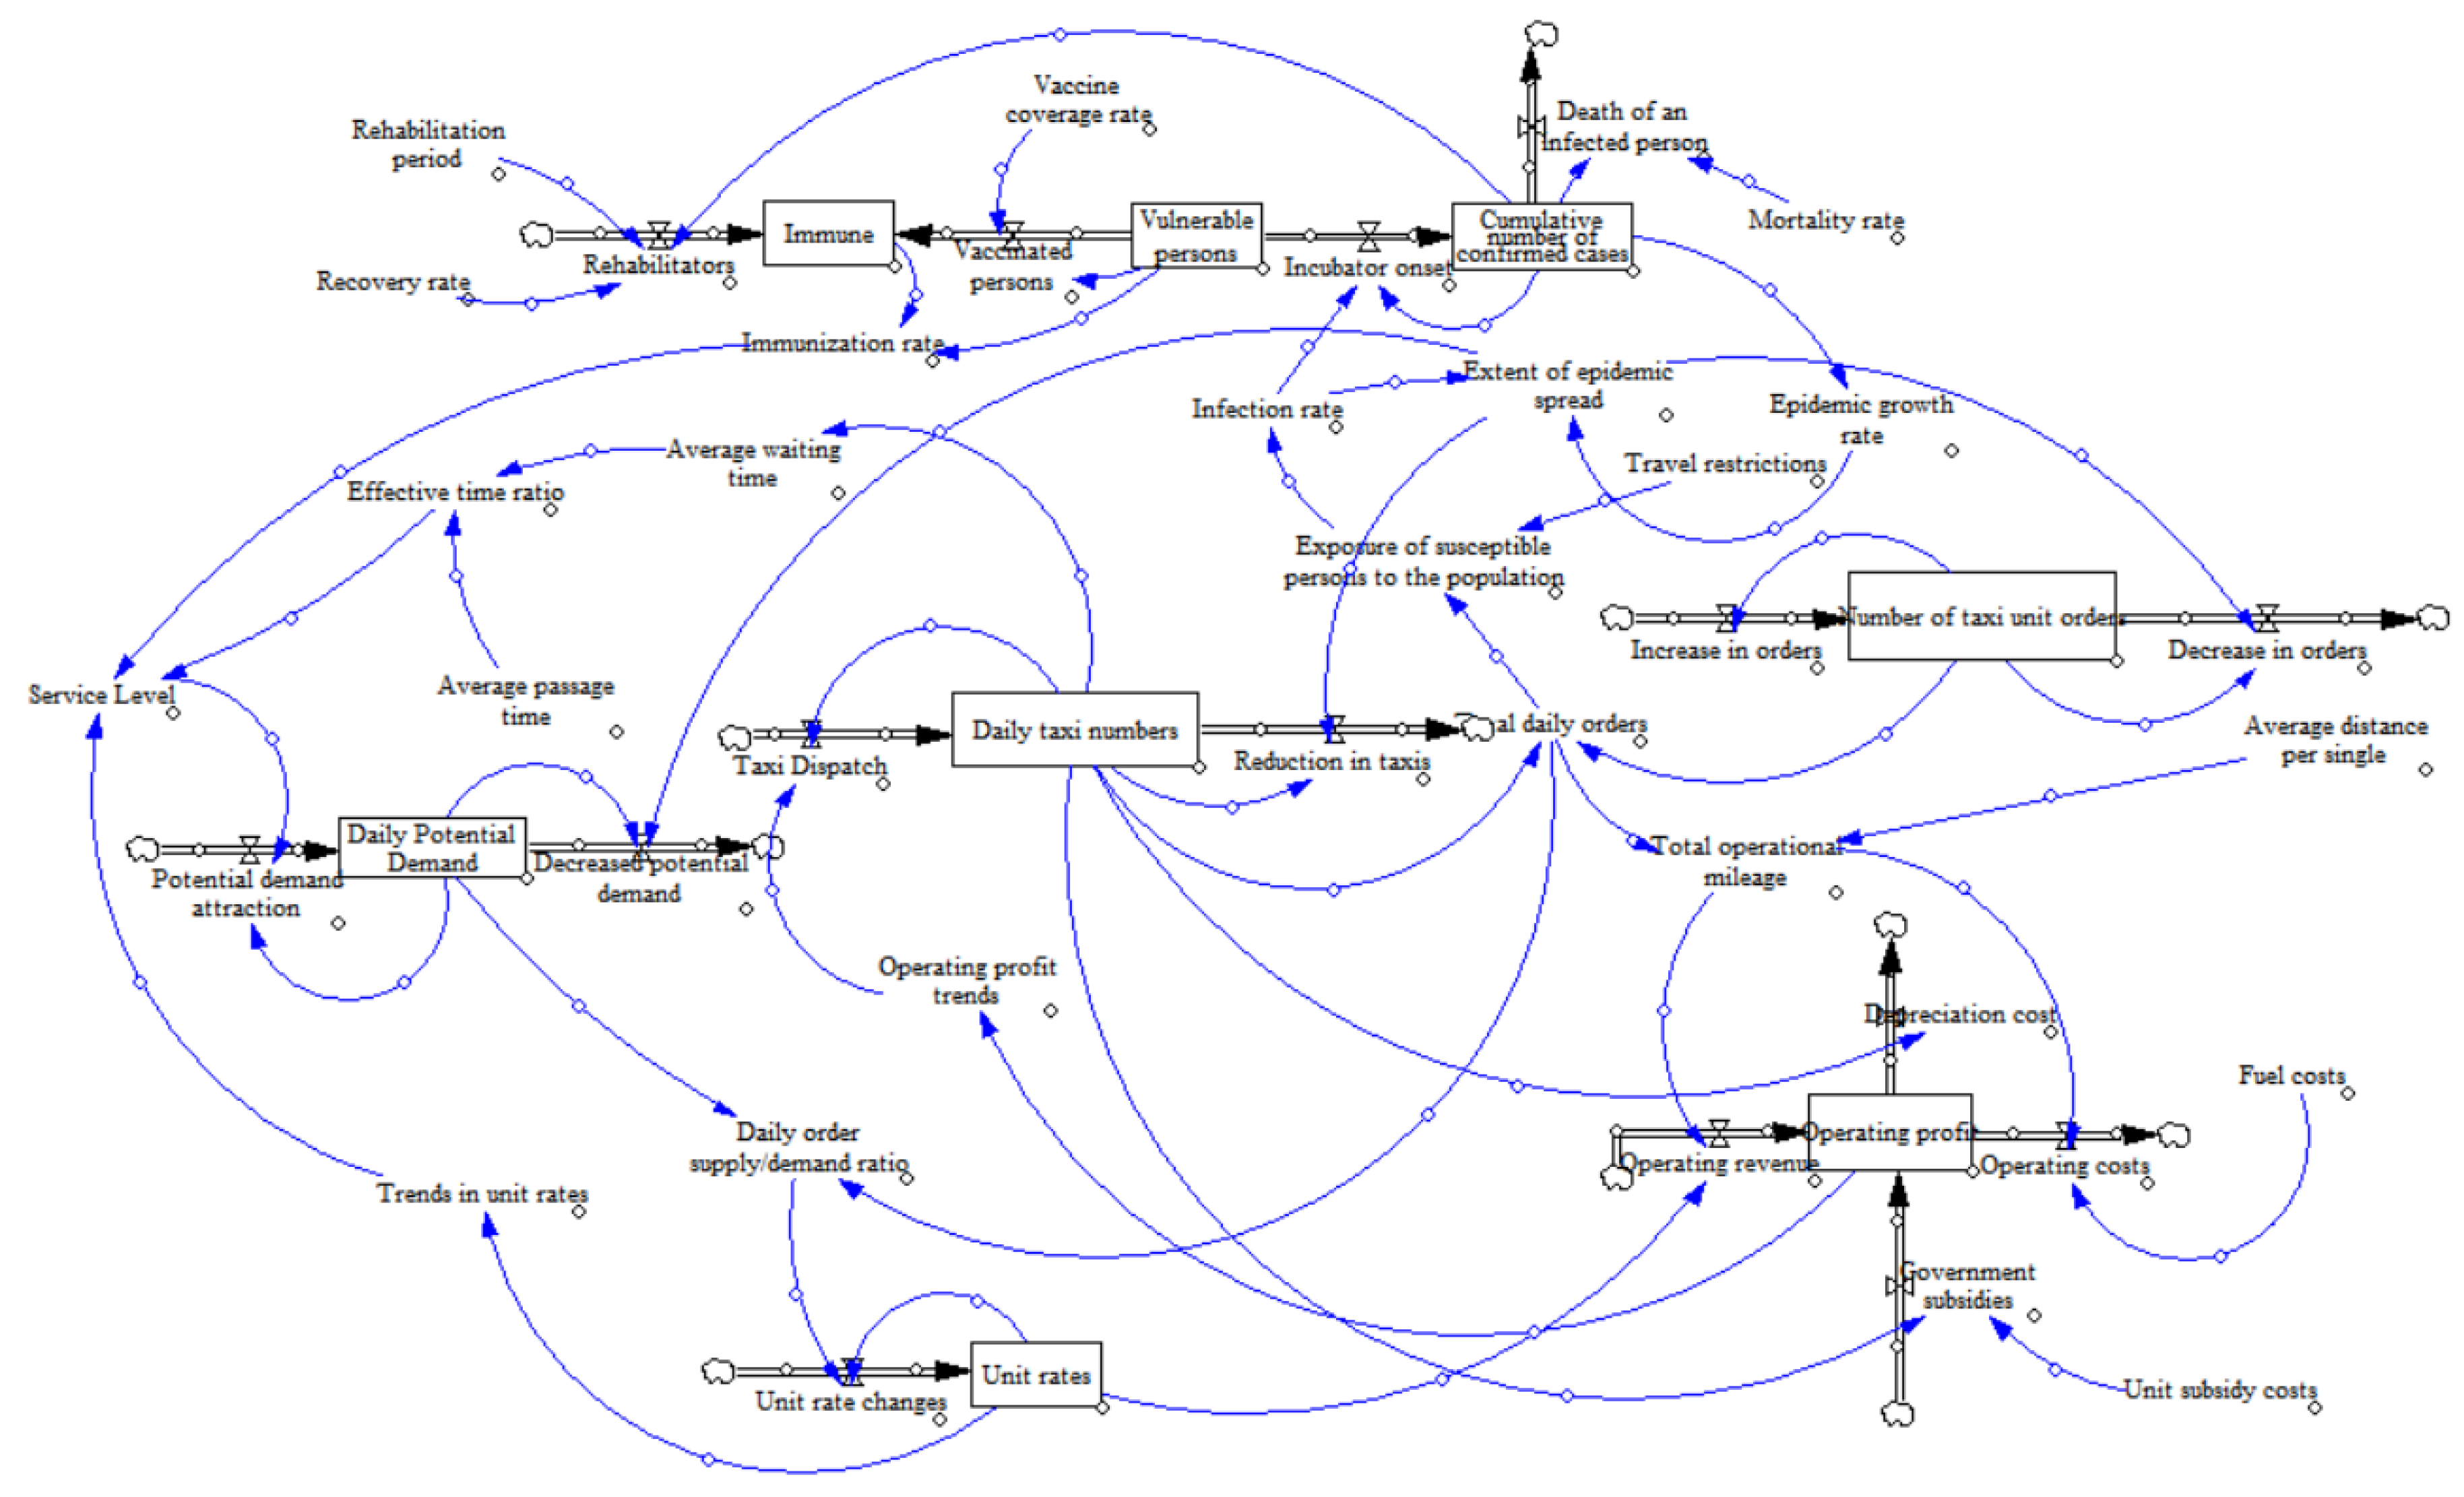
Figure 3.
Epidemic transmission sub-model.
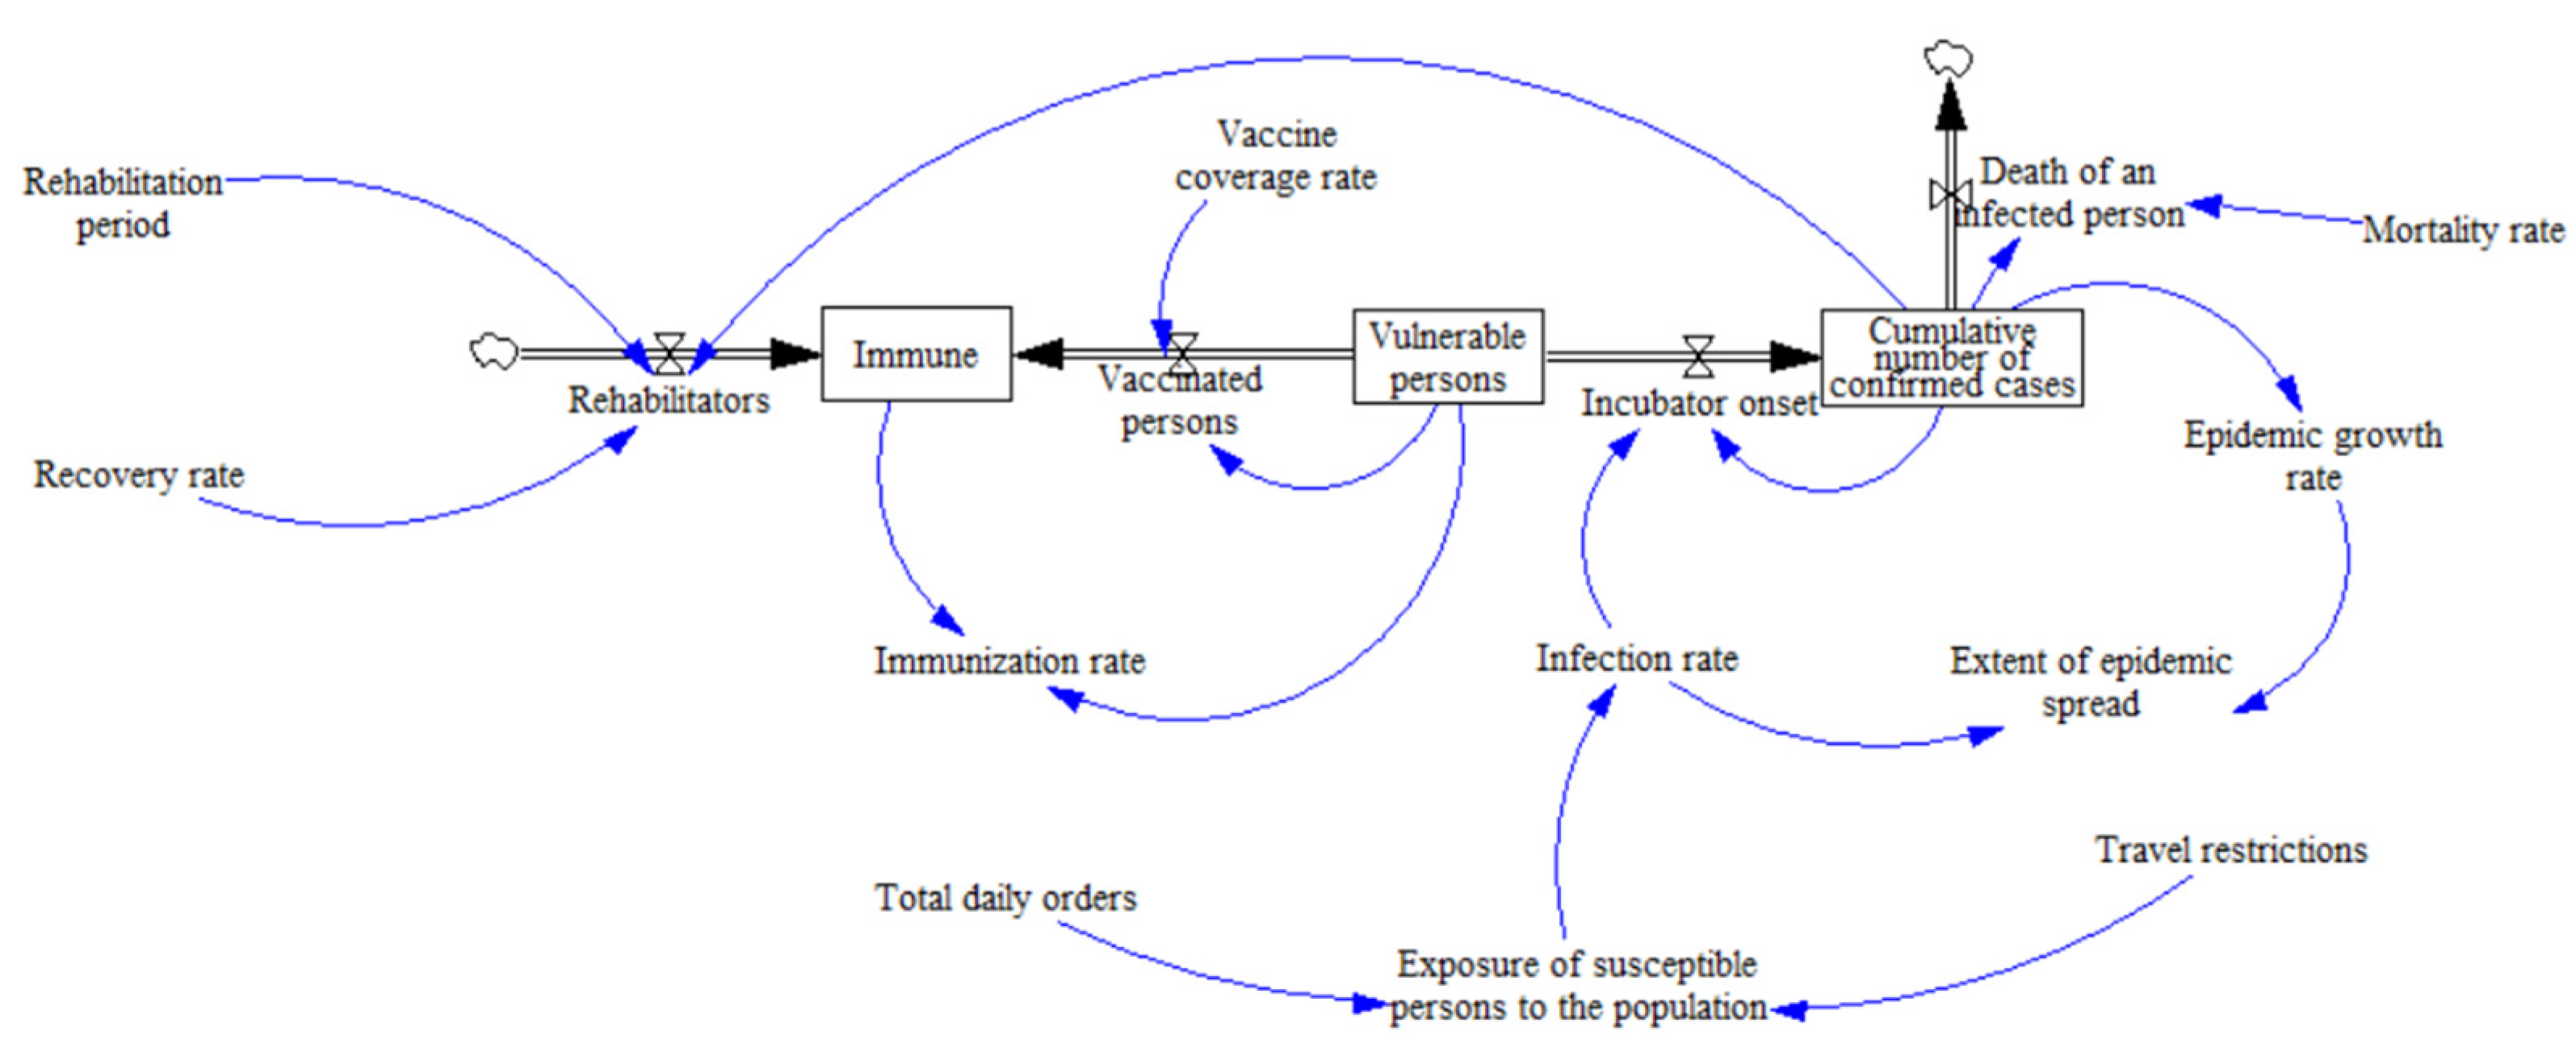
Figure 4.
Travel demand sub-model.
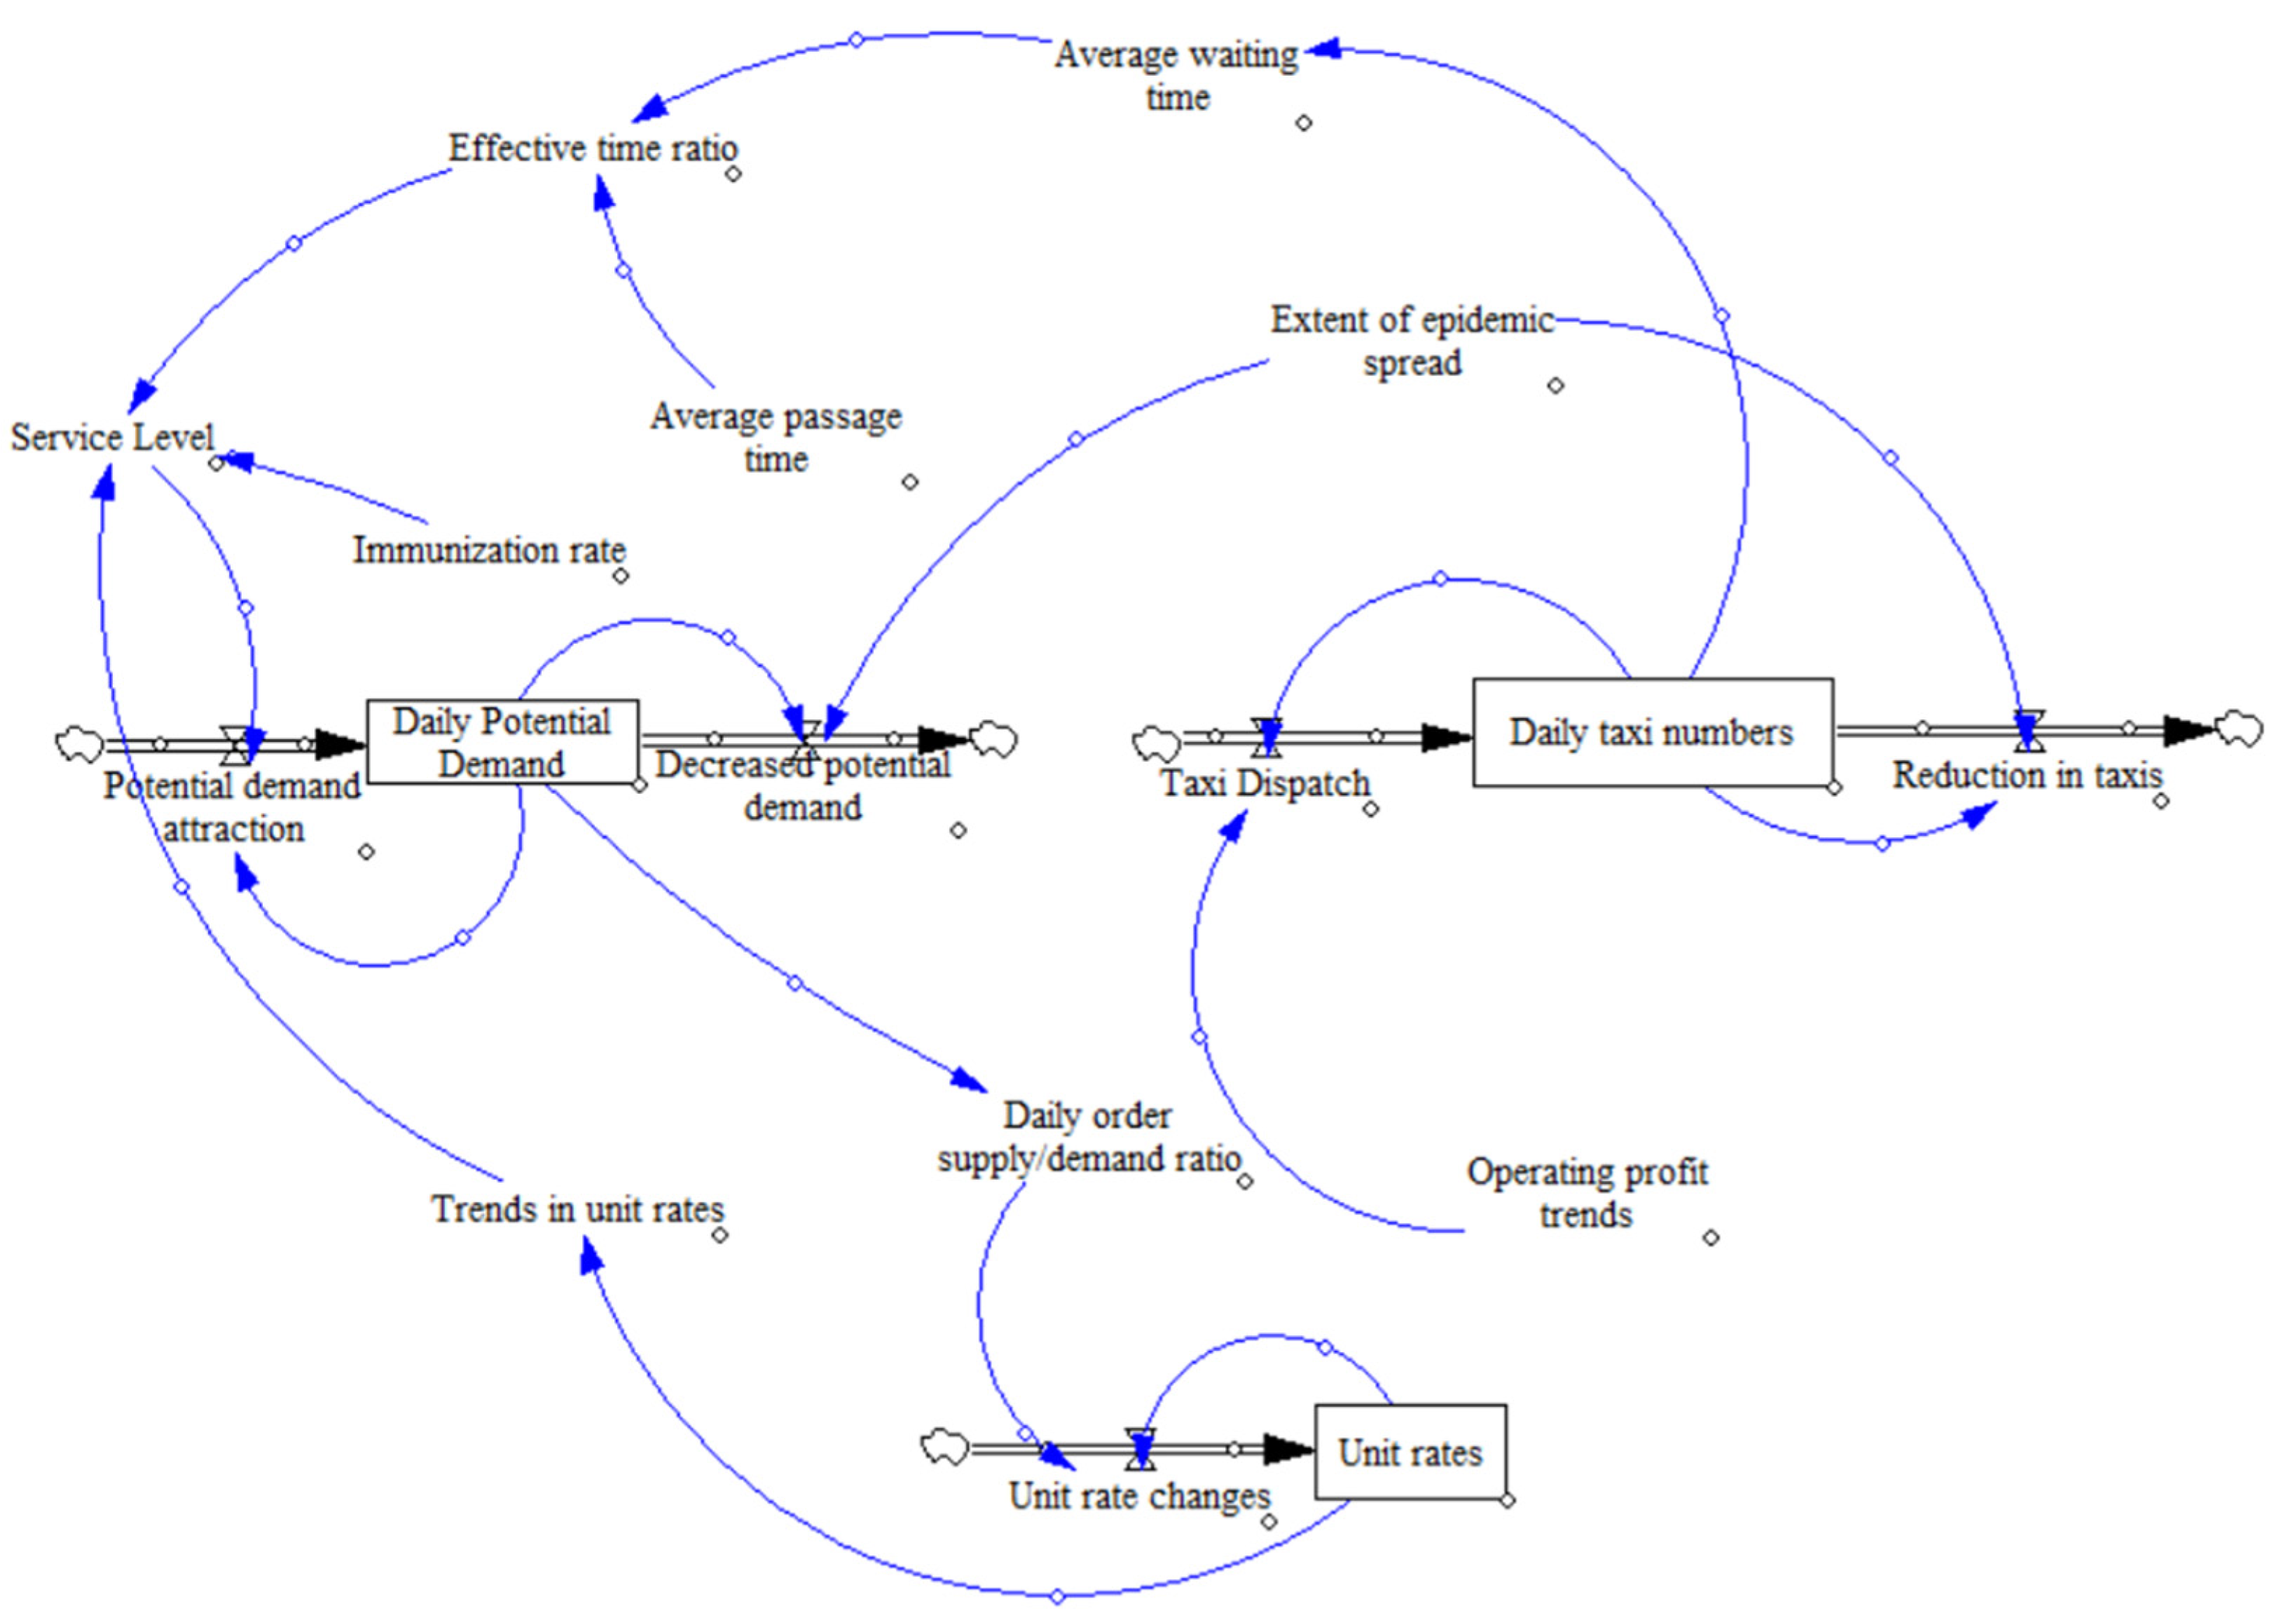
Figure 5.
Taxi supply sub-model.

Figure 6.
Validation of the cumulative number of confirmed cases.
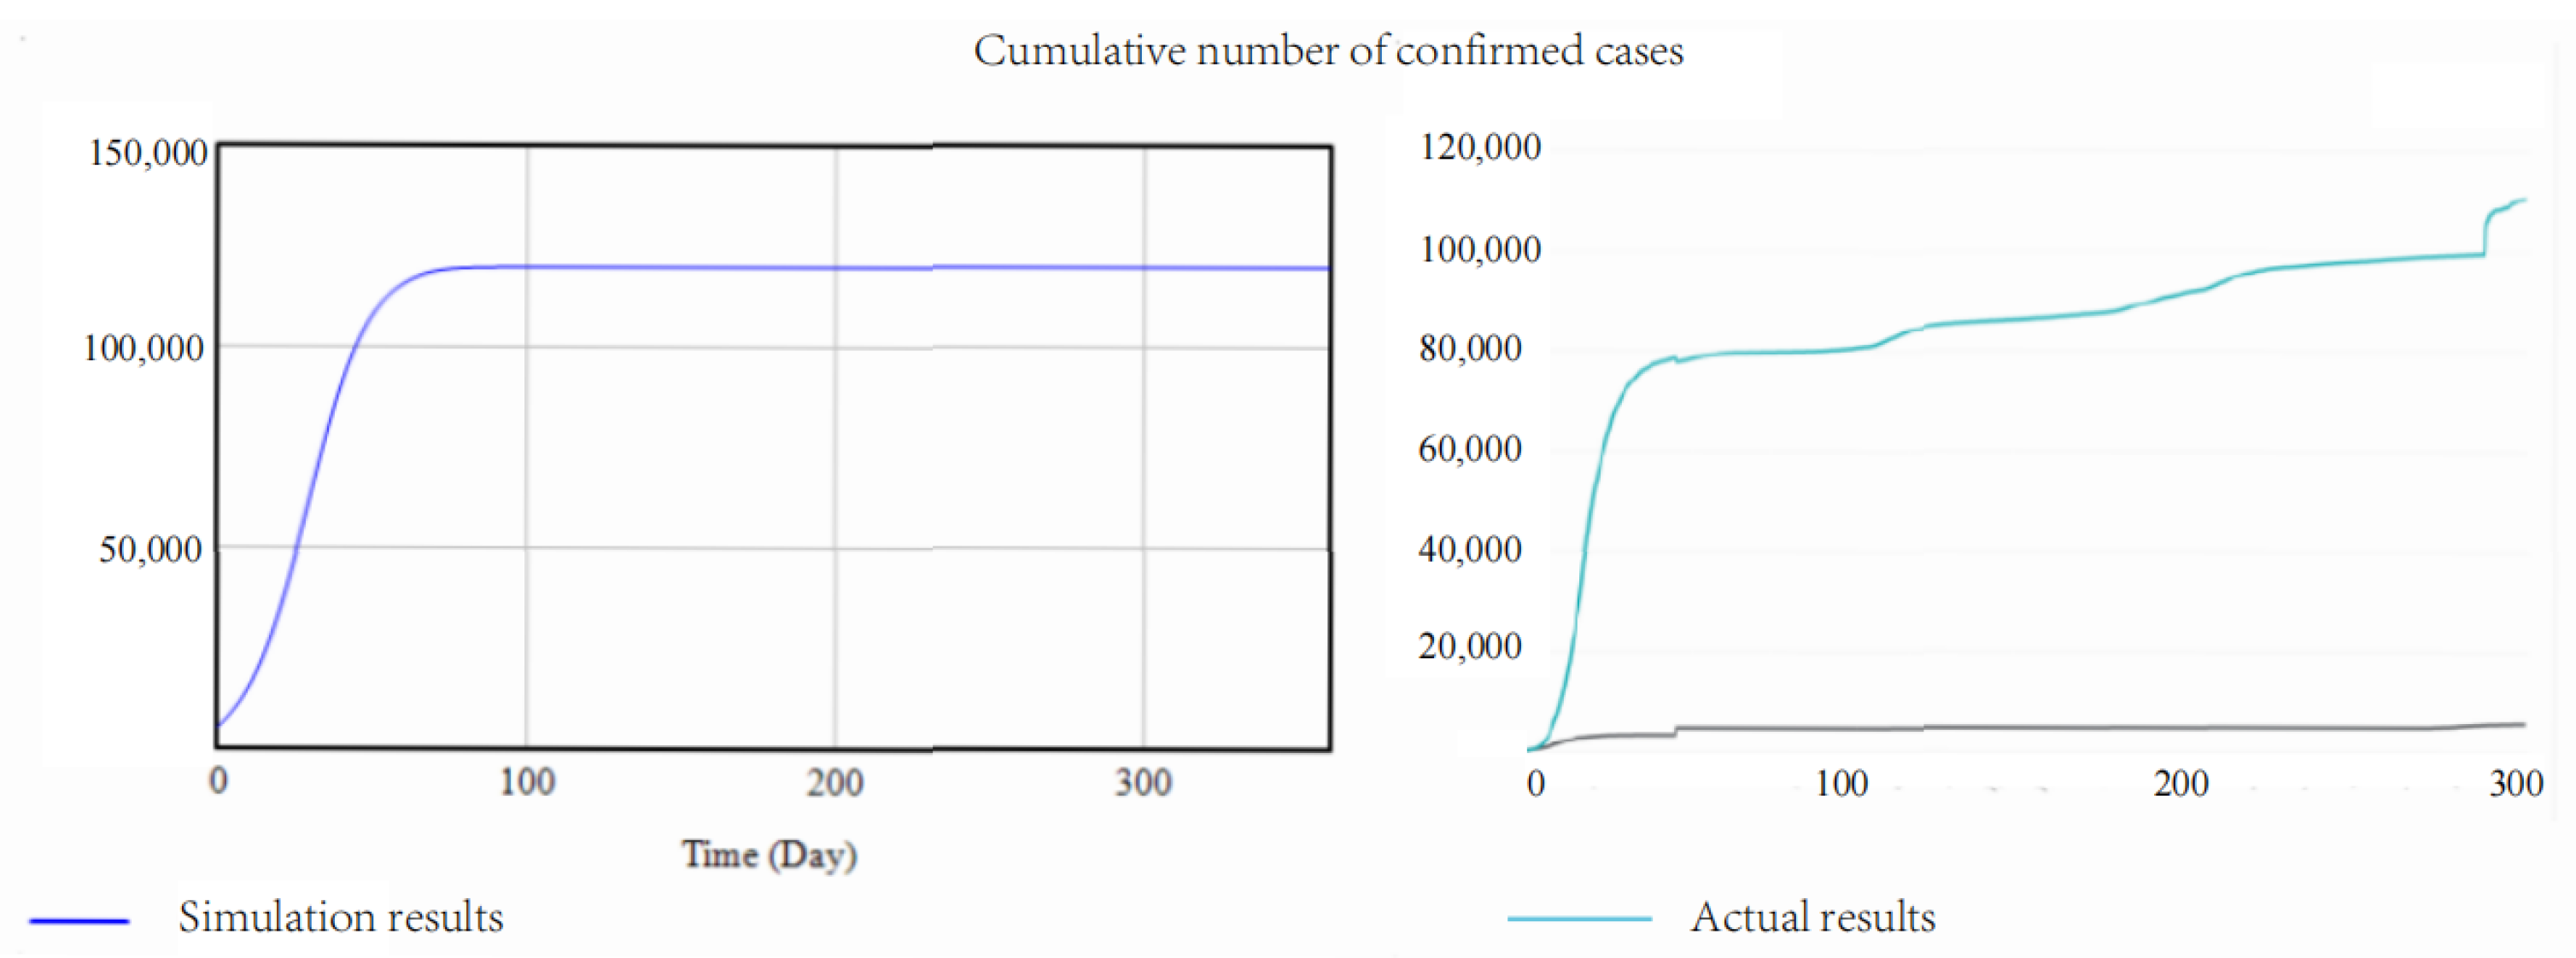
Figure 7.
Daily order count verification.
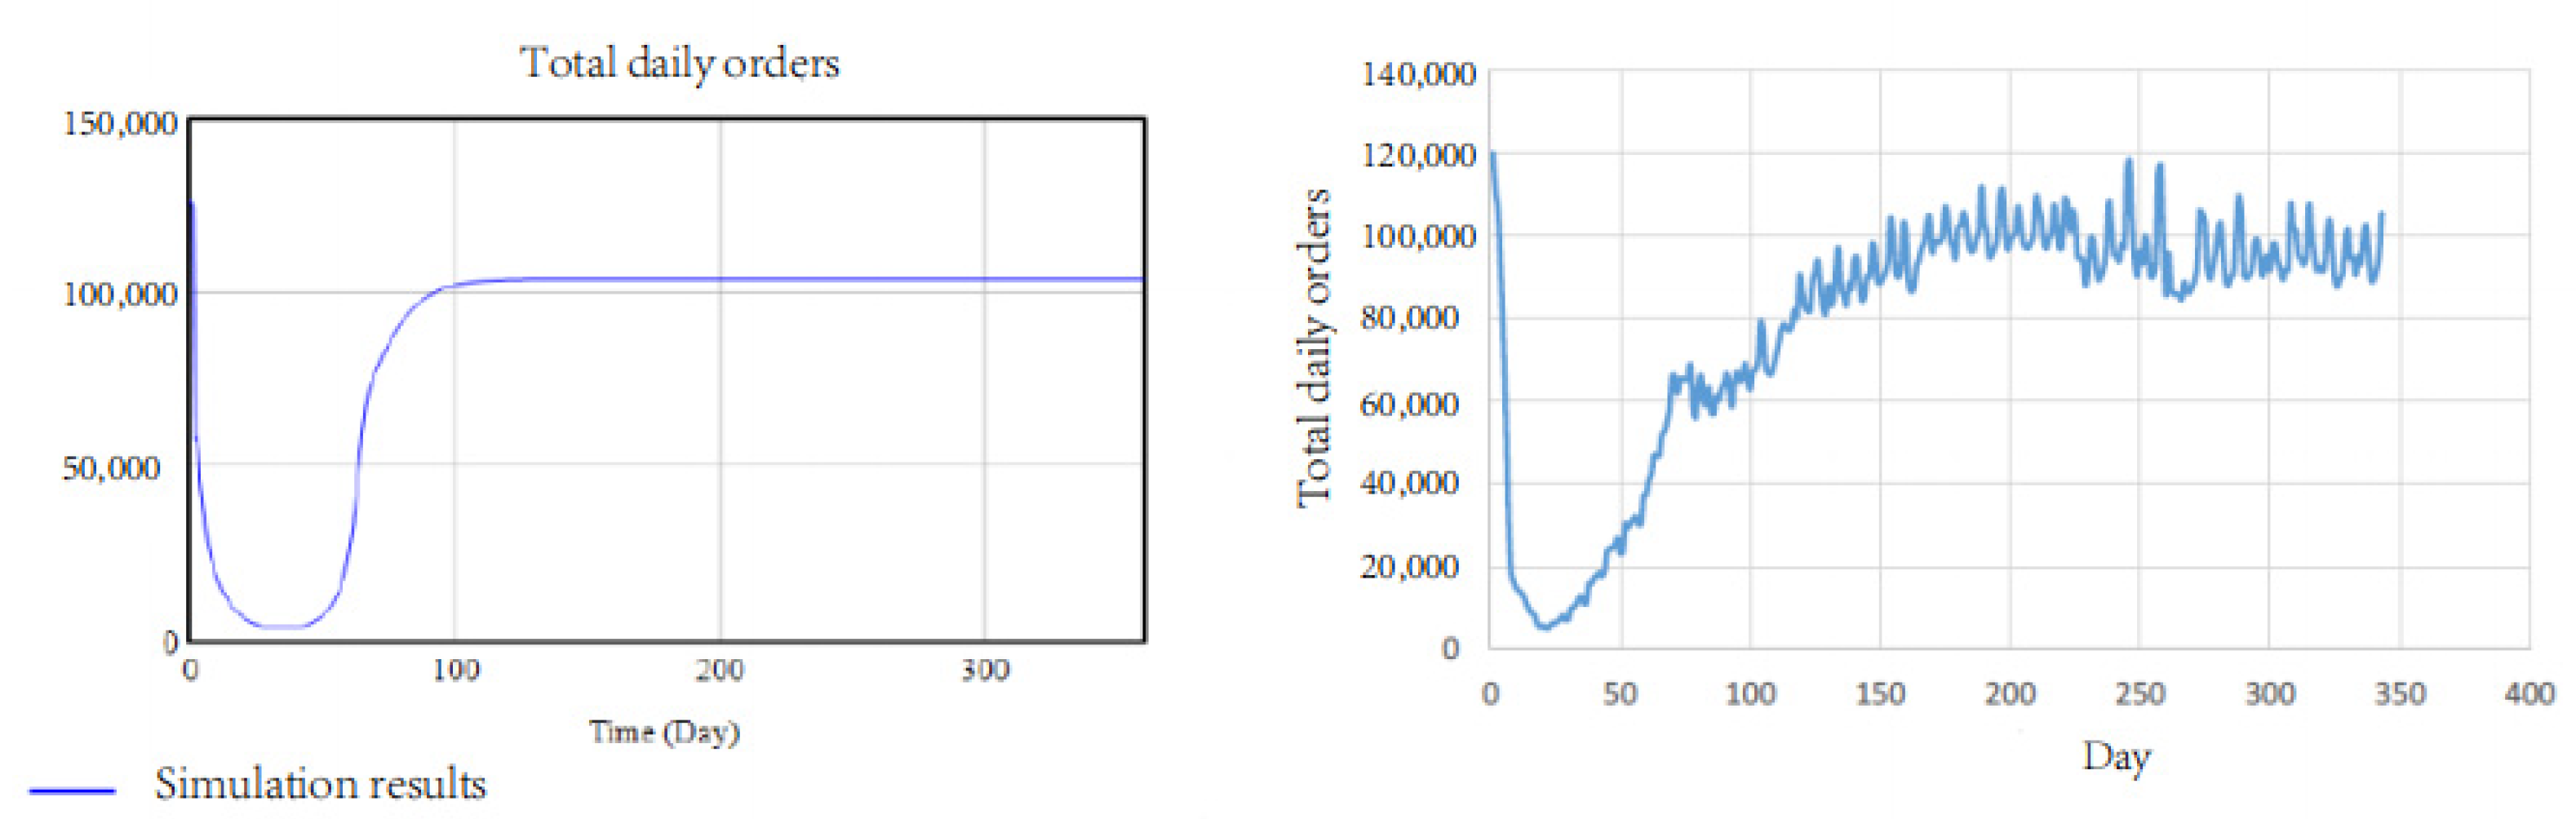
Figure 8.
Analysis of vaccine prevalence rates. (Left): daily potential (in passengers). (Right): operation profit (in yuan).
Figure 8.
Analysis of vaccine prevalence rates. (Left): daily potential (in passengers). (Right): operation profit (in yuan).
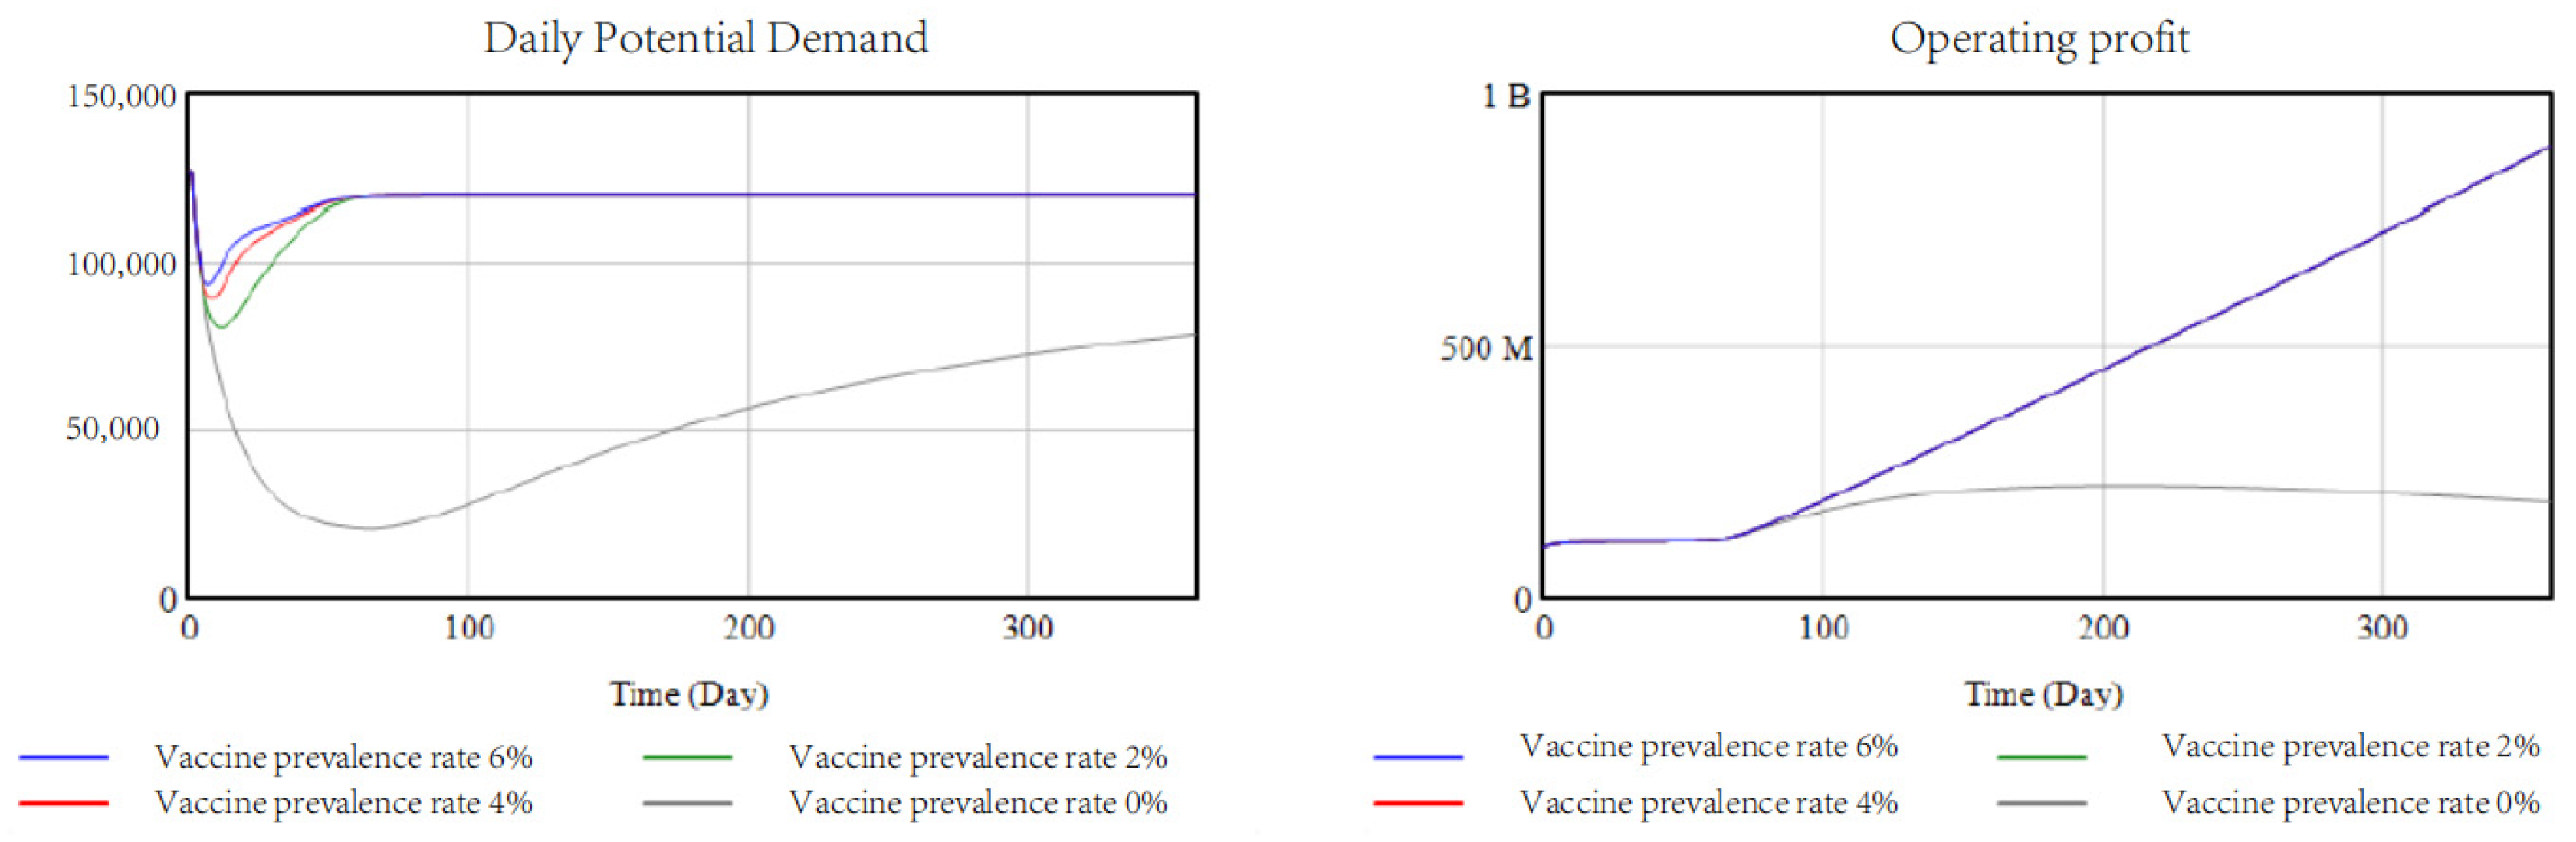
Figure 9.
Analysis of travel restrictions. (Left): total daily orders. (Right): operation profit (in Yuan).
Figure 9.
Analysis of travel restrictions. (Left): total daily orders. (Right): operation profit (in Yuan).
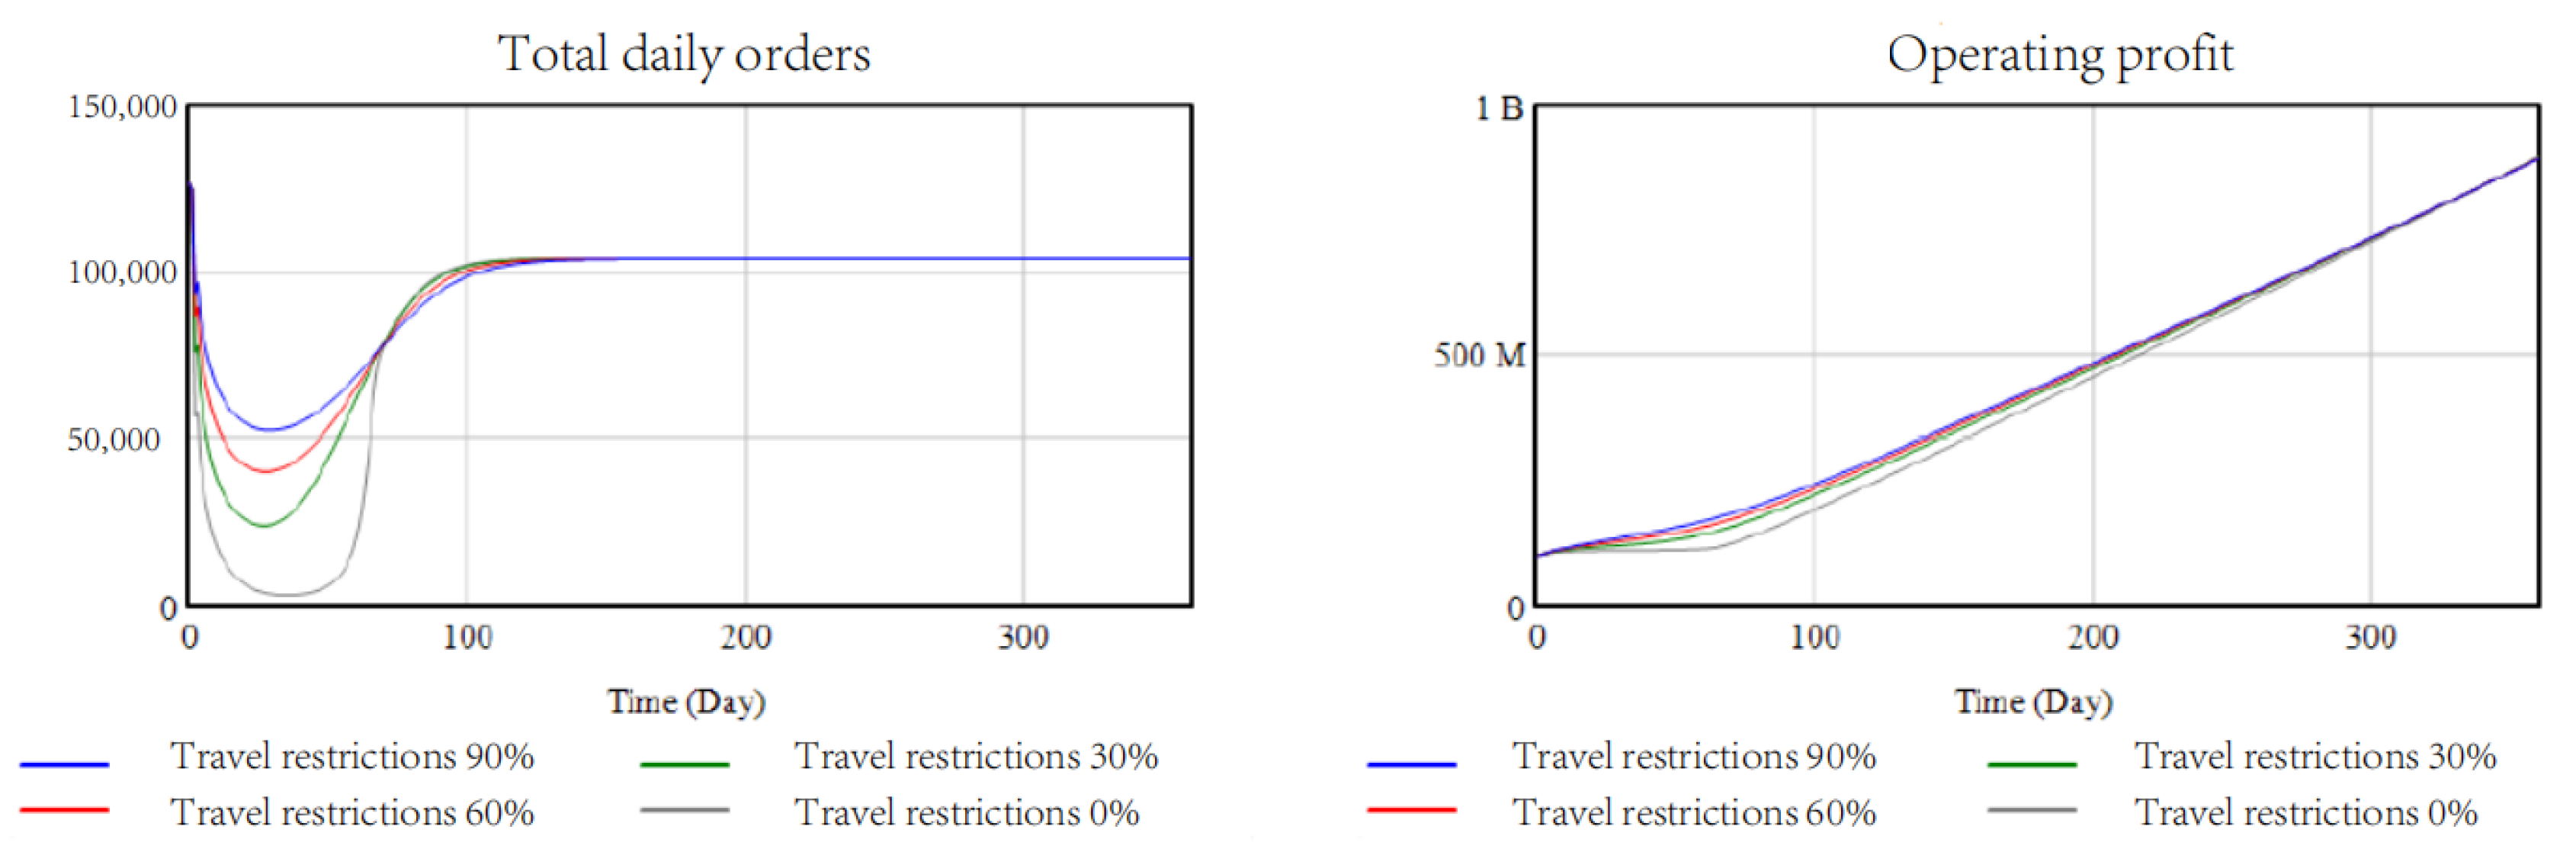
Figure 10.
Unit subsidy analysis. (Left): total daily orders (in passengers). (Right): operation profit (in Yuan).
Figure 10.
Unit subsidy analysis. (Left): total daily orders (in passengers). (Right): operation profit (in Yuan).


Table 1.
Summary of causal feedback loops.
| Name | Causal Feedback Loop | Notes |
|---|---|---|
| B1 | Daily potential demand → daily order supply/demand ratio → unit freight change → service level → daily potential demand | the daily order supply/demand ratio can influence the demand side. The change in the daily order supply/demand ratio regulates the unit tariff and affects the service level, which feeds into the daily potential demand. |
| B2 | Daily order supply/demand ratio → unit freight change → taxi dispatch → total daily orders → daily order supply/demand ratio | The daily order supply/demand ratio can also influence the supply side; by changing the daily order supply/demand ratio, the unit freight change can be adjusted, affecting taxi operations and dispatching, thus changing the total number of daily orders. |
| B3 | Total daily orders → operating revenue → operating profit → taxi dispatching → total daily orders | The daily order supply/demand ratio also affects taxi operations and scheduling by affecting operating revenue, thus changing the total number of daily orders. |
| B4 | Total daily orders → number of people exposed to susceptible persons → infection rate → degree of spread of the epidemic → total daily orders | An increase in the total number of daily orders affects the increase in the infection rate of the epidemic, which reduces the number of taxis per day and feeds back into itself, thus changing the total number of daily orders. |
| B5 | Cumulative number of confirmed cases → Immunized → Immunization rate → Level of service → Potential daily demand → Supply and demand ratio of daily orders → Unit fare → Taxi dispatch → Total daily orders → Number of people exposed to susceptible → Transmission rate → Cumulative number of confirmed cases | by implementing a vaccine prevalence policy for the epidemic, it is possible to increase the rate of immunization of the population and the demand for travel, thus affecting the total number of daily orders, which in turn increases the number of transmissions of the epidemic, thus achieving negative feedback. |
Table 2.
Summary of outbreak transmission variables.
| Variable Type | Variable Name | Value (Initial) | Formula |
|---|---|---|---|
| State variables | Immunized | 0 | = Recovered persons + vaccinated persons |
| Susceptible | 1,400,000,000 | = Total number of persons–vaccinated persons–latent persons become ill | |
| Cumulative confirmed number | 5000 | = The latent person becomes ill—the infected person recovers–the infected person dies | |
| Auxiliary variable | Recovered | - | = Cumulative number of confirmed cases × Recovery rate/Recovery period |
| Vaccinated | - | = Susceptible people × Vaccine penetration rate | |
| Latent person onset | - | = Infection rate × Cumulative number of confirmed cases × (1 − Cumulative number of confirmed cases/120,000) | |
| Degree of spread of the epidemic | - | = Contagion rate × Epidemic growth rate | |
| Number of people exposed to susceptible | - | = 10/(1 + travel restriction)/(1 + EXP(−10−5 × total number of daily orders)) | |
| Rate variable | Immunization rate | - | = Immune/(susceptible + immune) |
| Infection rate | - | = 0.1 × Number of people exposed to susceptible | |
| Epidemic growth rate | - |
= (Cumulative number of confirmed cases-DELAY1 (Cumulative number of confirmed cases, 1))/Cumulative number of confirmed cases DELAY1 = LV/delay time LV = INTEG (In-DELAY1, input×delay time) |
Table 3.
Summary of travel demand variables.
| Variable Type | Variable Name | Value (Initial) | Formula |
|---|---|---|---|
| Status variables | Daily potential demand | 129,600 (orders) | = Potential demand attraction − Decrease in potential demand |
| Number of taxis per day | 4300 (vehicles) | = Taxi dispatch − Reduction in taxis | |
| Unit rates | 3.6 (yuan/km) | = Unit rate changes | |
| Auxiliary variables | Potential demand attraction | - | = Daily potential demand × Service Level ×(1 − Daily potential demand/120,000) |
| Decrease in potential demand | - | = 10 × Extent of epidemic spread × Daily potential demand | |
| Taxi dispatch | - | = 70 × Trends in operating profit × Number of taxis per day × (1 − Number of taxis per day/4000) | |
| Reduction in taxis | - | = 26 × Extent of epidemic spread × Number of taxis per day | |
| Unit rate changes | - | = 0.01 × (1 − Daily order supply/demand ratio) × Unit rates × (1 − Unit rates/6) | |
| Service Level | - | = Immunization rate × Effective time ratio − Trends in unit rates | |
| Average waiting time | - | = 5 + 60 × EXP (−0.001 × Number of taxis per day) | |
| Effective time ratio | - | = Average travel time/(Average waiting time + Average travel time) | |
| Rate variables | Extent of epidemic spread | - | = Infection rate × Epidemic growth rate |
| Daily order supply/demand ratio | - | = Total daily orders/Daily potential demand | |
| Trends in operating profit | - | = (Operating profit − DELAY1 (Operating profit, 1))/Operating profit |
Table 4.
Summary of taxi supply variables.
| Variable Type | Variable Name | Value (Initial) | Formula |
|---|---|---|---|
| Status variables | Number of taxi unit orders | 30 (orders) | = Change in unit orders |
| Operating profit | 108 (yuan) | = Operating income − depreciation costs − operating costs + government subsidies | |
| Unit freight change | 3.6 (yuan/km) | = Change in unit rates | |
| Auxiliary variables | Increase in orders | - | = 0.1 × Number of taxi unit orders × (1 − Number of taxi unit orders/26) |
| Decrease in orders | - | = 28 × Extent of spread of the epidemic × Number of taxi unit orders | |
| Operating revenue | - | = total miles operated × unit rate | |
| Operating costs | - | = total miles operated × fuel cost | |
| Depreciation cost | - | = number of taxis per day × 70 | |
| Government subsidies | - | = number of taxis per day × unit subsidy cost | |
| Total daily orders | - | = number of taxi unit orders × daily taxis | |
| Total operational mileage | - | = total number of daily orders × average distance per order |
Publisher’s Note: MDPI stays neutral with regard to jurisdictional claims in published maps and institutional affiliations. |
© 2022 by the authors. Licensee MDPI, Basel, Switzerland. This article is an open access article distributed under the terms and conditions of the Creative Commons Attribution (CC BY) license (https://creativecommons.org/licenses/by/4.0/).
Share and Cite
MDPI and ACS Style
Yao, H.; Huang, Z.; Ye, X.; Grifoll, M.; Liu, G.; Zheng, P. Analysis of Taxi Travels during an Epidemic Period Using System Dynamics Method. Sustainability 2022, 14, 3457. https://doi.org/10.3390/su14063457
AMA Style
Yao H, Huang Z, Ye X, Grifoll M, Liu G, Zheng P. Analysis of Taxi Travels during an Epidemic Period Using System Dynamics Method. Sustainability. 2022; 14(6):3457. https://doi.org/10.3390/su14063457
Chicago/Turabian StyleYao, Hui, Zhengfeng Huang, Xiaofei Ye, Manel Grifoll, Guiyun Liu, and Pengjun Zheng. 2022. "Analysis of Taxi Travels during an Epidemic Period Using System Dynamics Method" Sustainability 14, no. 6: 3457. https://doi.org/10.3390/su14063457
Note that from the first issue of 2016, this journal uses article numbers instead of page numbers. See further details here.