Article

Quality Control of Emerging Contaminants in Marine Aquaculture Systems by Spot Sampling-Optimized Solid Phase Extraction and Passive Sampling

by
Panagiota Martinaiou
1,
Panagiota Manoli
1,
Vasiliki Boti
1,2,*,
Dimitra Hela
1,2,*,
Elissavet Makou
1,
Triantafyllos Albanis
1,2 and
Ioannis Konstantinou
1,2
1
Department of Chemistry, University of Ioannina, 45110 Ioannina, Greece
2
Institute of Environment and Sustainable Development, University Research Center of Ioannina (URCI), University of Ioannina, 45110 Ioannina, Greece
*
Authors to whom correspondence should be addressed.
Sustainability 2022, 14(6), 3452; https://doi.org/10.3390/su14063452
Submission received: 31 January 2022 / Revised: 6 March 2022 / Accepted: 9 March 2022 / Published: 15 March 2022
(This article belongs to the Special Issue Innovative Agrifood Supply Chain in the Post-COVID 19 Era)

Abstract

:
The presence of organic pollutants such as pesticides and pharmaceuticals in the aquatic environment, and especially in regions where fish farms are installed, is a matter of major importance due to their possible risks to ecosystems and public health. The necessity of their detection leads to the development of sensitive, reliable, economical and environmentally friendly analytical methods for controlling their residue in various environmental substrates. In the present work, a solid-phase extraction method was developed, optimized and validated for the analysis of 7 pesticides and 25 pharmaceuticals in seawater using LC-HR-LTQ/Orbitrap-MS. The method was then applied in seawater samples collected from an aquaculture farm located in the Ionian Sea, Greece, in order to evaluate environmental pollution levels. None of the pesticides were detected, while paracetamol was the only pharmaceutical compound that was found (at trace levels). At the same time, passive sampling was conducted as an alternative screening technique, showing the presence of contaminants that were not detected with spot sampling. Among them, irgarol was detected and as far as pharmaceuticals is concerned, trimethoprim and sulfadiazine were found; however, all positive findings were at the very low ppt levels posing no threat to the aquatic environment.

1. Introduction

In recent years, the development of the urban environment and industry has led to increasing pollution in the aquatic environment; however, the environmental quality control monitoring in marine aquaculture is one of the main concerns [1]. Aquaculture is among the pressure factors in coastal ecosystems, introducing pollutants such as pharmaceuticals and plant protection compounds. Emerging organic pollutants, including pesticides and pharmaceutical compounds, are a large group of contaminants that can be found in aquatic ecosystems, and therefore various monitoring frameworks have been developed aiming to assess their environmental fate and concentration levels. The EU Marine Strategy Framework Directive (MSFD) (Directive 2008/56/CE), ref. [2] especially, establishes requirements to obtain a good environmental status of the marine environment. Emerging organic pollutants are extensively studied in various aquatic matrices such as wastewater, surface, ground water and drinking water, which are directly affected by them [3,4,5,6]; however, studies focusing on the presence of organic pollutants in marine ecosystems are relatively limited [7].
Pesticides are present in the aquatic environment due to their application in agricultural fields [8], and in this way, they can be transported by surface runoff into inland surface waters ending to the sea and by leaching through soil into groundwater [9,10]. Water solubility, as well as the stability of each substance, are major properties affecting the fate of pesticides in the environment [11,12]. In general, pesticides are toxic to living organisms with carcinogenic and mutagenic properties in humans and other animals. Taking into account their potential effects, their persistence and their regular application, these compounds provide a major risk for the environment [13,14]. The concentrations of pesticides that are found in aquatic marine ecosystems are usually at levels of ng L−1. As a result, the use of very reliable, selective and highly sensitive analytical methodologies is very important in order to be detected, involving a pre-concentration step of the target analytes from the seawater sample so that they can be determined at such low levels based on the modern analytical techniques [15].
Pharmaceuticals are widely used for the treatment of diseases in humans and animals, reaching environmental compartments through incomplete removal during decontamination technologies or improper disposal [16]; they are considered as emerging and priority environmental contaminants because of their potential risks both to the environment and human health due to the promotion of microbial resistance to antibiotics [17,18,19]. The occurrence of pharmaceuticals and their transformation products (TPs) in aquatic systems is highly demonstrated, while they can undergo further transformations into more toxic products in some cases [20,21,22,23]. Consequently, the environmental monitoring of these compounds is very important in order to assess their possible environmental risks, and several works have focused on their occurrence in the marine environment [24,25,26,27]. The concentration levels of these compounds in fish farm regions are an issue that must be under further investigation while it is directly connected with public health; therefore, these contaminants’ presence in marine ecosystems and especially in fish farming areas makes necessary the constant monitoring of pollution levels.
Routine water monitoring mainly relies on spot (grab) sampling at fixed intervals. The analysis of spot samples combined with optimized solid-phase extraction (SPE) procedures and high-resolution chromatographic analysis can detect pollutants at trace levels [8,13], and thus, improvements in extraction and detection methods are highly important; however, this approach provides an instantaneous estimate of the pollutant’s concentration at the time and point of sampling and is likely to miss peak inputs in a given aquatic system. Passive sampling (PS) appears as a promising alternative instead of the traditional spot sampling method for environmental contaminants monitoring [28]. This method for detecting such compounds, including pesticides or drugs, offers a great variety of advantages. One significant benefit is that PS, in contrast to instantaneous sampling, allows the determination of the average concentration of pollutants that are present in a sampling area as well as the pre-concentration of pollutants, thus increasing the possibility of their detection in trace concentrations. PS devices are used to enable regular monitoring of chemicals in both spatial and temporal ways in water [29]. In this way, a screening of environmental pollutants could be achieved while during spot sampling some contaminants may not be detected; moreover, the number of required sampling for a reliable analysis is somewhat lower, making this method much more economic as the use of materials and reagents is reduced [30]. Although PS techniques are more challenging due to hydrodynamic regime and calibration requirements, they have been recommended (WFD daughter 2013/39/UE) as complementary methods to improve the level of confidence in surface water monitoring in comparison with grab sampling [31].
In the present study, 7 multiclass pesticides and 25 multiclass pharmaceuticals were selected and studied in seawater samples coming from an aquaculture facility located in the Ionian Sea, Greece. The selection of the target compounds was based on factors such as their extended use in aquaculture facilities, their potential presence in aquatic systems due to the surrounding agriculture activities (pesticides), their multi-purpose use of disease treatment (pharmaceuticals), as well as their detection in surface waters in Greece [1,32,33,34]. The aim of this work is the development, optimization and validation of an SPE extraction method for conventional spot samples, along with passive sampling screening for seawater quality control in aquatic farm ecosystems, as well as the application of this method in real samples.

2. Materials and Methods

2.1. Chemicals and Reagents

The pesticides selected in the present study were azamethiphos, azoxystrobin, boscalid, irgarol, malathion, pirimiphos-methyl, tebufenozide, and metobromuron (internal standard) were of high purity (>98%) and they were supplied in solid form by Sigma Aldrich (Darmstadt, Germany). The standard pharmaceutical compounds were also of high purity (>98%) and were supplied in solid form (alprazolam, amisulpride, amitriptyline, atenolol, bezafibrate, budesonide, bupropion, carbamazepine, cimetidine, citalopram, diazepam, fluoxetine, haloperidol, ketoprofen, mirtazapine, olanzapine, paracetamol, paroxetine, phenazone, quetiapine, risperidone, sertraline, and venlafaxine). All pharmaceutical compounds were purchased from Sigma Aldrich (Darmstadt, Germany) except olanzapine, amisulpride, amitriptyline, ketoprofen, paroxetine, quetiapine and venlafaxine, which were acquired from Tokyo Chemical Industry, Europe N.V (Oxford, U.K). Mirtazapine and deuterated internal standards D3-olanzapine, D4-haloperidol, D5-fluoxetine, D6-amitriptyline and D10-carbamazepine were obtained from Analytical Standard Solutions, A2S (Saint Jean d’Illac, France). Alprazolam and diazepam are under controlled distribution in Greece with drug control procedures, so they were offered as a donation by the company Adelco (Moschato, Athens, Greece).
Stock standard solutions were prepared for each compound, at concentrations of either 2000 mg L−1 or 1000 mg L−1, in methanol. Based on these solutions the mixtures of pesticides and pharmaceutical compounds were prepared at a concentration of 10 mg L−1, in methanol. Both the solutions of individual compounds and the mixtures were stored at −20 °C. The working solutions of the mixtures were prepared in methanol and in concentrations of 50, 100, 250, 500, 1000 and 5000 ng L−1. Both metobromuron and the mixture of deuterated internal standards were prepared in methanol at concentrations of 1000 and 5000 ng L−1.
The solvents methanol and acetonitrile (ACN, acetonitrile) of analytical grade and dichloromethane (DCM, methyl chloride) of purity >99.5% were supplied by Fisher Scientific (Leicestershire, UK). High purity ethanol (ethanol) as well as hexane (n-hexane) were supplied by Lab-Scan (Dublin, Ireland). The purity acetone >99.9% was from Honeywell (Morris Plains, NJ, USA) while the LC–MS purity water was supplied by Fisher Scientific. Formic acid (FA) and ammonium formate (FNH4) of 98–100% purity was obtained from Merck (Darmstadt, Germany). Oasis HLB extraction cartridges (divinylbenzene/N-vinylpyrrolidone copolymer, 200 mg, 6 mL) were supplied from Waters Corporation (Milford, CT, USA). The samplers POCIS (47 mm i.d. membrane disks) were provided by Exposmeter SA (Tavelsjö, Sweden) with the “generic” configuration for pesticide sampling (pest-POCIS) and for pharmaceutical sampling (pharm-POCIS).

2.2. Sampling

Seawater samples were collected for the development and validation of the extraction method. In addition, a 10-month spot sampling campaign was carried out to estimate the seawater pollution levels. For that purpose, water samples were collected monthly (July 2020 to April 2021) from an aquaculture farm in the Ionian Sea, from two sampling points (one sampling point in the fish farm and one reference point around 1 Km away from the fish farm in the open sea, both at 2 m depth from the surface) (Figure S1). Seawater from the reference point which was previously checked to ensure that it did not contain the selected analytes was also used for the method development and validation. The collection of the samples was carried out in dark glass bottles of 2.5 L. The samples were transferred to the laboratory under refrigeration, filtered through GF/F glass fiber filters (0.7 μm pore size, Whatman International Ltd., Maidstone, UK) and stored at 4 °C until extraction within 24 h. At the same time, passive sampling took place in the same region.
For the passive sampling, both pest-POCIS and pharm-POCIS disks were attached in stainless steel holders and placed in stainless steel canisters as they are provided by Exposmeter SA (Tavelsjö, Sweden). The samplers were mantled in the field before deployment. The three canisters were placed at different sampling sites in the aquaculture region. The first was placed between the coast and the fish farming, the second within fish farming area, while the third was placed away from fish farms in the open sea, all at a depth of 2 to 3 m. The samplers were deployed twice for 3 weeks during the period September 2020–April 2021. At the end of the exposure period, the POCIS were slightly or not biofouled and for this reason, they were rinsed with sea water and ultrapure water to remove any debris and to clean the nuts and bolts, wrapped in aluminum foil, and stored in their original containers, then transported to the laboratory under cooled conditions (~4 °C). The extraction of the target compounds was carried out usually on the same day; otherwise, POCIS were stored, frozen, and the extraction was performed within 24 h. One blank POCIS was exposed to open air during the deployment and retrieval of the POCIS and was transported and analyzed as the deployed POCIS. Procedural blank consisted of POCIS taken through the entire processing and analysis sequence.

2.3. Solid-Phase Extraction (SPE)

Two different analytical procedures for solid-phase extraction were developed, with the first concerning the extraction of pesticides and the second concerning pharmaceutical compounds.

2.3.1. Pesticides

The Oasis HLB extraction columns (200 mg, 6 mL) were placed in a 12-port extraction manifold connected to a vacuum pump and activated by the successive addition of 6 mL of methanol and 6 mL of LC–MS water, which were eluted from the columns with a flow rate ≈1 mL min−1. Immediately after activation and before the adsorbent dries, 250 mL of the aqueous sample percolated through the cartridge by vacuum, with a flow rate ≈2 mL min−1. At the end of the extraction and before the columns dry, the cartridge was washed with 6 mL of LC–MS water and left under a vacuum for 30 min. The elution with 3 mL of dichloromethane, 3 mL of hexane and 3 mL of acetone followed previous reports [35]. This procedure was chosen after testing two extraction protocols in triplicate under different extraction conditions in order to select the optimal conditions for pesticides in water. Oasis HLB extraction columns (200 mg, 6 mL) were used in both cases. The pH of the samples was not adjusted in any protocol as most of the selected compounds do not have chemical moieties that can be ionized; Moreover, the aim of the study was the simultaneous determination of pesticides with different physicochemical properties, and as the pH values of the samples ranged from 6.5 to 7.5, it was finally chosen not to adjust the pH value of the seawater samples. LC–MS grade methanol and water were used as activation solvents in both protocols. The volume of the passing sample in both cases was 250 mL and the flow rate was constant (2 mL min−1). Regarding the rinsing of the cartridges after loading the whole sample and before elution, LC–MS purity water was used in both cases. Testing was performed at the elution stage of the SPE process, where different elution solvents were used among protocols. In “HLB1” 2 × 5 mL MeOH was used while in “HLB2” a combination of solvents was used: 3 mL dichloromethane, 3 mL hexane, 3 mL acetone, successively and in this order; the 9 mL eluate was collected in the same tube. In both cases, the eluate was evaporated to dryness under a gentle stream of nitrogen and redissolved in 500 μL H2O: MeOH (90:10, v/v) acidified with 0.1% formic acid. Metabromuron was added as an internal standard in the final extracts before chromatographic analysis.

2.3.2. Pharmaceuticals

For the extraction of the pharmaceutical compounds, a different procedure was followed. After the samples were acidified with formic acid (pH = 3–3.5), the mixture of isotopically labeled internal standards (IS) was added. The Oasis HLB extraction columns (200 mg, 6 mL) were placed in an extraction device connected to a vacuum pump and activated by successive addition of 5 mL of methanol and 5 mL of, acidified with formic acid, LC–MS water similarly to the sample, which is eluted from the columns by vacuum application and flow rate ≈1 mL min−1. Immediately after activation, 250 mL of the acidified aqueous sample was extracted through the columns by vacuum application and flow rate ≈2 mL min−1. At the end of the extraction, the cartridges were washed with 5 mL of LC–MS water and were left under vacuum for 30 min, for complete moisture removal. Elution with 2 × 5 mL methanol, in a vacuum, at a flow rate of ≈2 mL min−1 followed. The eluents were concentrated under a gentle stream of nitrogen and redissolved in 500 μL of 0.1% formic acid in water/methanol 90/10 (v/v).
Prior to method validation, three protocols were tested. The pH of the sample was not adjusted before extraction in protocol “HLB3” while in the protocols “HLB4” and “HLB5”, the samples were acidified in a final pH value of ≈3. Furthermore, in protocols “HLB3” and “HLB4” 5 mL Na2EDTA (5% w/v) were added. Methanol LC–MS and water LC–MS were the activating solvents in all cases. The volume of the passing sample in all 3 cases was 250 mL and the flow rate constant (2 mL min−1). Regarding the rinsing of the cartridges after loading of the whole sample and before elution, in the first 2 cases, LC–MS purity water was used while in the “HLB5” protocol 5 mL of 20% methanol in 2% acetic acid was used. Testing was also performed at the elution stage of the SPE process, where 2 × 5 mL MeOH was used in the first two protocols while 2 × 5 mL methanol was used in “HLB5” with the addition of 2% acetic acid (v/v). In all 3 cases, the eluate was evaporated to dryness under a gentle stream of nitrogen and redissolved in 500 μL, H2O: MeOH (90:10, v/v) acidified with 0.1% formic acid in “HLB4” and H2O: MeOH (90:10, v/v) without the addition of formic acid in the other two protocols.
The final extracts from both pesticides and pharmaceutical extraction procedures were then subjected to analysis in LC-HR-LTQ/Orbitrap-MS. The validation of the analytical methods was carried out on fortified samples based on the current instructions 2002/657/EC, [36] and 96/23/EC. After the development, optimization and validation of the SPE methods for the determination of pesticides and pharmaceuticals, the methods were applied in seawater samples. The physicochemical characteristics of the seawater samples were measured using a portable field multimeter sensor (WTW) as shown in Table 1.

2.4. Passive Sampling Procedure

Two configurations of POCIS were used in this study, the generic configuration that contained a mixture of three sorbent materials to sample most pesticides, the pharmaceutical configuration that contained a single sorbent material designed for sampling most pharmaceutical groups. The loaded POCIS were disassembled carefully, and the membranes were detached from the disk. The sorbent was transferred into a glass mortar and left at room temperature until dried. Then, it was weighed and carefully transferred into an empty solid-phase extraction tube (6 mL) and it was packed between two polyethylene (PE) frits (20 μm porosity). The pest-POCIS samplers contained ≈200 mg of a triphasic sorbent admixture: hydroxylated polystyrene-divinylbenzene resin (Isolute ENV+)/carbonaceous sorbent (Ambersorb 572), 80:20 (w/w), dispersed on styrene-divinylbenzene copolymer (S-X3 Bio Beads) and was enclosed between two hydrophilic polyethersulfone (PES) microporous membranes (130 μm thickness, 0.1 μm pore size). For the extraction of the pesticides, SPE cartridges were disposed on a Visiprep SPE vacuum manifold (Supelco) and were eluted using 30 mL of a mixture of dichloromethane/methanol/toluene (8:1:1, v:v:v) [37]. The eluate was reduced to dryness in a gentle stream of nitrogen and the residue was dissolved in 0.5 mL of LC mobile phase.
For the extraction of pharmaceutical compounds, Pharm-POCIS (HLB) sorbent was also transferred into an empty SPE cartridge (6 mL) and packed between two polyethylene frits (6 mL). Elution of the analytes from the sorbent was performed twice with 10 mL of MeOH at 1 mL min−1 rate. At the last step, the eluate was evaporated until dryness was almost achieved under a gentle stream of nitrogen, and reconstituted in 1 mL of LC mobile phase. The sampling rate is a parameter that allows the determination of analytes mass in passive sampling devices, as it shows the water volume which is sampled per time units. For the calculation of environmental concentration levels, the following equation for the determination of sampling rates [38] was used:
R s = C p o c i s × M p o c i s C w a t e r × t
where Cpocis (μg g−1) is the concentration of analyte in the sorbent, Mpocis (g) is the mass of the sorbent within the POCIS, Cwater (μg L−1) is the mean concentration of the analyte in the water and t concerns the sampling period (days). In this study, available Rs values were obtained from literature data [23,39], and in this way, the minimum and maximum concentrations of the detected compounds were calculated.

2.5. LC–MS Analysis

An Ultra High Performance Liquid Chromatography (UHPLC) system coupled to a LTQ/Orbitrap FT mass spectrometer was used for the selected pesticides and pharmaceutical compounds determination. The system included an automatic sampler (Accela AS autosampler model 2.1.1), an automatic sample flow pump (Accela quaternary gradient U-HPLC-pump model 1.05.0900) and an LTQ Orbitrap XL 2.5.5 SP1 mass spectrometer from Thermo Fisher Scientific (Bremen, Germany). The selected analytes were separated on a Hypersil GOLD reversed-phase analytical column (50 mm × 2.1 mm, 1.9 μm) from Thermo (Bremen, Germany). The control of the instrument and the processing of the mass spectra was carried out using the Xcalibur v.2.2 software (Thermo Electron, San Jose, CA, USA). Chromatographic analysis in both cases included a gradient elution program. For the pesticides, the mobile phase consisted of (A) H2O + 5 mM FNH4 + 0.1% FA and (B) MeOH + 5 mM FNH4 + 0.1% FA. A 10-min program was used to separate the compounds of interest. The mobile phase gradient started at 90% mobile phase A and was maintained for 0.6 min; then the methanol content (B) increased until it reached 100% at 5.1 min, where it was maintained for 1.2 min. Afterward, the mobile phase was restored to 90% A and maintained over 3 min for re-equilibration. The flow rate was kept constant at 300 μL min−1 and the oven temperature was set at 20 °C. For the pharmaceutical compounds, the mobile phase consisted of (A) H2O + 0.1% FA and (B) MeOH + 0.1% FA with an initial solvent composition of 95% (A) and 5% (B). This was maintained for 1 min. Then, the methanol content increased to 70% in 2 min to reach 100% in 5 min and it was maintained for 2 min, until the system returned to its initial conditions. The flow rate was kept constant at 250 μL min−1 and the oven temperature was set at 35 °C. The injection volume was 5 μL in both cases.
All the detected compounds were identified on the basis of their retention time and formation of the protonated molecular ion [M + H]+. The mass range selected for pesticides and pharmaceuticals full scan acquisition was m/z 120–1000 amu. The main instrument parameters were optimized at the instrument tuning sections. Quantification was performed post-acquisition using an isolation window of ±2 amu. The ESI source values and the MS parameters were: spray voltage 3.7 V and 4 V for pesticides and pharmaceuticals, respectively, sheath gas 40, aux gas 15 and sweep gas 0 arbitrary units, capillary temperature 320 °C, capillary voltage 30 V, tube lens 90 V, as well as AGC target 4 × 10⁵ at a resolution of 60,000. Confirmation of the analytes was achieved through their production using Collision Induced Dissociation (CID 35%) and fragmentation process (Data-Dependent mode). The fragment ions produced for the detected compounds were: paracetamol 152.0706 → 110.0597, trimethoprim 291.1452 → 230.1162, sulfadiazine 251.0579 → 156.0114 and irgarol 254.1434 → 198.0811.

3. Results and Discussions

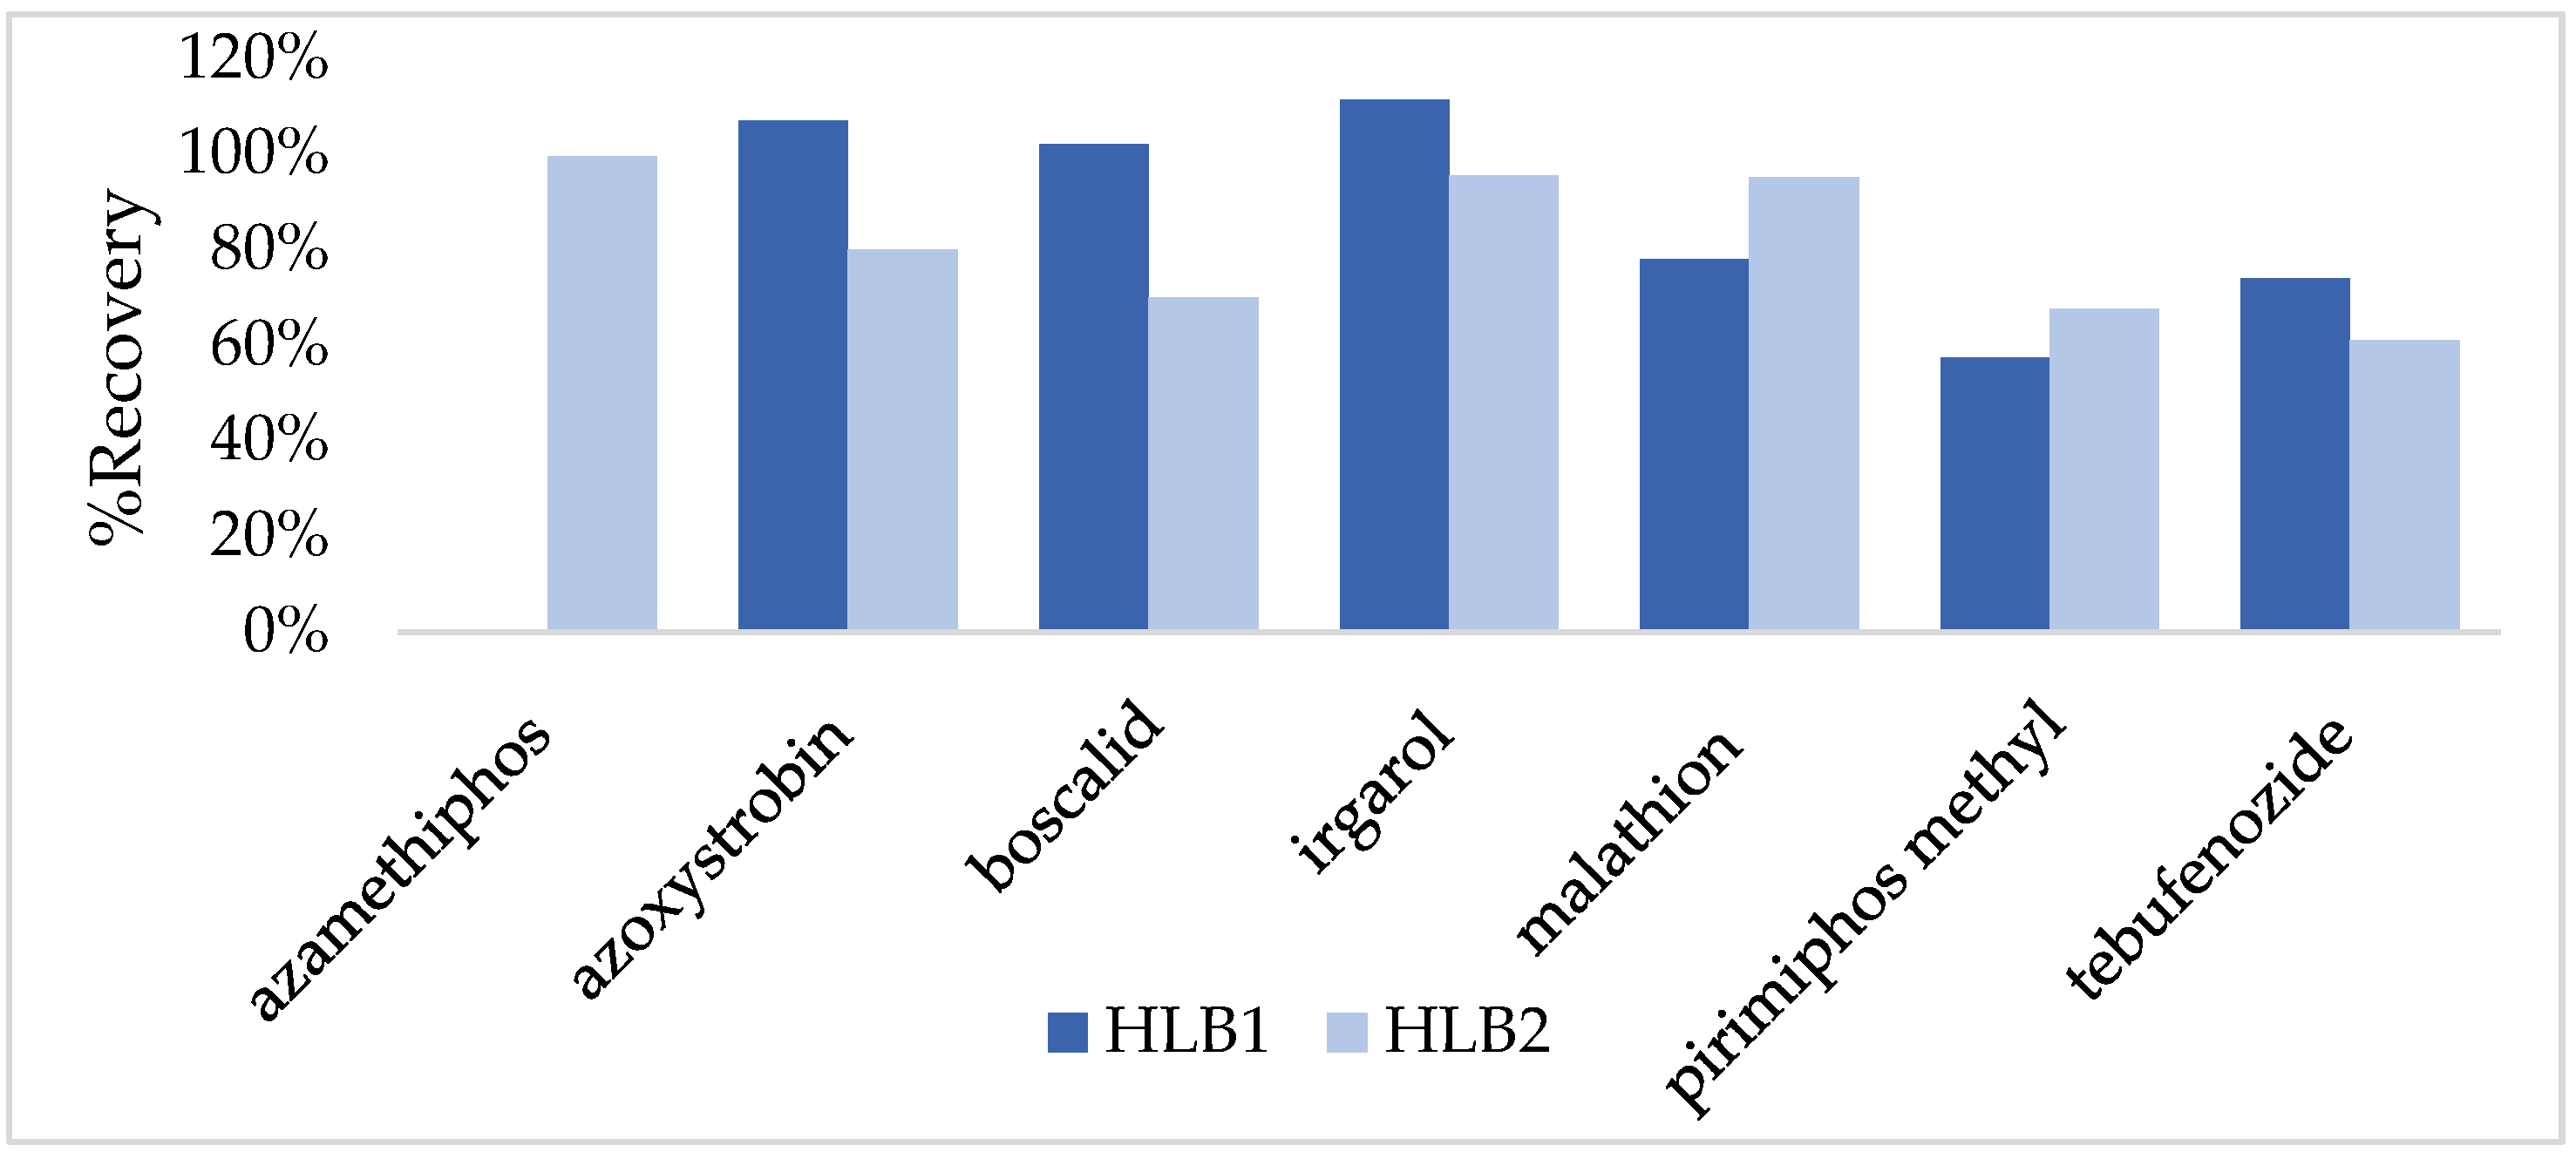
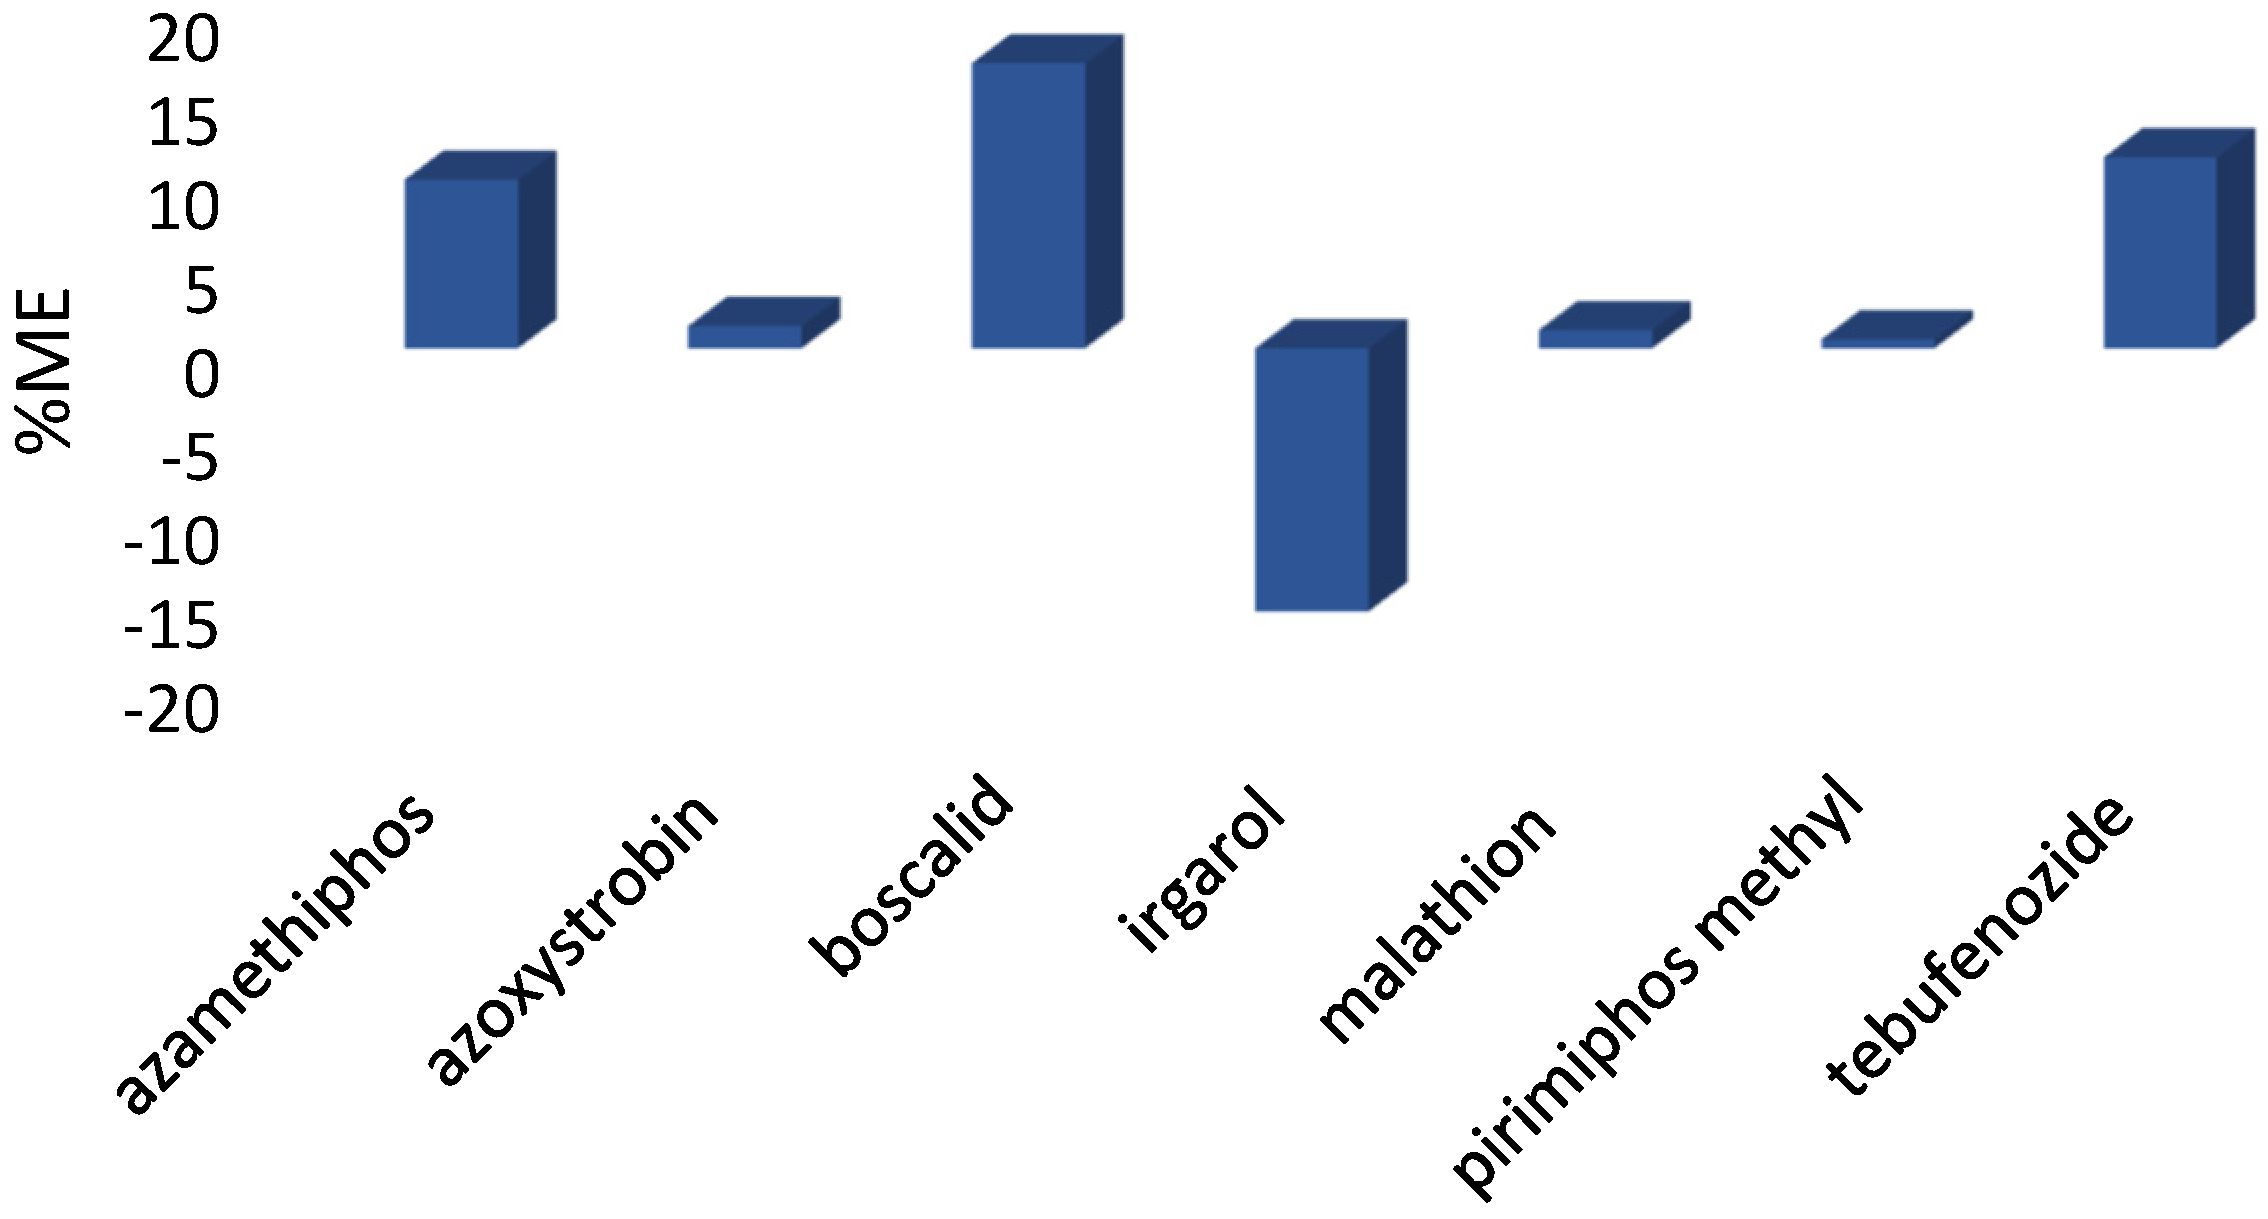
3.1. Optimization and Validation of SPE Method for Pesticides

The optimization of the extraction method was based on different protocols for the multiresidue analysis of pesticides and pharmaceutical compounds. Two extraction protocols (HLB1, HLB2, Table S1) were tested to select the optimal extraction conditions for pesticides from seawater and three extraction protocols (HLB3-HLB5) for pharmaceutical compounds. As shown in Figure 1, the recoveries for most pesticide compounds are in the range of 60–100% in both protocols and the relative standard deviations in the acceptable limits of 0–20%; however, for “HLB1” protocol azamethiphos was not recovered while the relative standard deviations are larger, thus “HLB2” protocol was chosen.
The evaluation of the method’s trueness was based on the calculation of the recoveries in fortified water samples. The recoveries of pesticides were calculated in three concentration levels, 25 ng L−1, 100 ng L−1 and 250 ng L−1 that were analyzed in triplicates. The levels selection was based on the concentration levels at which the selected compounds are generally found in the environment. As shown in Table 2, the mean recovery values at the low concentration level ranged from 58.5% (tebufenozide) to 98.9% (pirimiphos-methyl), at the intermediate concentration level from 61, 8% (tebufenozide) to 95% (malathion) and from 58.6% (tebufenozide) to 78.3% (malathion) for the high concentration level. Five samples (n = 5) were fortified and analyzed on the same day to calculate the repeatability of the method (RSDr), for the intermediate concentration level, on five consecutive days to calculate the intermediate precision (RSDIP). The repeatability of the method (RSDr) was always less than 19.5% recorded for the high concentration level. Method intermediate precision (RSDIP) was <11.4%, observed for azoxystrobin.
The use of calibration curves with substrate simulation in conjunction with an internal standard has significantly contributed to minimizing errors in calculations. Slight matrix effect (ME) values (Figure 2) were observed ranging between −20% and 20%. The Limits of Detection (LODs) and Limits of Quantification (LOQs) determined as signal to noise (S/N) ratio 3 and 10 respectively, ranged from 0.2 ng L−1 to 7.5 ng L−1 and 0.5 ng L−1 to 25 ng L−1, respectively (Table 3). Overall, the method presented similar or better performance characteristics to previous SPE-LC–MS/MS methods for the determination of other pesticide compounds in seawater [15].

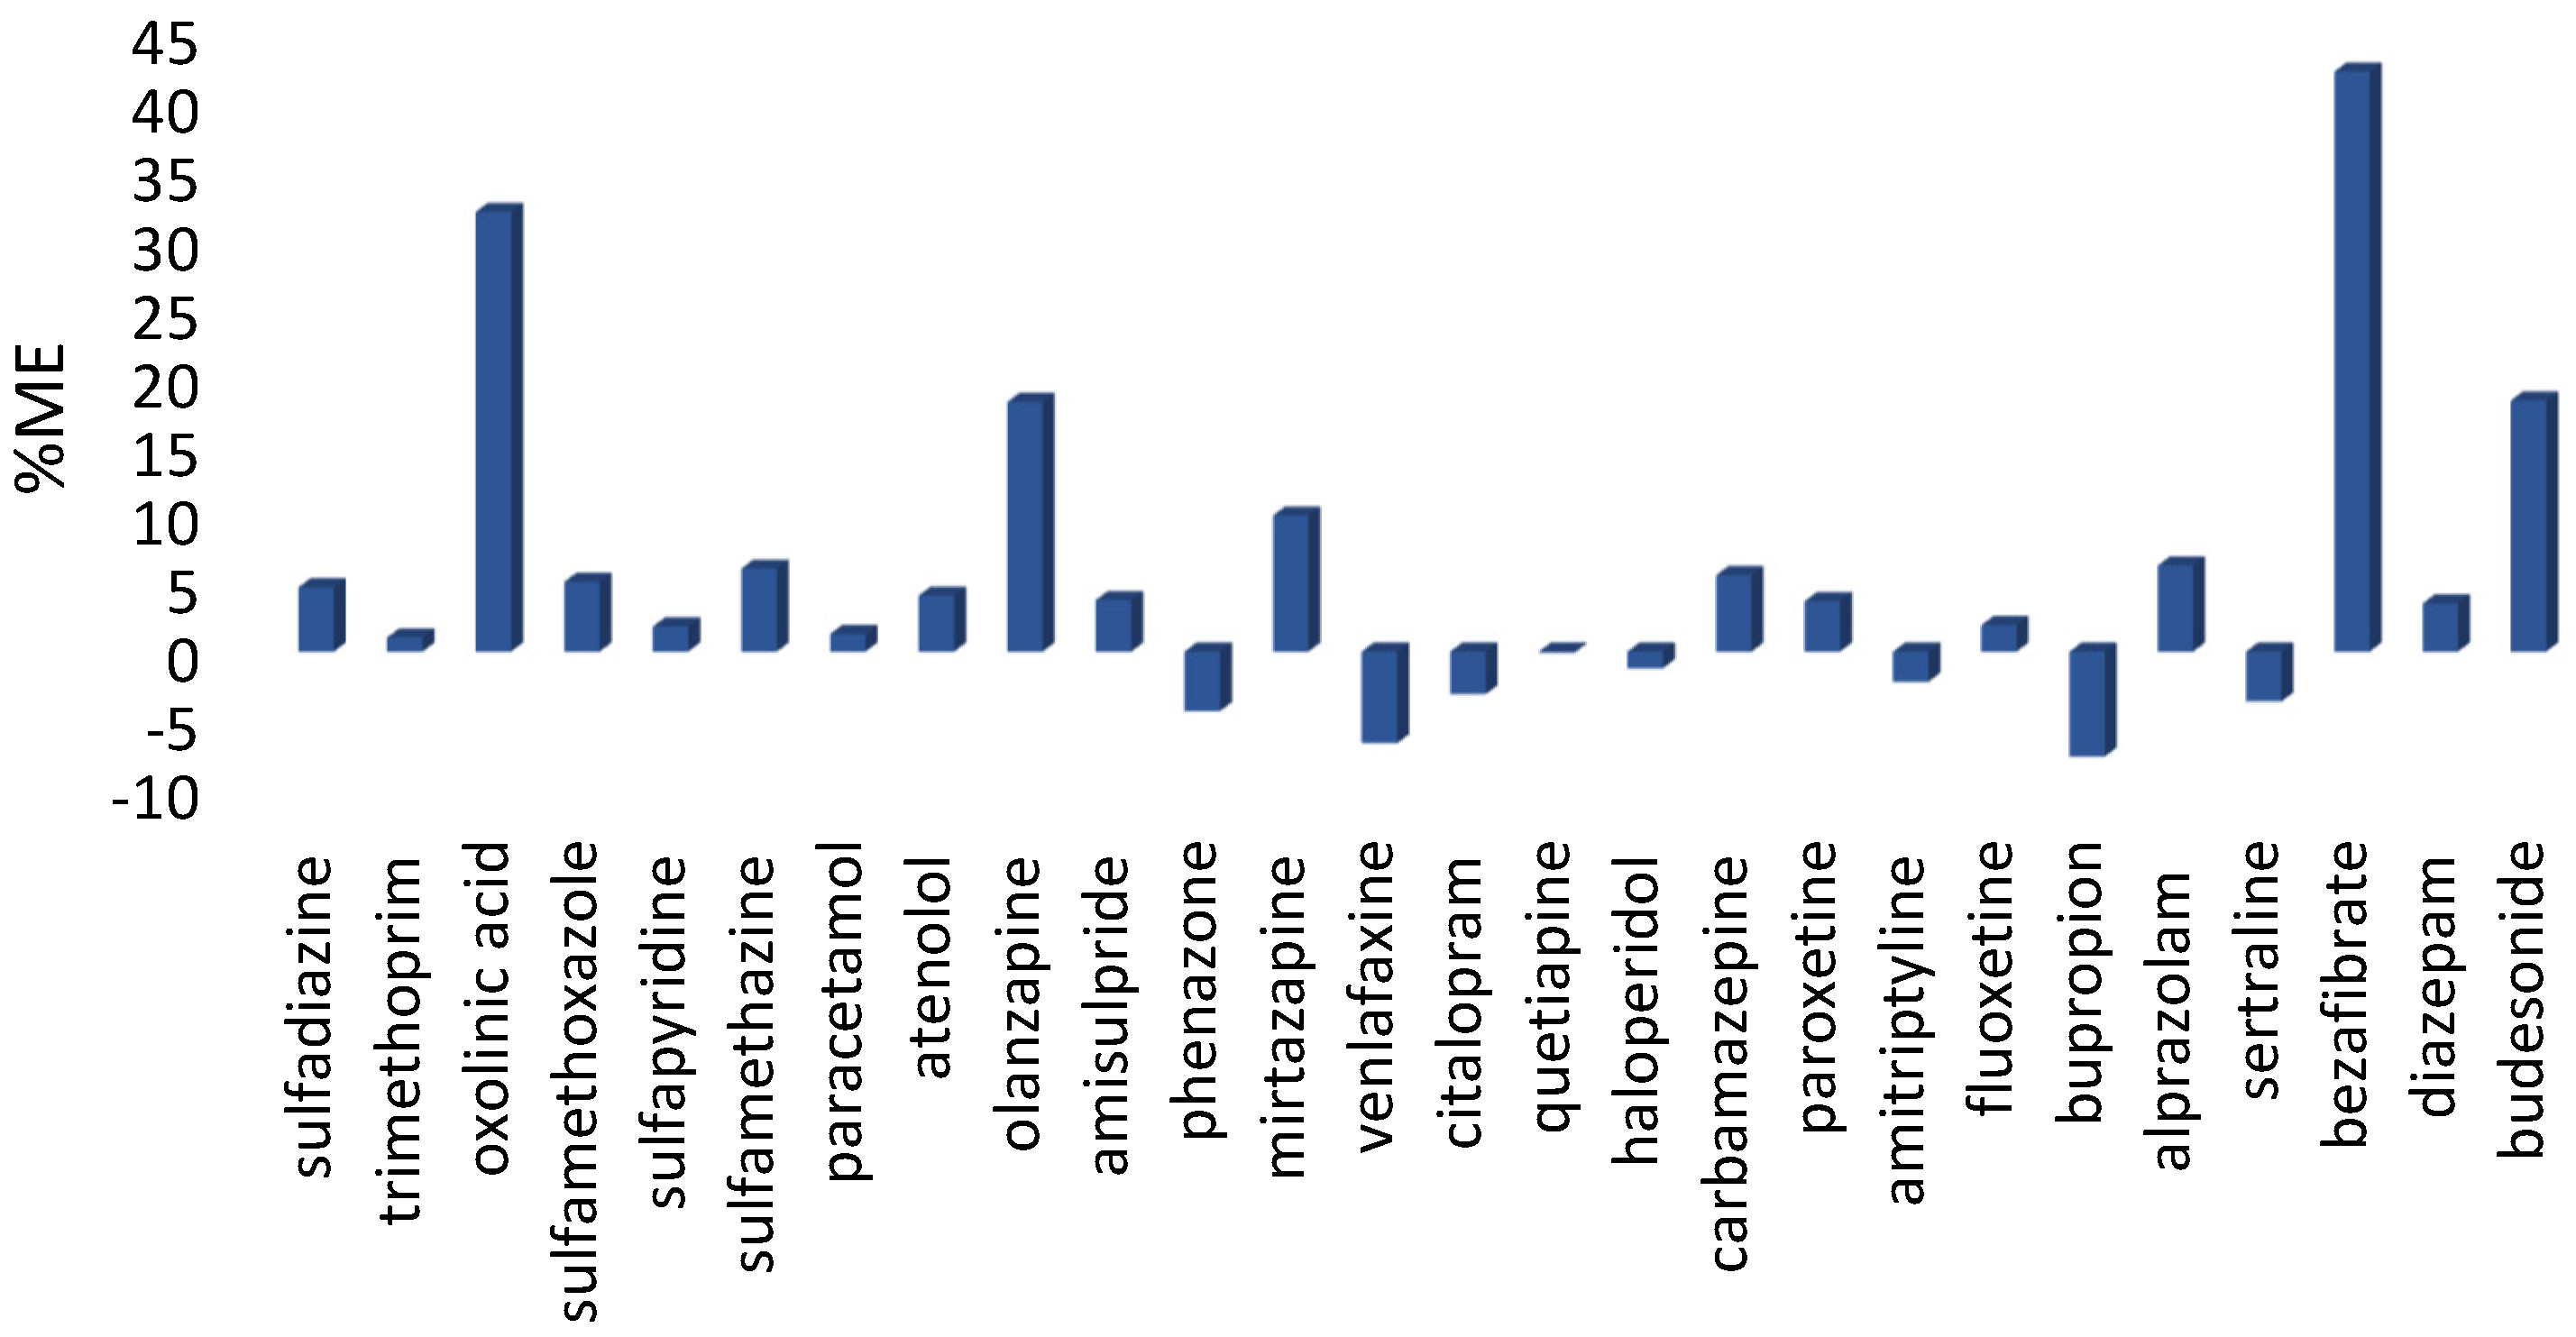
3.2. Optimization and Validation of SPE Method for the Determination of Pharmaceuticals

The optimization of the extraction recovery of pharmaceutical compounds from seawater was based on three different protocols (Table S1). The recoveries ranged from 77 to 143% for “HLB3” protocol, from 62 to 110% for “HLB4” protocol while in the “HLB5” protocol they ranged from 23 to 116% (Figure 3). Therefore, “HLB4” protocol was chosen because all the compounds gave acceptable recovery values as well as the RSD values were within acceptable limits (0–20%). In addition, “HLB4” recoveries are among the higher reported ranges while the whole procedure combines specific conditions (acidification and addition of Na2EDTA) that improve the extraction performance [40].
For the pharmaceutical compounds, validation procedure was also performed at three concentration levels. Mean recovery values (n = 5) at low level (25 ng L−1) ranged from 52.3% (bupropion) to 128% (diazepam), at intermediate level (100 ng L−1 ranged from 65.6% (sertraline) up to 99.6% (sulfadiazine) and at the high level (250 ng L−1) from 47.0% (bupropion) to 128.7% (olanzapine), as shown in Table 4. The repeatability of the method (RSDr) for the low level was less than 14.1% for all compounds, less than 15.8% for the medium level and less than 19.2% for the high level. The intermediate precision (RSDIP) of the method was below 18.2%. It is worth mentioning that the maximum acceptable limit (20%) was not exceeded by any of the pharmaceutical compounds. The linearity of the method was checked by constructing a nine-point curve in fortified samples for a concentration range of LOQ-100LOQ. The determination coefficient (r2) values were always greater than 0.99, thus indicating excellent linearity for the method. As far as matrix effect, most pharmaceutical compounds showed values between 0 and 20% and only in two cases, i.e., oxolinic acid and bezafibrate presented greater ME but lower than 50% (Figure 4). The washing step with deionized water after the extraction is critical in order to reduced matrix effects of seawater samples in ESI as also denoted previously [41]. The detection and quantification limits for pharmaceutical compounds ranged from 0.5 ng L−1 to 10 ng L−1 and 2 ng L−1 to 30 ng L−1, respectively (Table 5). The low limits of the method indicate that the pre-concentration factor is sufficient to quantify the compounds even in traces.

3.3. Application to Real Samples

After the optimization and validation of the SPE method for the determination of pesticides and pharmaceutical compounds, the method was applied in real samples of seawater collected during a ten-month sampling campaign in an aquaculture farm in the Ionian Sea. None of the selected pesticides were detected in the water samples in contrast to pharmaceutical compounds among which paracetamol compound was detected (Figure 5) during the months of December and January in concentrations of 94.0 and 27.4 ng L−1, respectively. Paracetamol is among the compounds previously detected in marine environments.
Passive sampling was conducted twice within the studied period and among drugs, trimethoprim and sulfadiazine were detected at low ppt levels. Passive sampling was not conducted in the months that paracetamol was detected with grab sampling. The concentrations of the detected pharmaceutical compounds were calculated based on literature data for Rs. For this reason, the minimum and maximum value of Rs, found in literature, were taken into account, as shown in Table 6. As a result, the concentration levels ranged from 0.24–1.14 ng L−1 for trimethoprim and 0.91–10.42 ng L−1 for sulfadiazine depending on the Rs values. Trimethoprim and sulfadiazine were also detected in marine studies, where they were found at concentration levels ranging between 0.02 and 95.8 ng L−1 for trimethoprim and 0.207–5.69 ng L−1 for sulfadiazine [42,43]. In the previous study a PNEC value of 16 μg L−1 was proposed for trimethoprim while the minimum EC50 for sulfadiazine was 0.11 mg L−1, as reported elsewhere [44]. As a result, the detected pharmaceutical concentrations are considered to pose insignificant risk. Among pesticides, Irgarol 1051 was detected at 0.26–0.81 ng L−1 only in September (Figure 6). Trimethoprim is a diaminopyrimidine antimicrobial agent used in veterinary medicine. It is commonly used in combination with a sulphonamide (such as sulfadiazine) in a concentration ratio of 1:5. On the other hand, Irgarol–1051 is a booster biocide that has been used to prevent biofouling on submerged surfaces such as boats, navigational buoys, underwater equipment and ships in marine environment. Irgarol was also detected in the study of Muñoz et al., 2010, at 0.36 ng L−1 [41] while in Köck-Schulmeyer et al., 2019 study [15], Irgarol was detected in higher levels with a median concentration of 20.2 ng L−1. Annual average and maximum allowable concentration environmental quality standard (EQS) for Irgarol in the marine environment was proposed as 2.5 and 16 ng L−1 [45], respectively; thus, the detected concentration levels pose no considerable risk for the aquaculture environment.

4. Conclusions

In the present study, SPE methods have been developed and validated for the multiresidue determination of pesticides and pharmaceuticals in seawater samples, as selected for their frequent application as well as their occurrence in the environment and in fish farming ecosystems. The suitability of the optimized method for the determination of the selected compounds in seawater was confirmed by the determined performance characteristics (accuracy, repeatability, intermediate precision, linearity LODs-LOQs). The developed analytical methodologies were applied to real samples from aquaculture in the Ionian Sea area with a 10-month monitoring study program (July 2020–April 2021). Regarding pesticide compounds and their detection in seawater, none of them was detected. As far as pharmaceuticals are concerned, only paracetamol was detected twice at concentration levels below 94 ng L−1. At the same time, seawater quality control screening based on passive sampling was carried out. Among pesticides, Irgarol 1051 was detected at 0.26–0.81 only in one case, and among pharmaceuticals, trimethoprim and sulfadiazine were detected at 0.26 to 10.4 ng L−1 levels.
Passive sampling can be used successfully for screening purposes in the quality control of emerging contaminants in sea water at low levels due to its integrative nature, although environmental conditions influence the sampling rates and consequently the measured concentrations, indicating that further work is needed in order to improve performance. On the other hand, grab sampling combined with a validated SPE method provides reliable quantitative results, but the time intervals between samplings may lead to misinterpretation of actual environmental concentration levels due to the loss of pollution events detection.
The extensive use of the target analytes and consequently their dispersion in seawater, especially waters hosting aquaculture facilities, illustrates the need for their continuous monitoring in the aquatic environment and relevant organisms. Spot and passive sampling techniques can be used complementarily for the screening and quantitative determination of contaminant levels and potential risks to aquatic environments; however, further improvements such as site-specific sampling rates and frequency are needed in order to maximize their significance in aquatic monitoring.

Supplementary Materials

The following supporting information can be downloaded at: https://www.mdpi.com/article/10.3390/su14063452/s1, Figure S1: Sampling location; Table S1: Solid phase extraction protocols tested for pesticides and pharmaceutical compounds efficient removal from waters; Table S2: Detection parameters for full MS/dd-MS2 analysis of pesticides; Table S3: Detection parameters for full MS/dd-MS2 analysis of pharmaceuticals.

Author Contributions

Conceptualization, D.H., V.B. and I.K.; methodology, V.B. and I.K.; validation, P.M. (Panagiota Martinaiou) and V.B.; formal analysis, P.M. (Panagiota Martinaiou), V.B., P.M. (Panagiota Manoli); investigation, P.M. (Panagiota Martinaiou) and V.B.; resources, T.A. and I.K.; data curation, P.M. (Panagiota Martinaiou), V.B. and E.M.; writing—original draft preparation, P.M. (Panagiota Manoli), D.H., I.K.; writing—review and editing, D.H., V.B. and I.K.; visualization, P.M. (Panagiota Manoli) and V.B.; supervision, T.A., D.H.; project administration, V.B.; funding acquisition, T.A. and I.K. All authors have read and agreed to the published version of the manuscript.

Funding

This research was funded by Environmental Aquatic Management (ENVIAQUAMAN) project, grant number HΠ1AΒ-00270 which is co-financed by the European Regional Development Fund (ERDF) under the Operational Program «Epirus 2014–2020», NRSF 2014–2020.

Institutional Review Board Statement

Not applicable.

Informed Consent Statement

Not applicable.

Data Availability Statement

The data are contained within the article and the supporting information file.

Acknowledgments

The authors acknowledge the support of this work by the project « Environmental Aquatic Management» (ENVIAQUAMAN (grant number HΠ1AΒ-00270)) which is co-financed by the European Regional Development Fund (ERDF) under the Operational Program «Epirus 2014–2020», NRSF 2014–2020. The authors would like to thank the Unit of Environmental, Organic and Biochemical high-resolution analysis–Orbitrap-LC–MS of the University of Ioannina for providing access to the facilities.

Conflicts of Interest

The authors declare no conflict of interest.

References

  1. Hernando, M.D.; Martínez-Bueno, M.J.; Fernández-Alba, A.R. Seawater Quality Control of Microcontaminants in Fish Farm Cage Systems: Application of Passive Sampling Devices. Bol. Inst. Esp. Oceanogr. 2005, 21, 37–46. [Google Scholar]
  2. European Commission. Directive 2008/56/EC, Official Journal of the European Union, L 164/19, 25.6.2008. 2008. Available online: https://eur-lex.europa.eu/LexUriServ/LexUriServ.do?uri=OJ:L:2008:164:0019:0040:EN:PDF (accessed on 31 January 2021).
  3. Batt, A.L.; Furlong, E.T.; Mash, H.E.; Glassmeyer, S.T.; Kolpin, D.W. The Importance of Quality Control in Validating Concentrations of Contaminants of Emerging Concern in Source and Treated Drinking Water Samples. Sci. Total Environ. 2017, 579, 1618–1628. [Google Scholar] [CrossRef] [PubMed] [Green Version]
  4. Caldas, S.S.; Bolzan, C.M.; Guilherme, J.R.; Silveira, M.A.K.; Escarrone, A.L.V.; Primel, E.G. Determination of Pharmaceuticals, Personal Care Products, and Pesticides in Surface and Treated Waters: Method Development and Survey. Environ. Sci. Pollut. Res. 2013, 20, 5855–5863. [Google Scholar] [CrossRef] [PubMed]
  5. Stuart, M.; Lapworth, D.; Crane, E.; Hart, A. Review of Risk from Potential Emerging Contaminants in UK Groundwater. Sci. Total Environ. 2012, 416, 1–21. [Google Scholar] [CrossRef] [Green Version]
  6. Vergeynst, L.; Haeck, A.; De Wispelaere, P.; Van Langenhove, H.; Demeestere, K. Multi-Residue Analysis of Pharmaceuticals in Wastewater by Liquid Chromatography–Magnetic Sector Mass Spectrometry: Method Quality Assessment and Application in a Belgian Case Study. Chemosphere 2015, 119, S2–S8. [Google Scholar] [CrossRef]
  7. Vanryckeghem, F.; Huysman, S.; Van Langenhove, H.; Vanhaecke, L.; Demeestere, K. Multi-Residue Quantification and Screening of Emerging Organic Micropollutants in the Belgian Part of the North Sea by Use of Speedisk Extraction and Q-Orbitrap HRMS. Mar. Pollut. Bull. 2019, 142, 350–360. [Google Scholar] [CrossRef]
  8. Belmonte Vega, A.; Garrido Frenich, A.; Martínez Vidal, J.L. Monitoring of Pesticides in Agricultural Water and Soil Samples from Andalusia by Liquid Chromatography Coupled to Mass Spectrometry. Anal. Chim. Acta 2005, 538, 117–127. [Google Scholar] [CrossRef]
  9. Larson, S.J.; Capel, P.D.; Goolsby, D.A.; Zaugg, S.D.; Sandstrom, M.W. Relations between Pesticide Use and Riverine Flux in the Mississippi River Basin. Chemosphere 1995, 31, 3305–3321. [Google Scholar] [CrossRef]
  10. Schulz, R. Rainfall-Induced Sediment and Pesticide Input from Orchards into the Lourens River, Western Cape, South Africa: Importance of a Single Event. Water Res. 2001, 35, 1869–1876. [Google Scholar] [CrossRef]
  11. Kearney, P.; Wauchope, R. Disposal Options Based on Properties of Pesticides in Soil and Water. In Pesticide Remediation in Soils and Water, 1st ed.; Kearney, P., Roberts, T., Eds.; John Wiley & Sons: Hoboken, NJ, USA, 1998. [Google Scholar]
  12. Flores, C.; Morgante, V.; González, M.; Navia, R.; Seeger, M. Adsorption Studies of the Herbicide Simazine in Agricultural Soils of the Aconcagua Valley, Central Chile. Chemosphere 2009, 74, 1544–1549. [Google Scholar] [CrossRef]
  13. Kalogridi, E.-C.; Christophoridis, C.; Bizani, E.; Drimaropoulou, G.; Fytianos, K. Part I: Temporal and Spatial Distribution of Multiclass Pesticide Residues in Lake Waters of Northern Greece: Application of an Optimized SPE-UPLC-MS/MS Pretreatment and Analytical Method. Environ. Sci. Pollut. Res. 2014, 21, 7239–7251. [Google Scholar] [CrossRef]
  14. Casado, J.; Santillo, D.; Johnston, P. Multi-Residue Analysis of Pesticides in Surface Water by Liquid Chromatography Quadrupole-Orbitrap High Resolution Tandem Mass Spectrometry. Anal. Chim. Acta 2018, 1024, 1–17. [Google Scholar] [CrossRef]
  15. Köck-Schulmeyer, M.; Postigo, C.; Farré, M.; Barceló, D.; López de Alda, M. Medium to Highly Polar Pesticides in Seawater: Analysis and Fate in Coastal Areas of Catalonia (NE Spain). Chemosphere 2019, 215, 515–523. [Google Scholar] [CrossRef]
  16. Gros, M.; Petrović, M.; Barceló, D. Wastewater treatment plants as a pathway for aquatic contamination by pharmaceuticals in the Ebro river basis (Northeast Spain). Environ. Toxicol. Chem. 2007, 26, 1553. [Google Scholar] [CrossRef]
  17. López-Pacheco, I.Y.; Silva-Núñez, A.; Salinas-Salazar, C.; Arévalo-Gallegos, A.; Lizarazo-Holguin, L.A.; Barceló, D.; Iqbal, H.M.N.; Parra-Saldívar, R. Anthropogenic Contaminants of High Concern: Existence in Water Resources and Their Adverse Effects. Sci. Total Environ. 2019, 690, 1068–1088. [Google Scholar] [CrossRef]
  18. Rivera-Utrilla, J.; Sánchez-Polo, M.; Ferro-García, M.Á.; Prados-Joya, G.; Ocampo-Pérez, R. Pharmaceuticals as Emerging Contaminants and Their Removal from Water. A Review. Chemosphere 2013, 93, 1268–1287. [Google Scholar] [CrossRef]
  19. Liu, H.-H.; Wong, C.S.; Zeng, E.Y. Recognizing the Limitations of Performance Reference Compound (PRC)-Calibration Technique in Passive Water Sampling. Environ. Sci. Technol. 2013, 47, 10104–10105. [Google Scholar] [CrossRef]
  20. Boxall, A.B.A.; Rudd, M.A.; Brooks, B.W.; Caldwell, D.J.; Choi, K.; Hickmann, S.; Innes, E.; Ostapyk, K.; Staveley, J.P.; Verslycke, T.; et al. Pharmaceuticals and Personal Care Products in the Environment: What Are the Big Questions? Environ. Health Perspect. 2012, 120, 1221–1229. [Google Scholar] [CrossRef]
  21. Hass, U.; Duennbier, U.; Massmann, G. Occurrence and Distribution of Psychoactive Compounds and Their Metabolites in the Urban Water Cycle of Berlin (Germany). Water Res. 2012, 46, 6013–6022. [Google Scholar] [CrossRef]
  22. Fono, L.J.; Kolodziej, E.P.; Sedlak, D.L. Attenuation of Wastewater-Derived Contaminants in an Effluent-Dominated River. Environ. Sci. Technol. 2006, 40, 7257–7262. [Google Scholar] [CrossRef]
  23. Li, Y.; Yao, C.; Zha, D.; Yang, W.; Lu, G. Selection of Performance Reference Compound (PRC) for Passive Sampling of Pharmaceutical Residues in an Effluent Dominated River. Chemosphere 2018, 211, 884–892. [Google Scholar] [CrossRef]
  24. Zhang, R.; Du, J.; Dong, X.; Huang, Y.; Xie, H.; Chen, J.; Li, X.; Kadokami, K. Occurrence and Ecological Risks of 156 Pharmaceuticals and 296 Pesticides in Seawater from Mariculture Areas of Northeast China. Sci. Total Environ. 2021, 792, 148375. [Google Scholar] [CrossRef]
  25. Lai, W.W.-P.; Lin, Y.-C.; Wang, Y.-H.; Guo, Y.L.; Lin, A.Y.-C. Occurrence of Emerging Contaminants in Aquaculture Waters: Cross-Contamination between Aquaculture Systems and Surrounding Waters. Water. Air. Soil Pollut. 2018, 229, 249. [Google Scholar] [CrossRef]
  26. Xie, H.; Hao, H.; Xu, N.; Liang, X.; Gao, D.; Xu, Y.; Gao, Y.; Tao, H.; Wong, M. Pharmaceuticals and Personal Care Products in Water, Sediments, Aquatic Organisms, and Fish Feeds in the Pearl River Delta: Occurrence, Distribution, Potential Sources, and Health Risk Assessment. Sci. Total Environ. 2019, 659, 230–239. [Google Scholar] [CrossRef]
  27. Ismail, N.A.H.; Wee, S.Y.; Kamarulzaman, N.H.; Aris, A.Z. Quantification of Multi-Classes of Endocrine-Disrupting Compounds in Estuarine Water. Environ. Pollut. 2019, 249, 1019–1028. [Google Scholar] [CrossRef]
  28. Togola, A.; Budzinski, H. Development of Polar Organic Integrative Samplers for Analysis of Pharmaceuticals in Aquatic Systems. Anal. Chem. 2007, 79, 6734–6741. [Google Scholar] [CrossRef]
  29. Martinezbueno, M.; Hernando, M.; Aguera, A.; Fernandezalba, A. Application of Passive Sampling Devices for Screening of Micro-Pollutants in Marine Aquaculture Using LC–MS/MS. Talanta 2009, 77, 1518–1527. [Google Scholar] [CrossRef]
  30. Valenzuela, E.F.; Menezes, H.C.; Cardeal, Z.L. Passive and Grab Sampling Methods to Assess Pesticide Residues in Water. A Review. Environ. Chem. Lett. 2020, 18, 1019–1048. [Google Scholar] [CrossRef]
  31. Miège, C.; Mazzella, N.; Allan, I.; Dulio, V.; Smedes, F.; Tixier, C.; Vermeirssen, E.; Brant, J.; O’Toole, S.; Budzinski, H.; et al. Position paper on passive sampling techniques for the monitoring of contaminants in the aquatic environment—Achievements to date and perspectives. Trends Environ. Anal. Chem. 2015, 8, 20–26. [Google Scholar] [CrossRef] [Green Version]
  32. Nannou, C.I.; Kosma, C.I.; Albanis, T.A. Albanis. Occurrence of pharmaceuticals in surface waters: Analytical method development and environmental risk assessment. Int. J. Environ. Anal. Chem. 2015, 95, 1242–1262. [Google Scholar] [CrossRef]
  33. Papadakis, E.N.; Tsaboula, A.; Vryzas, Z.; Kotopoulou, A.; Kintzikoglou, K.; Papadopoulou-Mourkidou, E. Pesticides in the rivers and streams of two river basins in northern Greece. Sci. Total Environ. 2018, 624, 732–743. [Google Scholar] [CrossRef] [PubMed]
  34. Lambropoulou, D.; Hela, D.; Koltsakidou, A.; Konstantinou, I. Overview of the Pesticide Residues in Greek Rivers: Occurrence and Environmental Risk Assessment. In The Rivers of Greece. The Handbook of Environmental Chemistry; Skoulikidis, N., Dimitriou, E., Karaouzas, I., Eds.; Springer: Berlin/Heidelberg, Germany, 2015; Volume 59. [Google Scholar] [CrossRef]
  35. Nannou, C. Modern Analytical Methods for the Determination of Pesticide and Pharmaceutical Residues in Natural Waters and Sediments. Ph.D. Thesis, Department of Chemistry, University of Ioannina, Ioannina, Greece, 2018. [Google Scholar]
  36. European Commission. SANTE/12682/2019, Guidance Document on Analytical Quality Control and Method Validation Procedures for Pesticide Residues and Analysis in Food and Feed. 2019. Available online: https://www.eurl-pesticides.eu/userfiles/file/EurlALL/AqcGuidance_SANTE_2019_12682.pdf (accessed on 30 January 2021).
  37. Alvarez, D.A.; Petty, J.D.; Huckins, J.N.; Jones-Lepp, T.L.; Getting, D.T.; Goddard, J.P.; Manahan, S.E. development of a passive, in situ, integrative sampler for hydrophilic organic contaminants in aquatic environments. Environ. Toxicol. Chem. 2004, 23, 1640. [Google Scholar] [CrossRef] [PubMed] [Green Version]
  38. Thomatou, A.A.; Zacharias, I.; Hela, D.; Konstantinou, I. Passive sampling of selected pesticides in aquatic environment using polar oragnic chemical integrative samplers. Environ. Sci. Pollut. Res. 2011, 18, 1222–1233. [Google Scholar] [CrossRef] [PubMed]
  39. Vrana, B.; Urík, J.; Fedorova, G.; Švecová, H.; Grabicová, K.; Golovko, O.; Randák, T.; Grabic, R. In Situ Calibration of Polar Organic Chemical Integrative Sampler (POCIS) for Monitoring of Pharmaceuticals in Surface Waters. Environ. Pollut. 2021, 269, 116121. [Google Scholar] [CrossRef]
  40. Sadutto, D.; Pico, Y. Sample Preparation to Determine Pharmaceutical and Personal Care Products in an All-Water Matrix: Solid Phase Extraction. Molecules 2020, 25, 5204. [Google Scholar] [CrossRef]
  41. Wu, J.; Qian, X.; Yang, Z.; Zhang, L. Study on the matrix effect in the determination of selected pharmaceutical residues in seawater by solid-phase extraction and ultra-high-performance liquid chromatography–electrospray ionization low-energy collision-induced dissociation tandem mass spectrometry. J. Chromatogr. A 2010, 1217, 1471–1475. [Google Scholar]
  42. Muñoz, I.; Martínez Bueno, M.J.; Agüera, A.; Fernández-Alba, A.R. Environmental and Human Health Risk Assessment of Organic Micro-Pollutants Occurring in a Spanish Marine Fish Farm. Environ. Pollut. 2010, 158, 1809–1816. [Google Scholar] [CrossRef]
  43. Ojemaye, C.Y.; Petrik, L. Pharmaceuticals in the marine environment: A review. Environ. Rev. 2019, 27, 151–165. [Google Scholar] [CrossRef]
  44. Carballeira, C.; De Orte, M.R.; Viana, I.G.; DelValls, T.A.; Carballeira, A. Assessing the toxicity of chemical compounds associated with land-based marine fish farms: The sea urchin embryo bioassay with Paracentrotus lividus and Arbacia lixula. Arch. Environ. Contam. Toxicol. 2012, 63, 249–261. [Google Scholar] [CrossRef]
  45. EU. Cybutryne EQS Dossier 2011 Prepared by the Sub-Group on Review of the Priority Substances List (under Working Group E of the Common Implementation Strategy for the Water Framework Directive). 2011. Available online: https://circabc.europa.eu/sd/d/1eb5aa3b-bf6c-48ca-8ce0-00488a0c2905/Cybutryne%20EQS%20%20dossier%202011.pdf (accessed on 30 January 2011).
Figure 1. Recoveries (%) of pesticides by applying HLB1 and HLB2 extraction protocols.
Sustainability 14 03452 g001
Figure 2. Matrix effect (%ME) for the studied pesticides.
Sustainability 14 03452 g002
Figure 3. Recoveries (%) of pharmaceutical compounds by applying three extraction protocols.
Sustainability 14 03452 g003
Figure 4. Matrix effect (%ME) for the studied pharmaceuticals.
Sustainability 14 03452 g004
Figure 5. Full scan spectrum of paracetamol.
Sustainability 14 03452 g005
Figure 6. LC-LTQ/Orbitrap MS Extracted Ion Chromatogram (EIC) of seawater passive sampling.
Sustainability 14 03452 g006
Table 1. Physicochemical characteristics of seawater samples.
ParametersMinMaxAverageSD
Temperature (°C)14.917.515.90.82
TDS (mg L−1)77,00091,00085,5424496.3
Conductivity (mS cm−1)45.650.547.81.97
Salinity (‰)35.341.238.91.98
pH6.57.56.80.4
Table 2. Recovery, repeatability and intermediate precision results of the optimized solid-phase extraction method for the determination of pesticide residues.
Compound25 ng L−1100 ng L−1250 ng L−1
(%) RRSDr (%)(%) RRSDr (%)RSDIP (%)(%) RRSDr (%)
Azamethipos80.510.479.94.05.270.67.9
Azoxystrobin72.313.883.68.411.459.70.7
Boscalid68.37.870.25.27.069.619.5
Irgarol68.28.069.110.62.574.75.4
Malathion81.42.995.05.47.778.317.6
Pirimiphos-methyl98.94.982.02.99.477.28.8
Tebufenozide58.51.261.97.18.358.614.7
Table 3. Detection and quantification limits, linear range of the method and determination coefficient (R2) for the studied pesticides.
CompoundLOD
(ng L−1)
LOQ
(ng L−1)
Linear RangeR2
Azamethipos7.525LOQ-5000.9994
Azoxystrobin0.31LOQ-5000.9992
Boscalid0.51.5LOQ-5000.9996
Irgarol0.20.5LOQ-5000.9998
Malathion0.51.5LOQ-5000.9992
Pirimiphos-methyl0.52LOQ-7500.9996
Tebufenozide310LOQ-5000.9993
Table 4. Validation results of the analytical extraction method for pharmaceuticals.
Compound25 ng L−1100 ng L−1250 ng L−1
(%) RRSDr (%)(%) RRSDr (%)RSDIP (%)(%) RRSDr (%)
Oxolinic acid105.612.280.815.87.2118.32.1
Sulfadiazine99.67.915.5111.213.3
Sulfamethazine91.98.110.373.23.5
Sulfamethoxazole90.79.26.7113.57.1
Sulfapyridine88.88.798.111.318.2118.83.1
Trimethoprim61.69.878.49.09.595.40.1
Paracetamol76.53.57.382.80.8
Alprazolam105.110.794.27.56.281.65.4
Amisulpride83.74.089.84.73.681.45.4
Amitriptyline98.12.194.45.22.599.51.3
Bupropion52.314.171.53.59.747.05.9
Carbamazepine107.22.087.05.24.292.12.2
Citalopram94.45.279.36.96.696.46.8
Diazepam128.09.493.65.612.394.60.2
Fluoxetine103.23.689.03.93.995.14.1
Haloperidol96.04.287.44.65.6100.55.4
Mirtazapine113.37.582.26.510.1119.03.6
Olanzapine112.39.886.14.64.0128.70.4
Paroxetine104.04.379.69.67.3118.819.2
Quetiapine109.97.492.57.96.6111.712.0
Sertraline97.311.165.610.311.7103.77.9
Venlafaxine60.01.376.85.811.759.91.3
Bezafibrate89.612.479.615.713.5122.56.3
Atenolol58.75.585.49.28.852.12.9
Budesonide118.01.789.57.65.3116.03.4
Table 5. Detection and quantification limits, linear range and determination coefficient (R2) for the studied pharmaceuticals.
CompoundLOD (ng L−1)LOQ (ng L−1)Linear RangeR2
Oxolinic acid1.55LOQ-5000.9992
Sulfadiazine1030LOQ-7500.9998
Sulfamethazine1030LOQ-7500.9990
Sulfamethoxazole1030LOQ-5000.9986
Sulfapyridine7.525LOQ-7500.9997
Trimethoprim0.52LOQ-5000.9996
Paracetamol512.5LOQ-7500.9999
Alprazolam1.55LOQ-2500.9991
Amisulpride1.55LOQ-2500.9997
Amitriptyline0.52LOQ-2500.9998
Bupropion310LOQ-2500.9998
Carbamazepine0.52LOQ-2500.9997
Citalopram1.55LOQ-2500.9997
Diazepam0.52LOQ-1000.9980
Fluoxetine1.55LOQ-2500.9994
Haloperidol512.5LOQ-2501.000
Mirtazapine7.525LOQ-2500.9991
Olanzapine0.52LOQ-2500.9993
Paroxetine7.525LOQ-7501.000
Quetiapine0.52LOQ-2500.9984
Sertraline1.55LOQ-2500.9993
Venlafaxine1.55LOQ-2500.9998
Bezafibrate7.525LOQ-7500.9994
Atenolol1.55LOQ-5000.9984
Budesonide310LOQ-5000.9992
Table 6. Concentration range of the detected compounds based on passive sampling.
CompoundRs (L d−1) aCwater (ng L−1)
minmax
Trimethoprim0.0900.4360.24–1.14
Sulfadiazine0.0160.1840.91–10.42
Irgarol0.0410.1290.26–0.81
a Range of literature RS values [23,39].
Publisher’s Note: MDPI stays neutral with regard to jurisdictional claims in published maps and institutional affiliations.

