1. Introduction
The sustainable supply chain requires a broadened approach to the supply chain [
1]. A sustainable supply chain network is defined as a network of services that carries out the roles of sourcing raw materials, transforming these materials into finished items or products, as well as distributing them to customers or end users, while preserving the environment and achieving additional long-term financial benefits. The notion of the sustainable supply chain exists in both production and service organizations. Sustainability in the supply chain is a key component of corporate sustainability, with a focus on three aspects of sustainable development: environmental protection, economic growth, and social equity [
2]. The sustainable supply chain is one of 14 key supply chain trends [
3]. Sustainable supply chain risk management (SSCRM) is a decisive management issue in both public and private sector organizations. For many organizations, a deficient SSCRM can be a source of heavy financial losses or even bankruptcy. Thus, organizations should be familiar with the regular management of small disruptions and are required to urgently reorganize themselves to satisfy their customers [
4,
5,
6,
7,
8].
To maintain productivity, organizations must be able to respond quickly to inner and exterior risk occurrences while keeping their units operative and effective. Furthermore, SSCM must be adaptable to unexpected misfortunes. Specifically, one must have a thorough understanding of sustainable supply chain risks and how to manage them. Risk analysis is always prone to ambiguity and imprecision. Any study that ignores this imprecision and ambiguity leads to a major information discrepancy and, as a result, substantial errors. Risk analysis involves risk identification and then evaluation. Risk identification is a procedure of investigating, recognizing, and reporting the origins of risks, impact, potential measures, causes, and effects. In a sustainable supply chain, every stakeholder or link has its own responsibilities and limitations and can easily anticipate the associated risks. Thus, risk identification provides information about possible risks and hindrances that can affect the supply chain operation in the long-run. Risk evaluation is a next step that provides a framework for comparing risks and prioritizes them according to their importance, frequency of occurrence, and affect. Risk evaluation is used to determine risk’s importance or value within the supply chain. Numerous techniques are available for risk evaluation, among which multi-criteria decision-making (MCDM) techniques are found to be very effective. The combination of fuzzy sets with decision management has been proven to be very effective to handle the uncertainty combined with risk measurement. Numerous studies have shown that fuzzy-based MCDM techniques have received a great deal of research interest. The most often-used approaches for this type of problem are fuzzy analytic network process (ANP) and fuzzy analytical hierarchy process (AHP). However, fuzzy AHP is frequently used for the determination of criterion weights, necessitating the employment of an MCDM technique that takes the conflicting aspects into account directly. Fuzzy TOPSIS is another renowned approach, but it lacks consistency and reliability checks. The VlseKriterijumska Optimizacija I Kompromisno Resenje (VIKOR) method is another well-known method that ranks the alternatives according to priority and provides a compromised response closer to the ideal response. However, no distinct rules for weight selection exist in this method.
In this work, the logistics sector of Pakistan is selected for the study. We have selected four Pakistani logistics organizations, among which two are from the public sector and the other two are private sector organizations. There are two reasons for this selection. To begin with, the logistics industry plays a substantial role in the country’s economy, accounting for 10% of the GDP and around 18% of the gross capital. Second, the present transportation and logistics sector lacks the necessary infrastructure to support the China–Pakistan Economic Corridor (CPEC), which is projected to develop significantly in the coming years. As a result, the logistics and transportation sectors will form the backbone of China’s commerce with the rest of the world via Pakistan. Several public and private firms are now active in the trade, with business predicted to increase by two to three times in the coming 5 years.
This work is aimed to evaluate sustainable supply chain risks using a novel fuzzy VIKOR–CRITIC approach. The work has the following research contributions:
First, this is the first attempt to combine the fuzzy VIKOR method with the criteria importance through inter-criteria correlation (CRITIC) method to overcome the shortcomings of the VIKOR method.
Second, this is the first study, to the best of the authors’ knowledge, that has considered the supply chain risk management of the logistics sector of Pakistan.
The rest of the paper is structured as follows: the theoretical background and state of the art are presented in
Section 2. The risks identified for this study are presented in
Section 3, followed by the research framework in
Section 4. The proposed method is described in
Section 5. The results and discussion are presented in
Section 6. Finally, the study is concluded in
Section 7.
2. Theoretical Background
2.1. Sustainable Supply Chain Risk Identification
Supply chain risks (SCR) are associated with disturbances and disruptions in the network connecting commodities, information, and capital. These are also associated with public and official networks, which may have a negative impact on the achievement of specific corporate objectives, as well as the supply chain as a whole, while harming the customer in terms of expenditures, time, and quality [
9]. The literature study has revealed that sustainable supply chain risks are categorized in various ways according to different researchers. Chopra & Sodhi [
10] have compared recurring risks, such as late delivery from a supplier or fluctuating demand, which can normally be covered by a good SSCM practice, to the risks of disruption or interruption, which force the organization to resort to resilience strategies. However, some authors disagreed with the concept that a good SSCM practice can avoid risks and have emphasized that risks are inevitable. Norrman & Lindroth [
11] have categorized sustainable supply chain risks as operational accidents and operational disasters. They have also introduced the concept of “strategic uncertainties”, which may have an impact on the organization at the strategic level. This could be, for example, volatility in demand, supplier failure, or a change in technology.
Sustainable supply chain risks are also distinguished as “supply risks”, which are risks associated with the upstream part of the logistics chain, and “demand risks”, which group together the risks associated with demand. Some authors have added a third category of risks, operational risks, that affect the organization’s production process, and even a fourth, security risks. These are due to, for example, theft, damage, and crime or sabotage [
12]. Besides supply and demand risks, a handful of literature has also introduced the notion of external risks of the supply chain. Kleindorfer & Saad [
13] have distinguished between risks linked to supply and demand (supply risks and demand risks) and other risks linked in particular to natural disasters. These “external risks” to the supply chain are less studied than the other types of risk in the risk management literature in the supply chain [
14].
Some authors have not used the terminology of “external risks” but rather introduced a distinction between the events related to the internal and “normal” functioning of the supply chain and the external events outside this functionality. For example, the risks related to the coordination of the upstream (supply) and downstream (demand) parts of the logistics chain form the same category. Singh & A. Wahid [
15] have used the following classification for supply chain risks:
- i.
Avoidable risks, such as human error;
- ii.
Strategic risks, taken voluntarily by managers in the organization’s interest;
- iii.
External risks that are beyond the control of management.
Nakanu & Lau [
16] have distinguished between internal and external supply chain risks in a more precise way, given as under:
- i.
Internal risks: risks linked to design, purchasing, and supply process, failures of the manufacturing process, vulnerabilities of the distribution process, such as lack of flexibility, human resource risks, such as lack of training or the loss of skills, and the risks related to the IT systems;
- ii.
External risks: risks associated with demand management and outsourcing. Environmental, regulatory, fiscal, and climatic risks are classified in the category of external risks.
Kırılmaz & Erol [
17] have further divided external risks into sub-categories according to the collaboration between logistics chain elements. According to them:
- i.
Internal risks to the organization result from strategic decisions taken by management or the production or operation reliability;
- ii.
External risks (inside the supply chain) surface from the relationships between the organization and its partners within the supply chain, mainly with suppliers and consumers. Here, we divide the classification into “supply risk” and “demand risk”;
- iii.
External risks (outside of the supply chain) surface from the interactions of the supply chain with its non-productive environment. They can be caused by accidents, climatic disturbances, legislation, or war.
2.2. Sustainable Supply Chain Risk Management (SSCRM)
SSCRM is the strategic and operational management of sustainable supply chain risks. These risks can interrupt, if not completely obstruct, the effective and efficient flow of information, raw materials, and products from the supplier to the company’s client. According to Jüttner [
18], SSCRM is the act of detecting and managing sustainable supply chain risks through a collaborative network of stakeholders in order to reduce the supply chain’s overall vulnerability. SSCRM, as described by Kouvelis et al. [
19], is the management of demand, supply, and cost uncertainty. SSCRM is defined by Carter and Rogers as “the company’s capacity to understand and regulate its supply chain’s financial, environmental, and social risks, which may be avoided via the use of interdependent planning and management” [
20]. Managing risks would thus include developing a solid framework within which managers could develop skills that would allow them to foresee unplanned outcomes. According to Rice and Caniato, supply chain resilience is an organization’s capacity “to adapt to an unforeseen disruption and retain its operations following the occurrence” [
21]. This resilience may be achieved within enterprises by leveraging strong flexibility and adequate redundancy. According to Christopher and Peck, it is the system’s capacity to cope with the changing state or advance toward a better, more desirable one after being disrupted [
22]. SSCRM is, therefore, defined as the risk management of the company’s own internal logistics chain, avoiding external participants (especially upstream and downstream partners). Tang [
23] defines SSCRM as “the management of SCR through association or interaction between chain participants in order to assure productivity and endurance,” which is also relevant to this study. This definition illustrates two SSCRM viewpoints that may be examined for the proposed study’s analysis: the first is restricted to a single company (considered standalone), and the second is to evaluate the relationships between industrial partners. As a result, the SSCRM is studied here from the standpoint of risk management in the global supply chain.
2.3. Multi-Criteria Decision-Making (MCDM) in SSCRM
Numerous models for SSCRM have been proposed in the last two decades based on MCDM approaches [
24,
25,
26,
27,
28]. Wu et al. [
29] established a system for the ranked categorization of risk variables in incoming supply using the AHP. Even though the research does not give explicit advice on how to create risk mitigation strategies, it does focus on how risk assessment approaches are used in different situations. However, a collective decision-making environment is not taken into account. To analyze SSCR, Su [
30] utilized a hybrid fuzzy decision-making technique using ANP and VIKOR. The SSCRs were recognized and a risk index categorization structure was constructed. Risk weights were determined and then incorporated into the FVIKOR using FANP to discover the riskiest contributor and graded the participants. Wang et al. [
31] suggested a risk assessment model that allowed for a systematic assessment of the aggregative risk of incorporating green SCM in the fashion industry. The aggregative risk index (ARI) was calculated using fuzzy AHP. An approach for estimating supply risk for a product was developed by Ganguly and Guin [
32]. It was accomplished using FAHP. The method was used to identify supply-related risks and their possible effect on the purchasing organization. The suggested model is straightforward and adaptable, and it could be used by experts. FAHP was utilized by Mangla et al. [
33] to prioritize hazards in GSC. Dong & Cooper [
34] suggested an orders-of-magnitude AHP (OM-AHP)-driven ex-ante SCR assessment model to make comparisons of the extrinsic and intrinsic variables that impact SCR. More recently, Rostamzadeh et al. [
35] have proposed a combined fuzzy TOPSIS–CRITIC method to evaluate SSCRM for the oil industry.
3. Risk Identification for Logistics Sector of Pakistan
The process of examining, recognizing, and documenting the sources of risk, their effects, causes, consequences, and potential measures is known as risk identification. The ultimate objective is to make a list of potential risks. The risk identification can make use of classical methods, for example, archival records, literature reviews, experts’ opinions, brainstorming, etc. As discussed in
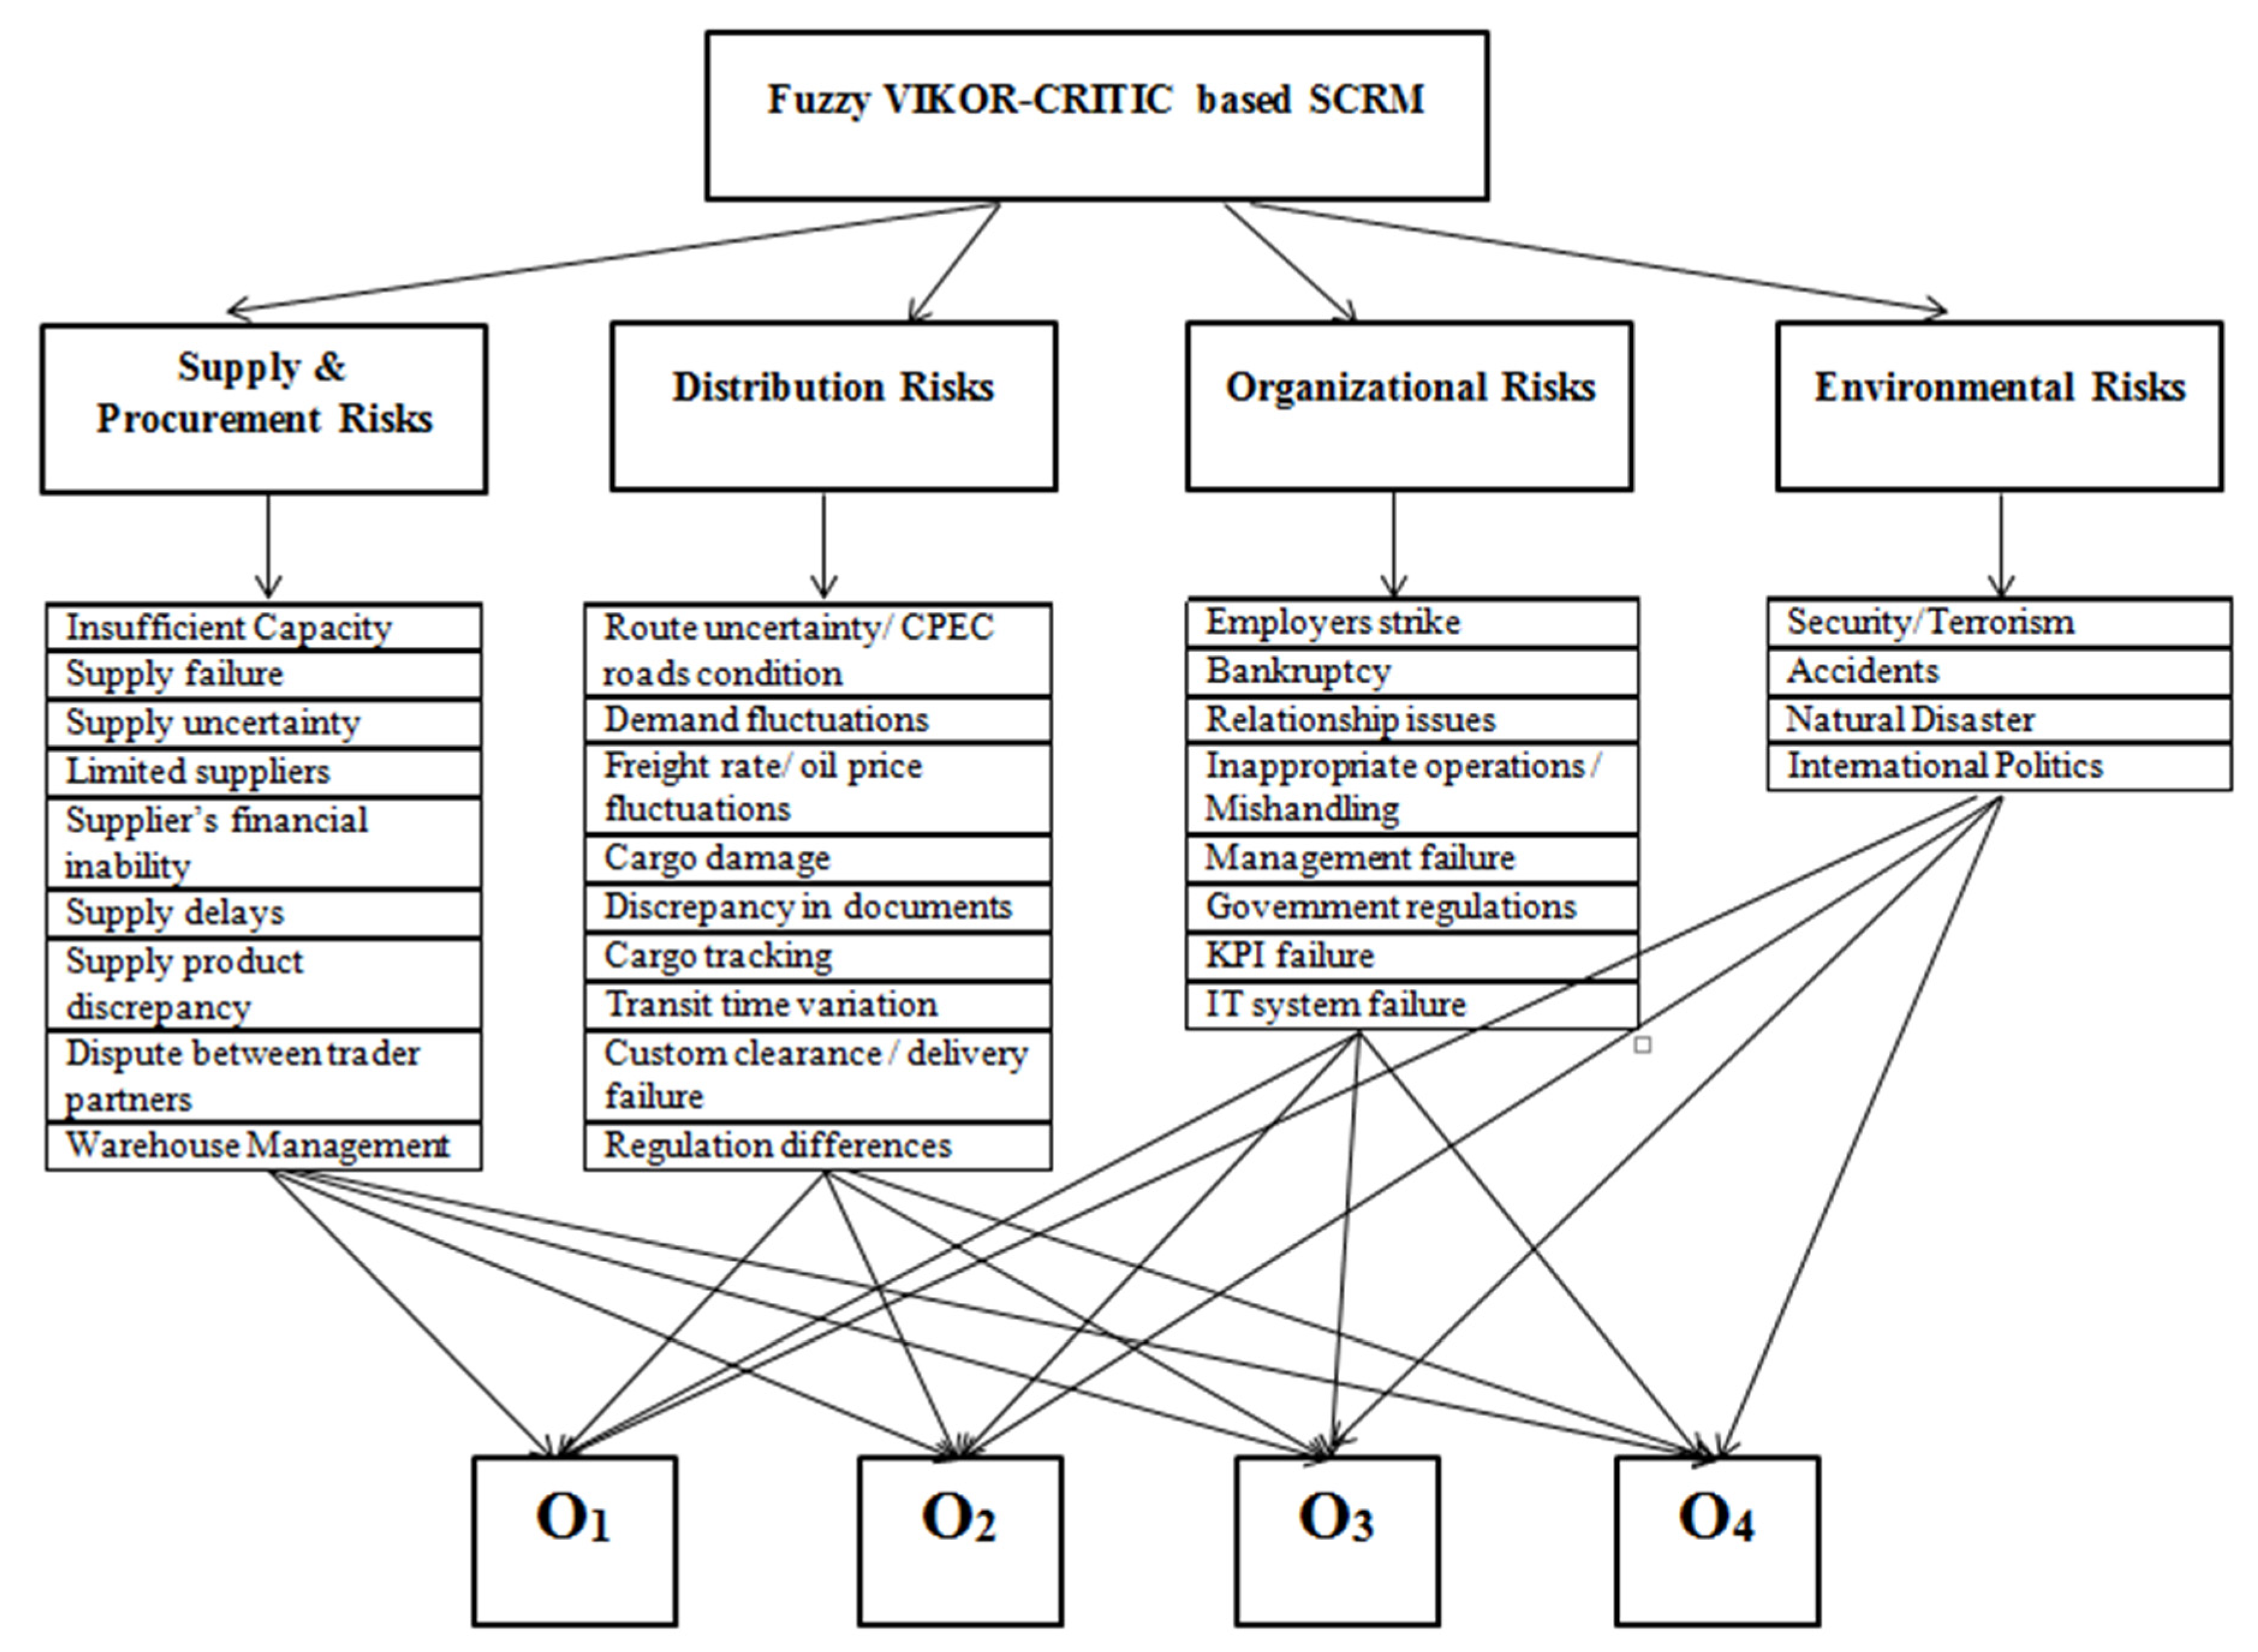
Section 2, there is no formal categorization of sustainable supply chain risks. The sustainable supply chain risks identified in the literature are according to specific organizations or environments. In addition, some researchers, rather than categorization of internal and external risks, have highlighted sources of risk for the supply chain. This categorization is more intuitive as it further helps in risk prioritization and then risk mitigation and management. For this study, risks are divided into four groups, i.e., supply and procurement risks, distribution risks, organizational risks, and environmental risks. The risks are further divided into sub-categories, as described below.
3.1. Supply and Procurement Risks
Supply and procurement risks are defined as the probability of incidents associated with the upstream link of the logistics chain. These risks can arise due to supplier or market failure. These risks lead to the inability of the business to meet the customers’ needs and may become a threat to the customers’ safety and lives. Supply risk is also defined as the sudden unavailability of supply due to an unforeseen event that affects the source of the supply. Disruption in supply and procurement may also occur when any activity of the supply chain, i.e., production, storage, distribution, installation, or transport, is disturbed due to some incident or disaster [
33,
36]. The following risks are identified as supply and procurement risks: insufficient capacity (R11), supply failure (R12), supply uncertainty (R13), limited suppliers (R14), supplier’s financial inability (R15), supply delays (R16), supply product discrepancy (R17), dispute between trader partners (R18), and warehouse management (R19).
3.2. Distribution Risks
Transporting finished products to the markets and end users is acknowledged to be one of the most difficult tasks for logistics organizations. The significance of distribution channel selection lies in that the organization must stick to them for a long period and remain dedicated to them. The distribution should be performed so that the product supply may be made available when the products are needed. It should also work with other elements of the marketing plan, such as the promotion and pricing. The term “distribution” refers to all of the operations that come about between customers, retailers, and manufacturers. The distribution process starts with the order placement, packing, and then shipping to the customer. Uncertain costs provide a significant risk in distribution systems, particularly those that span the world. The increase in the gasoline cost, as well as ongoing fluctuations, may cut profit margins and have a significant impact on pricing. The risks identified in this category are: route uncertainty/CPEC roads condition (R21), demand fluctuations (R22), freight rate/oil price fluctuations (R23), cargo damage (R24), discrepancy in documents (R25), cargo tracking (R26), transit time variation (R27), custom clearance/delivery failure (R28), and regulation differences (R29).
3.3. Organizational Risks
Organizational risks are defined as risks related to the organizational procedures, policies, and culture. These risks can severely affect the logistics operation and require a high level of attention and relevant response. These risks arise mainly due to poor management. The management failure can have a great impact on the performance and reputation of the logistics organization. Management failure is also a cause of other risks associated with employees, such as employee strike, employee–management relationship issues, and inappropriate operations and mishandling. Another risk in this regard is KPI failure. KPIs are common performance indicators that are present profoundly in organizations’ procedures. Operating with weak KPIs raises not just the danger of failure but also endangers the chance of success. Financial instability of the organization is another big risk that can lead to ceasing the operation if it leads to bankruptcy. Similarly, variations in government regulations also affect the logistics operations. Another important risk is failure of the IT system, which can be caused by virus, cyber-attack, or machine failure. The following organizational risks are identified in this work: employers strike (R31), bankruptcy (R32), relationship issues (R33), inappropriate operations/mishandling (R34), management failure (R35), government regulations (R36), KPI failure (R37), and IT system failure (R38).
3.4. Environmental Risks
Environmental risks are defined as consequences of natural and unwanted events that have an adverse impact on organizations’ operation. Environmental risks are inevitable in logistics operation. These risks are present in various forms and can affect logistics operations in different ways. Natural disasters and severe weather conditions are the main environmental risks that are a great hindrance to the usual logistics operations. This is because flood, storm, land sliding, and severe cold weather may cause the logistics operator to halt operation. For example, due to extreme poor weather, the China–Pakistan border is closed from December 1 to March 31 every year. Terrorism is another risk that can interrupt a smooth logistics operation. The other important risk in the category is security requirements, which can prevent logistics operations for some time on special occasions. Another similar risk is international politics, which can cause political instability, war threat, and unfavorable conditions for reliable logistics operation. The environmental risks evaluated in this study are: security/terrorism (R41), accidents (R42), natural disaster (R43), and international politics (R44).
4. Research Framework
The research is aimed to identify and evaluate the SSCRM of Pakistan’s public and private sector logistics companies. The logistics sector has a significant contribution in the economy of Pakistan, with a contribution of 10% in GDP. Furthermore, the inception of the CPEC has resulted in enormous investments in infrastructure and logistics, and its revenue and contribution to the economy are expected to double within a few years. Considering this importance, this study has selected the largest public and private sector companies. Due to confidentiality clauses, the organizations are denoted as O1, O2, O3, and O4. The data were collected through websites and interviews with officials involved in supply chain management. Based on the collected data, interviews, and literature review, four main criteria (risk categories) and 30 sub-criteria (risks) were selected for evaluation and risk prioritization. The research problem formulation is shown in
Figure 1.
5. Methods
5.1. Fuzzy Sets
Fuzzy logic was proposed by Zadeh [
37] to model the imprecision linked to human knowledge. It has since been used in many fields, such as AI, signal processing, robotics, image processing, etc. MCDM methods integrated in fuzzy environment have also been very effective. Some basic concepts of fuzzy sets are described below:
Definition 1. A fuzzy subsetbelonging to a classical set
with subset x is described by a membership function such that:
The membership function provides the degree to which each element ofbelongs to the fuzzy subset .
Definition 2. If a fuzzy number is a normalized fuzzy subset (i.e., such that ) of a higher semi-continuous membership function (i.e., for any levelε, the set ofx of such that is closed), it is denoted as and is also bounded (i.e., .
Definition 3. A trapezoidal fuzzy number can be represented by a quadruplet (a, b, c, d). It is characterized by a membership functiondefined as follows:
Definition 4. A triangular fuzzy number is a trapezoidal number for which the lower modal value is equal to the upper modal value. A modal value ofis an element x such that .
A triangular fuzzy number is represented by a triplet (a, b, c) denoting the lower bound, the modal value, and the upper bound of the fuzzy set, respectively.
Definition 5. The minimum and maximum operations of two triangular fuzzy numbersand are as follows:
The membership function provides the degree to which each element belongs to the fuzzy subset. Here shows MIN operator and shows MAX operator.
5.2. Fuzzy-Based VIKOR–CRITIC Method
In this work, fuzzy-based VIKOR–CRITIC method is proposed for risk evaluation of logistics sector of Pakistan. The VIKOR method has been successfully employed to solve conflicting and un-measurable criteria and decision problems [
38]. This technique emphasizes ranking and choosing among a large number of alternatives and enables decision-makers to determine compromise solutions to the problem by evaluating conflicting criteria that they will use in reaching the final decision. The value close to 0 is marked as best alternative and close to 1 as worst alternative. However, this method lacks proper weight selection. In the proposed method, we have incorporated fuzzy CRITIC approach for weight calculation along with subjective weight selection by decision-makers. In the proposed method, the value closest to 0 represents the last alternative, while the alternative with the largest value is determined as the most optimal choice. The proposed method is described as below:
Step A-1-Construction of fuzzy decision matrix: The fuzzy decision matrix is created by means of the alternatives, criteria, and data to be used in the evaluation. Let
denote the decision matrix with
n rows (alternatives) and
m columns (criteria). Fuzzy linguistic variables are selected and then used by each decision-maker to assign a value to each alternative according to the criteria.
Step A-2-Construction of subjective criteria weight matrix: In this step, decision-makers’ assign subjective weights to each criterion. The subjective weight matrix is given as:
where
and
K shows total number of decision-makers.
Step A-3-Construction of fuzzy weight matrix: The fuzzy weight matrix is constructed using aggregation
of subjective criteria weight matrix
and fuzzy CRITIC matrix (
Section 5.3). The fuzzy weight matrix is given as
Step A-4-De-fuzzification of decision and weight matrices: In this step, fuzzy decision and weight matrices are de-fuzzified and converted to a matrix of crisp values, as shown below, where n show rows and m shows column:
Step A-5-Calculation of best and worst criterion functions: The best criteria (
) and worst criteria (
) values are calculated for each criterion. If the effect of criterion is beneficial, then these values are given as
If effect of criterion is non-beneficial, then these values are given as
Step A-6-Construction of normalized decision matrix: Linear normalization is applied to make the decision metric data comparable, and matrix is converted to
R normalized matrix. The elements
of the normalized matrix
R are calculated as
Step A-7-Calculation of
Si and
Ri values:
Si values are considered as best values, while
Ri values are considered as worst values. These values are calculated as
Step A-8-Calculation of
Qi values: These values are calculated as
where
value expresses the strategy weight that provides the maximum group benefit, while
expresses the minimum regret. Moreover,
Step A-9-Ranking of alternatives: The rank of alternative is determined by arranging values of S, R, and Q in ascending order. The best alternative has minimum Q value and the worst alternative has maximum Q value, while satisfying the following two stability conditions:
Condition-I: where
Condition-II: The alternative must also be of higher rank with respect to S and/or R.
If stability conditions are not met, then alternative ranking is also accepted as compromised solution.
5.3. Fuzzy CRITIC Weight Calculation
The fuzzy CRITIC weight calculation is described as below:
Step 2-Normalization of decision matrix: Each element in the decision matrix is normalized as follows:
Step B-2-Fuzzy CRITIC weight matrix calculation: The fuzzy CRITIC weight matrix is calculated as follows:
where
,
shows the standard deviation of each element and
shows the linear correlation coefficient between elements.
6. Results
In this work, we have selected four logistics organizations of Pakistan to evaluate the supply chain risks. The novel technique is employed to solve the evaluation problem with the following steps:
Step 1: The organizations are denoted as O1, O2, O3, and O4. Four decision-makers from the respective organizations have used their skills for risk evaluation, denoted as D1, D2, D3, and D4. There are 30 criteria in total, arranged in four groups as CR-A1 to CR-A9, CR-B1 to CR-B9, CR-C1 to CR-C8, and CR-D1 to CR-D4.
Step 2: The linguistic variables used by the decision-makers are converted into fuzzy variables and are shown in
Table 1.
Step 3: The subjective weights selected for each criterion by the decision-makers are shown in
Table 2.
Step 4: The ratings of the alternatives by the decision-makers are shown in
Table 3. The fuzzy weight matrix using fuzzy subjective weights and fuzzy CRITIC weight is then calculated using Equations (7), (14) and (15), as shown in
Table 4.
Step 5: The fuzzy values are then de-fuzzified into crisp values and presented in
Table 5.
Step 6: From
Table 5, the best and worst values of all the criteria are determined using Equations (9) and (10) and are shown in
Table 6.
Step 7:
Si and
Ri values are then calculated using Equations (11) and (12) and are presented in
Table 7.
Step 8:
Qi values for all the alternatives are calculated using Equation (13) and are presented in
Table 7 as well in a descending order.
Step 9: Finally, the risk evaluation, i.e., ranking of all the criteria, is presented in
Table 8.
The proposed method offers many advantages over the traditional VIKOR method:
It encompasses the fuzzy CRITIC method for weight selection, so weights are fixed. It is worth mentioning that, in the traditional VIKOR method, if the weights are selected arbitrarily, then the ranking changes for every new iteration.
The stability conditions are not guaranteed to be fulfilled with the traditional VIKOR method.
The results show that organizational risks are known as the most important risks for the logistics sector. Afterward, supply and procurement risks, distribution risks, and environmental risks are ranked from higher to lower risks.
Table 1.
Linguistic variables for decision-makers.
Table 1.
Linguistic variables for decision-makers.
| Linguistic Scale for Impact | Triangular Fuzzy MSF | Decision-Maker’s Criteria |
|---|
| Very Small (VS) | (0, 0, 0.25) | Very Poor (VP) |
| Small (S) | (0, 0.25, 0.5) | Poor (P) |
| Medium (M) | (0.25, 0.5, 0.75) | Fair (F) |
| Large (L) | (0.5, 0.75, 1) | Good (G) |
| Very Large (VL) | (0.75, 1, 1) | Very Good (VG) |
Table 2.
Weights of criteria by decision-makers.
Table 2.
Weights of criteria by decision-makers.
| Criteria | D1 | D2 | D3 | D4 | Criteria | D1 | D2 | D3 | D4 |
|---|
| CR-A1 | VS | VS | S | S | CR-B7 | S | S | M | M |
| CR-A2 | S | S | VS | VS | CR-B8 | S | S | M | M |
| CR-A3 | M | S | M | S | CR-B9 | S | M | M | M |
| CR-A4 | VS | VS | S | VS | CR-C1 | VS | VS | S | S |
| CR-A5 | VS | VS | VS | VS | CR-C2 | VS | VS | S | VS |
| CR-A6 | M | L | L | VL | CR-C3 | M | M | L | L |
| CR-A7 | S | S | S | M | CR-C4 | M | L | L | VL |
| CR-A8 | M | M | L | M | CR-C5 | S | S | S | M |
| CR-A9 | S | S | VS | S | CR-C6 | S | S | VS | S |
| CR-B1 | VS | VS | VS | S | CR-C7 | S | S | VS | M |
| CR-B2 | S | VS | VS | S | CR-C8 | S | M | M | L |
| CR-B3 | L | L | L | VL | CR-D1 | M | M | L | L |
| CR-B4 | VS | VS | VS | S | CR-D2 | M | L | M | L |
| CR-B5 | S | S | VS | S | CR-D3 | L | L | L | VL |
| CR-B6 | VS | VS | VS | S | CR-D4 | M | M | L | VL |
Table 3.
Ratings of criteria by decision-makers.
Table 3.
Ratings of criteria by decision-makers.
| Criteria | D1 | D2 | D3 | D4 |
|---|
| | O1 | O2 | O3 | O4 | O1 | O2 | O3 | O4 | O1 | O2 | O3 | O4 | O1 | O2 | O3 | O4 |
|---|
| CR-A1 | VS | S | VS | S | VS | VS | VS | VS | S | S | VS | VS | S | S | VS | VS |
| CR-A2 | S | S | VS | VS | S | S | M | M | VS | VS | S | S | VS | VS | VS | VS |
| CR-A3 | M | M | S | S | S | S | S | S | M | M | S | S | S | S | VS | S |
| CR-A4 | VS | VS | VS | VS | VS | VS | VS | VS | S | S | VS | VS | VS | VS | S | S |
| CR-A5 | VS | VS | VS | VS | VS | VS | VS | S | VS | S | VS | VS | VS | S | VS | VS |
| CR-A6 | M | M | M | L | L | L | VL | L | L | M | M | M | VL | L | M | L |
| CR-A7 | S | S | S | S | S | M | M | S | S | M | S | S | M | M | S | S |
| CR-A8 | M | M | L | M | M | S | S | S | L | M | S | S | M | M | S | VS |
| CR-A9 | S | S | VS | VS | S | S | VS | VS | VS | S | VS | VS | S | VS | VS | VS |
| CR-B1 | VS | VS | S | S | VS | S | S | S | VS | S | VS | VS | S | VS | VS | VS |
| CR-B2 | S | S | S | S | VS | VS | S | S | VS | S | VS | VS | S | S | VS | VS |
| CR-B3 | L | M | L | VL | L | M | L | VL | L | M | L | L | VL | VL | VL | VL |
| CR-B4 | VS | S | VS | VS | VS | S | VS | VS | VS | S | VS | VS | S | M | VS | VS |
| CR-B5 | S | M | VS | VS | S | S | VS | VS | VS | S | VS | VS | S | M | VS | VS |
| CR-B6 | VS | S | VS | VS | VS | S | VS | VS | VS | VS | VS | VS | S | VS | VS | S |
| CR-B7 | S | M | S | S | M | L | S | VS | M | M | VS | VS | M | L | VS | S |
| CR-B8 | S | S | M | M | S | S | M | S | M | M | S | S | M | S | S | M |
| CR-B9 | S | S | S | S | M | S | S | S | M | S | M | S | M | M | S | S |
| CR-C1 | VS | S | VS | VS | VS | M | VS | VS | S | L | VS | VS | S | M | VS | VS |
| CR-C2 | S | VS | S | S | S | VS | S | M | S | VS | S | S | S | VS | S | S |
| CR-C3 | M | M | S | S | M | L | S | S | L | M | S | S | L | M | VS | VS |
| CR-C4 | M | M | VS | VS | L | L | S | S | L | L | S | S | VL | L | VS | VS |
| CR-C5 | S | M | VS | VS | S | M | VS | VS | S | M | VS | VS | M | S | S | VS |
| CR-C6 | S | VS | VS | VS | S | S | S | VS | VS | VS | S | S | S | S | VS | VS |
| CR-C7 | S | S | S | S | S | VS | VS | S | VS | VS | S | S | S | S | S | S |
| CR-C8 | S | S | VS | VS | M | S | VS | VS | M | S | VS | VS | S | S | VS | VS |
| CR-D1 | M | M | S | S | M | M | S | S | L | M | S | S | L | M | S | S |
| CR-D2 | M | L | S | S | M | L | S | S | M | L | S | S | M | L | S | S |
| CR-D3 | L | L | VL | VL | L | VL | VL | L | L | VL | VL | L | VL | VL | L | VL |
| CR-D4 | M | M | S | S | M | L | S | S | L | S | S | M | M | M | S | L |
Table 4.
Fuzzy weights for criteria.
Table 4.
Fuzzy weights for criteria.
| Criteria | Fuzzy Weight | Criteria | Fuzzy Weight | Criteria | Fuzzy Weight | Criteria | Fuzzy Weight |
|---|
| CR-A1 | (0.031,0.12,0.21) | CR-A9 | (0.160,0.291,0.230) | CR-B8 | (0.413,0.574,0.617) | CR-C7 | (0.24,0.27,0.31) |
| CR-A2 | (0.14,0.18,0.21) | CR-B1 | (0.180,0.213,0.254) | CR-B9 | (0.281,0.328,0.373) | CR-C8 | (0.21,0.26,0.32) |
| CR-A3 | (0.241,0.248,0.331) | CR-B2 | (0.125,0.140,0.159) | CR-C1 | (0.275,0.341,0.361) | CR-D1 | (0.61,0.720,0.827) |
| CR-A4 | (0.018,0.22,0.25) | CR-B3 | (0.74,0.81,0.92) | CR-C2 | (0.298,0.310,0.385) | CR-D2 | (0.619,0.712,0.759) |
| CR-A5 | (0.11,0.14,0.16) | CR-B4 | (0.151,0.159,0.187) | CR-C3 | (0.576,0.617,0.762) | CR-D3 | (0.75,0.88,0.96) |
| CR-A6 | (0.68,0.74,0.80) | CR-B5 | (0.218,0.324,0.327) | CR-C4 | (0.619,0.741,0.856) | CR-D4 | (0.410,0.520,0.670) |
| CR-A7 | (0.371,0.470,0.532) | CR-B6 | (0.104, 0.11,0.130) | CR-C5 | (0.413,0.541,0.605) | | |
| CR-A8 | (0.561,0.713,0.80) | CR-B7 | (0.616,0.746,0.844) | CR-C6 | (0.17,0.26,0.33) | | |
Table 5.
Crisp values for decision and weight matrices.
Table 5.
Crisp values for decision and weight matrices.
| Criteria | O1 | O2 | O3 | O4 | Weight | Criteria | O1 | O2 | O3 | O4 | Weight |
|---|
| CR-A1 | 0.160 | 0.190 | 0.100 | 0.130 | 0.117 | CR-B7 | 0.408 | 0.601 | 0.160 | 0.160 | 0.745 |
| CR-A2 | 0.160 | 0.160 | 0.223 | 0.223 | 0.173 | CR-B8 | 0.345 | 0.283 | 0.345 | 0.345 | 0.574 |
| CR-A3 | 0.345 | 0.345 | 0.190 | 0.220 | 0.303 | CR-B9 | 0.408 | 0.283 | 0.283 | 0.220 | 0.348 |
| CR-A4 | 0.130 | 0.130 | 0.130 | 0.130 | 0.220 | CR-C1 | 0.160 | 0.473 | 0.100 | 0.100 | 0.329 |
| CR-A5 | 0.100 | 0.160 | 0.100 | 0.130 | 0.147 | CR-C2 | 0.220 | 0.100 | 0.220 | 0.283 | 0.342 |
| CR-A6 | 0.713 | 0.601 | 0.582 | 0.667 | 0.742 | CR-C3 | 0.601 | 0.536 | 0.190 | 0.190 | 0.679 |
| CR-A7 | 0.283 | 0.408 | 0.283 | 0.220 | 0.440 | CR-C4 | 0.713 | 0.667 | 0.160 | 0.160 | 0.739 |
| CR-A8 | 0.536 | 0.408 | 0.348 | 0.253 | 0.727 | CR-C5 | 0.283 | 0.408 | 0.130 | 0.100 | 0.517 |
| CR-A9 | 0.190 | 0.190 | 0.100 | 0.100 | 0.213 | CR-C6 | 0.190 | 0.160 | 0.160 | 0.130 | 0.271 |
| CR-B1 | 0.130 | 0.160 | 0.160 | 0.160 | 0.219 | CR-C7 | 0.190 | 0.160 | 0.190 | 0.220 | 0.284 |
| CR-B2 | 0.160 | 0.190 | 0.160 | 0.160 | 0.143 | CR-C8 | 0.345 | 0.220 | 0.100 | 0.100 | 0.272 |
| CR-B3 | 0.778 | 0.582 | 0.778 | 0.870 | 0.817 | CR-D1 | 0.601 | 0.470 | 0.220 | 0.220 | 0.738 |
| CR-B4 | 0.130 | 0.283 | 0.100 | 0.100 | 0.164 | CR-D2 | 0.470 | 0.732 | 0.220 | 0.220 | 0.750 |
| CR-B5 | 0.190 | 0.345 | 0.100 | 0.100 | 0.379 | CR-D3 | 0.778 | 0.870 | 0.870 | 0.824 | 0.841 |
| CR-B6 | 0.130 | 0.160 | 0.100 | 0.130 | 0.119 | CR-D4 | 0.536 | 0.473 | 0.220 | 0.411 | 0.530 |
Table 6.
The best and worst values of criteria.
Table 6.
The best and worst values of criteria.
| Supply & Procurement Risk | Distribution Risks | Organizational Risks | Environmental Risks |
|---|
| Criteria | | | Criteria | | | Criteria | | | Criteria | | |
|---|
| O1 | 0.13 | 0.778 | O1 | 0.1 | 0.713 | O1 | 0.16 | 0.713 | O1 | 0.47 | 0.778 |
| O2 | 0.16 | 0.601 | O2 | 0.13 | 0.601 | O2 | 0.1 | 0.667 | O2 | 0.47 | 0.87 |
| O3 | 0.1 | 0.778 | O3 | 0.1 | 0.582 | O3 | 0.1 | 0.22 | O3 | 0.22 | 0.87 |
| O4 | 0.1 | 0.87 | O4 | 0.1 | 0.667 | O4 | 0.1 | 0.283 | O4 | 0.22 | 0.824 |
Table 7.
Calculation of S, R, and Q values.
Table 7.
Calculation of S, R, and Q values.
| Criteria | S | R | Q | Criteria | S | R | Q |
|---|
| CR-A1 | 0.0451 | 0.022038 | 0.0320 | CR-B7 | 0.3220 | 0.1430 | 0.2028 |
| CR-A2 | 0.1475 | 0.077322 | 0.1917 | CR-B8 | 0.4599 | 0.2952 | 0.3486 |
| CR-A3 | 0.2288 | 0.07897 | 0.2460 | CR-B9 | 0.3799 | 0.2205 | 0.2724 |
| CR-A4 | 0.0362 | 0.018859 | 0.0209 | CR-C1 | 0.2249 | 0.2249 | 0.1080 |
| CR-A5 | 0.0226 | 0.01164 | 0 | CR-C2 | 1.4536 | 0.7390 | 1 |
| CR-A6 | 0.8130 | 0.303 | 1 | CR-C3 | 1.3980 | 0.5092 | 0.7954 |
| CR-A7 | 0.298 | 0.115039 | 0.3520 | CR-C4 | 1.2527 | 0.3420 | 0.6053 |
| CR-A8 | 0.4005 | 0.1559 | 0.4866 | CR-C5 | 0.4287 | 0.1857 | 0.1570 |
| CR-A9 | 0.0392 | 0.022038 | 0.0283 | CR-C6 | 0.5146 | 0.3395 | 0.3130 |
| CR-B1 | 0.0850 | 0.072301 | 0.0702 | CR-C7 | 1.0478 | 0.5092 | 0.6577 |
| CR-B2 | 0.1049 | 0.072301 | 0.0776 | CR-C8 | 0.1824 | 0.1100 | 0 |
| CR-B3 | 1.3368 | 0.817 | 1 | CR-D1 | 0.3138 | 0.3138 | 0.1086 |
| CR-B4 | 0.0398 | 0.039884 | 0.0332 | CR-D2 | 0.4912 | 0.4912 | 0.2751 |
| CR-B5 | 0.0802 | 0.059989 | 0.0608 | CR-D3 | 2.8590 | 0.8410 | 1 |
| CR-B6 | 0.0063 | 0.00639 | 0 | CR-D4 | 0.3313 | 0.1675 | 0.0034 |
Table 8.
Risk prioritization.
Table 8.
Risk prioritization.
| Main Criteria | Rank | Sub-Criteria | Rank |
|---|
| Supply & Procurement Risk | 2 | CR-A1 Insufficient Capacity | 6 |
| CR-A2 Supply failure | 5 |
| CR-A3 Supply uncertainty | 4 |
| CR-A4 Limited suppliers | 8 |
| CR-A5 Supplier’s financial inability | 9 |
| CR-A6 Supply delays | 1 |
| CR-A7 Supply product discrepancy | 3 |
| CR-A8 Dispute between trader partners | 2 |
| CR-A9 Warehouse Management | 7 |
| Distribution Risks | 3 | CR-B1 Route uncertainty/CPEC roads condition | 6 |
| CR-B2 Demand fluctuations | 5 |
| CR-B3 Freight rate/oil price fluctuations | 1 |
| CR-B4 Cargo damage | 8 |
| CR-B5 Discrepancy in documents | 7 |
| CR-B6 Cargo tracking | 9 |
| CR-B7 Transit time variation | 4 |
| CR-B8 Custom clearance/delivery failure | 2 |
| CR-B9 Regulation differences | 3 |
| Organizational Risks | 1 | CR-C1 Employers strike | 7 |
| CR-C2 Bankruptcy | 1 |
| CR-C3 Relationship issues | 2 |
| CR-C4 Inappropriate operations/Mishandling | 4 |
| CR-C5 Management failure | 6 |
| CR-C6 Government regulations | 5 |
| CR-C7 KPI failure | 3 |
| CR-C8 IT system failure | 8 |
| Environmental Risks | 4 | CR-D1 Security/Terrorism | 3 |
| CR-D2 Accidents | 2 |
| CR-D3 Natural Disaster | 1 |
| CR-D4 International Politics | 4 |
Discussion
The study proposed a novel fuzzy VIKOR–CRITIC-based approach to evaluate the SSCRM of Pakistan’s logistics sector. There are four primary categories and thirty sub-criteria in these categories. The results show that the most important risks to consider are organizational risks, whereas environmental risks are considered to have the least impact on the disruption of the supply chain. The four most important criteria in these groups are CR-A6 supply delays, CR-B3 freight rate/oil price fluctuations, CR-C2 bankruptcy, and CR-D3 natural disaster. The results seem more logical and also conform to the ground realities as supply delay is the major risk in local supply chains. Moreover, considering the unstable economic conditions of Pakistan and increase in the routine dollar price, it is hard to predict oil prices. Therefore, with the increase in oil prices, freight rates are also increased. Furthermore, bankruptcy has been the cause of many business closures in Pakistan. Finally, natural disaster is ranked higher in environmental risks, which is also true due to extreme weather conditions near the Pakistan–China border.
The four least important criteria in the four risk categories are CR-A4 limited suppliers, CR-B6 cargo tracking, CR-C8 IT system failure, and CR-D4 international politics. The results are also logical as there is no shortage of suppliers in Pakistan–China trade. Moreover, with redundant system practices and the use of the latest facilities, it is very rare to experience IT system failure or problems in cargo tracking. Finally, international politics is also the least important factor to consider in Pakistan–China trade.
The study has some limitations as it only considered the largest logistics companies of Pakistan. Therefore, it may limit the possible generalization and applicability of the study to small companies operating specifically in CPEC. The findings of this study offer inspiration for future research that can verify the findings on a large sample of companies or Chinese companies operating in CPEC. From the methodology point of view, future research can also focus on interval type-2 (IT2) fuzzy logic to incorporate uncertainty associated with various attributes.
7. Conclusions
Sustainable supply chain risk management is the strategic management for identifying and managing risks to reduce a supply chain’s vulnerability. It includes the development of a framework in which risk identification and evaluation are key steps. This work was aimed to evaluate supply chain risks for the logistics sector of Pakistan. For this purpose, a hybrid fuzzy-based MCDM technique has been proposed by combining the CRITIC and VIKOR methods. Four logistics organizations were selected for the study and thirty criteria classified in four groups were identified through the collected data and literature studies. The results show that organizational risks are the most critical risks to consider, whereas environmental risks are found to have the least impact. The four most important criteria in these groups are supply delays, freight rate/oil price fluctuations, bankruptcy, and natural disaster. The four least important criteria in the four risk categories are limited suppliers, cargo tracking, IT system failure, and international politics. The study is useful for practitioners and decision-makers working in Pakistani logistics organizations as a guideline for risk identification and management. The future research can focus on adding more attributes for risk evaluation and the use of IT2 fuzzy sets to incorporate uncertainty associated with these attributes.
Author Contributions
Conceptualization, F.u.A. and Q.-L.D.; methodology, F.u.A. and Q.-L.D.; validation, Q.-L.D. and K.G.; formal analysis, F.u.A., Z.A. and B.-R.Y.; resources, F.u.A., K.G. and Z.A.; writing—original draft preparation, F.u.A., Q.-L.D., K.G., Z.A. and B.-R.Y.; writing—review and editing, F.u.A.; funding acquisition, K.G. All authors have read and agreed to the published version of the manuscript.
Funding
This research was funded by POZNAN UNIVERSITY OF TECHNOLOGY, grant number 0812-SBAD-4170.
Institutional Review Board Statement
Not applicable.
Informed Consent Statement
Not applicable.
Data Availability Statement
Not applicable.
Conflicts of Interest
The authors declare no conflict of interest.
References
- Grzybowska, K. Supply Chain Sustainability—analysing the enablers. In Environmental Issues in Supply Chain Management—New Trends and Applications; Golinska, P., Romano, C.A., Eds.; Springer: Berlin, Germany, 2012; pp. 25–40. [Google Scholar]
- Cooper, M.C.; Lambert, D.M.; Pagh, J.D. Supply Chain Management: More Than a New Name for Logistics. Int. J. Logist. Manag. 1997, 8, 1–14. [Google Scholar] [CrossRef]
- Grzybowska, K. Identification and classification of global theoretical trends and supply chain development directions. Energies 2021, 14, 4414. [Google Scholar] [CrossRef]
- Fathi, M.R.; Nasrollahi, M.; Zamanian, A. Mathematical Modeling of Sustainable Supply Chain Networks under Uncertainty and Solving It Using Metaheuristic Algorithms. Ind. Manag. J. 2019, 11, 621–652. [Google Scholar] [CrossRef]
- Nasrollahi, M.; Fathi, M.R.; Hassani, N.S. Eco-innovation and cleaner production as sustainable competitive advantage antecedents: The mediating role of green performance. Int. J. Bus. Innov. Res. 2020, 22, 388–407. [Google Scholar] [CrossRef]
- Nasrollahi, M.; Fathi, M.R.; Sanouni, H.R.; Sobhani, S.M.; Behrooz, A. Impact of coercive and non-coercive environmental supply chain sustainability drivers on supply chain performance: Mediation role of monitoring and collaboration. Int. J. Sustain. Eng. 2021, 14, 98–106. [Google Scholar] [CrossRef]
- Mari, S.I.; Lee, Y.H.; Memon, M.S. Sustainable and resilient supply chain network design under disruption risks. Sustainability 2014, 6, 6666–6668. [Google Scholar] [CrossRef] [Green Version]
- Rha, J.S. Trends of research on supply chain resilience: A systematic review using network analysis. Sustainability 2020, 12, 4343. [Google Scholar] [CrossRef]
- Pfohl, H.C.; Köhler, H.; Thomas, D. State of the art in supply chain risk management research: Empirical and conceptual findings and a roadmap for the implementation in practice. Logist. Res. 2010, 2, 33–44. [Google Scholar] [CrossRef]
- Chopra, S.; Sodhi, M.S. Managing risk to avoid: Supply-chain breakdown. MIT Sloan Manag. Rev. 2004, 46, 53–61. [Google Scholar]
- Norrman, A.; Lindroth, R. Categorization of supply chain risk and risk management. In Supply Chain Risk; Ashgate Publishing: Farnham, UK, 2004; pp. 14–27. [Google Scholar]
- Manuj, I.; Sahin, F. A model of supply chain and supply chain decision-making complexity. Int. J. Phys. Distrib. Logist. Manag. 2011, 41, 511–549. [Google Scholar] [CrossRef]
- Kleindorfer, P.R.; Saad, G.H. Managing risks in supply chains. Prod. Oper. Manag. 2005, 14, 53–68. [Google Scholar] [CrossRef]
- Kauppi, K.; Longoni, A.; Caniato, F.; Kuula, M. Managing country disruption risks and improving operational performance: Risk management along integrated supply chains. Int. J. Prod. Econ. 2016, 182, 484–495. [Google Scholar] [CrossRef]
- Singh, G.; Wahid, N.A. Supply chain risk management: A review. Int. J. Supply Chain Manag. 2014, 3, 59–67. [Google Scholar]
- Nakano, M.; Lau, A.K.W. A systematic review on supply chain risk management: Using the strategy-structure-process-performance framework. Int. J. Logist. Res. Appl. 2020, 23, 443–473. [Google Scholar] [CrossRef]
- Kırılmaz, O.; Erol, S. A proactive approach to supply chain risk management: Shifting orders among suppliers to mitigate the supply side risks. J. Purch. Supply Manag. 2017, 23, 54–65. [Google Scholar] [CrossRef]
- Jüttner, U. Supply chain risk management: Understanding the business requirements from a practitioner perspective. Int. J. Logist. Manag. 2005, 16, 120–141. [Google Scholar] [CrossRef]
- Kouvelis, P.; Kouvelis, P. Supply chain management research and production and operations management: Review, trends, and opportunities. Prod. Oper. Manag. 2006, 15, 449–469. [Google Scholar] [CrossRef]
- Carter, C.R.; Rogers, D.S. A framework of sustainable supply chain management: Moving toward new theory. Int. J. Phys. Distrib. Logist. Manag. 2008, 38, 360–387. [Google Scholar] [CrossRef]
- Rice Jr, J.B.; Caniato, F. Building a secure and resilient supply network. Supply Chain Manag. Rev. 2003, 7, 22–30. [Google Scholar]
- Christopher, M.; Peck, H. Building the Resilient Supply Chain. Int. J. Logist. Manag. 2004, 15, 1–14. [Google Scholar] [CrossRef] [Green Version]
- Tang, O.; Nurmaya Musa, S. Identifying risk issues and research advancements in supply chain risk management. Int. J. Prod. Econ. 2011, 133, 25–34. [Google Scholar] [CrossRef] [Green Version]
- Dias, G.C.; de Oliveira, U.R.; Lima, G.B.A.; Fernandes, V.A. Risk management in the import/export process of an automobile company: A contribution for supply chain sustainability. Sustainability 2021, 13, 6049. [Google Scholar] [CrossRef]
- Elmsalmi, M.; Hachicha, W.; Aljuaid, A.M. Prioritization of the best sustainable supply chain risk management practices using a structural analysis based-approach. Sustainability 2021, 13, 4608. [Google Scholar] [CrossRef]
- Essaber, F.E.; Benmoussa, R.; De Guio, R.; Dubois, S. A hybrid supply chain risk management approach for lean green performance based on AHP, RCA and TRIZ: A case study. Sustainability 2021, 13, 8492. [Google Scholar] [CrossRef]
- Mani, V.; Delgado, C.; Hazen, B.T.; Patel, P. Mitigating supply chain risk via sustainability using big data analytics: Evidence from the manufacturing supply chain. Sustainability 2017, 9, 608. [Google Scholar] [CrossRef] [Green Version]
- Chimwal, M.; Agrawal, S.; Kumar, G. Measuring circular supply chain risk: A bayesian network methodology. Sustainability 2021, 13, 8448. [Google Scholar] [CrossRef]
- Wu, T.; Blackhurst, J.; Chidambaram, V. A model for inbound supply risk analysis. Comput. Ind. 2006, 57, 350–365. [Google Scholar] [CrossRef]
- Su, Z.X. A hybrid fuzzy approach to fuzzy multi-attribute group decision-making. Int. J. Inf. Technol. Decis. Mak. 2011, 10, 695–711. [Google Scholar] [CrossRef]
- Wang, K.; Gou, Q.; Sun, J.; Yue, X. Coordination of a fashion and textile supply chain with demand variations. J. Syst. Sci. Syst. Eng. 2012, 21, 461–479. [Google Scholar] [CrossRef]
- Ganguly, K.K.; Guin, K.K. A fuzzy AHP approach for inbound supply risk assessment. Benchmarking 2013, 20, 129–146. [Google Scholar] [CrossRef]
- Mangla, S.K.; Kumar, P.; Barua, M.K. Risk analysis in green supply chain using fuzzy AHP approach: A case study. Resour. Conserv. Recycl. 2015, 104, 375–390. [Google Scholar] [CrossRef]
- Dong, Q.; Cooper, O. A peer-to-peer dynamic adaptive consensus reaching model for the group AHP decision making. Eur. J. Oper. Res. 2016, 250, 521–530. [Google Scholar] [CrossRef]
- Rostamzadeh, R.; Ghorabaee, M.K.; Govindan, K.; Esmaeili, A.; Nobar, H.B.K. Evaluation of sustainable supply chain risk management using an integrated fuzzy TOPSIS- CRITIC approach. J. Clean. Prod. 2018, 175, 651–669. [Google Scholar] [CrossRef]
- Zhang, Q.; Fan, W.; Lu, J.; Wu, S.; Wang, X. Research on dynamic analysis and mitigation strategies of supply chains under different disruption risks. Sustainability 2021, 13, 2462. [Google Scholar] [CrossRef]
- Zadeh, L.A. Fuzzy sets. Inf. Control. 1965, 8, 338–353. [Google Scholar] [CrossRef] [Green Version]
- Mitra, G.; Jain, K.K.; Bhattacharjee, B. Condition Assessment of Corrosion-Distressed Reinforced Concrete Buildings Using Fuzzy Logic. J. Perform. Constr. Facil. 2010, 24, 562–570. [Google Scholar] [CrossRef]
| Publisher’s Note: MDPI stays neutral with regard to jurisdictional claims in published maps and institutional affiliations. |
© 2022 by the authors. Licensee MDPI, Basel, Switzerland. This article is an open access article distributed under the terms and conditions of the Creative Commons Attribution (CC BY) license (https://creativecommons.org/licenses/by/4.0/).


